
Abstract
In the industrial sector, ensuring reliability and robustness is of utmost importance. The research goes beyond conventional non-destructive testing by exploring advanced methods for comprehensive defect detection and imaging. It employs state-of-the-art eddy current testing, enhanced by sensor arrays composed of multiple elements arranged in an updated sequential matrix. This innovative configuration overcomes the challenges of magnetic repulsion between sensor elements, significantly speeding up the testing process while ensuring accuracy through detailed imaging of failure paths. Additionally, this study introduces a novel approach for characterizing random defects in aluminum sheets by utilizing machine learning techniques within the Radial Basis Function (RBF) network. This tool, trained on initial data, enables precise predictions of defect shapes and paths, allowing for accurate identification and dimension estimation later. By integrating defect imaging with predictive modeling, our approach not only advances technology in data security but also reduces effort, time, and costs. The research presents a pioneering methodology for defect identification and prediction, as detailed in the following sections.
Introduction
Non-destructive testing (NDT) is critical for ensuring the safety and reliability of components in industries like aerospace, oil and gas, and transportation. Among NDT methods, 1 Eddy Current Testing (ECT) stands out for its ability to detect surface and subsurface defects in conductive materials using electromagnetic induction. 2 Widely applied in inspecting pipelines, 3 aircraft structures, 4 and metal sheets, ECT is valued for its high sensitivity and non-contact approach.5,6 Recent advancements in ECT have focused on innovations in circuit design, 7 coil excitation, coil configuration, and signal processing to enhance crack detection capabilities.6,8 This study explores ECT imaging techniques, 8 Its advantages and the challenges it poses, and in light of the growth witnessed by artificial intelligence algorithms in all fields. While traditional ECT methods and machine learning approaches, 9 such as neural networks (NN) 10 and support vector machines (SVM) 11 and (SVR), 12 excel at classifying defects—identifying their presence or general type—they often fail to capture the shape, orientation, or growth trajectory of defects. Convolutional neural networks (CNNs) have improved defect recognition accuracy in ECT signal images, 13 but these classification-focused methods are insufficient for safety-critical applications where understanding a defect’s form and evolution is crucial. For example, a minor surface crack may require only monitoring, whereas a deep, rapidly propagating defect could necessitate urgent repairs or component replacement. 14 The inability of conventional models to predict defect progression is a significant challenge, particularly in high-stakes industries where proactive maintenance is essential to prevent catastrophic failures and optimize operational efficiency. As highlighted by Wang et al. 15 Dynamic prediction of defect evolution is vital for informed decision-making and cost-effective maintenance strategies. To address this, research has turned to predictive modeling, where radial basis function (RBF) networks have shown promise in capturing complex, nonlinear patterns in several areas due to their simplicity and effectiveness, such as in sensitive fields. This research has focused on their application in electroconvulsive therapy signals to model irregular defect paths and shapes.10,16 This study proposes a two-stage approach to advance ECT capabilities. First, high-resolution images of random defect patterns are generated using a multi-element ECT sensor matrix,8,17 simulated through COMSOL Multiphysics. 18 This enables precise imaging of complex defect shapes, such as curved or branched cracks. Second, an RBF-based machine learning model is employed to predict the path and evolution of these defects, providing dynamic insights beyond static classification. By integrating advanced imaging with predictive modeling, this research enhances NDT from mere defect detection to comprehensive defect characterization and forecasting, improving safety, decision-making, and efficiency in industrial applications. The key challenges and role of RBF NNs in ECT lie in moving beyond defect detection to predicting defect behavior, which requires modeling complex nonlinear relationships in signal data. AI, particularly RBF networks, addresses this by enabling dynamic and continuous predictions of defect growth and supporting proactive maintenance, whose future application will contribute to risk reduction in safety-critical systems.
Building on previous studies summarized in Table 1, which explored the use of artificial intelligence and machine learning in defect classification and prediction, this work advances the field by introducing a two-stage RBF-based framework that integrates sensor multiplexing with defect trajectory prediction. While earlier RBF–ECT studies have primarily addressed defect classification or size estimation, they remain limited to static detection tasks. In contrast, our approach leverages a COMSOL-designed multi-layer sensor array to generate rich, multi-dimensional impedance signals, which are then processed by the RBF network to capture both defect shape and its temporal evolution. This predictive capability—estimating future defect propagation rather than only present characteristics—represents a key step toward proactive maintenance in safety-critical industries.
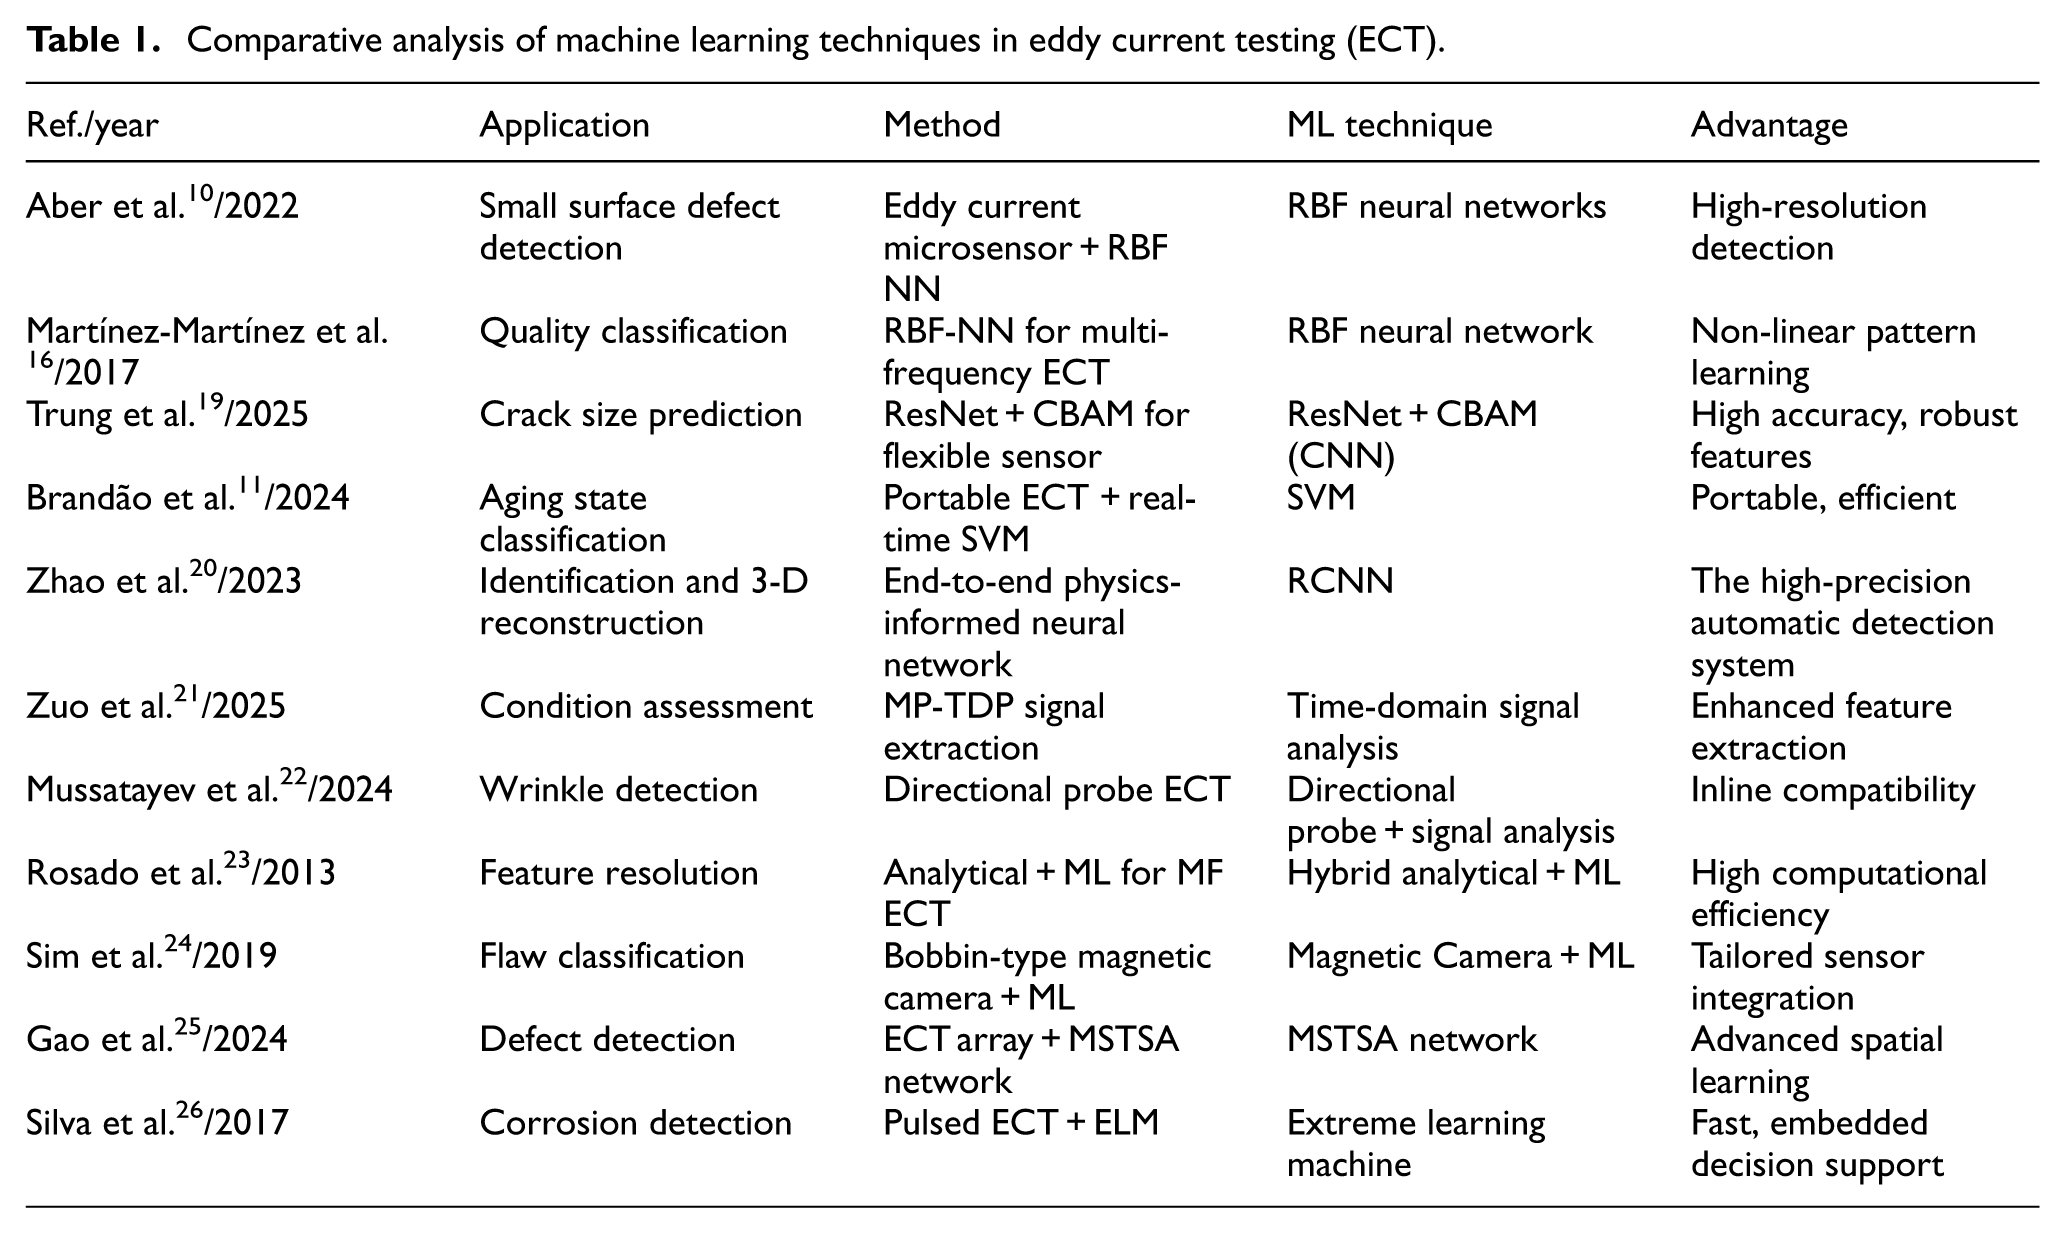
Comparative analysis of machine learning techniques in eddy current testing (ECT).
Moreover, the proposed workflow integrates forward simulation, multi-signal processing, and dynamic prediction into a unified pipeline, enabling a shift from traditional reconstruction to real-time prognostic modeling. Unlike prior works, which often require noise handling or focus narrowly on classification, our dataset design ensures noise-free training for high accuracy, while the RBF model maintains computational efficiency suitable for near real-time applications. Taken together, the novelty of this work lies in the combined use of sensor multiplexing, predictive modeling of defect trajectories, and streamlined integration, thereby extending the capabilities of RBF–ECT frameworks beyond static detection toward intelligent, predictive non-destructive testing (NDT).
Fundamental calculation principles and assumptions
Electromagnetic
Electromagnetic non-destructive testing (ECNDT) employs electromagnetic principles as its foundation. It involves the examination and mathematical representation of induced currents within steam generator tubes, based on the laws of electromagnetism and quasi-static approximations of Maxwell’s equations. Various strategies exist for modeling the interaction between the probe and the structure under test, especially in complex geometries where numerical methods are commonly utilized. The modeling and simulation of eddy current testing provides a robust framework for early inspection of components. Numerous numerical formulations, employing the finite element method, have been proposed to address challenges associated with this open boundary problem, both differentially and integrally. 27 Among the notable differential formulations are the H-Φ formulation by Bossavit and Verite, 28 the T-Ω formulation introduced by Carpenter and further developed by Brown and Albanese 29 with Rubinacci, 30 and the A-V formulation by Biro. 31 The primary advantage of the differential formulation lies in the sparse matrices within the solving system, which is crucial for minimizing computational costs.
In this document, we employ a three-dimensional Finite Element (FE) approach to compute signals produced by eddy current probes in the presence of cracks, enabling the characterization of material properties. 31 The set of equations governing the dynamics of Multiphysics systems, with variables in evolution, can be derived from Maxwell’s equations, as outlined below:

where:
A (Wb/m) is the magnetic vector potential,
μ (H/m) is the magnetic permeability of the material,
σ (S/m) is the electrical conductivity,
ω = 2πf (rad/s) is the angular frequency of excitation,
J (A/m2) is the source current density.
After calculating the magnetic potential vector, A, we easily deduce the sensor impedance as follows:

Where the following integral expressions give P and W:
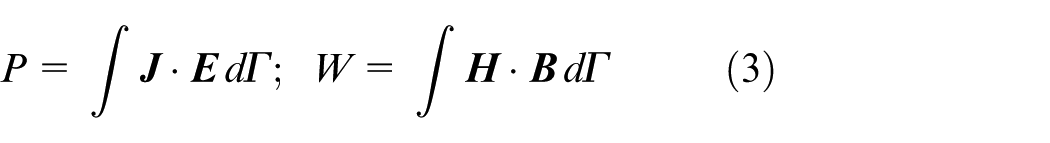
where
After calculating the magnetic potential vector,
Proposed models
Motivated by the demonstrated effectiveness of eddy-current NDT—and the close agreement reported between COMSOL Multiphysics® simulations and laboratory measurements 32 —we modeled the proposed system with the AC/DC module.
The model implements time-division multiplexing to improve defect detectability and image acquisition: an array of probes is excited sequentially (one at a time) to form a scanning sensor array (Figure 1). Sequential activation provides uniform coverage while minimizing mutual inductive coupling between adjacent coils, thereby improving signal. 8
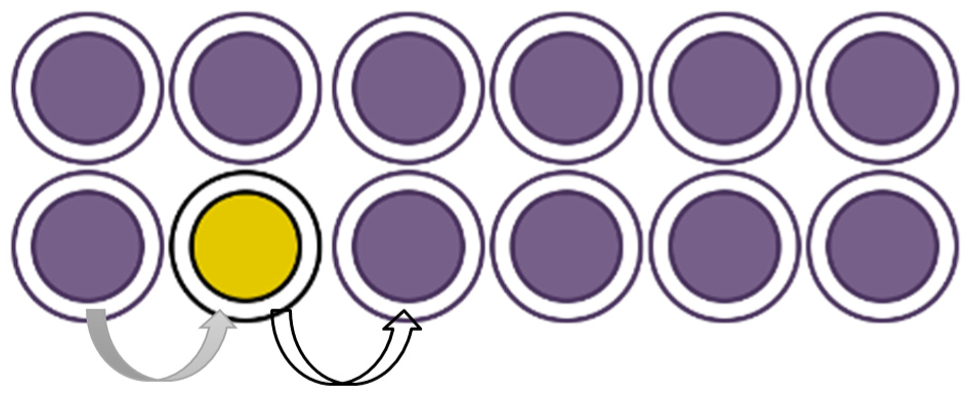
A sensor array composed of a multi-element sensor integrated with a multiplexer.
Multiplexing essentially combines multiple analog message signals into a unified digital signal over a shared medium. When applied to eddy current array data, individual eddy current coils are activated sequentially, as depicted in Figure 1, ensuring that no two adjacent coils are energized simultaneously. This deliberate sequencing minimizes the undesirable effects of mutual inductance, which refers to the magnetic coupling between closely positioned coils. To precisely (control the timing of each coil’s eddy current signal transmission) manage when each coil transmits its eddy current signal, an internal multiplexing system is employed, effectively mitigating mutual inductance. Subsequently, the signals are reconstructed before being presented as imagery.8,33
In addition to the improved imaging capabilities provided by multiplexed data, this technique enables the analysis of individual coil channels post-inspection. Multiplexing enhances channel resolution, increases coil sensitivity (by reducing mutual inductance), and lowers noise levels. These benefits collectively lead to an enhanced signal-to-noise ratio.
Considering that the probe is a multi-element sensor, as illustrated, it includes the following parameters for each element (Figure 1): coil wire cross- section area = 0.03 × 10⁻⁶ (m2), number of turns = 100, and conductivity = 6 × 10⁷ (S/m). The scanning procedure is aligned parallel to the y-axis with a left- off of 0.5 (mm). The probe advances each sensor element step-by-step through the scanning process along the aluminum plate structure (Figure 2), which has a conductivity of 3.774.107 (S/m). The plate contains two defects with random paths.
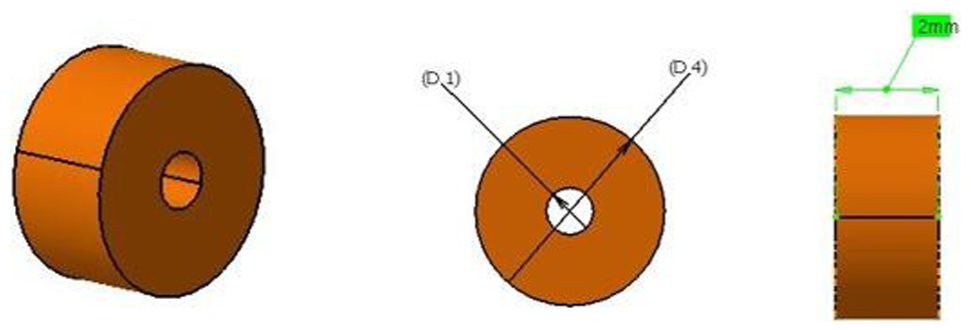
The dimensions of the sensor coil.
The first defect (Figure 3) has a winding path with a total length of 30 mm, a width of 0.1 mm, and a depth of 2 mm.
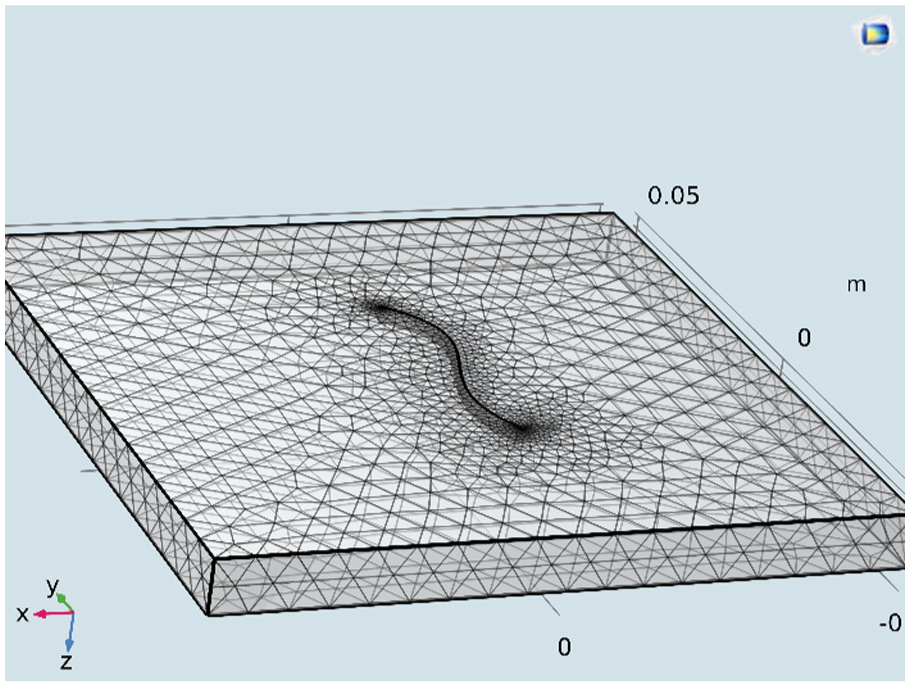
Mesh of a random defect following a winding path.
The second defect (Figures 4 and 5) has a straight, broken path that begins with a width of 2 mm, then transitions to 1.5 mm, followed by 0.75 mm, and ends with a width of 0.5 mm. It also features straight branches, each 1 mm long and 0.5 mm wide.
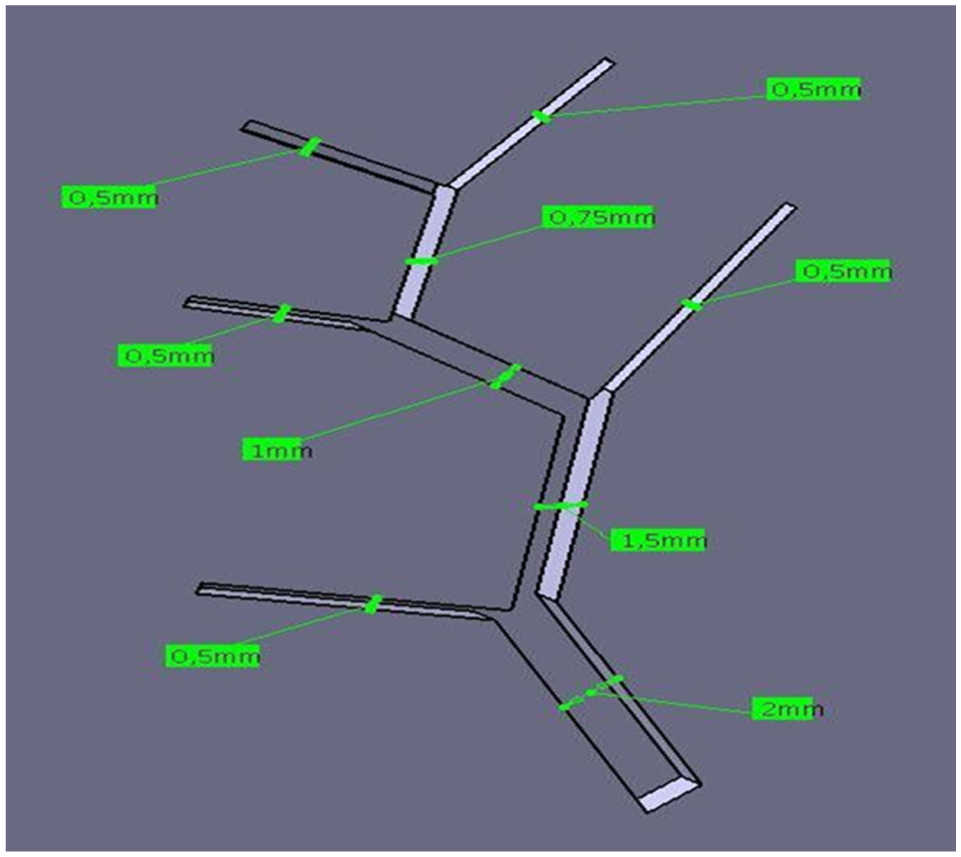
The width differences of random defect 2.
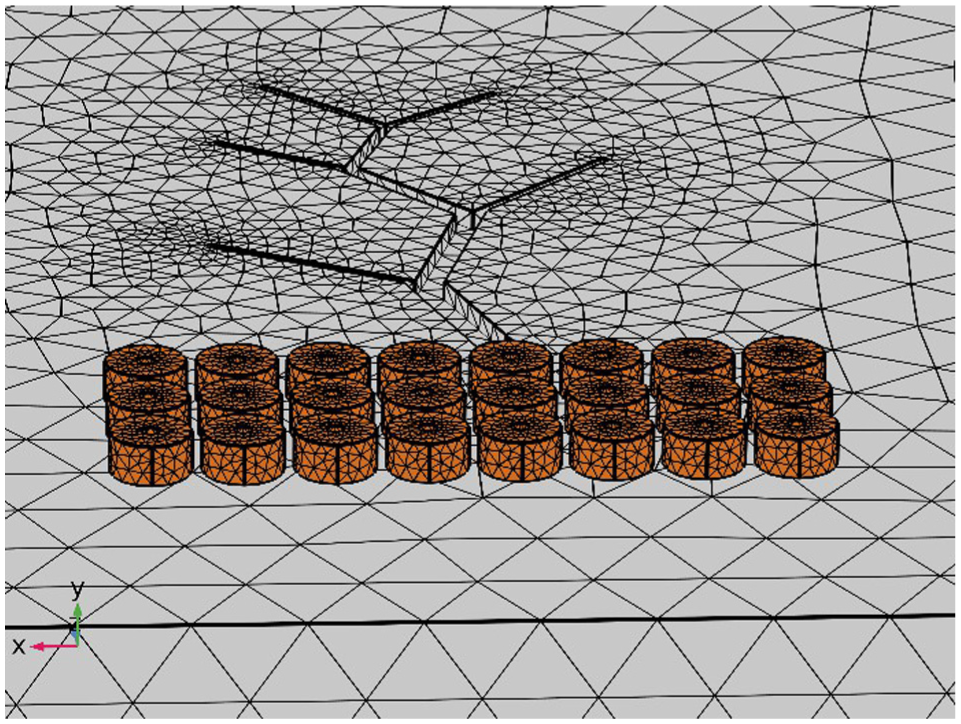
Mesh of a random defect with refracted straight branches.
Analysis and discussion of results – Part 1
Distribution of eddy currents
In Figures 6 and 7, we present visualizations depicting the distribution of the eddy current density resulting from two types of defects: a random defect with straight branches and a random, curved defect.
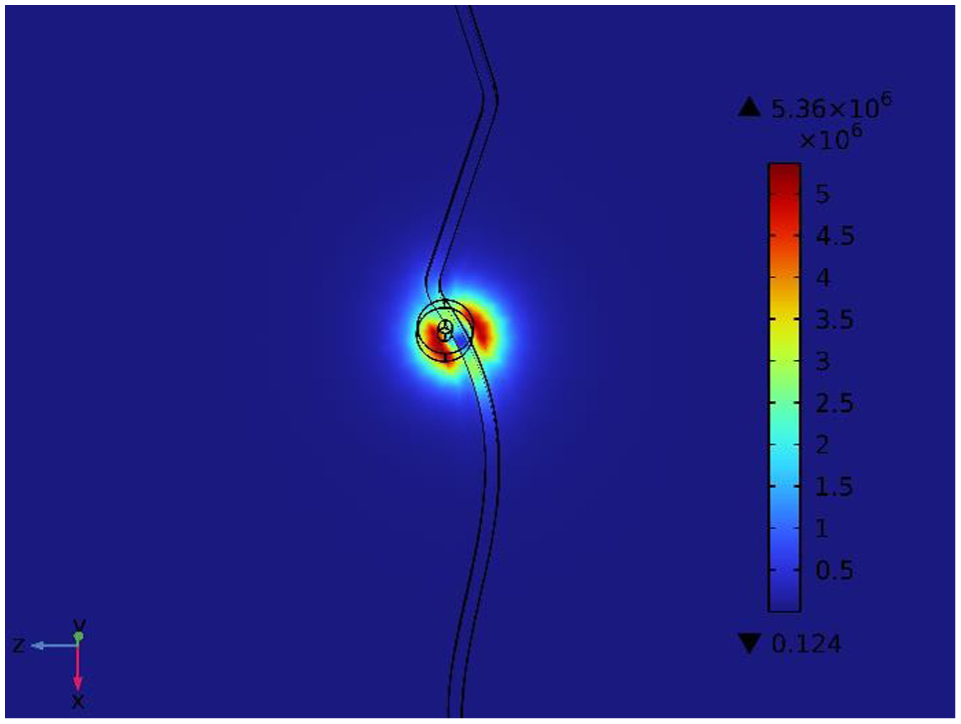
Eddy current distribution of a random defect 1.
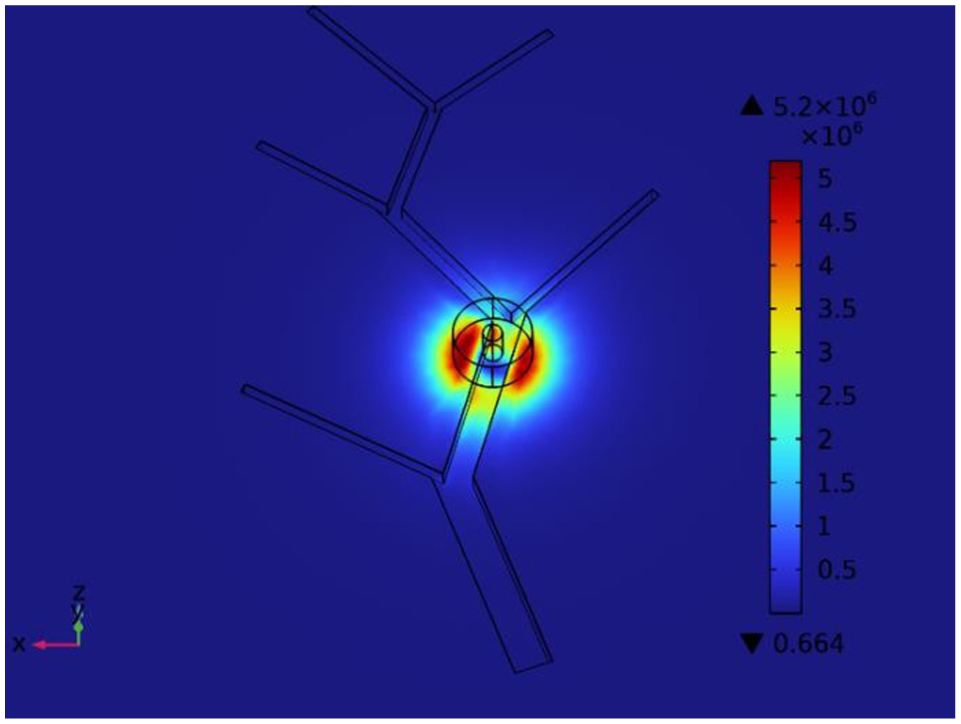
Eddy current distribution of a random defect 2.
These simulations were conducted under identical initial conditions, including a frequency of 10 kHz and a distance of 0.5 mm between the sensor and the plate. The imaging results provide valuable insights into the extent of the coil’s influence at the specified frequency, enabling the calculation of impedance relative to the coil’s position.
Variations in induced currents exhibit an inverse relationship with the size of surface defects, diminishing as defect dimensions increase. For example, at the smallest dimensions, as observed in the case of a curved random defect, the induced current density is Jind1 = 5.36 × 10⁶ A/m2. In contrast, this value decreases significantly to reach the value limit of Jind2 = 5.2 × 10⁶ A/m2, for a random defect with divided and broken paths. This reduction is mainly due to the larger width of the latter defect compared to the former. Hence, these results demonstrate that the differences in the defect area directly influence the density of the induced currents. The proposed defect models have demonstrated high applicability, allowing the acquisition of the required images in the proposed system. This system comprises a sensor array, which is essentially a multiplexed multi-element sensor, as illustrated in Figure 1.
Collect impedance signals and display the shapes of defect paths
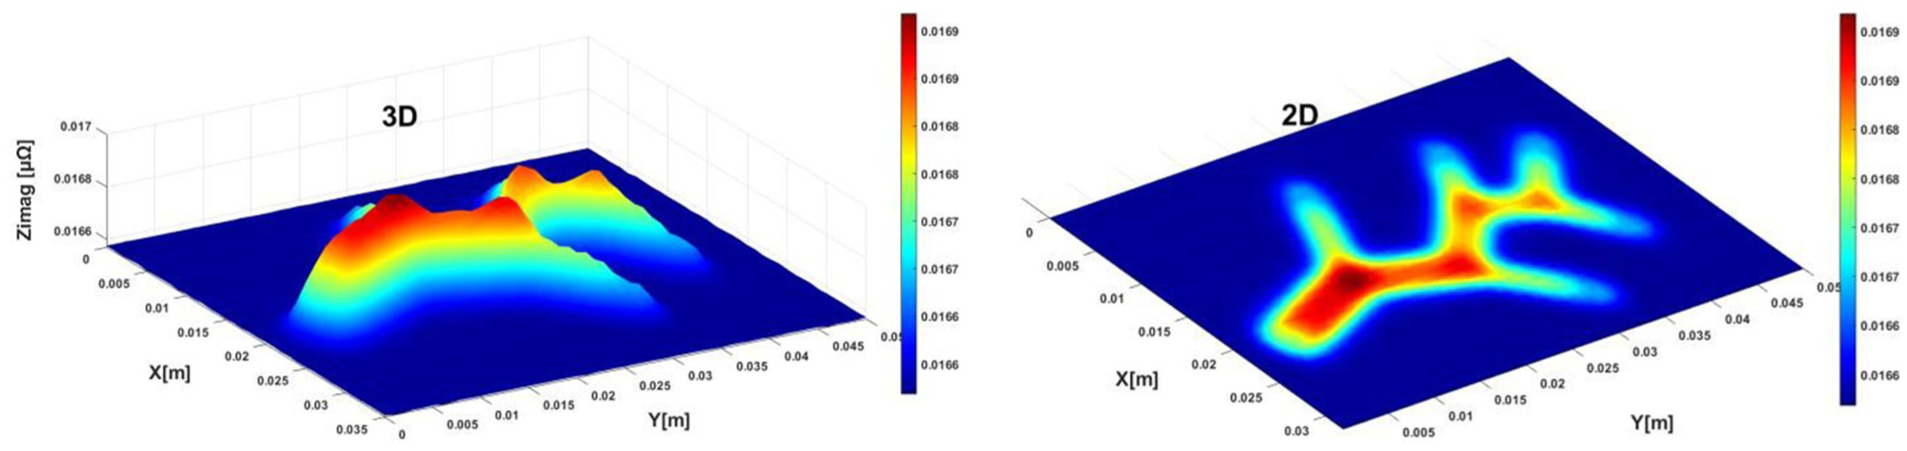
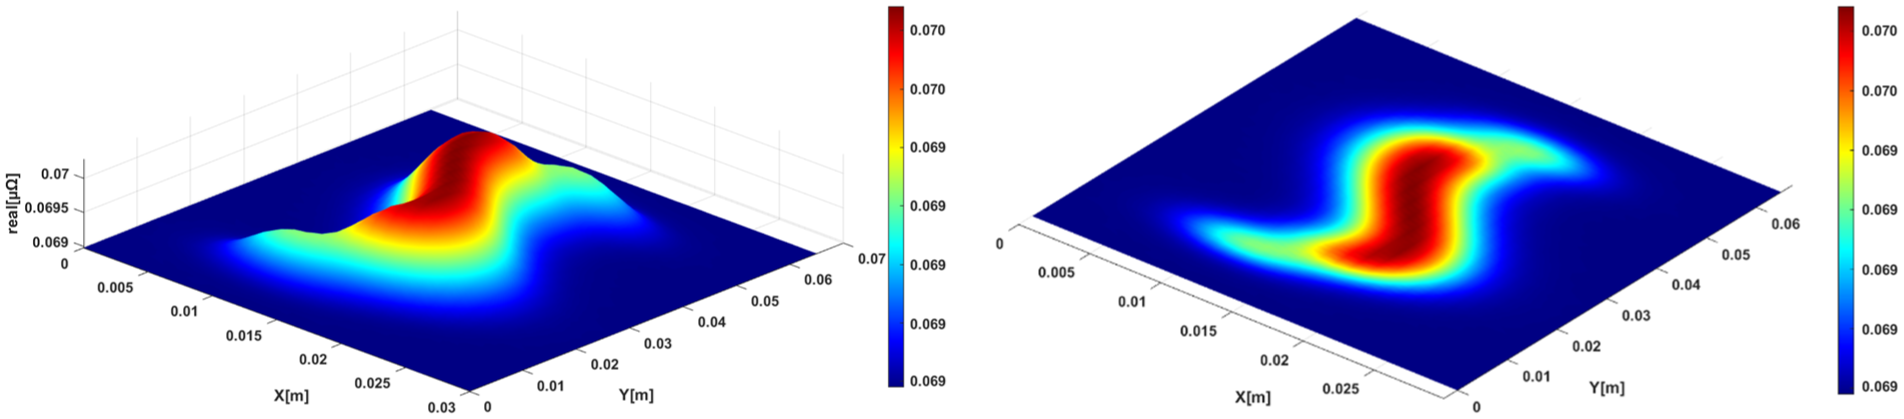
In this section, we present impedance signals, specifically their imaginary part, along the X and Y axes.
Figure 9 depict the results for random defect 1 having a winding path, while Figure 8 show the results for random defect 2 with straight branches. The colored parts represent the impedance signals along the defect’s paths. also, Figures 8 and 9 show an aggregation of these signals across the entire array, derived from scanning of impedance values along the X and Y axes. This process results in a three-dimensional representation at an angle (60°, 60°) and a two-dimensional projection vertically at (0°, 90°).
3D and 2D imaging of random defect 1 via impedance imaginary values.
3D and 2D imaging of random defect 2 via impedance imaginary values.
The intensity of colors increasing toward dark red in points, lines, or surfaces indicates higher impedance values. This visualization provides clear and distinct depictions of the shape and path of random defects, particularly along their trajectories.
Inverse problem
The radial basis function (RBF) network is an artificial neural network primarily used for function approximation, classification, and regression tasks. It is particularly well-suited for problems involving complex and nonlinear relationships between inputs and outputs.
General overview of RBF networks
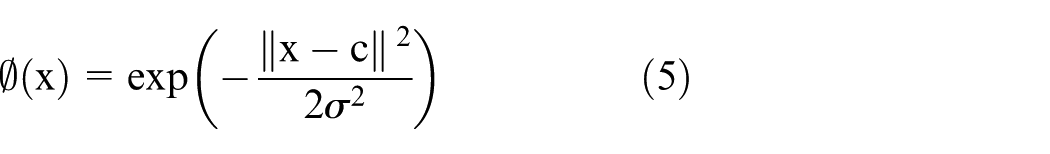
The radial basis function (RBF) neural network, 34 introduced by Broomhead and Lowe 1988, is built on the principles of conventional approximation theory. It is a highly adaptable architecture, well-suited for modeling complex relationships between input and output data. The network comprises three primary layers: the input layer, a hidden layer consisting of neurons that apply Gaussian non-linear activation functions, and the output layer. 35
An RBF network typically consists of three layers:
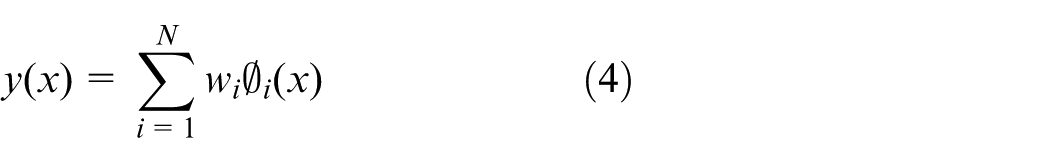
x is the input vector. The center of the radial basis function is denoted as c. The c parameter σ controls the spread of the function
N is the number of hidden neurons. The weights associated with each hidden node are denoted as w
i
. The outputs of the hidden nodes are represented as
In the RBF neural network, c
k
and σ
k
represent the center and spread of the radial basis function
Let y represent the real rate of penetration (real data),
Each dataset is randomly partitioned into two subsets: training and testing. The training dataset must be sufficiently large to capture the variability in the data, but not so large as to risk overfitting the model. The optimal split ratio varies based on several factors, but a typical guideline for the training-testing split is 60%–80% for training data and 20%–40% for test data. In this study, 70% for training and 30% for testing.
Training process
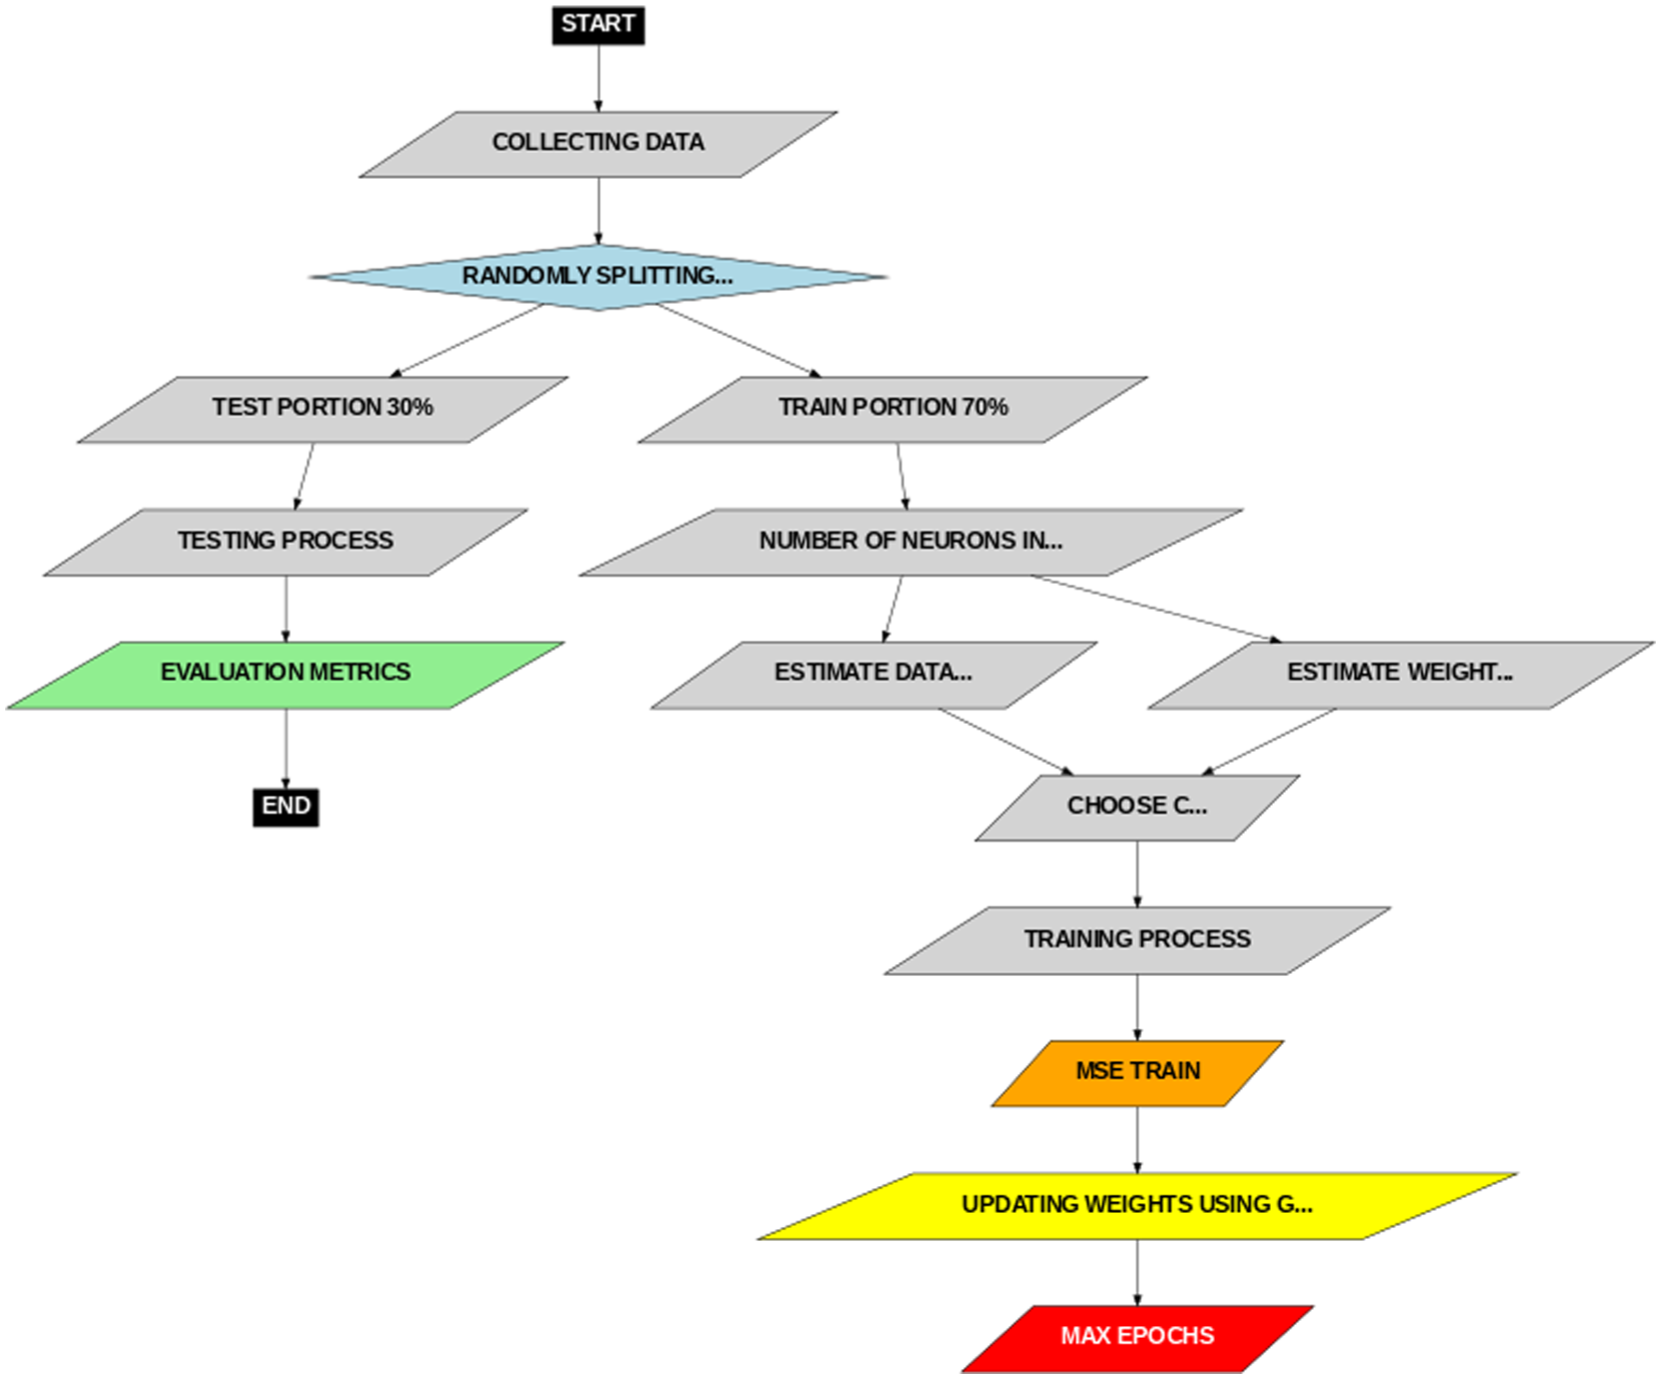
The training process of the radial basis function (RBF) neural network for defect detection and prediction in conductive materials follows these key steps:
Data collection: Eddy current testing (ECT) data is collected and randomly split into 70% for training and 30% for testing.
Network architecture: An important step is determining the optimal number of neurons, since this parameter directly affects the generalization ability of the network and its computational time. A trial-and-error strategy was adopted in this work because it provides a good balance between exploration efficiency and computational cost.
Cost function minimization: This step, also known as supervised training, where the network is trained by adjusting and updating weights based on the actual output of the network compared to the data. This step is crucial and requires a decent optimization algorithm; here, a genetic algorithm was implemented to minimize the error effectively.
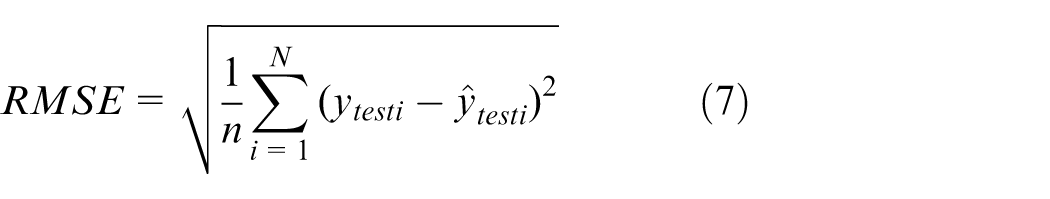
Testing process
The developed model is tested on unseen data to evaluate its generalization capability. Its performance is assessed using various evaluation metrics, including the root mean square error (RMSE) and the coefficient of determination. These metrics provide a quantitative measure of the model’s accuracy and ability to predict new, unseen data.
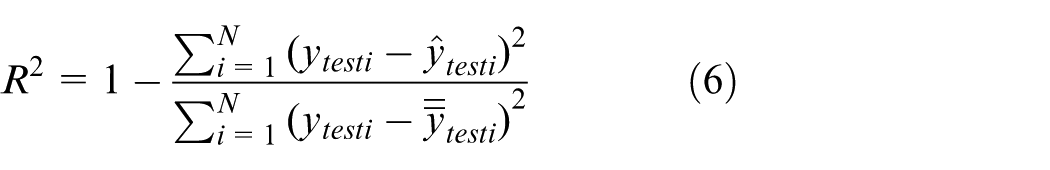
Where:
y testi actual values
N number of data points
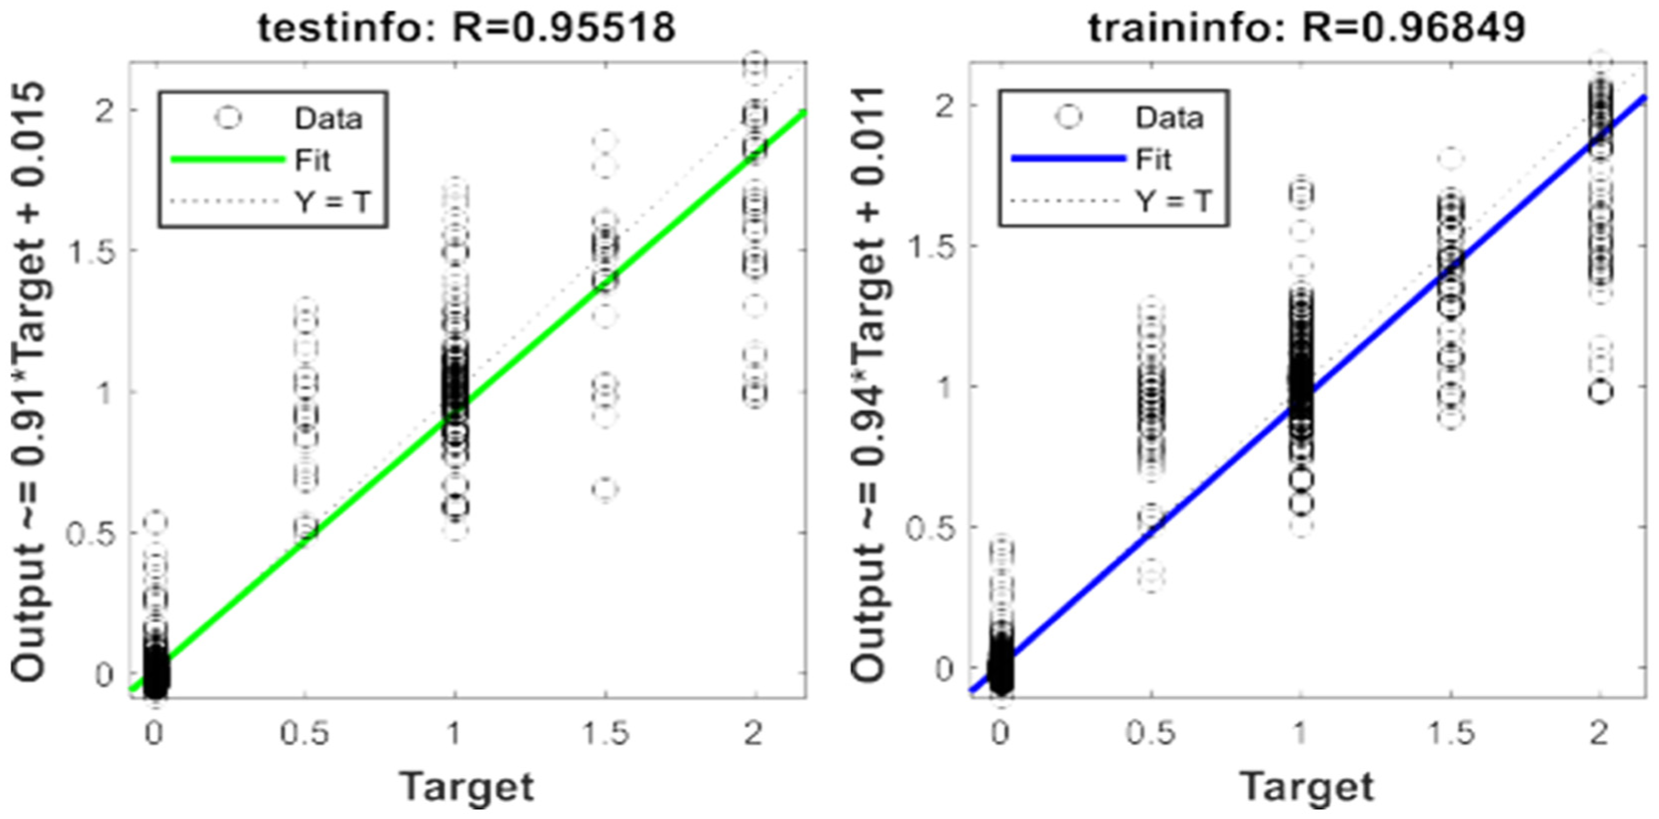
Correlation between predicted and actual defect dimension using RBF network.
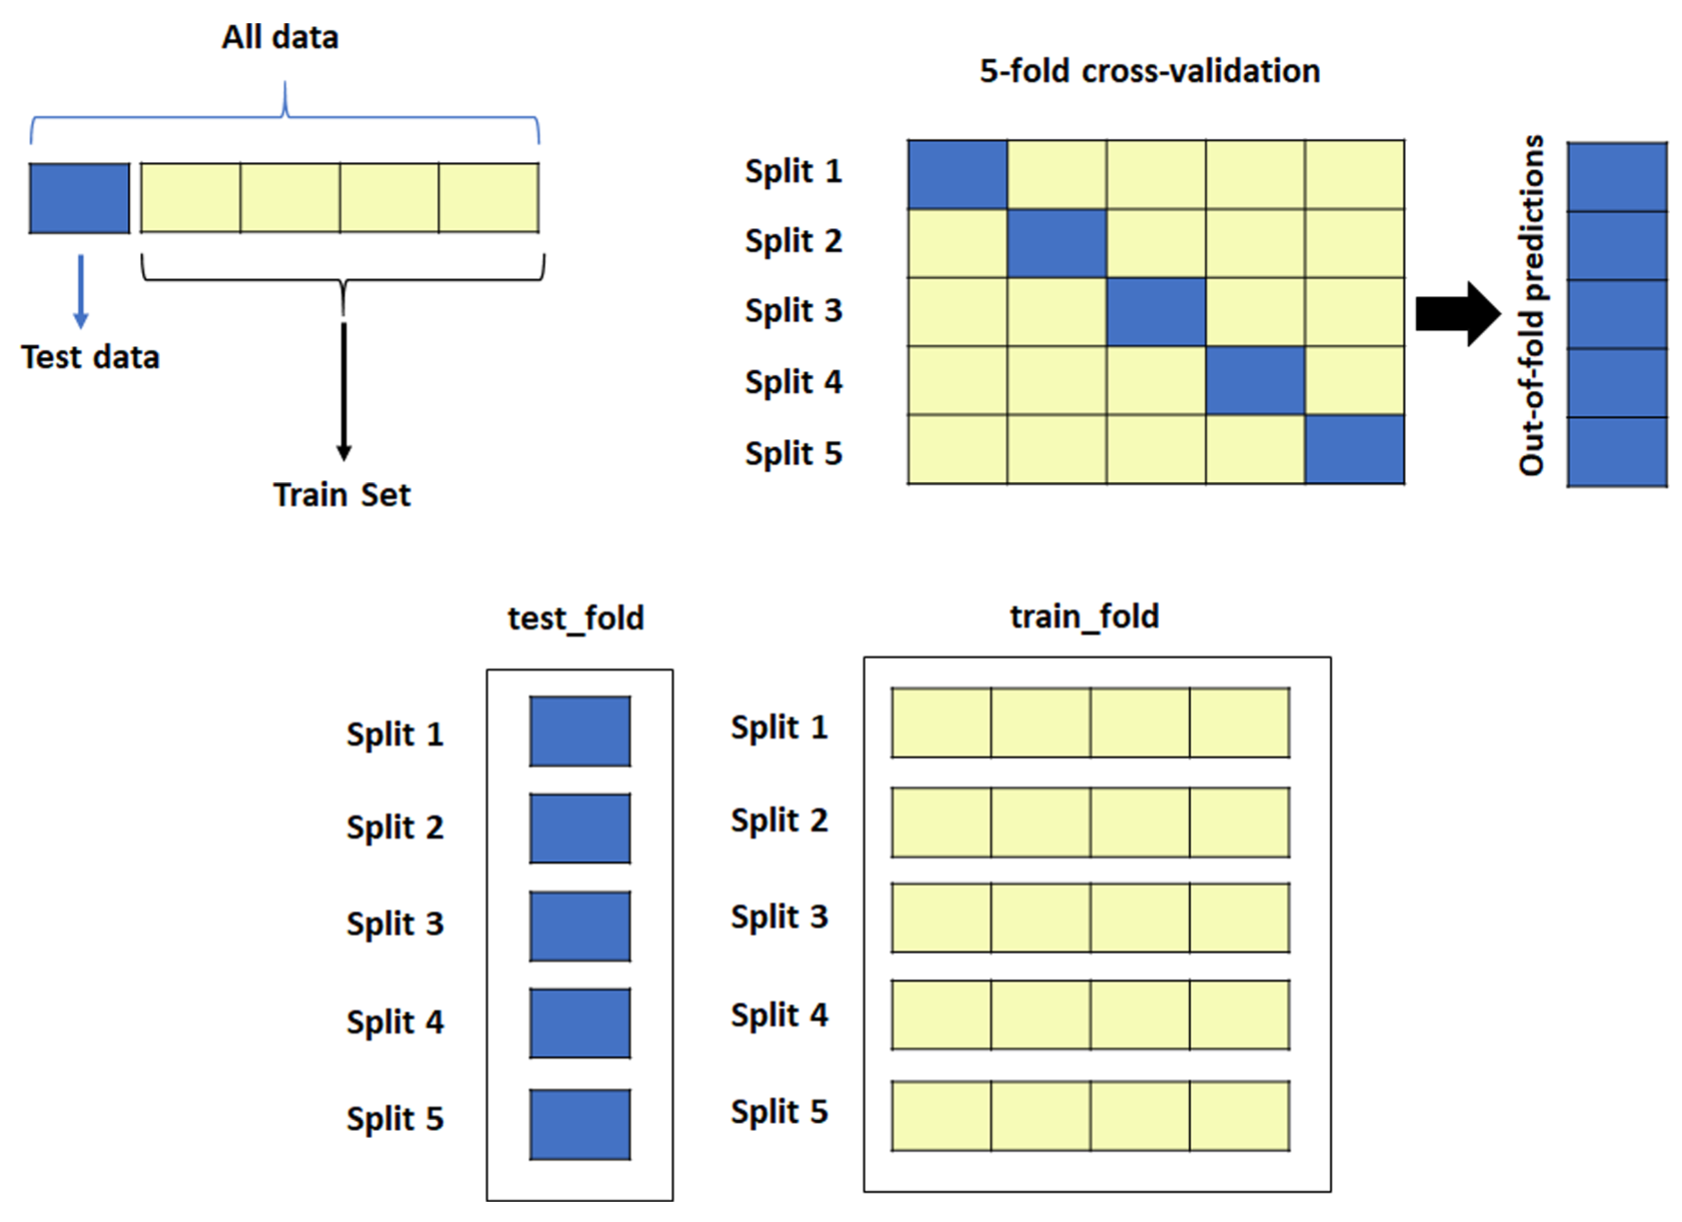
Illustration of the cross-validation method.
This study’s radial basis function (RBF) network predicts the path of defects in aluminum sheets by analyzing their detected dimensions (length and width). The revised process is outlined as follows:
In the first training stage, the network is fed with data from eight separate inspections of a test panel. Each inspection involves a single defect with a fixed length of 15 mm but varying widths and depths between 0.5 and 2 mm. For each inspection, impedance measurements (real and imaginary components) are recorded at 682 different sensor positions distributed across areas far from the defect, near the defect, and directly over the defect. This results in a total of 5456 impedance data points used to train the network.
In the second training stage, 45 additional inspections are carried out. Each inspection involves 24 impedance scans along a straight-line defect, with depth values ranging incrementally from 0 to 4.5 mm (0, 0.1, 0.2,…, 4.5 mm). This produces a total of 1080 additional input samples for depth-based training. Together, these two stages provide the RBF network with a rich dataset, allowing it to effectively learn complex nonlinear relationships and accurately model defect shapes and propagation paths.
Cross-validated RBF networks
Cross-validation is a vital method for assessing the reliability and generalization of radial basis function (RBF) neural networks in defect detection and prediction using eddy current testing (ECT) data. Rather than depending on a single train-test split, the dataset is divided into k subsets, or folds. The model is trained on (k–1) folds and validated on the remaining fold, with this process repeated until each fold has been used for validation. The average performance across all iterations is then calculated. This approach maximizes the use of limited or costly ECT data by ensuring all samples contribute to both training and testing. In this study, a 5-fold cross-validation strategy was employed, striking a balance between computational efficiency and robust evaluation. This method provides a reliable estimate of the RBF network’s ability to predict defect depth and propagation across diverse operating conditions and material properties.
Evaluation and discussion – Part 2
This enhanced workflow demonstrated the effectiveness of the RBF algorithm in analyzing defect characteristics and predicting their behavior based on dimensional input data. The network’s performance was assessed using both training and test datasets, yielding correlation coefficients of R train = 0.95518 and R test = 0.94849. In the first scenario, which focused on predicting the defect’s shape and trajectory using width data, the results were even more promising, with R train = 0.96808 and R test = 0.96392. These high and closely matched values indicate a strong correlation between the predicted and actual defect characteristics, confirming the model’s predictive accuracy, as illustrated in Figures 12 and 13.
RBF model workflow with a dataset containing different defect widths.
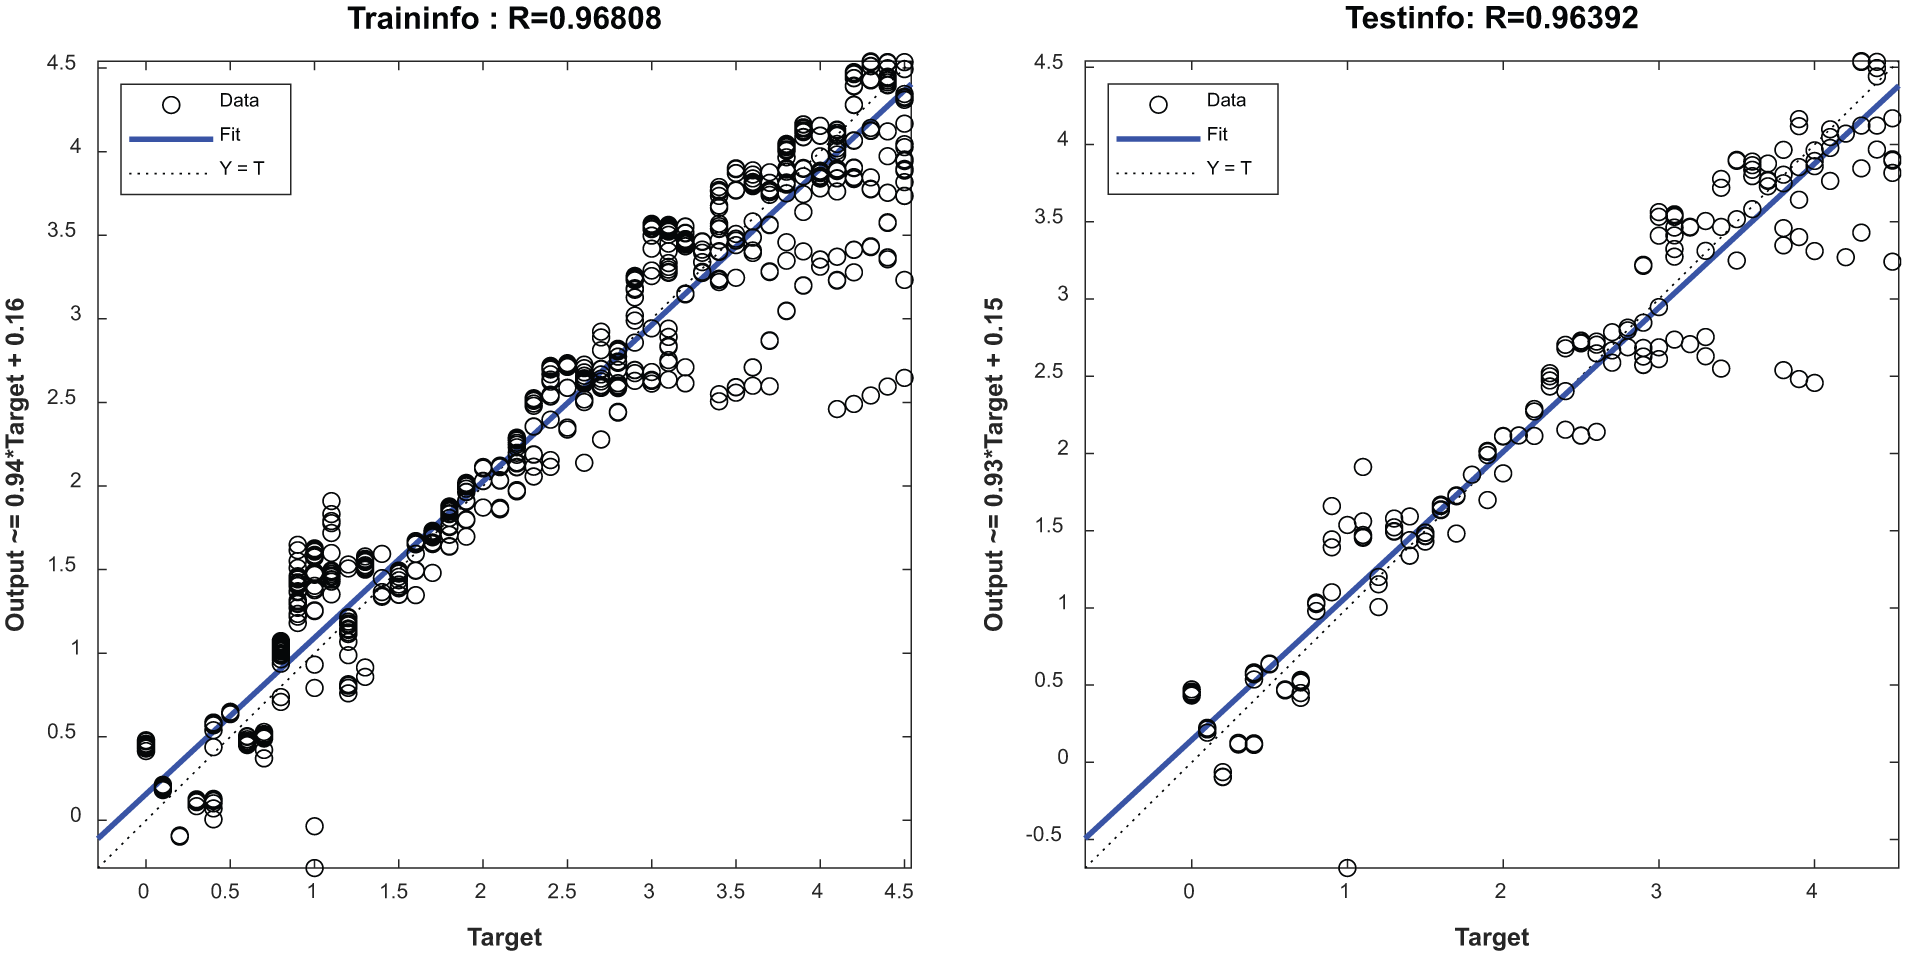
RBF model workflow with a dataset containing different defect depths.
Furthermore, the mean squared error (MSE) and normalized mean squared error (nMSE) were calculated to quantify the average squared deviation between predicted and true values. The low MSE values reinforce the model’s reliability and precision in accurately mapping defect trajectories based on impedance measurements.
As shown in Figure 14, a 5-fold cross-validation (CV) analysis was employed to ensure that the radial basis function (RBF) neural network framework generalizes beyond synthetic data and avoids overfitting. The dataset was partitioned into training and testing subsets. Performance was evaluated using CV training (CV_tr) and testing (CV_ts) errors, correlation coefficients (
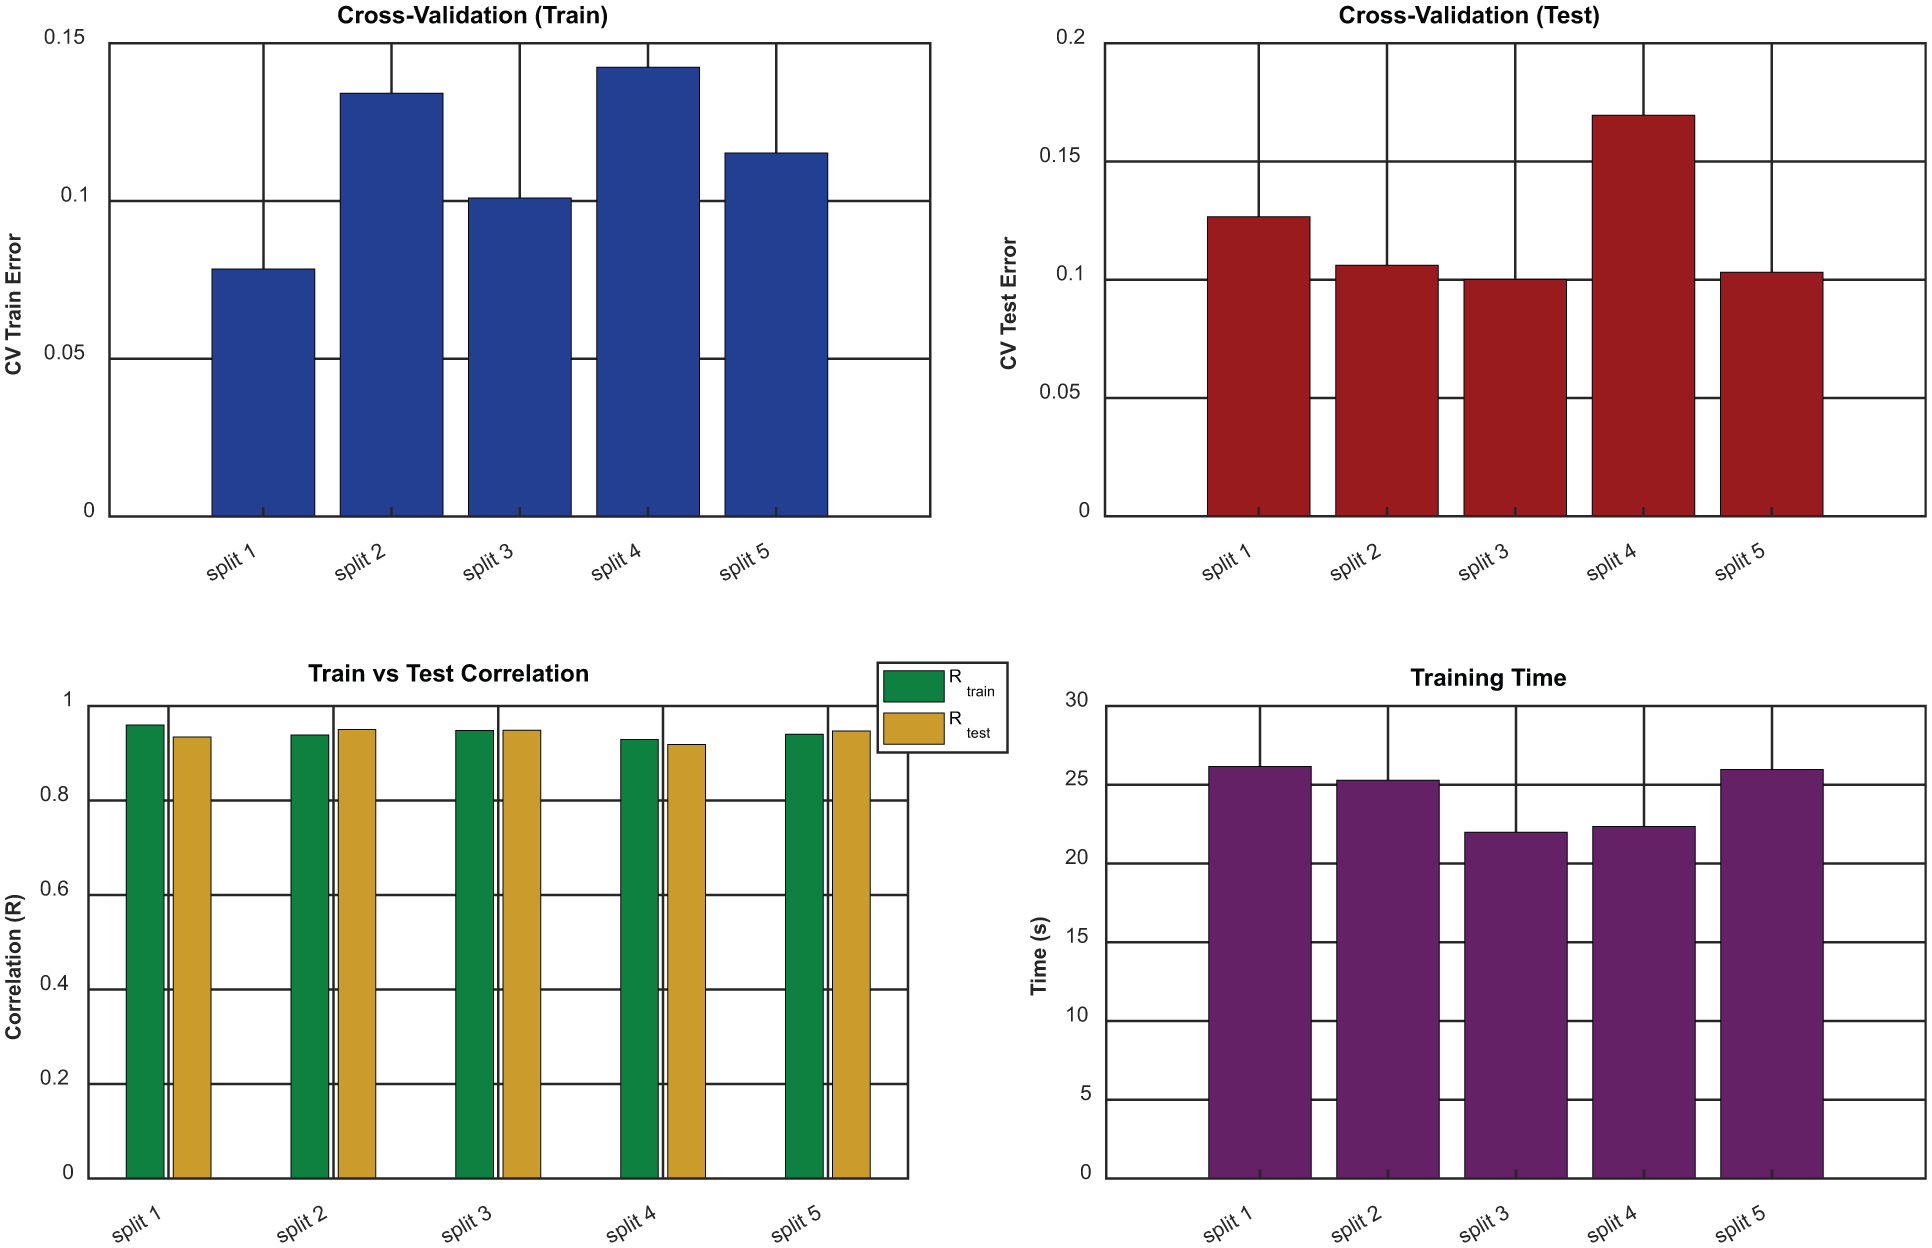
Training efficiency and cross-validation performance.
Figure 15 illustrates a process summary for characterizing defects in eddy current testing (ECT) using a radial basis function neural network (RBF-NN). Multiple sensor arrays, controlled by multiplexing, collect impedance data (both real and imaginary parts) from different locations on the tested material. These impedance values serve as input features for the RBF-NN, where neurons process the data to learn patterns associated with defects. The network’s output function aggregates the results, generating a three-dimensional spatial defect map, where a blue color distribution represents the absence of clear areas in the plate and distant from the defect, while a darker (red and orange) distribution represents the presence of the largest possible defect size. This approach promotes automated and accurate defect detection in non-destructive testing (NDT) applications.
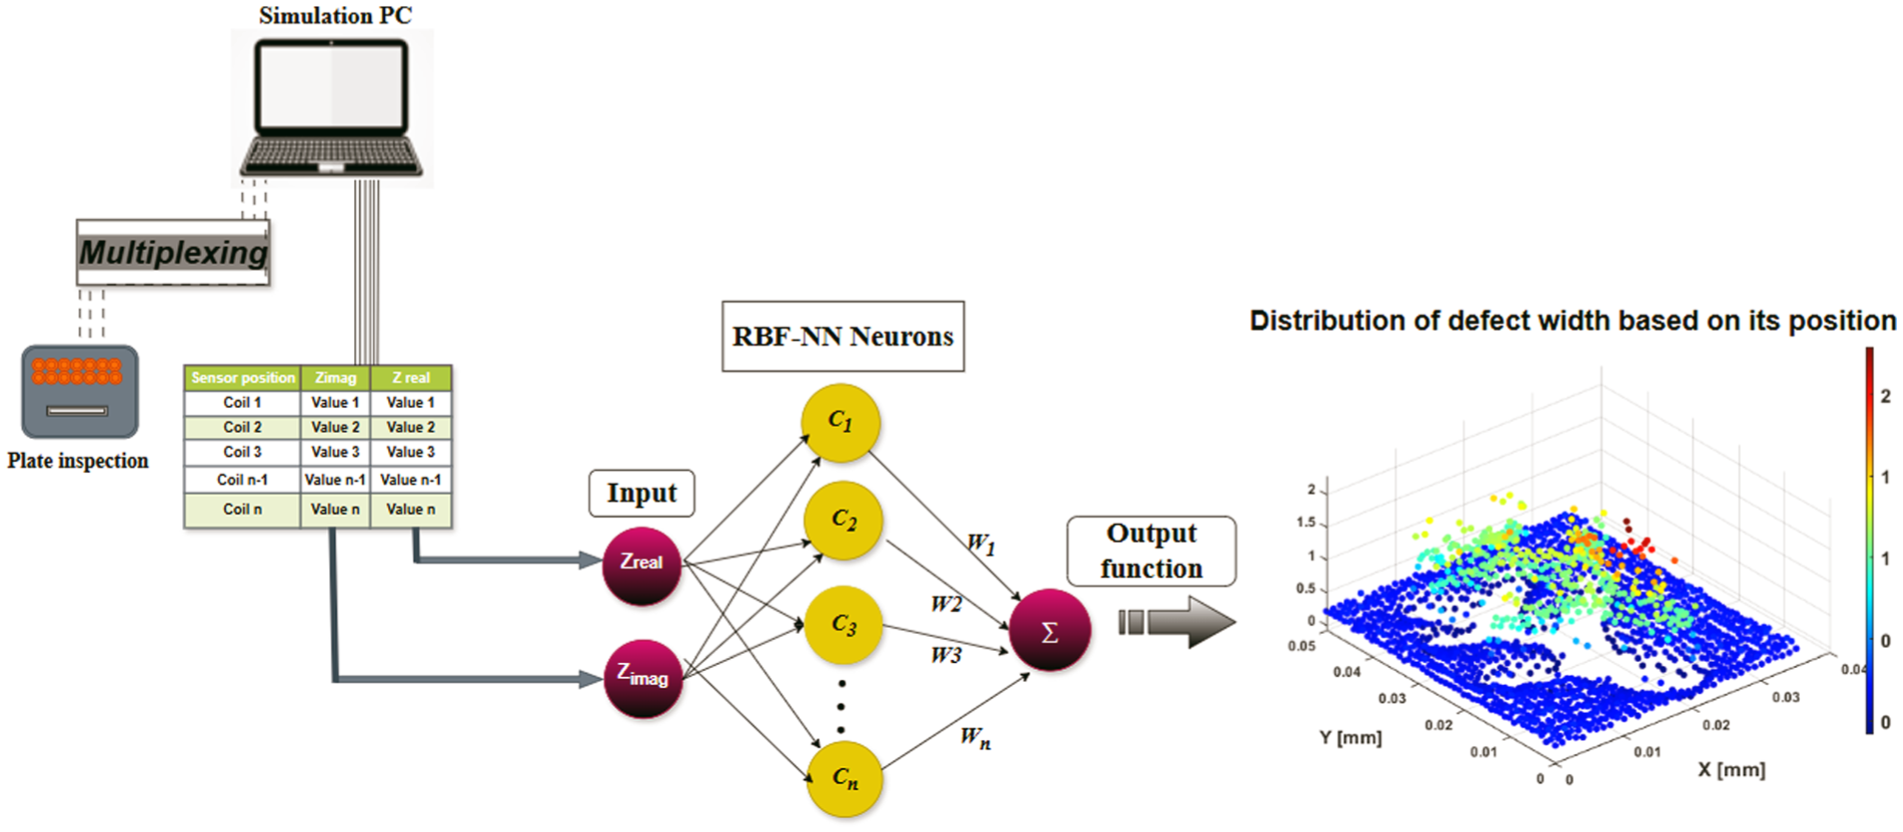
Defect characterization in eddy current testing using radial basis function neural networks.
The performance of the radial basis function (RBF) algorithm, pre-trained on two distinct datasets (Figure 13), was evaluated using impedance-based imaging of two types of randomly generated defects. The imaging results, presented in Figures 8 and 9, provide the first validation of the model’s ability to differentiate and characterize variations in the impedance response caused by defect presence and geometry. This step establishes a foundation for assessing whether the network can effectively generalize across different defect morphologies.
In the second phase of the study, the predictive capability of the RBF network was tested by reconstructing the geometric dimensions of the defects, as shown in Figure 16. Figure 16(a) and (b) illustrate the predicted shapes of random defects 1 and 2 along their propagation paths. The reconstructed defect widths are encoded using a color gradient, where dark blue represents regions free of defects (0 mm), and dark red highlights the maximum defect width (2 mm). Intermediate values are represented by orange (≈1.5 mm), yellow (0.75–1 mm), and light blue (≈0.5 mm), enabling a fine-grained visualization of defect severity. The close correspondence between predicted and expected defect geometry confirms that the network successfully captures localized impedance variations and translates them into quantitative structural information.
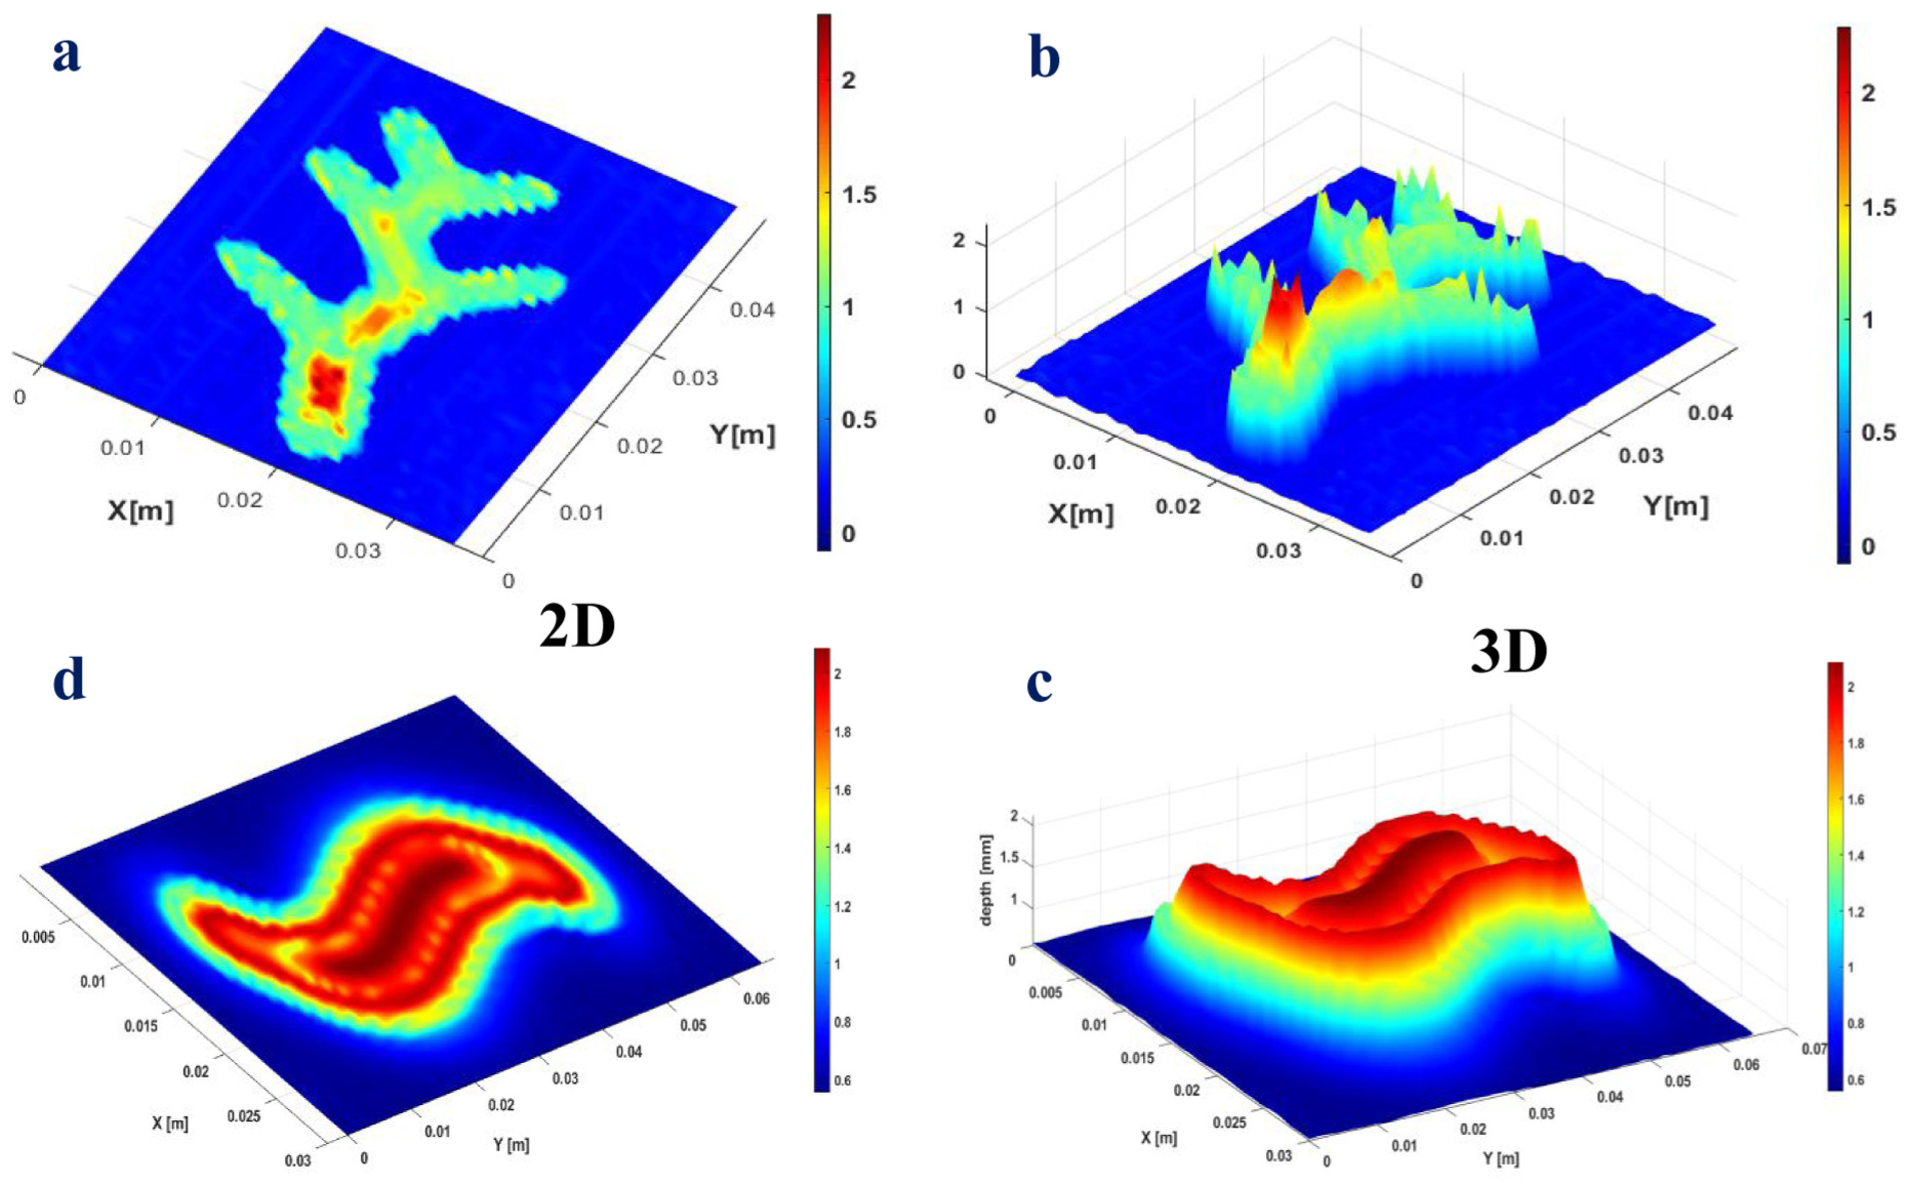
Reconstructed path and width distribution of random defect 2 (a to d) using the trained RBF algorithm.
Beyond width estimation, Figure 16(c) and (d) demonstrate the RBF algorithm’s ability to predict defect depth trajectories with high accuracy. The reconstructed profiles reveal maximum depths of approximately 2 mm, consistently highlighted in dark red, while shallower defect regions are represented by intermediate colors. This depth mapping is especially significant for non-destructive evaluation, as subsurface propagation often determines the criticality of structural degradation. The ability of the RBF network to track both shallow and deeper regions of the defect underlines its robustness in handling heterogeneous defect patterns.
Taken together, these results confirm that the proposed framework is not only capable of detecting the presence of defects but also of reconstructing their geometry with sufficient resolution to distinguish variations in both width and depth. The multi-level visualization underscores the practical value of the approach for monitoring defect evolution over time, which is crucial in applications such as predictive maintenance. Furthermore, the stability of the predictions across both datasets reinforces the claim that the RBF algorithm generalizes effectively and can be applied to different defect types without extensive retraining. In summary, the extended set of results highlights the strong predictive power of the RBF network in terms of accuracy, robustness, and practical interpretability, strengthening its relevance for industrial non-destructive testing scenarios.
Conclusion
This study presented a modeling framework for the detection and characterization of random defects in aluminum sheets, with particular emphasis on irregular defect paths and varying geometric dimensions. A multiplexed eddy current sensor array operating at a fixed excitation frequency was employed to minimize mutual inductance effects while maintaining high spatial resolution. The structured impedance data, synchronized with the scanning trajectory, provided a reliable and consistent basis for reconstructing complex defect geometries.
To enhance defect characterization, a Radial Basis Function (RBF) neural network was trained to predict defect dimensions directly from the measured impedance responses. The use of 5-fold cross-validation demonstrated strong generalization capability, as evidenced by high correlation coefficients and low error variance across all folds, thereby mitigating overfitting. Compared with more computationally demanding approaches such as convolutional neural networks (CNNs) or Gaussian process regression (GPR), the RBF model achieved a favorable balance between simplicity, fast training, and high prediction accuracy.
When applied to randomly shaped defects, the proposed RBF-based approach successfully reconstructed defect trajectories and geometric variations, including both width and depth, as illustrated in Figure 16. These results confirm the effectiveness of combining multiplexed sensing with RBF modeling for accurate defect detection and imaging, highlighting its suitability for efficient and automated non-destructive testing (NDT) applications.
Footnotes
Acknowledgements
It is gratefully acknowledged that the research project is proposed by the Electrical Engineering Laboratory, Electrical Engineering Department, Mohamed Boudiaf University and Laboratory of Electric Traction Systems (LSTE), Electrical Engineering Department, Batna 2 University.
ORCID iDs
Ethical considerations
Not applicable. Ethical approval was not required as the study did not involve human or animal subjects.
Informed consent/Consent to participate
Not applicable. This study did not involve human participants.
Funding
The authors received no financial support for the research, authorship, and/or publication of this article.
Declaration of conflicting interests
The authors declared no potential conflicts of interest with respect to the research, authorship, and/or publication of this article.
Trial registration number/date
Not applicable. This study is not a clinical trial and does not require registration.
Data availability statement
Data sharing not applicable to this article as no datasets were generated or analyzed during the current study.