
Abstract
This paper describes the smart energy meter (SM) conceptualization, development, and confirmation through metering tests for advanced smart grid applications. The designed device uses an architectural framework that is in line with the Internet of Things (IoT) concept and utilizes DLMS/COSEM (Device Language Message Specification/Companion Specification for Energy Metering) protocol. The device has an interactive web interface that enables live monitoring and control. The device is capable of measuring three-phase energy with bidirectional flow (import/export) and has a control relay for active load management. The testing outcomes indicate that the device is very precise for all the parameters that have been measured, the errors being 0.27%, 0.37%, 0.23%, 0.19%, and 0.08% for voltage, current, active power, reactive power, and power factor, respectively. The system can provide data almost in real-time and maintain the level of accuracy within a very tight tolerance range of −1% to +1%, with an average delay of around 700 ms. A review of the last 10 most recent designs shows that this work is the only one that has all eight features as a single solution, including power quality monitoring and standards-compliant communication. Besides that, thermographic tests affirm that the device operates well in terms of heat dissipation under normal, alert, and overload situations. The import/export case study (51% solar, 49% grid) shows a smooth transition to renewable energy-based infrastructures. These findings confirm that the system is scalable, interoperable, and conforms to cybersecurity regulations, thus, making it a potential large-scale deployment candidate for the future decentralized and decarbonized energy systems.
Introduction
The present energy transition fundamentally changes the global energy system by significantly reducing the use of fossil fuels and increasing the usage of clean and renewable energy sources such as solar or wind energy. Morocco has the sun and wind to power itself, and it has made a firm commitment to renewable energy in its national energy mix by setting a target of 52% renewables of installed capacity by 2030.1–3 However, increasing green energy production is only one aspect of the energy transition; the energy transition requires smarter and more efficient energy flow management systems as well as more efficient ones coupled with intelligent technologies.4,5 Despite being among the least energy-intensive countries in terms of per capita consumption, Morocco is heavily reliant on fossil fuels. Hydrocarbons account for 60% of the national energy mix, and 84% of electricity generation is done by private operators, mainly through coal and, to a lesser extent, natural gas. While there are renewable energy options, including solar, wind, and hydropower, they only account for 37% of the installed capacity and roughly 20% of actual generation. Furthermore, the country imports almost 90% of its primary energy needs and around 80% of its electricity supply, thus it is still highly vulnerable to energy disruptions. 6 Many factors explain this state of affairs: the scarcity of domestic fossil fuel resources, the lengthy lead times required to invest in alternative energy infrastructure, the limited local capacity to produce enough energy, and the high costs of investing in renewable options. Regardless of these elements, the risk that accompanies the shift to sustainable energy is still very high, especially in the case of climate change mitigation, fossil fuel depletion, greenhouse gas emissions that affect public health, and green economic growth, as cited in Laaroussi et al. 7 Hence, Morocco has set up an ambitious energy policy that aims to change the country’s energy mix through large-scale investment in both the diversification of energy sources and the execution of solar megaprojects (e.g. Noor Ouarzazate), wind farms, and battery storage systems, as documented in the sources.8,9
SM is one of the critical components that has brought about the current energy transition. It is a cutting-edge device capable of performing efficient and quick measurements, control, and optimization of electricity consumption. Nevertheless, several limitations persist in current technologies. What is more, we have found that these solutions overlook the energy network’s complex and two-way nature that results from renewable energy sources, in particular prosumer-based models, where users simultaneously consume and produce energy. 10
Smart metering technologies have become essential tools for real-time monitoring, decentralized control, and intelligent energy management in response to the emerging challenges of modern distributed energy systems. Consequently, this advancement has resulted in a growing number of research projects aimed at exploring various metering architectures, integrated designs, and communication frameworks.
Literature review
Such major studies as those of Uribe-Pérez et al. 11 and Al-Turjman and Abujubbeh 12 on smart metering technologies have been highly comprehensive and have resulted in a wide range of substantial advances, for example, system-level analysis and inexpensive embedded implementations. First-level groundbreaking studies, that is, those of Uribe-Pérez et al. 11 and Al-Turjman and Abujubbeh, 12 mainly indicate the necessity of interoperability, communication reliability, and privacy requirements; nevertheless, they do not propose practical integrated hardware solutions. The paper of Koukouvinos et al. 13 and Yadav and Anand 14 is very recent. As a consequence, they disclose not only the issues that may cause measurement accuracy, dynamic energy management, and network adaptability challenges but also the necessity for further integration of multifunctional SMs. Many experiments have been carried out to generate affordable or open-source designs. For example, Morales-Velazquez et al. 15 created a PQ-oriented three-phase meter, while Abed & Naser 16 and Ahammed et al. 17 started the concept of single-phase IoT meters as cheap devices, have limited PQ capabilities, and are short of multiphase functionality. Garcés et al. 18 research dealt with the issue of IoT-based energy monitoring going beyond power quality not very deeply. Thus, from a performance, scalability, and field validation perspective, these devices still have limitations although they make energy consumption more approachable. Other works have particularly been concerned with the security of communications and privacy of data. Zaredar et al. 19 came up with a privacy-preserving lightweight metering protocol that enhances data confidentiality; however, their solution does not incorporate embedded PQ detection or multifunctional hardware integration. More advanced hardware platforms have been created for power quality analysis. For example, Viciana et al.20,21 designed open-source power quality-compliant meters using STM32 microcontrollers, but these require calibration and are not ready for use. Moustafa et al. 22 integrated PQ monitoring with anomaly detection, and Haider et al. 23 studied metering in renewable energy-based networks; however, none of these systems provide a fully integrated solution that supports multiphase measurement, PQ evaluation, secure communication, and real-world deployment.
Significant limitations remain in all categories, including restricted multiphase capability, incomplete real-time PQ analysis, inadequate energy flow management, lack of secure communication, and minimal experimental validation. These shortcomings justify the need for a multifunctional, experimentally validated three-phase smart meter capable of real-time PQ assessment and intelligent energy management in solar microgrids which is the main contribution of this work.
Contribution
Despite significant progress in SM power quality monitoring, and Internet of Things-compatible platforms, current solutions remain limited in terms of scalability, multi-phase operation, and real-time integration into renewable energy-based microgrids. These prior research works reveal that the presently proposed resolutions ignore the consideration of the energy flows that are dynamic and bidirectional and, thus, hinder in the development of the interactive decentralized energy systems such as those based on user participation and energy exchange flexibility. The goal of this work is to present a solar microgrid scenario that is not only fully integrated but also experimentally validated and represents an SM that is capable of energy management in real-time and in a bidirectional manner. This research seeks to provide an innovative solution aimed at enhancing the functionality of energy meters through the implementation of advanced energy management features and the continuous monitoring of energy quality. To fulfill this aim, an experimental method was taken on which several electrical and electronic components, including a measurement device embedded and based on the HT5023 microcontroller, were needed. Following the technical designing stage, specific electronic circuits were created together with a custom-made printed circuit board (PCB) that contained an electronic overload protection relay. These components made it possible to carry out the experimental tests, the purpose of which was to verify the correctness of the metering system, mainly with regard to electrical power quality and the monitoring of energy flows that were entering and leaving.
The paper is divided into seven parts, with the second section describing in detail the method used in the investigation. The third section describes the design and the functional architecture of the main components of the SM. Section 4 records the custom-made PCB implementation and its evaluation, addressing the integrated electronic components and the interfaces. In Section 5, calibration procedures are explained in great detail, including register configuration and methods for accuracy enhancement. Section 6 starts with a case study about the operational performance of a residential setting. The last Section 7 is about experimental validation and the analysis of the results showing the performance of the SM under different operating conditions.
Methods of smart meter working
The system illustrated in Figure 1, that shows the use of our model and the SM as a result of this research, essentially conquers the limitations of present technologies with the three major innovations. First of all, it has a two-way energy monitoring feature through which the users can exact their energy supply to the grid as well as the energy drawn from the grid. As a result, the management of energy at the local level becomes more efficient and the monetary value of the self-generated renewable electricity increases. Secondly, the operations include a secure data communication protocol, like DLMS/COSEM, for the energy data real-time transmission, thus ensuring data reliability, confidentiality, and traceability. The effect is that data reliability is improved, and trust in energy data values is established. Lastly, the SM is equipped with a control relay module that enhances data reliability and facilitates intelligent load management as well as real-time fraud detection, thereby giving the system increased efficiency, transparency, and resilience.
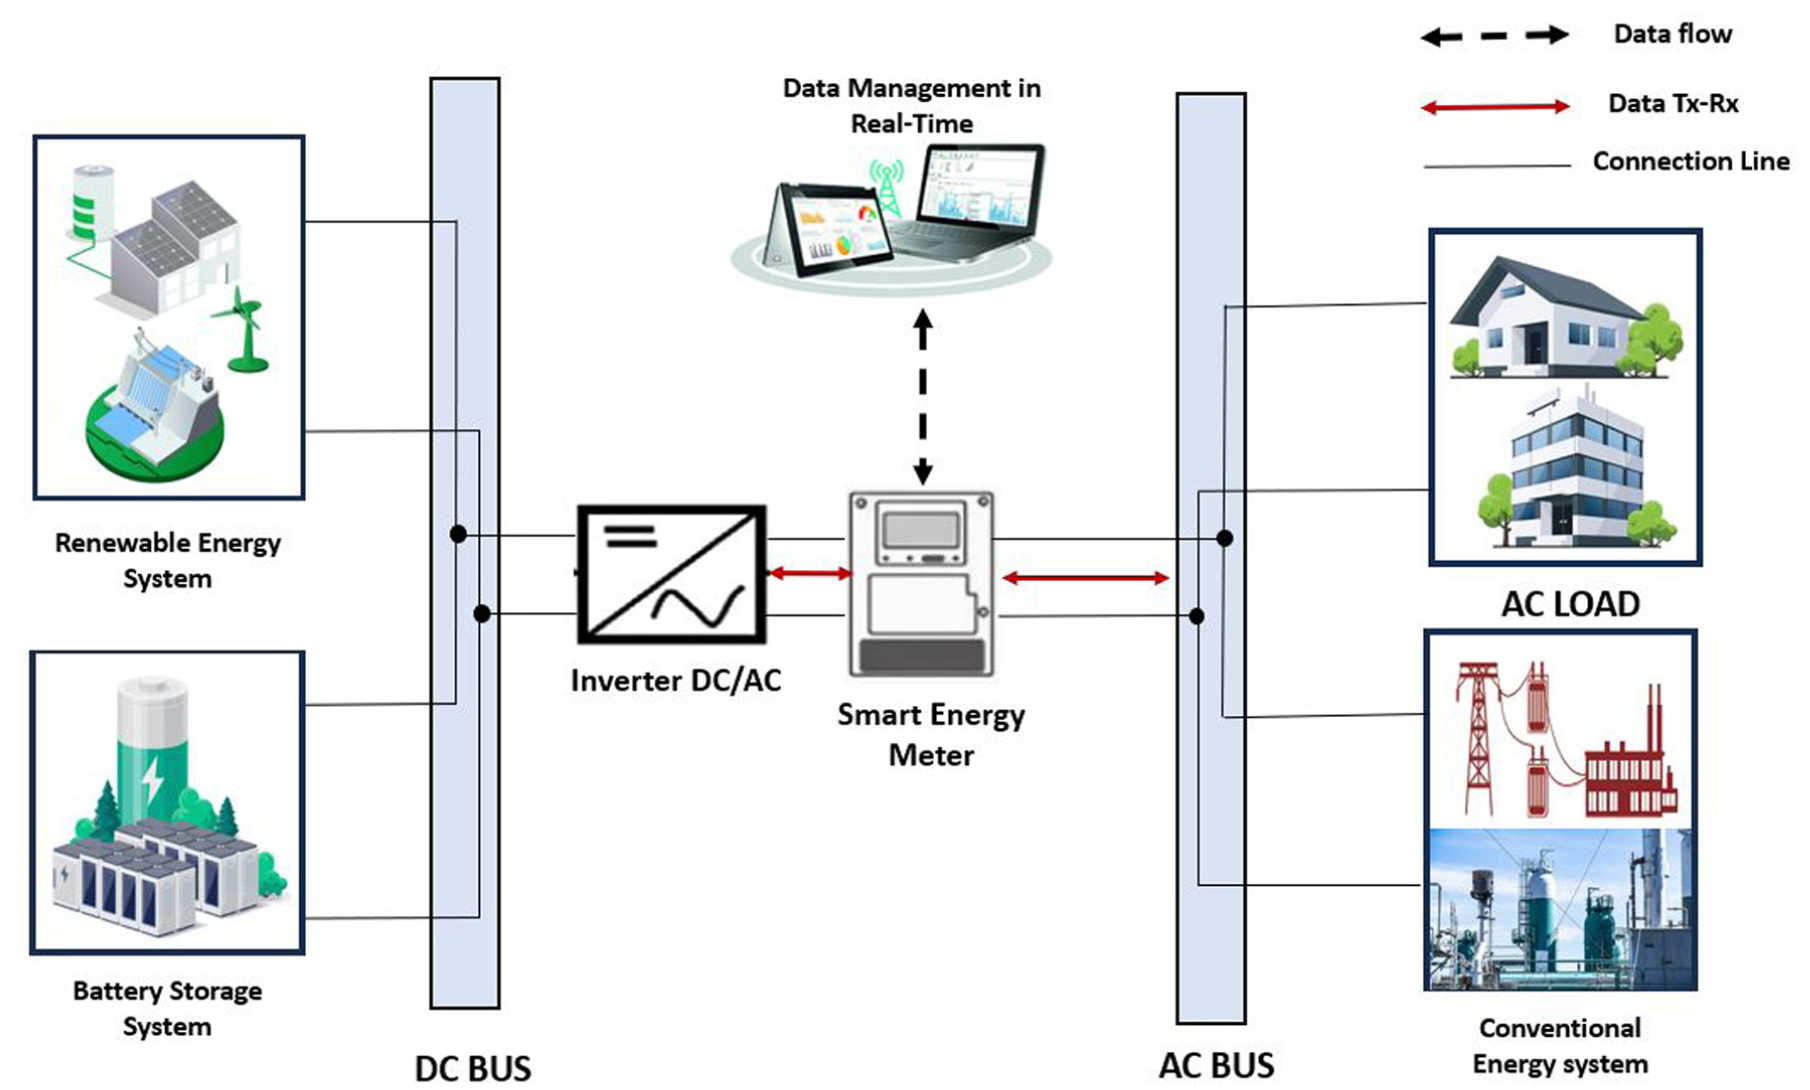
Functional diagram of the electrical system with smart meter integration.
The proposed SM employs a formal decision-based approach, enabling the SM to manage energy flows in real-time and monitor its use throughout the microgrid. In Figure 2, after the SM completes its proper wake-up procedure, which, in this case, consists of writing the energy data into an EEPROM memory module, it will then read and write the measured energy data into non-volatile memory, ensuring that all historical measures and records of use are maintained. Once it has woken up and initialized to conduct its operation, the SM evaluates the user’s energy demand by comparing its parameters of energy exported (E) to energy imported (I). From there, it then decides whether the total demand can be met from energy produced locally whether it has to import energy from the grid to meet the total supply. After doing the E to I evaluation, the meter will progress its logic framework along one of the two decision branches.
- If the exported energy (E) is greater than the imported energy (I), this means that locally produced energy is in surplus. The system will then measure several electrical parameters in “real time” such as: active energy (kWh), voltage (V), current (I), RMS voltage (U), power factor (PF), active power (P), and reactive power (Q). The system will prepare and distribute a billing calculation given the surplus in energy (E-I). Next, the system will trip a load check for possible overload (O) that is potentially harmful or disruptive to the grid.
- In the event imported energy (I) is greater than exported energy (E), this is an indication of a deficit in local production. The system will measure the same electrical parameters similar to the previous example, and prepare a billing based upon the net imported energy (I-E), and perform a fraud detection check (F) that will alert the system to any issues or strange use of energy, or possible tampering with energy usage, including unauthorized access.
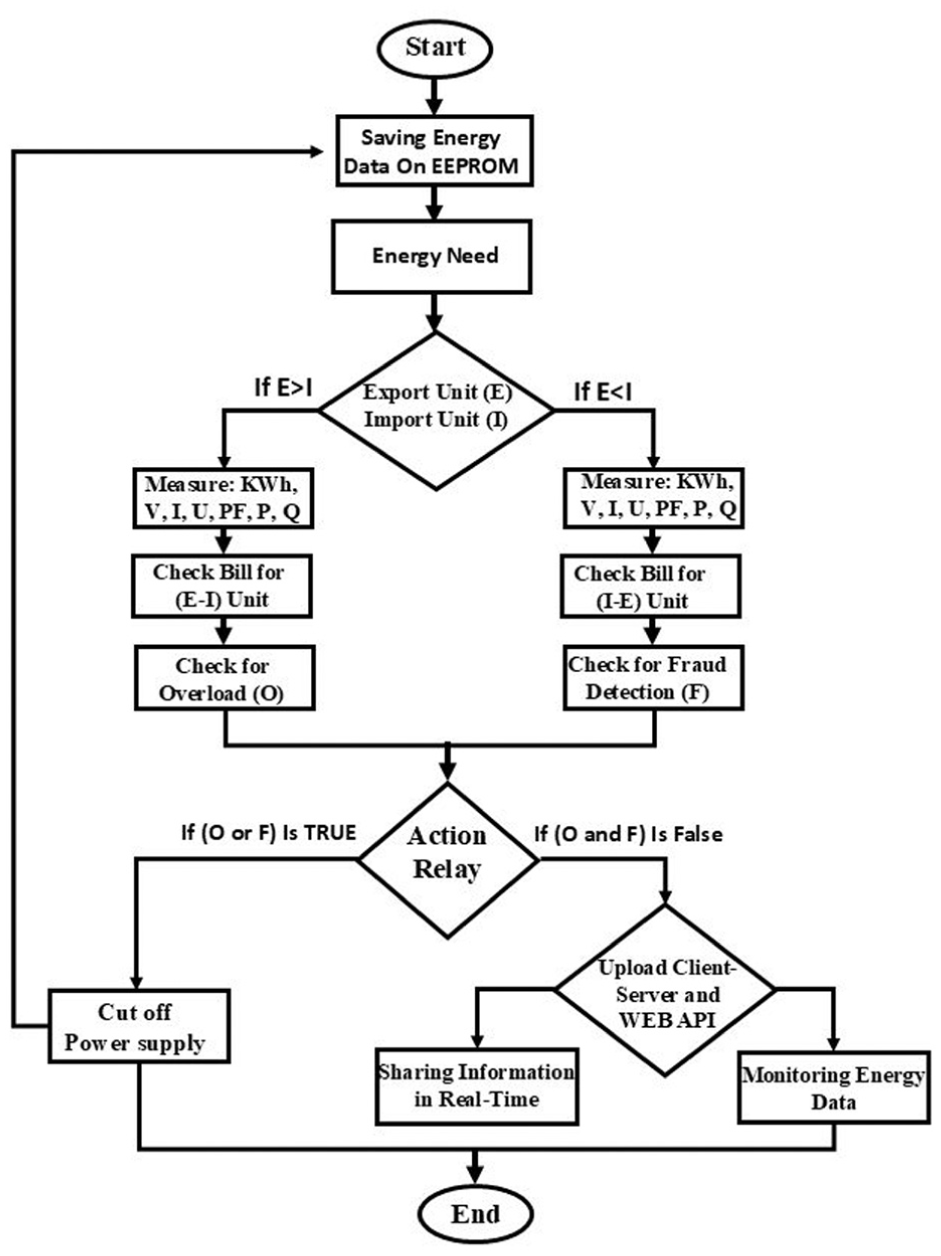
Operational workflow of the proposed smart energy meter system.
Depending on the scenario, all information will be relayed to the Action Relay module, the control center. If an overload is detected or fraudulent activity is suspected (if O or F is TRUE), the power supply will be automatically cut off to limit damage. If no suspicious activity is detected, the system will download validated data from a client-server environment via the web API, and energy data will be shared in real time. Finally, two fundamental functions are enabled: consumer energy data can be continuously monitored for supervision and operational purposes, and energy consumption and system status can be transparently communicated to consumers and network operators.
Design and function of a smart meter
The proposed SM is a compact and reliable device that combines multiphase detection, real-time calculation of electrical parameters, power quality analysis, and autonomous load control. The SM was made as part of this project. It uses a special measurement microcontroller, the HT5023, that was made just for measuring multiphase electrical energy. The system uses EE19-005101 isolated voltage transformers to pick up voltage signals from phases A, B, and C. It uses JD01 current transformers that are set up to measure 80 A to 250 VAC to obtain current measurements. Both sensors must ensure that galvanic isolation is maintained and that analog measurement signals are accurately picked up. The HT5023 microcontroller is designed to accept voltage and current inputs, and it does the calculations for the various electrical parameters on the go. Among these parameters, the microcontroller is able to determine the RMS values, power, energy, frequency, and power factor. Besides, the system is composed of other elements, such as capacitors, LEDs, push buttons, and a real-time clock (ER14250), which make the system more stable, user-friendly, and better at recording the time of energy events. In case the device is disconnected from the internet, it is still able to function, as it keeps the configuration settings and measurement logs in both volatile and non-volatile memory (external EEPROM and Flash). One of the most significant features of this system is the built-in load control based on the relay. This is what allows the SM to be able to carry out the automatic switching off and on of the electrical loads resulting from the user-set thresholds or the detection of the abnormal operating conditions, such as overloads or unusual consumption patterns. The HT5023 is the one in charge of the relay mechanism directly; hence, it is capable of a rapid and automatic intervention without the need for external protection supervision systems.
Apart from its functions of measurement and protection, the SM has a powerful communication architecture, which is shown in Figure 3. The system is equipped with a wireless communication module that can work with both Wi-Fi and Bluetooth, thus allowing easy integration into the latest energy management environments. The data exchange with external platforms is in line with the DLMS/COSEM standard through a UART (Universal Asynchronous Receiver/Transmitter) interface, thus ensuring total interoperability with the traditional metering infrastructures. A port for the optical communication that conforms to HDLC (High-Level Data Link Control) is there to support the existing meter reading equipment. Moreover, the SM permits both local and remote access through the LCD screens and web applications that facilitate the real-time visualization and management of energy consumption. The communication of the meter is designed in a modular and scalable way that makes the meter’s communication an ideal solution for smart grid and microgrid applications.
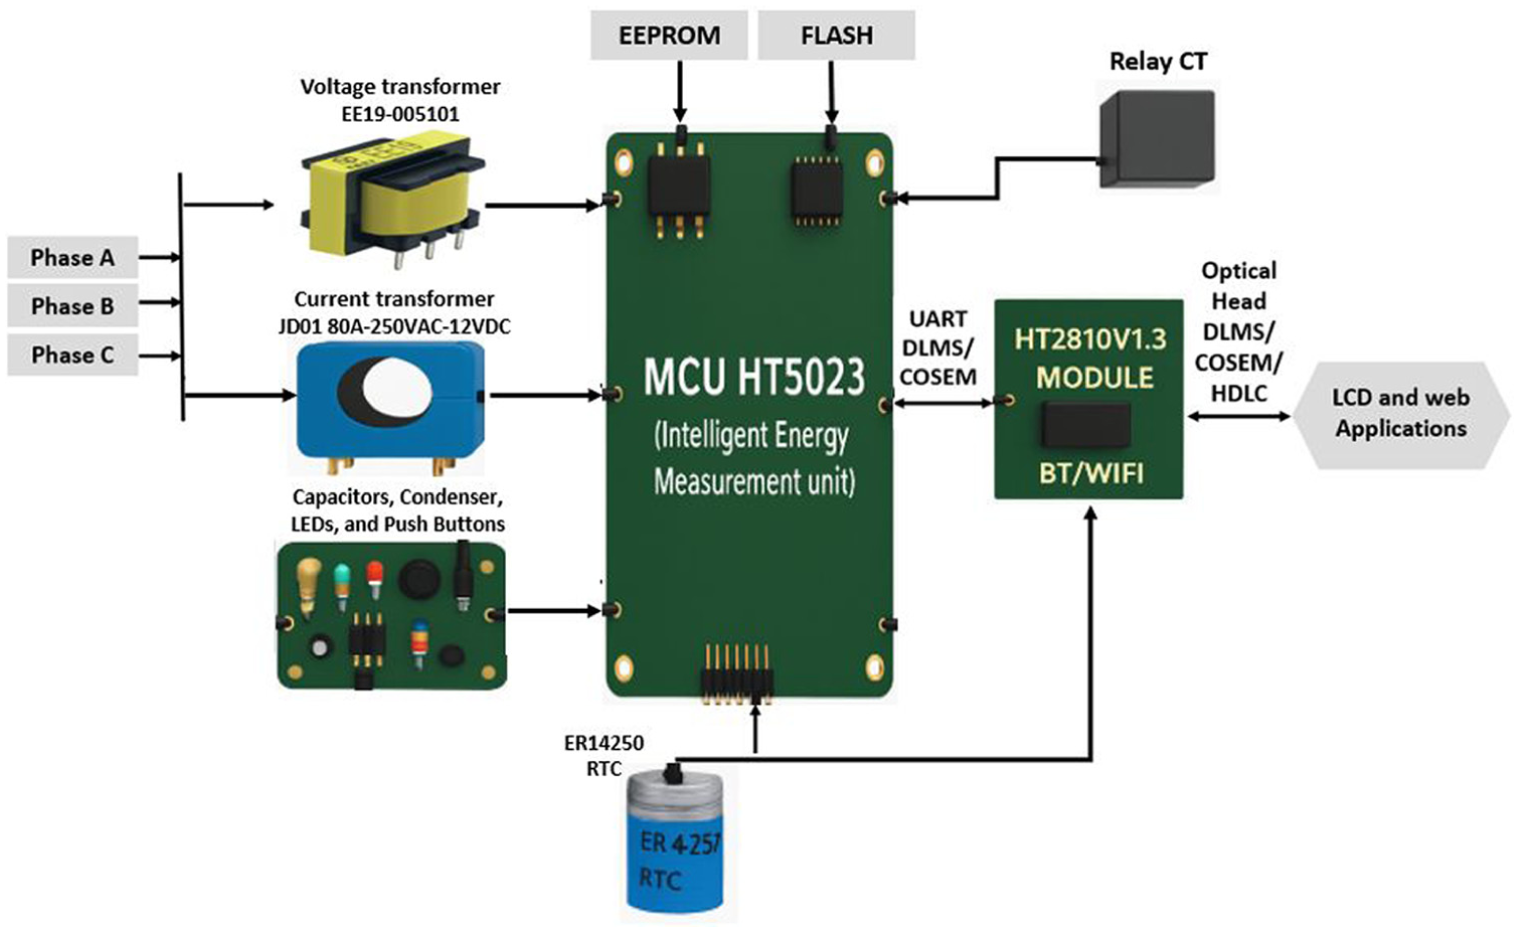
Smart meter architecture.
Measuring electrical parameters
The HT5023 is a high-performance microcontroller excellent for embedded systems that use SMs. The microcontroller carries the ARM-M0 processor core at a maximum frequency of 39.32 MHz, thus providing the necessary speed for higher-speed required processing. HT5023 offers 256 KB of FLASH program memory and 32 KB of RAM, which makes it possible to store a large part of program execution and data. Besides, a lot of different peripherals and functions for smart metering are present in the microcontroller. Some of the interesting peripheral functions are a direct memory access controller, LCD/LED interface drivers, a touch button interface, a capture/compare interface, and an Infrared Data Association interface. Moreover, the HT5023 is equipped with trendy features such as RTC, a watchdog timer, and advanced hardware encryption with a true random number generator that provides both security and reliability. The microcontroller is powered by a voltage from 2.2 to 5.5 V and is built to function within the temperature range from −40°C to 85°C; thus, it can survive the most extreme environmental conditions. It has 100 general-purpose input/output ports and can attach to six UART/USART modules, one I 2 C, and one SPI. Apart from that, the microcontroller is also equipped with an internal oscillator, four 16-bit timers, and a temperature detection function; thus, it is the perfect choice for SM control systems that require precise data acquisition along with power management. The HT5023 is in the LQFP-100 (14 × 14) package that provides compact and versatile features while still being able to meet the physical size requirements of the next-generation SM designs.
Voltage measuring instrument
The voltage detection circuit of the HT5023 energy measurement device connects to the AC power grid for an accurate measurement of the phase voltage at the point of measurement. The circuit is a resistive divider with a high-impedance divider, which brings the line voltage to a value that is compatible with the differential analog inputs (VxP, VxN) of the HT5023. A series resistor of 1 MΩ was used to limit the input current, in conjunction with two parallel RC filter branches (1 kΩ + 22 nF); these RC filters further aid the HT5023 metering chip by providing a low-pass filter, which also reduces high-frequency noise whilst stabilizing the signal. Ultimately, this circuit configuration provides a good level of protection and accuracy, electromagnetic interference (EMI) is suppressed, the integrity of the waveform is safeguarded, and the potential for over-voltage to the chip is reduced. The effective voltage is defined as the root mean square (RMS) of the instantaneous voltage, over the period T, that is given by equation (1):
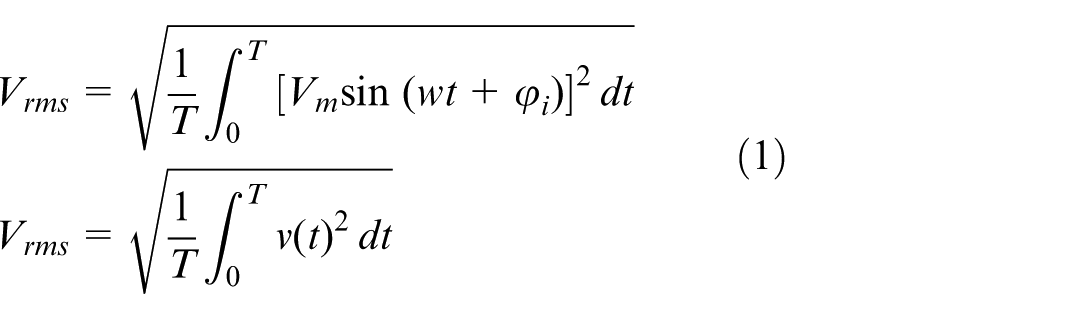
Where V
m
is the peak voltage amplitude (in volts), ω = 2πf is the angular frequency (in radians per second),
This differential measurement topology was adopted not only on the basis of the above noise rejection criterion, but also implemented with more practical common mode noise rejection, taking into account the actual electrical situation encountered. The line voltage was also protected by fast-acting fuses in the line and neutral paths, as shown in Figure 4, thereby reinforcing the robustness of this section of the circuit.
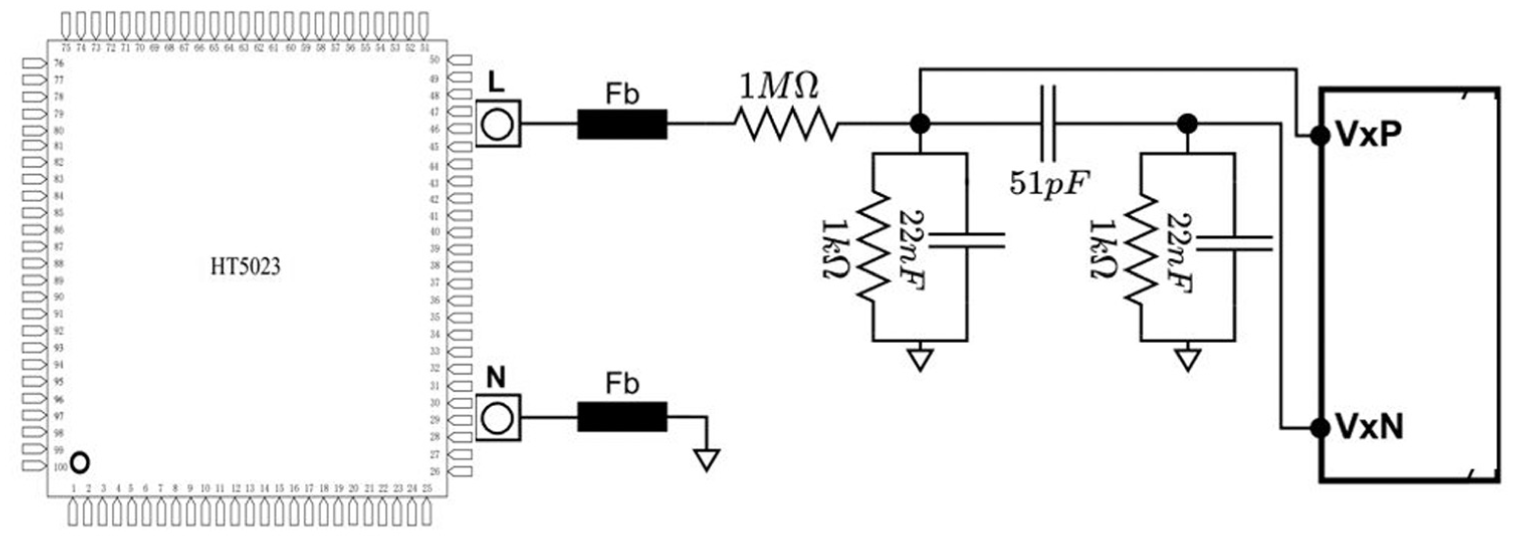
Voltage block diagram.
Current measuring instrument
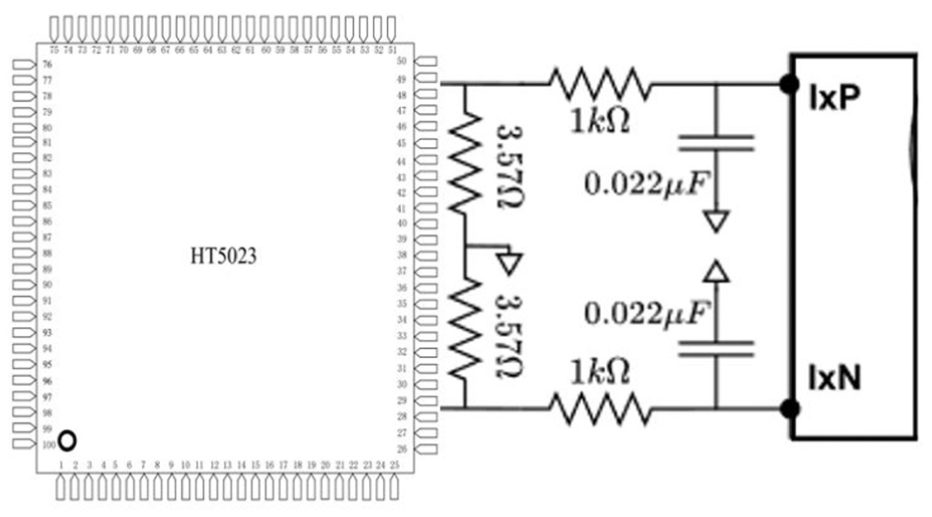
The current sensing interface, as designed for the SM, connects the HT5023 metering chip to the output of a current transformer (CT) in a differential configuration. The differential inputs IxP and IxN receive the scaled-down current signal from the current transformer output via the highly balanced analog front-end circuit used in the SM design. The current transformer output is connected across the precision burden resistors (3.57 Ω), which are used to convert the secondary current into an equivalent voltage signal. To reduce the potential for signal contamination due to noise and to provide some low-pass filtering for signal conditioning before measurement, each input path has a 1 kΩ resistor and a parallel decoupling capacitor (22 nF) in a series arrangement. Similarly to the voltage, the effective current is given by equation (2):
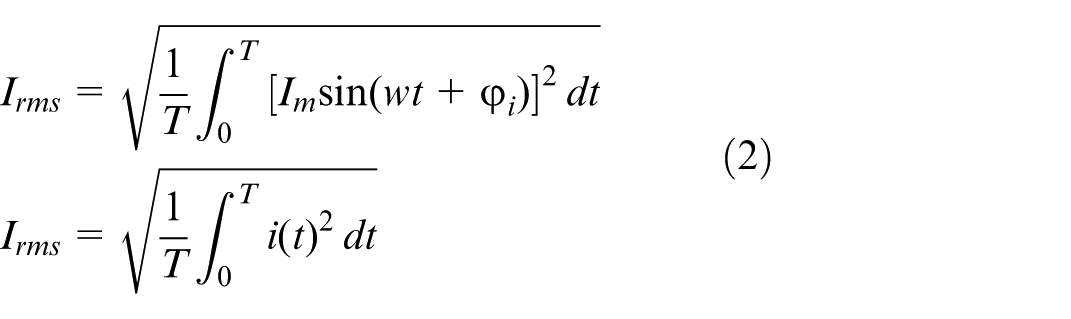
Where I
m
is the peak current amplitude (in amperes),
This makes a low-pass RC filter to attenuate any high-frequency components and provides a more stable signal from which to measure the current waveform when the load applies and releases rapidly. This overall electrical architecture of the circuit in Figure 5 allows the HT5023 to accurately measure line current and to do it in real-time.
Current block diagram.
Communication model
Figure 6 describes a wireless communication architecture for the development of smart energy metering systems, incorporating open communication standards and a lightweight wireless transport layer, as specified, to facilitate accurate, real-time, and bidirectional data communication between edge devices and cloud infrastructures. This architecture is based on SMs, which are capable of measuring electrical parameters, including RMS voltage and current, as well as active, reactive, and apparent power, and accumulated energy flows imported and exported in real time. The SM also provides power quality measurements like frequency deviations, voltage excursions, and harmonic distortion metrics, which are critical to enable advanced services like demand-side management, load forecast, and grid reliability. Regarding communication, the system utilizes the DLMS/COSEM protocol, which is covered by the HDLC frame protocol and transmitted via a UART interface. This kind of mixture is able to provide both interoperability and robustness. DLMS/COSEM offers a modular, object-oriented structure for the representation of meter data and device services, whereas HDLC is used for the reliable framing and flow control. The interface between the SM and the communication hardware is a UART, which is compatible with a large number of embedded systems and communication modules. To present the deployment option, the SM and an API server are connected wirelessly. This wireless link may have Bluetooth and Wi-Fi, depending on the specific version. The API server is the middleware layer that performs two main functions: (i) it receives and stores energy data, which are gathered by smart devices, and (ii) it sends control commands or configuration changes from the upper-level applications. In addition, the API server is responsible for the data integrity, time synchronization, user authentication, and secure access to the API; therefore, it is a vital part of the system.
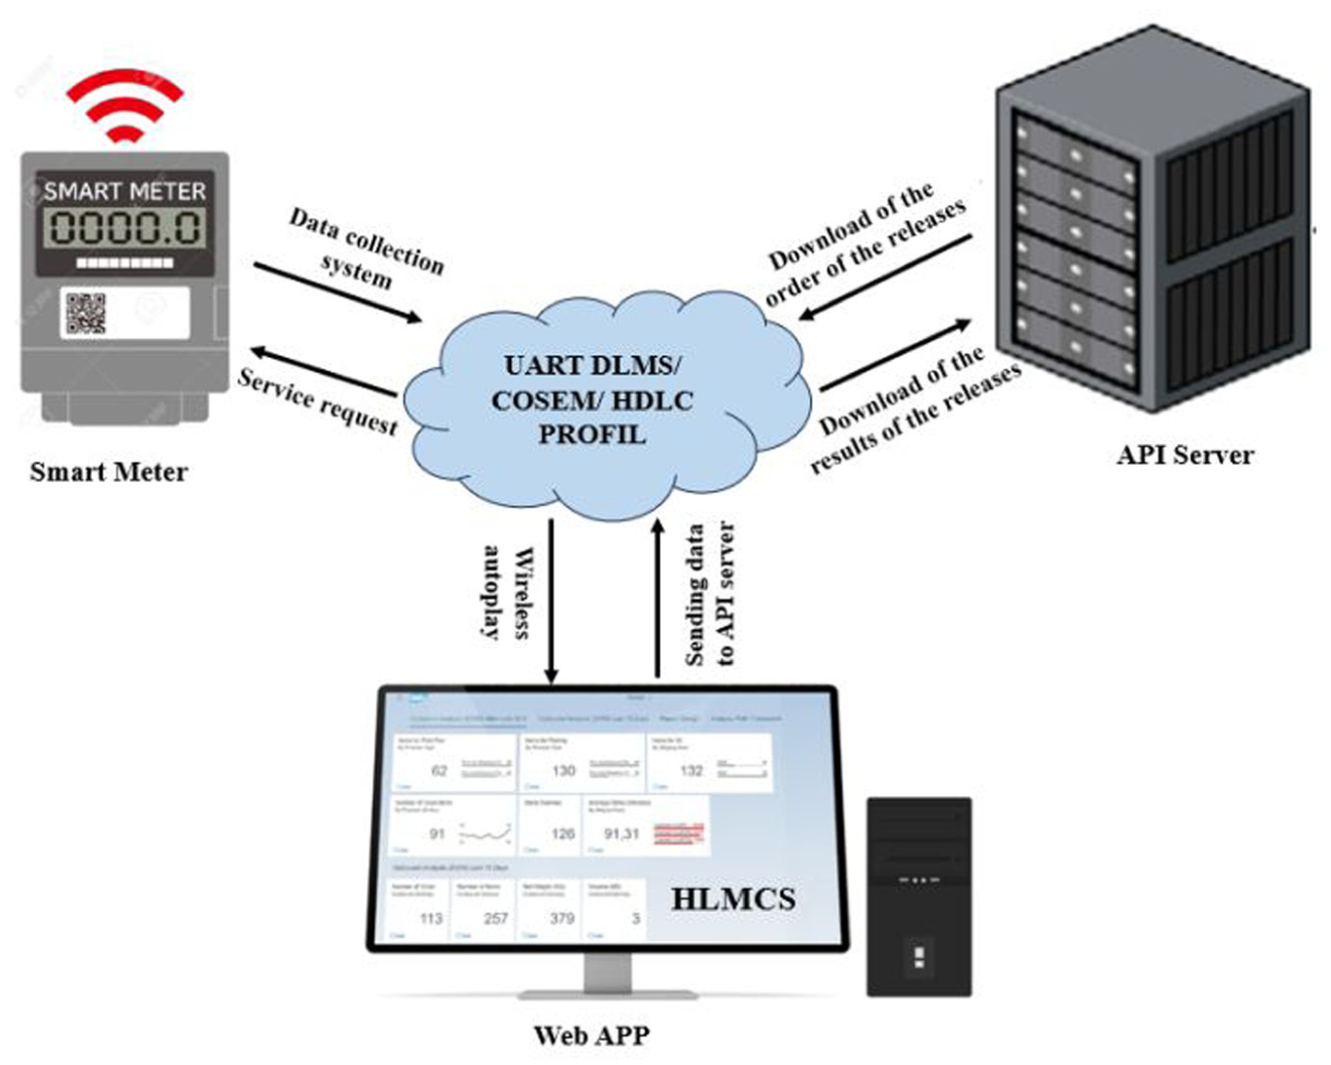
Communication protocols.
At the user level, an HLMCS is available that acts as a web interface for visualization and management. The system gets the processed data from the API server, and thus, users can track energy flows live, study energy consumption patterns, and view system events for all the equipment that is registered. Service requests like changing parameters and sending load control commands can also be given from the reading software; they are routed through the API server, and thus, the SM gets these commands through the same API infrastructure. The meter is fully two-way communicable with the metering infrastructure. The described architecture supports the following operational workflow:
The SM provides electrical measurements and composes them in standardized DLMS/COSEM messages.
The DLMS/COSEM messages are communicated wirelessly to the API server via the UART-HDLC stack.
The API server receives the messages, processes the messages for response, responds to the requests of the HLMC, and records the historical values.
The web application uses the API to retrieve, display, process, and analyze data and request control actions.
The service request from a web interface is transmitted to the API server, where it is sent wirelessly to the SM and executed.
In Table 1 below, the numerous communication interfaces implemented in the SM proposed are listed, each adapted to specific purposes of use. These interfaces will ensure that reliable data exchanges take place for communication, whether on-site or at remote locations. Importantly, too, the various ports at their own defined transmission rate (baud rate), have protocols adapted for use with the data, whether it be the optical port, RJ45 port, Bluetooth/Wifi port, GPRS port, or G3-PLC port, will allow for specific predetermined protocols as enumerated not limited to the IEC62056-21 MODE E in different profiles. These functions ensure the client/server model that governs the DLMS/COSEM protocols enables a robust and flexible integration of SMs into energy management systems.
Communication interfaces.
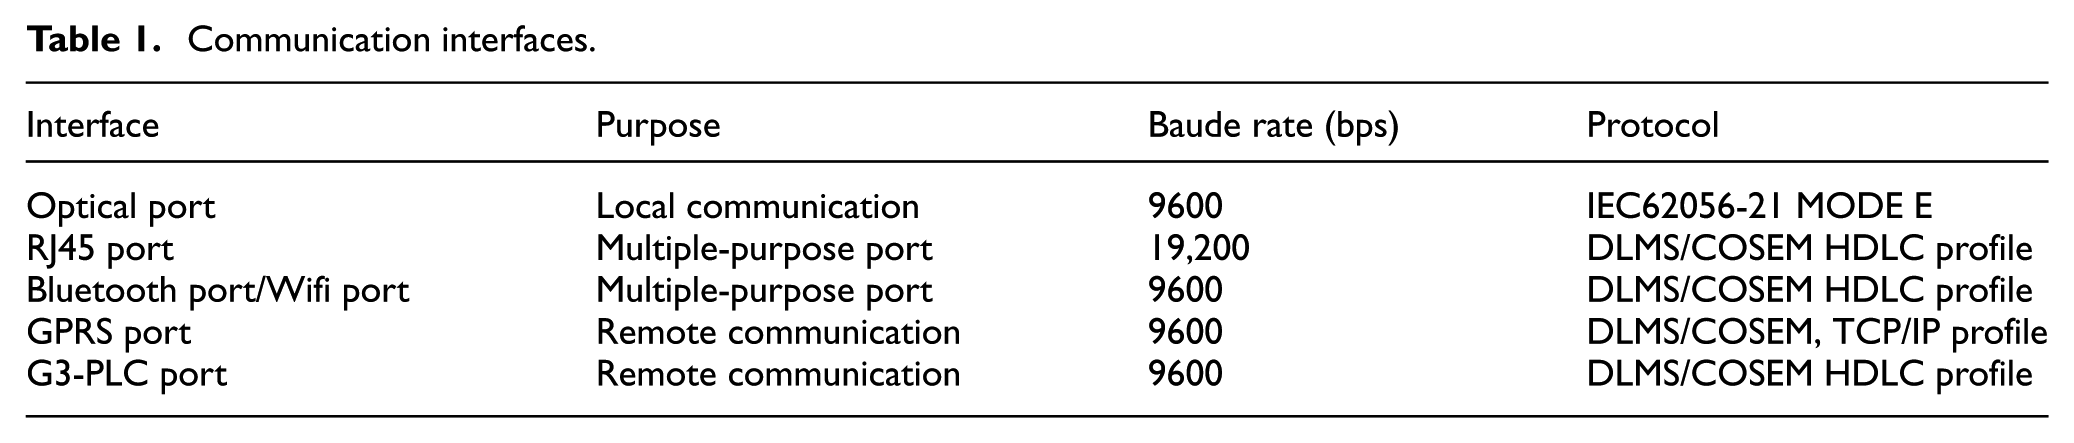
This structure supports reliable energy data management and monitoring is effectively integrated under various communication ecosystems, efficient, and flexible transport of data to optimize the production and distribution of renewable energies in a smart grid. 24
Power measurement and accumulated energy
In the analysis of the energy behavior of an electrical system, the relationship between active power and reactive power establishes the operating quadrant of an electrical system within the complex plane. The device utilizes this four-quadrant analysis to differentiate energy flows based on the type of energy and its direction, whether it is being imported or exported.
Q1 (p > 0, Q > 0): Injection of active energy into an inductive load.
Q2 (p < 0, Q > 0): Absorption of active energy with inductive characteristics.
Q3 (p < 0, Q < 0): Simultaneous absorption of active and reactive energy by a capacitive load.
Q4 (p > 0, Q < 0): Injection of active energy into a capacitive load.
This framework clearly illustrates both the energy flow and the nature of the load. In the case of smart metering, the total energy is first split into three parts: active, reactive, and apparent. After that, each of these parts is further divided into the segments of energy that have been imported and the segments that have been exported, thus showing the complete energy flow of the system.
Power active
The active power represented in equation (4), corresponds to the energy actually converted into real work and is defined as the time average of the voltage-current product:

Accumulated active energy
The total active energy stored in equation (4), referred to as P_abs, indicates the absolute value of the active energy flowing through the system. It includes both imported and exported components, reflecting the active and reactive power in each direction. The expression is defined as follows:

Where P
i
and Q
i
denote the imported active and reactive power, respectively. P
e
and Q
e
denote the exported active and reactive power, respectively. The cumulative imported active energy, denoted by

The cumulative active energy exported, represented by

These equations provide a balanced approach to understanding energy flow, facilitating analysis of the net energy balance in grid-connected and islanded modes.
Accumulated reactive energy
Reactive energy, although it does not contribute to the grid, plays a crucial role in maintaining voltage stability and managing system dynamics. The accumulated imported reactive energy, represented by +R, is calculated by adding the amplitudes of the two reactive power components Q1 and Q2, corresponding to the incoming reactive flows:

The cumulative reactive energy exported, denoted as −R, is expressed in equation (8), where Q3 and Q4 indicate the reactive power components during the export process.

This distribution in equations (7) and (8) facilitates more precise monitoring of reactive energy exchanges, which is particularly important in systems exhibiting significant capacitive or inductive characteristics.
Accumulated apparent energy
Apparent energy stored encompasses the combined effect of active and reactive components and provides a measure of the total energy capacity transmitted through the system. Apparent energy imported, denoted as +, is defined as follows equation (9):

The apparent exported energy, denoted as −E, is calculated in equation (10) below.

Their expressions derive from the vector relations between power components in a complex power triangle, thus making it possible to evaluate the energy quality and the energy utilization efficiency in a given network. The model put forward gives precise and very detailed energy measurements that are going to be used for the management of bidirectional energy flows so that renewable energy sources may be effectively integrated into the future electrical networks.
Power factor accuracy: Relay control
This equipment is one of the steps needed to prevent the electrical infrastructure from breaking down and to ensure the most efficient network operation, especially when it is combined with systems of renewable energy generation. Basically, it allows the network to create or break the connections with the different components of the electrical network depending on the control signals or the occurrence of a failure, such as an overload, short circuit, or frequency anomaly. The proposed supervision management system has three main states: disconnected, connected, and prepared for reconnection. These states can be smoothly and securely interchanged; thus, the energy network control, protection, and reliability are at a high level, particularly in the case of renewable energy integration when manual, local, and remote commands are used. Figure 7 shows the relay state diagram and possible state transitions. These commands depend on the control_mode configuration of the Disconnect control object. The meter supports modes ranging from 0 to 6, with the default control mode set to 5. If a state transition is not allowed by the current control mode, the corresponding action is ignored.
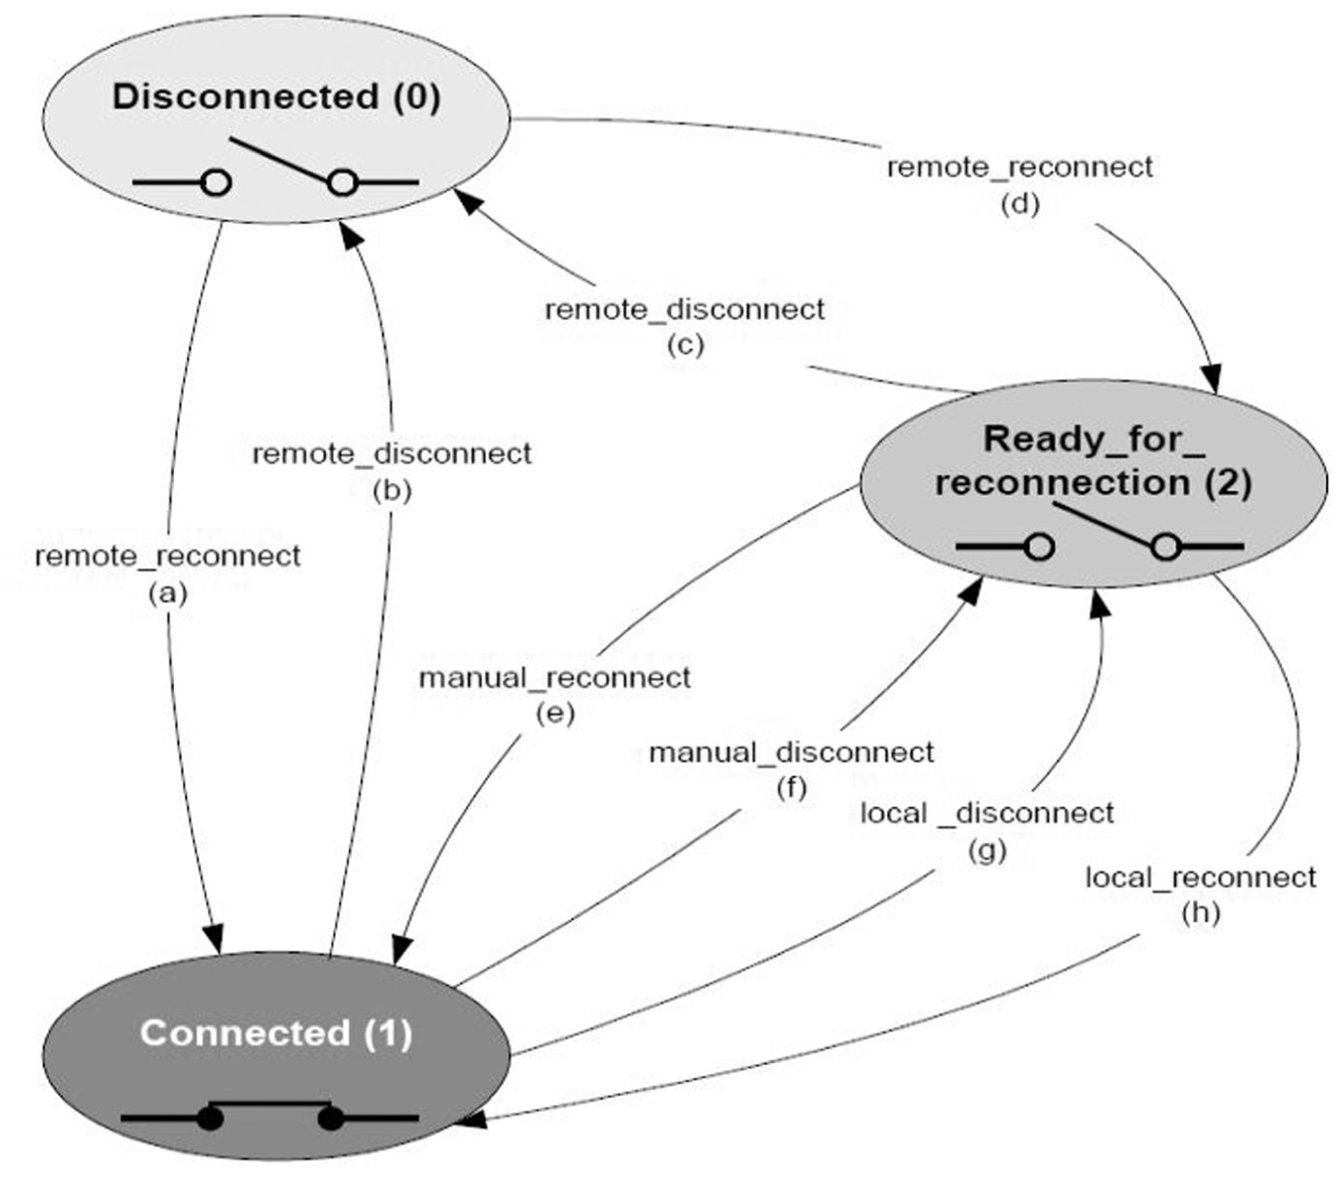
Relay state diagram.
The meter continuously measures active power at 1-s intervals. If the imported active power exceeds a defined threshold for a specified duration (called period 1 or t1), the meter cuts off the power supply. After this cut-off, there is an automatic delay (period 2 or t2) before the power supply is restored. During this delay (t2), the user has the option of pressing the display button to initiate reconnection. However, the meter will only reconnect if the load is below the authorized threshold. In the event that the load goes beyond this limit as a result of a second overload being detected, the power will be disconnected again. An automatic reconnection operation is controlled by a counter that indicates the maximum number of allowed reconnections. Therefore, when this counter hits its maximum, further overloads will be permanently unplugged. At that point, pressing the display button will not establish a connection again; the only ways to power up the device will be by remote or local control.
This arrangement is a clear example, shown in Figure 8, of how the SM can be an active element in energy management, thus enabling better operational decisions. Far from just being an energy consumption meter, the system has been fitted with three experimental components that are a step toward the future of electrical installations. Specifically, the control relay system is capable of load management and detecting abnormal consumption trends, thus providing operational control at the highest level and facilitating the detection of fraud.
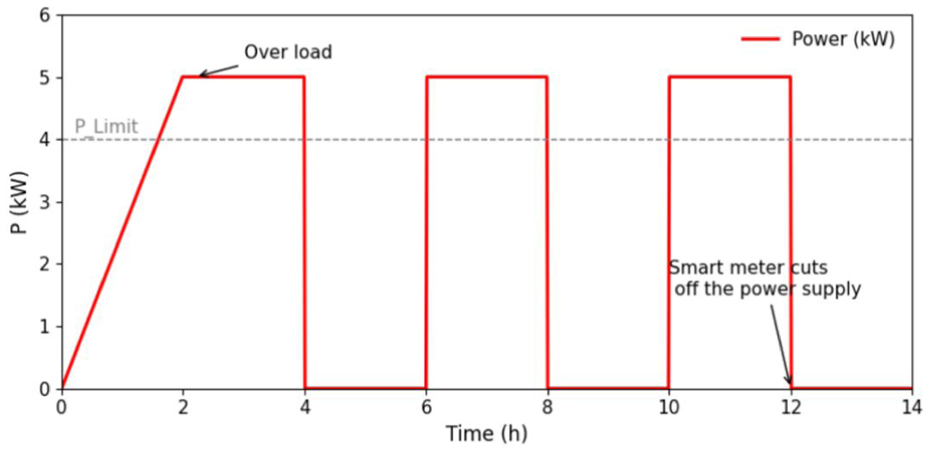
Load control process for one power threshold.
Development and implementation
Figure 9(a) is a printed circuit board that has been specially created for this single purpose and has on it all the hardware that is needed to provide real-time energy monitoring, signal conditioning, communication, and control. Figure 9(b) shows that this printed circuit board consists of several functional blocks, including voltage and current detection circuits, an integrated energy measurement circuit, a microcontroller, wireless communication modules, and a solid-state relay for load control. In designing the printed circuit board, we have attempted to optimize for measurement accuracy and electromagnetic compatibility, including routing of traces, component placement, and separation of ground planes. The analog front end consists of voltage dividers and current transformers that allow for accurate interfacing to the precise stages of converting analog signals to digital signals. The power consumed by the initial analog stage powers the main measurement integrated circuit that samples electrical quantities such as RMS values, active/reactive power, and energy accumulation in real time. The HT5023 microcontroller is centrally located in the design and manages the acquisition, communication with various protocols, and wireless transmission of data to the API.
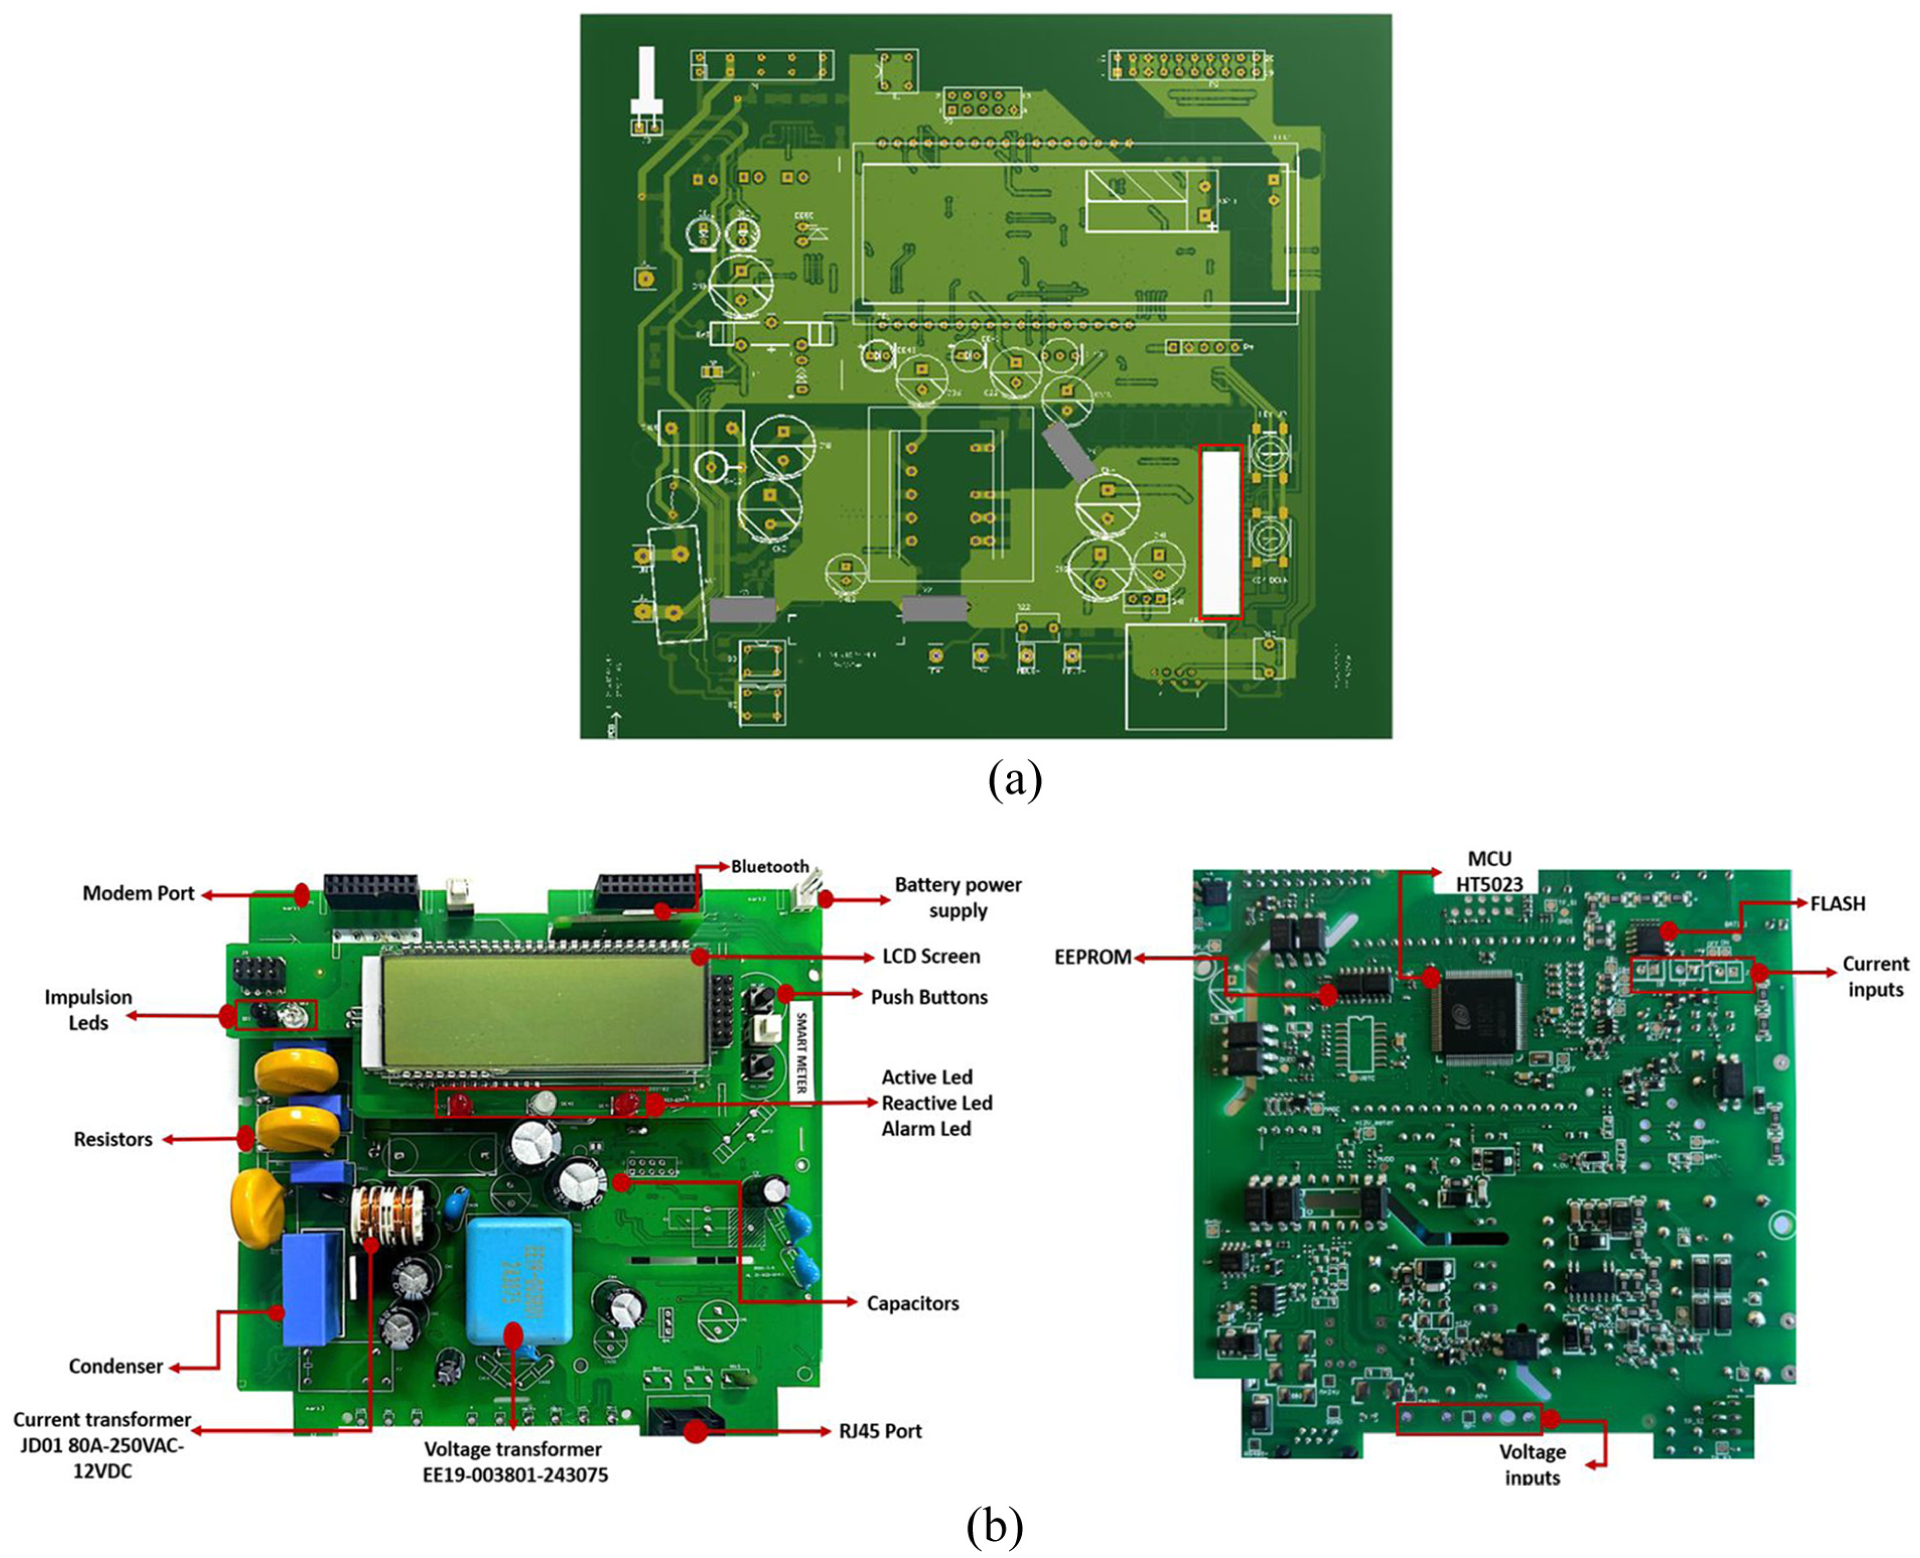
PCB implemented with components: (a) hardware platform for real-time energy monitoring, communication, and control; (b) functional blocks including voltage and current sensing circuits, microcontroller, and communication modules.
It should be emphasized that all the components of the SM, as well as their connection to custom-designed printed circuits and reading equipment, were made at low cost. Therefore, the cost of the overall construction of the entire architecture presented in this article is less than 100 USD. After the implementation of the compasses on the PCB, this SM is well suited for monitoring both the production and consumption of energy from renewable sources such as solar, wind, and other energy. It can provide detailed reports on the energy injected or consumed, identify inefficiencies or anomalies in the production and distribution chain, and allow remote control and dynamic management of energy flows. It is an integrated and intelligent solution, essential to guarantee an efficient and reliable management of renewable energy resources.
Latency
Latency refers to the total delay between the acquisition of data and its presentation on the Enspire servers illustrated in Fig.10, the latency comprises five main components: measurement acquisition (500 ms), DSP processing (50 ms), data serialization at 9600 baud (67 ms), network/gateway transmission (80 ms) and server-side processing (20 ms). The total latency is determined by adding up these different contributions.
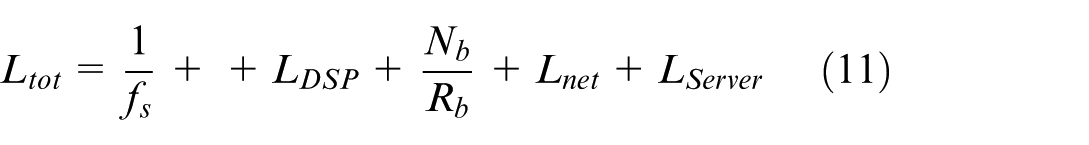
Where f s is the sampling frequency of the measurement system, N b is the number of bits in the transmitted frame, and R b is the baud rate.
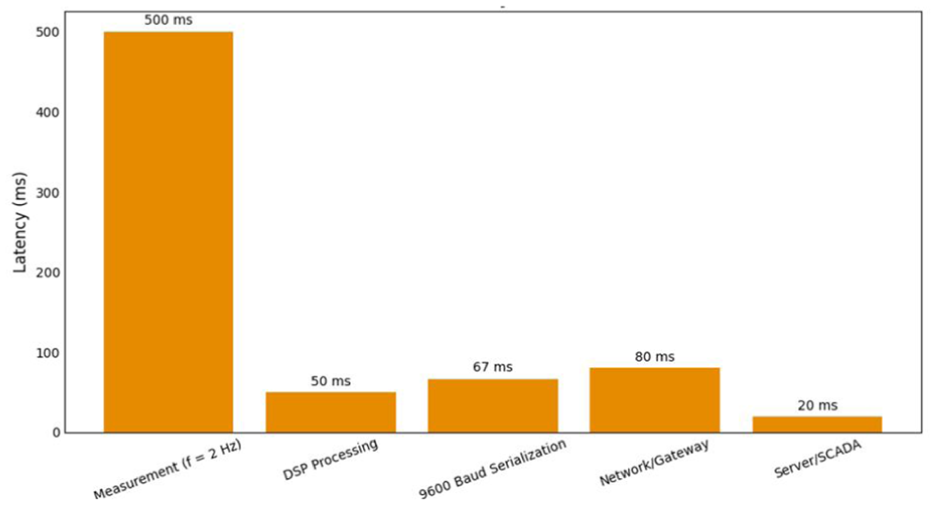
Latency performance.
Most of the delay is due to measurement acquisition, with the other steps only contributing minimally. The findings emphasize the SM’s capability to precisely measure and analyze system latency, thus facilitating dependable real-time performance monitoring and evaluation.
Calibration process of the smart meter
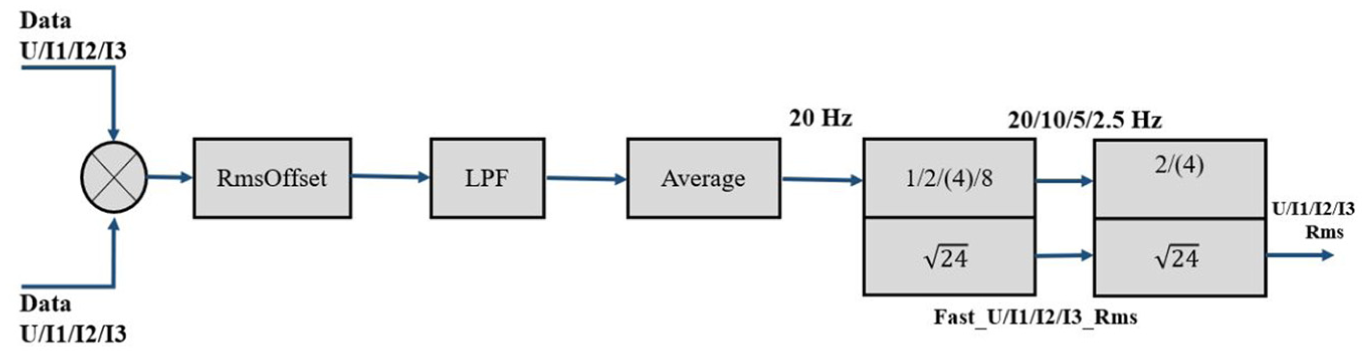
To calibrate the SM, it is necessary to set up certain HT5023 registers directly via SPI that are specific to the calibration. The manufacturer states that it is very important to calibrate the SM to fix the deviations that are caused by the different electronic components that are integrated into the system. The calibration of the unit involves the use of a method called “line accumulation” by Analog Devices, as in Figure 11. The line accumulation technique starts with the determination of the correct gain values for the voltage and current channels, then the offset corrections follow to make up for the hardware inaccuracies. Calculating the root mean square (RMS) value is the most important operation in the signal chain, which is a typical example of three-phase electricity meters. It is quite necessary to have correct voltage and current measurements if we want to be able to monitor and bill energy consumption correctly. The functional diagram shows the processing of the input signals (DataU/I1/I2/I3) to get a calibrated RMS value. At first, the instantaneous voltage and current signals are multiplied (squared) by the meter signals that have been acquired by the sensors.25,26
Smart meter calibration process.
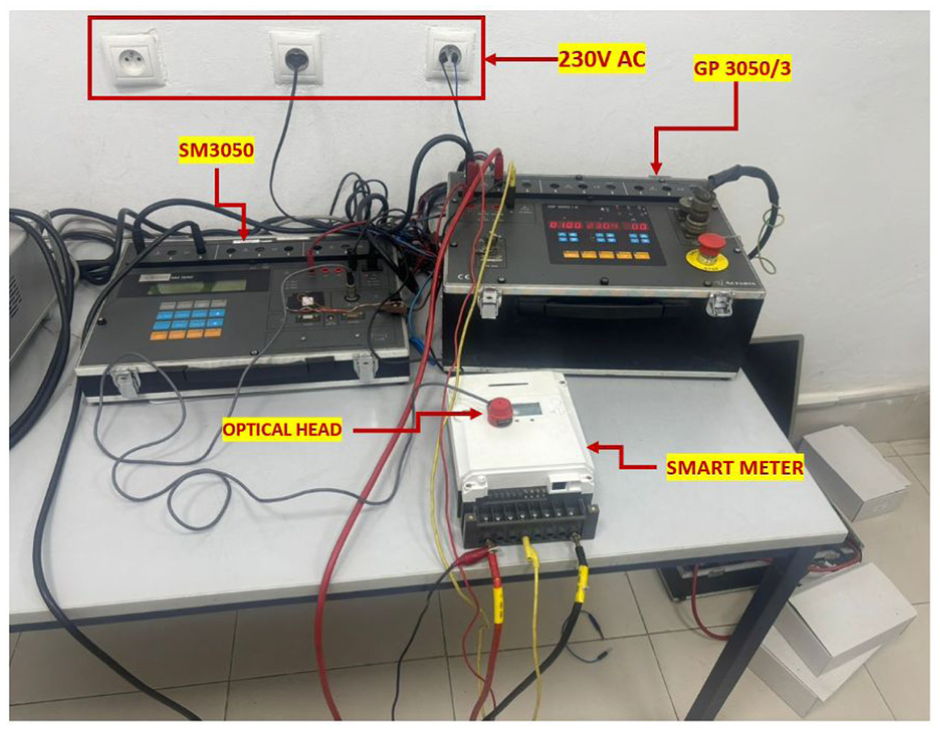
The change agrees with the RMS definition and changes the alternating signal into a strictly positive form that can be averaged. The signal that is squared goes through an offset correction block (RmsOffset) so that any residual DC voltage from some offset is removed. Thereafter, a low-pass filter (LPF) is still used to help the loaded voltage while at the same time removing the high-frequency noise, thus ensuring higher stability of the input signal for averaging. Averaging is done at a sampling frequency of 20 Hz, as this frequency gives a smoothed intermediate version of the squared signal. The signal is then divided into two processing channels, which result in two variable RMS output responses: a fast RMS and a slower stabilized RMS. The experimental test bench, depicted in Figure 12, was equipped with a standard reference energy meter, SM3050 (Actaris), a GP3050/3 portable energy generator, an optical head for communication with the SM under test, and a 230 V AC power source. The calibration procedure involved repeatedly injecting current into the SM while maintaining the RMS voltage at 230 V AC. The current was gradually reduced from 10 to 1 A RMS to include typical operating ranges. The Actaris SM3050 served as a traceable standard for comparing measurements and verifying the response.
Calibration setup using SM3050 reference meter and GP3050/3 power generation.
Case study
To validate the performance and functionalities of the proposed SM, it was installed in a real-world application in a PV system in the Fez region of Morocco. The selected site is a mini solar power plant that has a total installed capacity of 30 kWc to supply local residential loads and inject the excess energy into the national electrical grid. The PV system consists of 72 monocrystalline PV Panels ASTRONERGY, 410 Wc each, with maximum power voltage Vmp of 41 V, open circuit voltage Voc of 49 V, and maximum power current Imp of 9.80 A. The system is arranged as 12 panels per series string with six strings in parallel. The energy conversion is carried out by a three-phase 30 kVA inverter Fronius that includes an integrated Wi-Fi communication module for remote monitoring and data exchange. The SM was installed at the output of the inverter to monitor the energy flow of the PV installation to household consumption and the public grid. This setup allows us to assess the SM’s ability to simultaneously monitor a bidirectional energy flow, monitor real-time parameters, and integrate with existing energy systems.
The experimental setup shown in Figure 13(a) serves as a practical illustration for testing the usefulness and accuracy of the SM under real-world conditions. In each case tested, the objective is to test each of the SM’s key functions, including power measurement, data transmission, and integration capabilities. Together, these tests will provide insight into the performance of the SM for smart energy management in the field of distributed renewable energy. After acquiring and assembling the SM printed circuit board, we powered it up to test it in real-world situations. This step allowed us to measure and record load curves in real time over a specific period, providing us with actual data on changes in energy consumption and injection. In Figure 13(b), we experimented to analyze these curves and gather relevant information on the effectiveness of the integrated measurement and communication mechanisms.
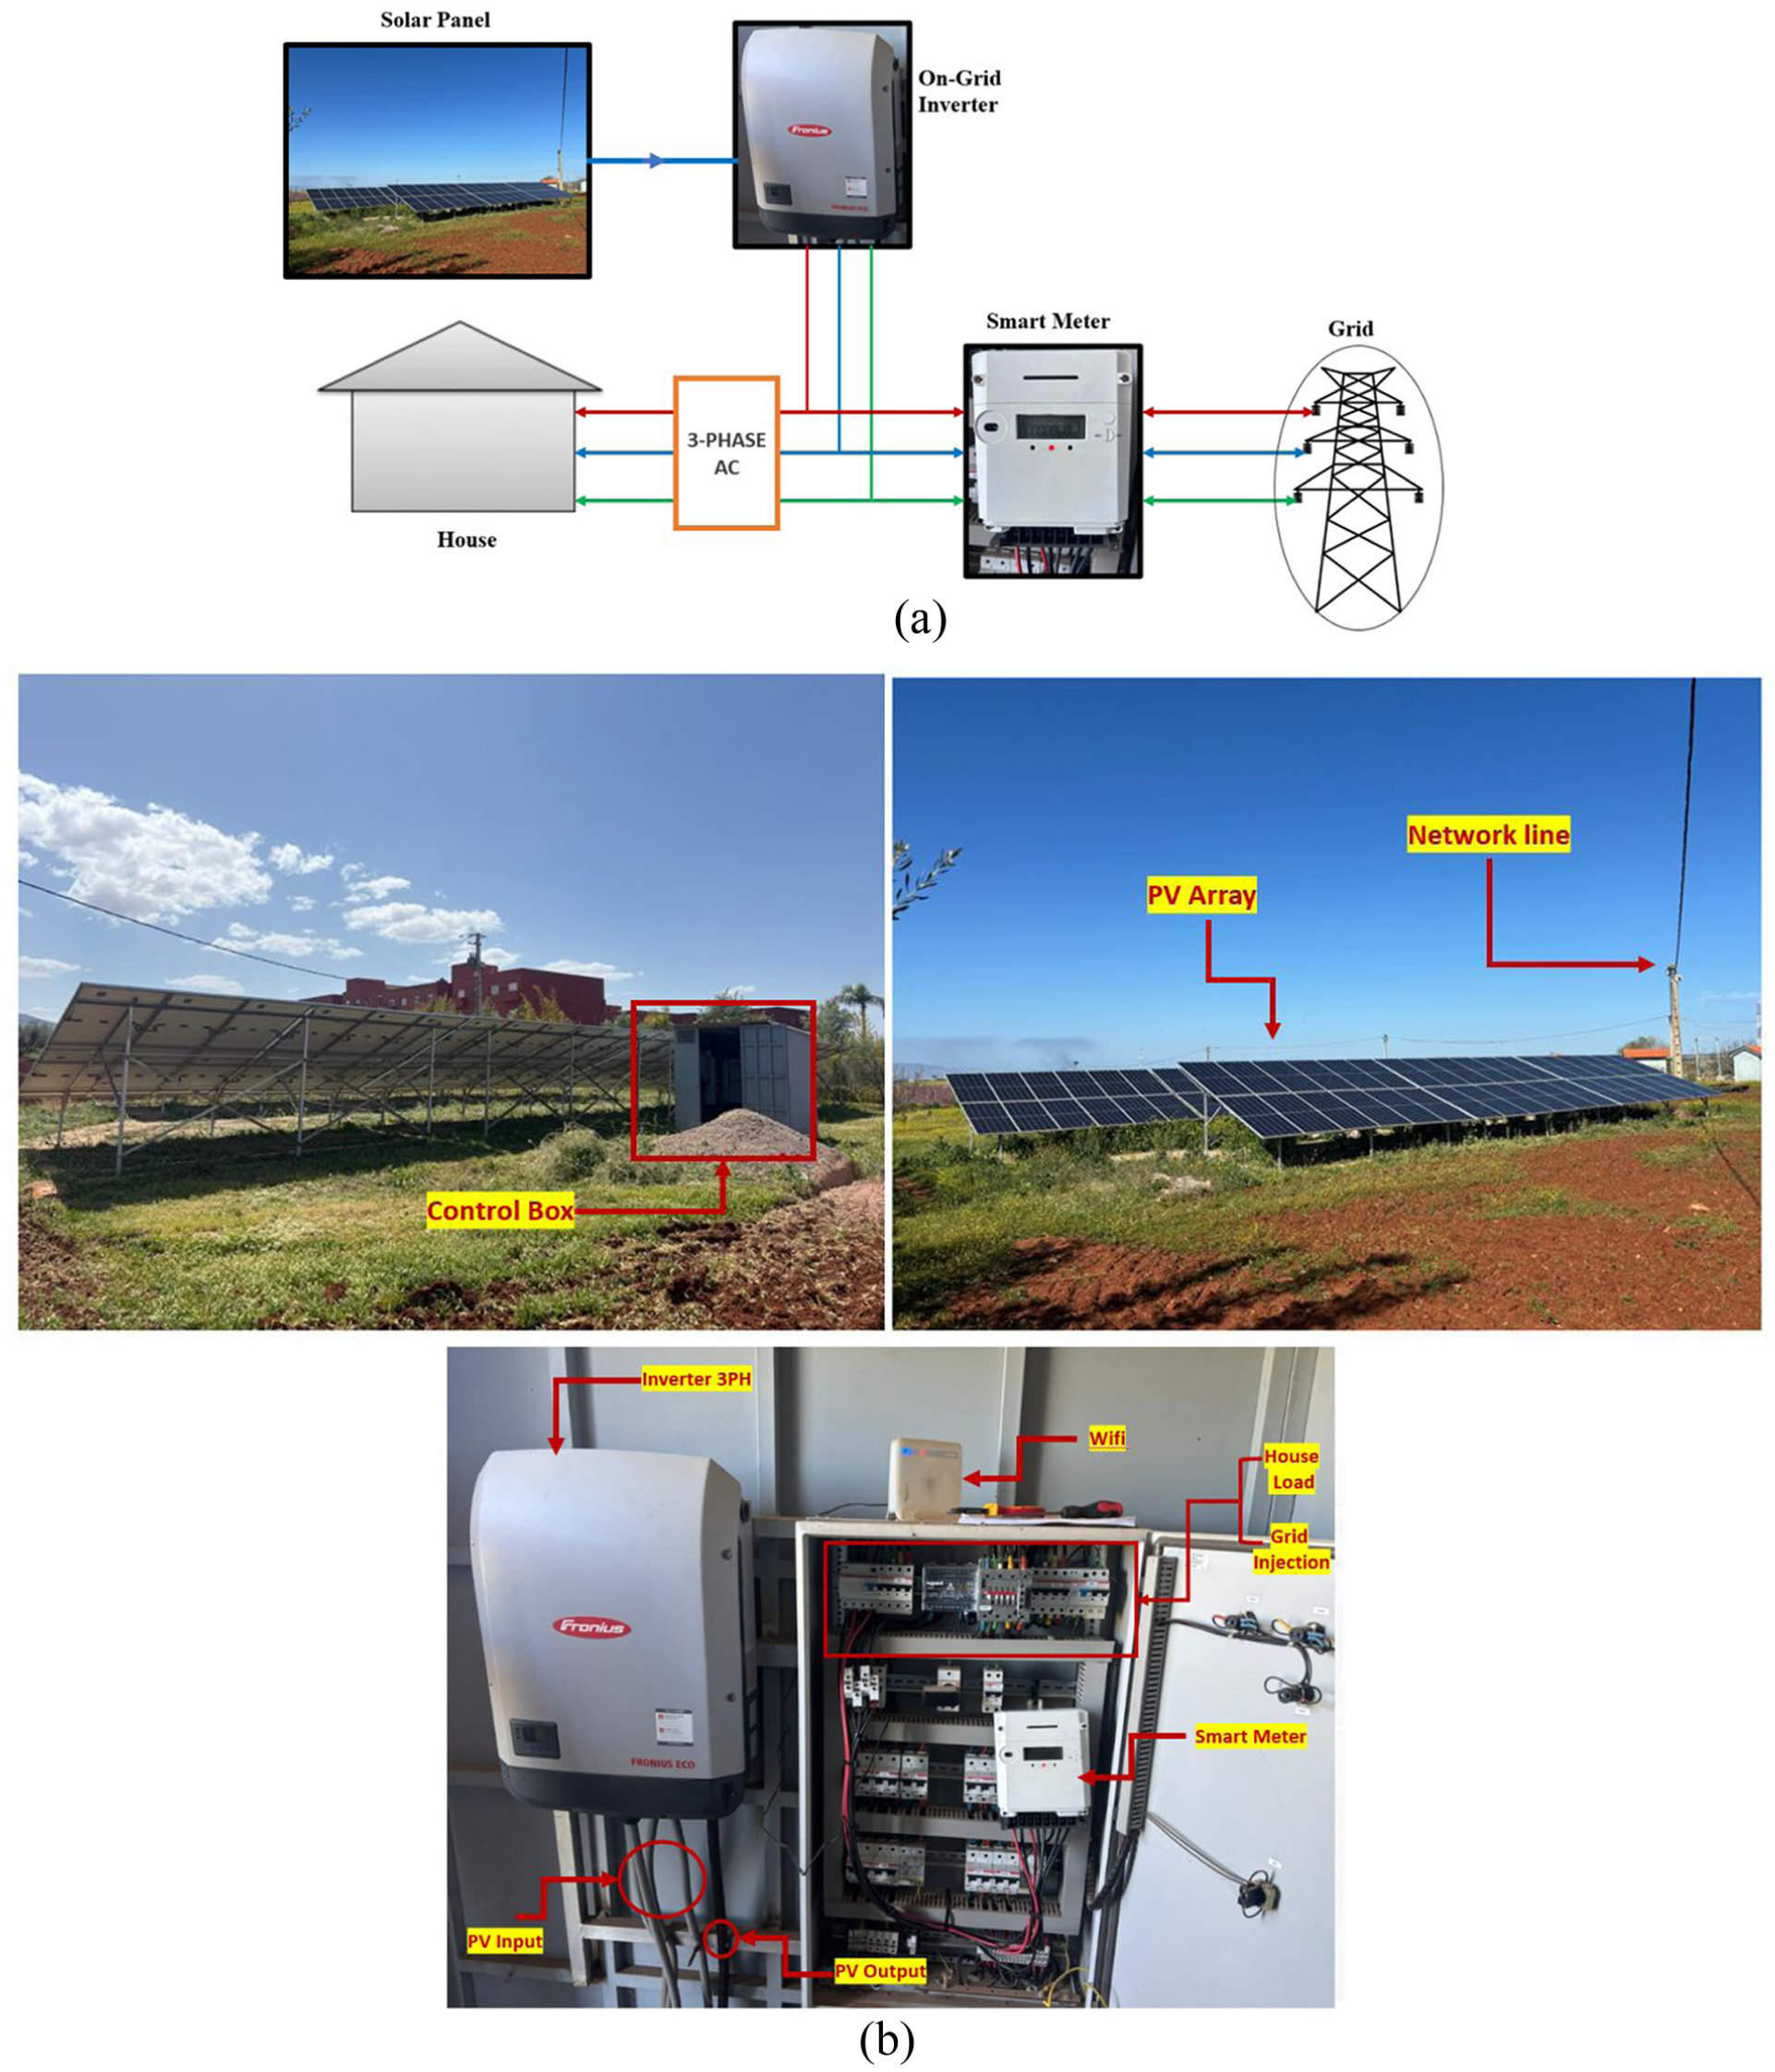
Experimental setup for smart meter testing and Real-world deployment of the smart energy meter in a 30 kWc solar power plant in Fez, Morocco: (a) real-world experimental setup for testing measurement and communication functions; (b) analysis of real-time load curves for evaluating energy consumption and injection performance.
Simulation tools
The process of data collection and visualization from the SM is given by the diagram in Figure 14. The SM attached to the solar power plant measures electrical data like voltage, current, power, etc., and a power data logger sends this information to an Enspire monitoring platform. The platform collects, stores, and provides real-time data from various measuring points for graphical visualization. The entire system is used to observe the condition of the network, analyze the energy performance, and make management decisions more efficiently.
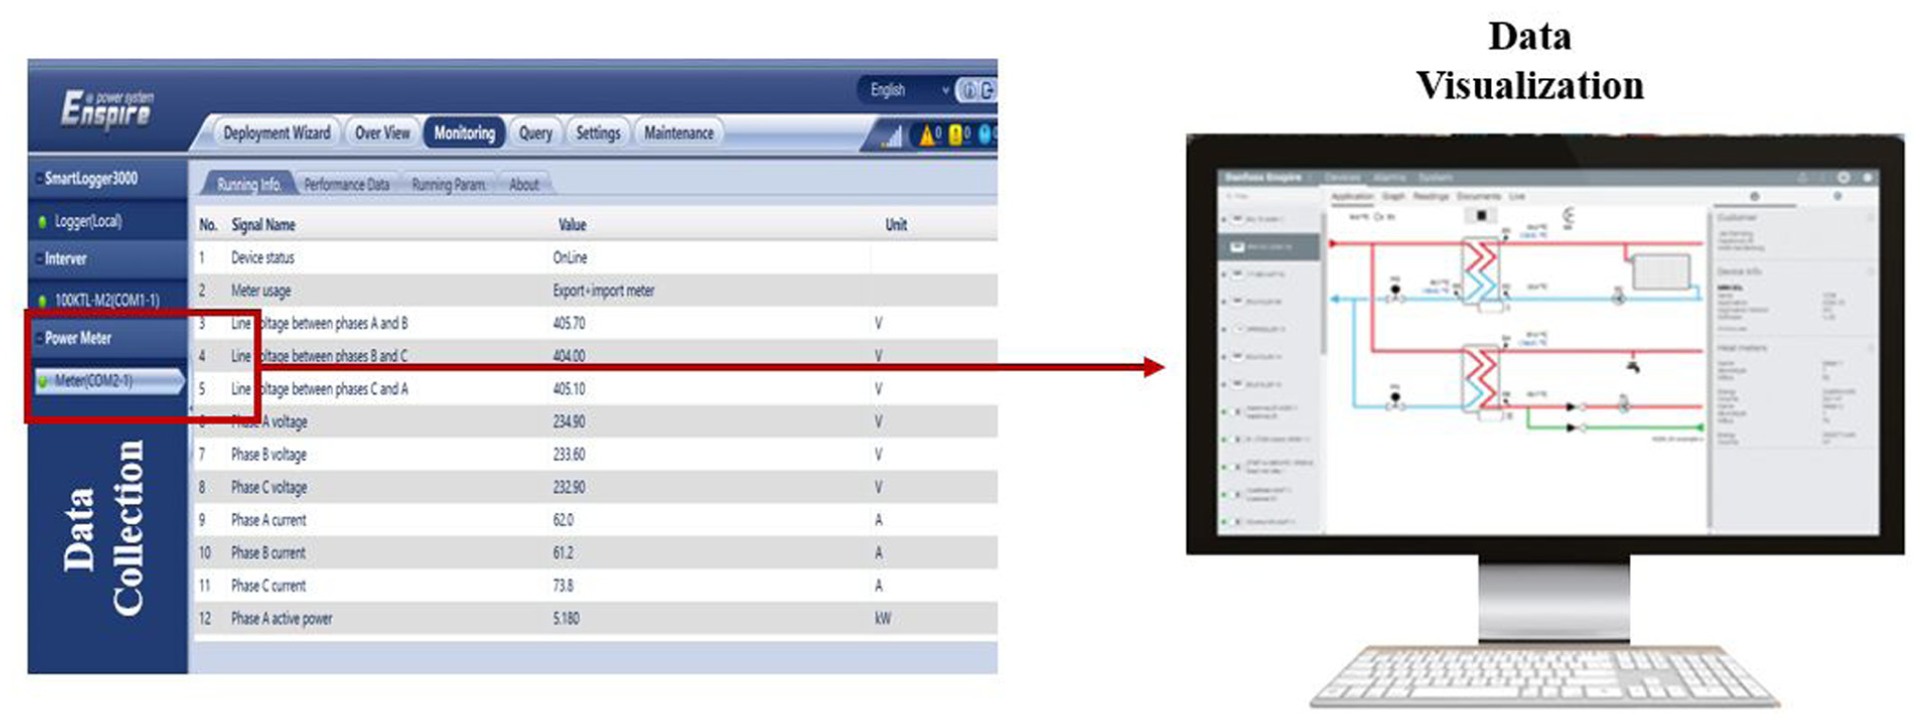
Simulations environnement.
Experimental results
Unity power factor test SM3050 and GP 3050/3
To confirm the performance of the SM developed in the project study, it was calibrated in a controlled electrical context with the use of a reference standard. Table 2 presents the allowable error limits established by the Moroccan standard NM06.4.001 for the Class 1 active energy meters under an alternating current, with appropriate error limits according to various load conditions (percentage of base current Ib), for single-phase and three-phase arrangements, as well as two different power factor conditions (1 and 0.5).
Acceptance limit of errors in percentage determined by the Moroccan Standard, NM06.4.001 “Active energy meters with alternating current class 1.”
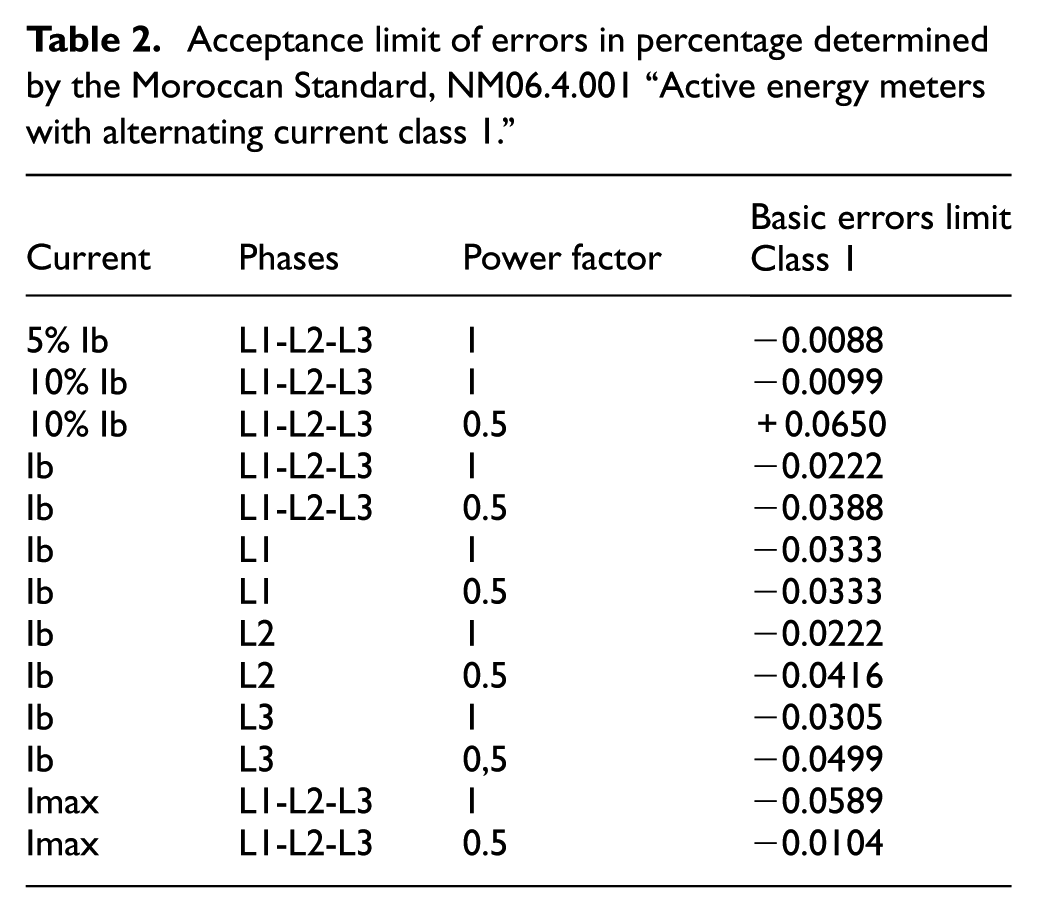
These constraints are important limits when it comes to the calibration and validation of SM. To be Class 1, any energy meter must adhere to these limits and yield an accurate measurement under a variety of conditions.
Table 3 presents the results of the calibration process for the three-phase measurement system, using the GP3050/3 current generator and the SM3050 reference meter in parallel to validate the performance of the three-phase measurement system over a range of currents (1–10 A) by taking measurements on each of the three phases (L1, L2, and L3) and comparing them against the current generator and the reference value from the SM3050. It can be seen from the SM3050 values that there was good agreement with the GP3050/3 generator and that all results are in relatively close agreement, with values never differing more than ±1%. The maximum error was −0.7000% at a measurement of 1.014 A. This phenomenon was anticipated in light of the increased uncertainty at low current readings. The SM3050 error values remain within an acceptable level, even over the larger current levels above 5 A, demonstrating the expected reliability of the SM3050 as a calibration reference. The measurement system under test additionally keeps up a good performance in phase-resolved current measurements. Most of the relative errors for the values lie within a band of ±0.05% of the reference value, especially for phases L2 and L3. In the case of phase L1, a significant positive deviation of +0.4663% was recorded at 8.029 A, which accounts for the greatest single-phase current error just among this particular experiment. Phase L3 had the lowest relative deviations with figures that were always between ±0.03% at all current levels. The system, as shown in the table, is also accurate and trustworthy at low current values. When current levels are 1.014 A, the errors for phases L1, L2, and L3 are +0.0217%, +0.0153%, and +0.0178%, respectively; all relative errors are quite a bit below the limit set for power quality applications.
Calibration results and error analysis of the smart energy meter.
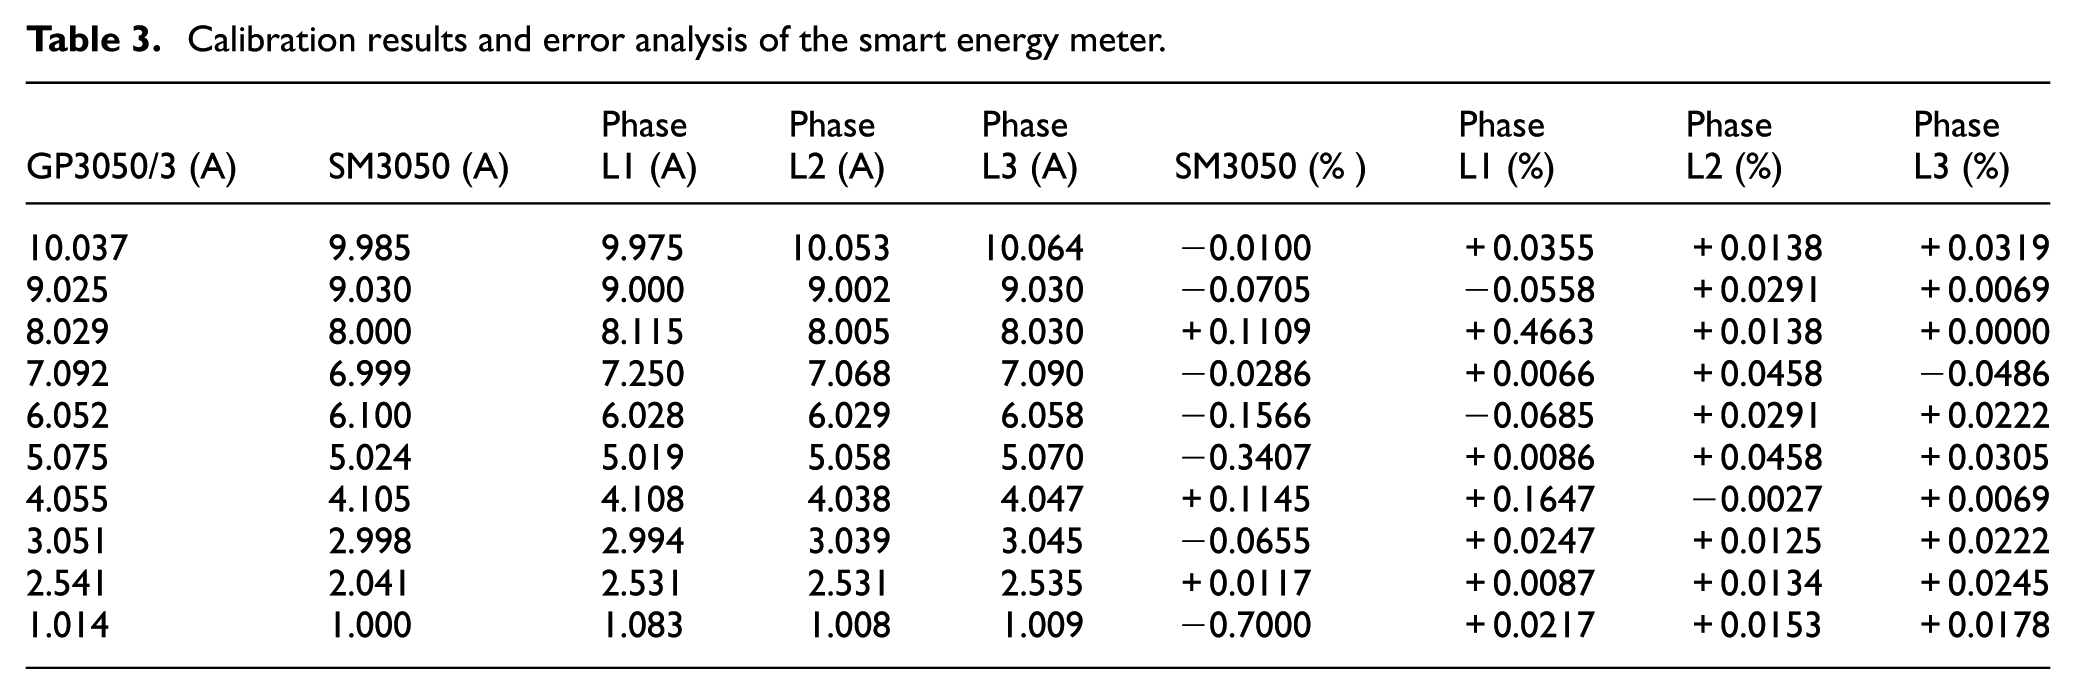
The measurements confirm that the proposed measurement system offers reliable and accurate performance across all three phases. Even at low intensities, the low error values indicate the robustness, stability, and correct calibration of the system. This performance, illustrated in Figure 15, makes this measurement system the ideal tool for SM applications that prioritize accuracy and reliability under variable current conditions.
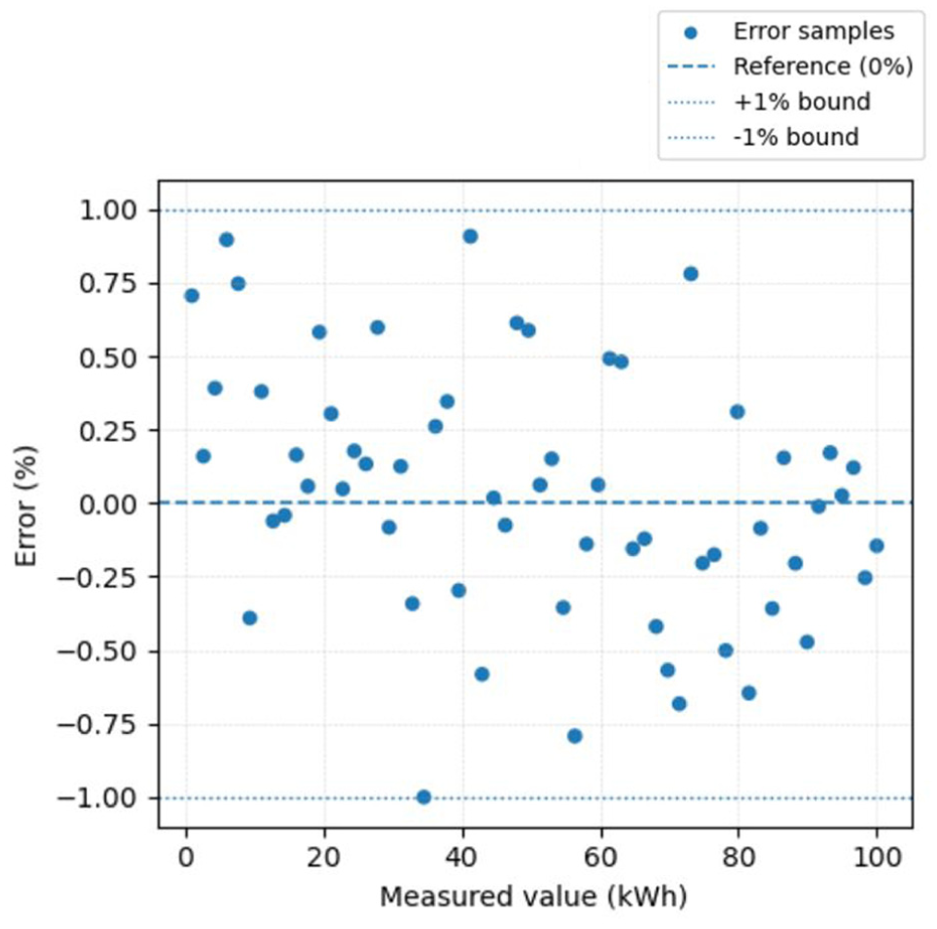
Measurement accuracy.
Voltage data performance
The chart below presents the voltage changes that were tracked by the SM over the 24 h of the monitoring time. In Figure 16(a), the three-phase voltages (A-B, B-C, and C-A) are almost the same throughout the day, that is, at around 400 V, while the single-phase voltages (A, B, and C) are kept at around 230 V. The non-existence of any notable fluctuation implies that the three-phase distribution system has been functioning in a stable and balanced manner during the whole day. Such firmness is necessary to both guarantee a stable power supply and prevent voltage disturbances in the connected devices. These findings are a clear indication of the SM’s performance capability in the continuous monitoring of line and phase voltages at a high level of precision, thus giving a concise network performance picture.
Figure 16(b) shows the voltages of the photovoltaic strings to have a customary daily profile, which is basically influenced by the solar irradiance. Following the sun’s rise, the voltages of the photovoltaic strings keep on increasing step by step to attain their peak values close to 600 V at around midday, from where they begin to decrease again toward sunset. The distance between the curves for the different strings is a small indication that the photovoltaic generator was operating under uniform conditions with only a few minor differences, which could have been caused by the incompatibility of the modules or the localization of the irradiance. These measures are used to confirm the performance of the photovoltaic system in the conversion of solar energy under variable sunlight conditions. The SM grid monitoring system (GMS) is thus validated through these detailed analyses to accurately reflect not only the steady state of the grid voltages but also the temporal evolution of the PV system in a very dynamic manner. This double monitoring functionality, in fact, constitutes the main leverage for the ongoing system utilization regarding the performance evaluation, the very first local fault detection, and the optimal grid and photovoltaic system operation.
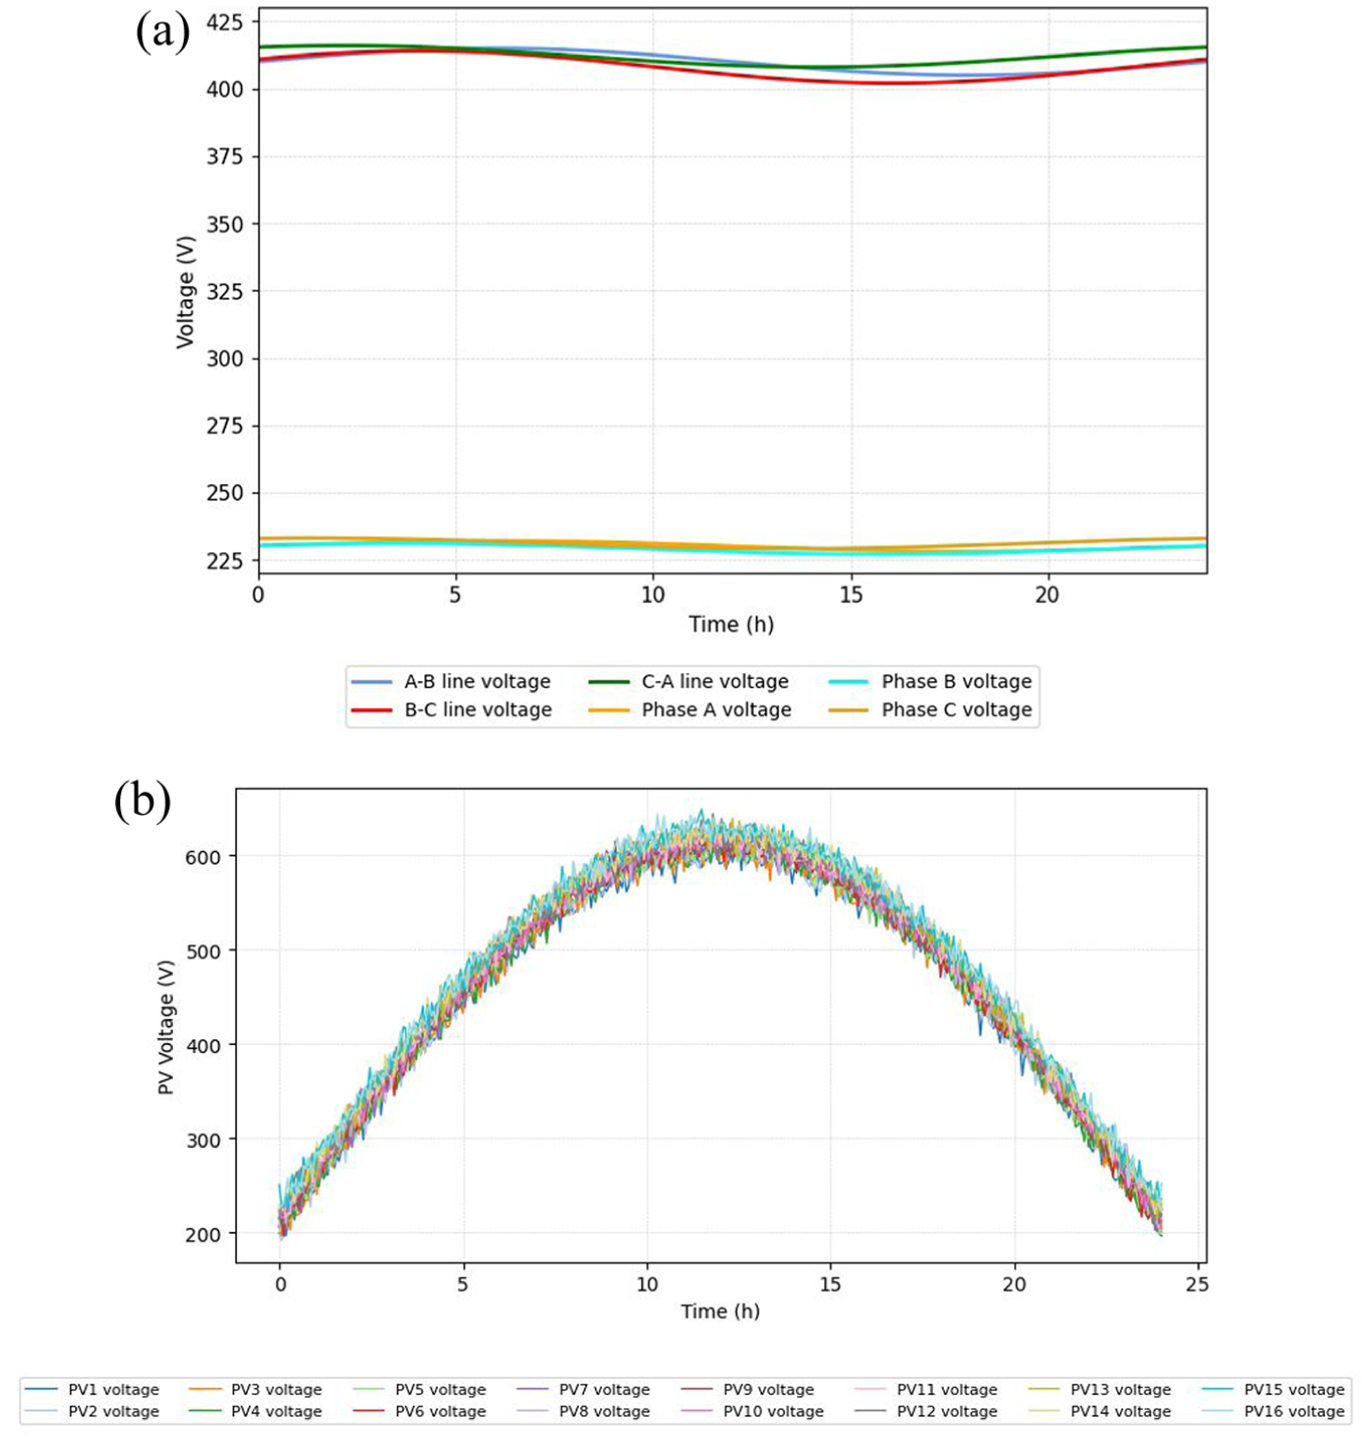
Voltage average over 24 h: (a) three-phase and single-phase grid voltages; (b) photovoltaic string voltages under varying solar irradiance.
Current data performance
Figure 17 shows how the current recorded by the SM changed during the 24 h of the observation period. The figure presents the phase currents on the grid side and the string currents on the photovoltaic side. The three phases (A, B, and C) currents had different courses during the day, as they varied from 10 to 80 A, which is shown in Figure 17(a). The difference between the phases indicates that the load distribution inside the system is not a perfectly symmetrical one. However, despite these changes, the SM manages to follow the dynamic performance of each phase, thus it is possible to have a continuous control of load conditions and the early detection of phase imbalance or overload.
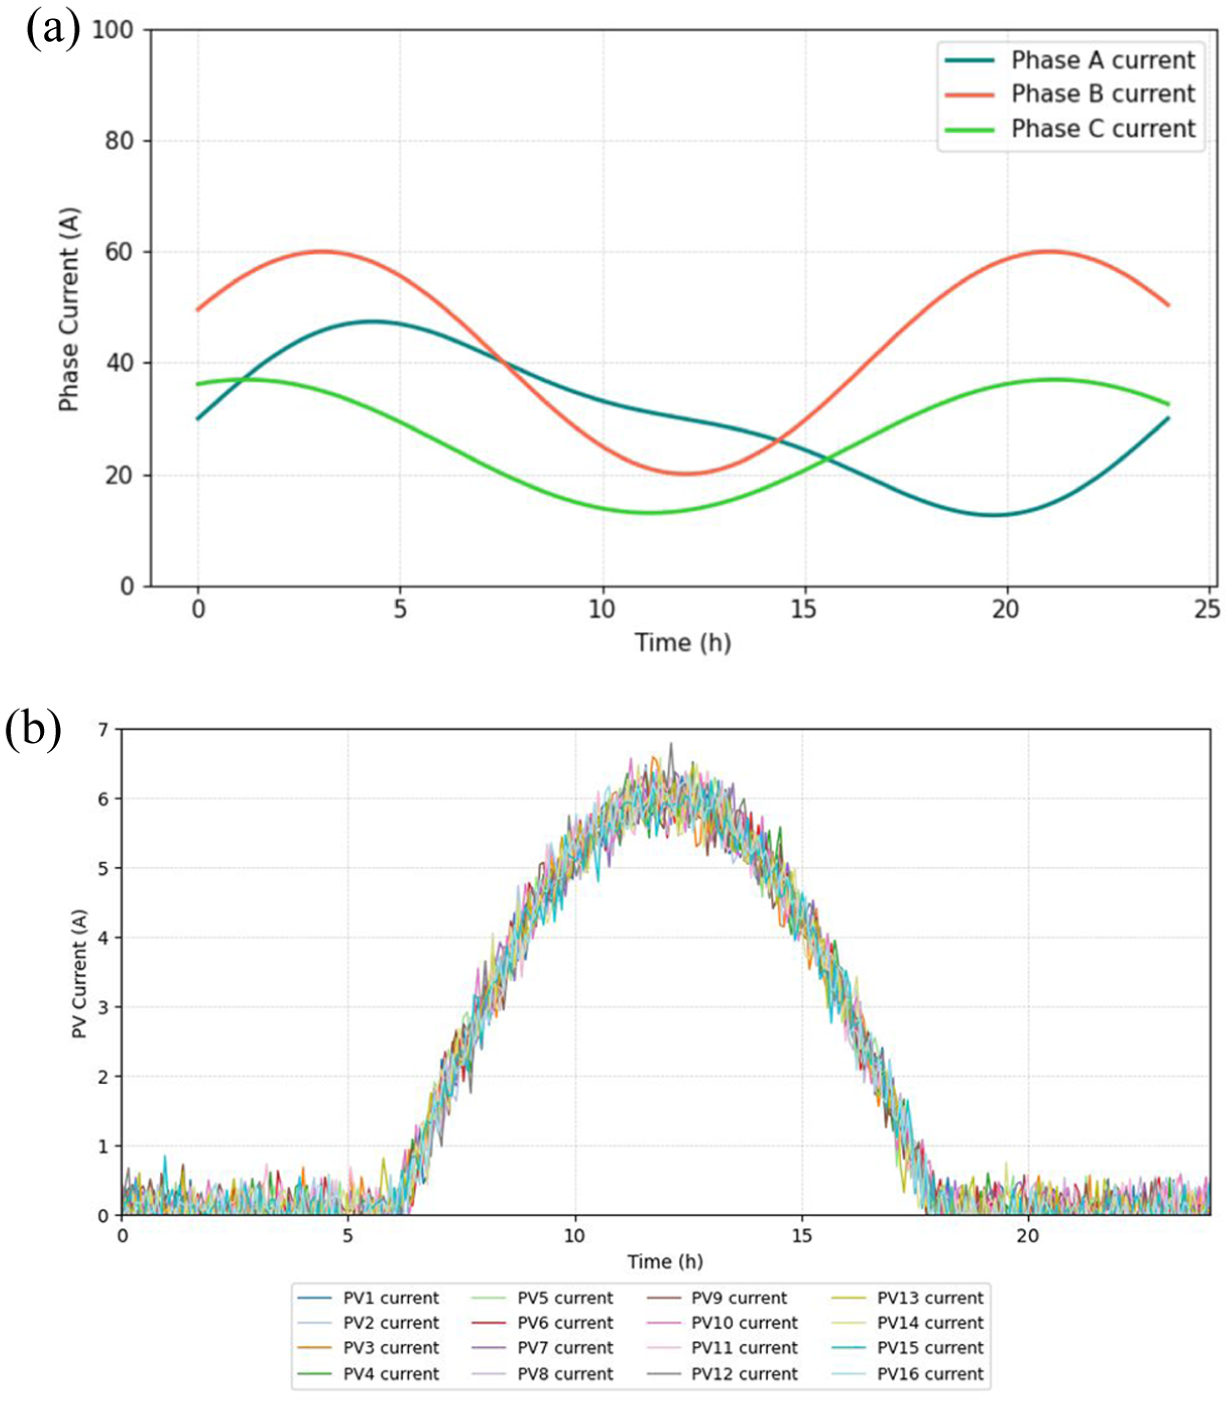
Variation of current depending on time: (a) three-phase grid currents (A, B, and C) over the day and (b) photovoltaic string currents following the daily solar generation profile.
In Figure 17(b), it is evidenced that the photovoltaic string currents follow a characteristic daily solar profile. The currents start from zero at sunrise and progressively go up to a peak of about 6 A at midday and then decrease again until sunset. The current curves of the 16 photovoltaic strings are almost identical; thus, it can be inferred that there is substantial homogeneity between the photovoltaic generators and the operating conditions are stable. The minor differences can be explained by natural causes such as partial shading or temperature differences, but these differences are still very small in terms of the overall performance of the system. These findings serve as proof that the SM is very effective in providing highly accurate monitoring of grid currents and photovoltaic generation currents. The device, by recording the variability of phase currents and the regularity of photovoltaic string behavior, is an important source of information for performance evaluation, fault detection, and the optimization of energy flows within the system.
Hours profile import-export and active-reactive power average
Figure 18 shows the real-time performance of the active power flow from the SM, which makes the distinction between importing power (blue curve) versus exporting power (red curve). The system initially acts in import mode, where the amount of power imported remains fairly constant at 6 kW. As we see at approximately 18:30, there is a sharp transition that is taking place, as the system goes from importing energy and starts to exporting energy back to the grid. This is easily recognized by how the blue curve intersects with the red curve, and is additionally revealed in the zoomed inset. The export interval slowly declines from 6 to 4 kW, before stopping just after 20:00. The system is idle until another import interval begins just before 06:00 the next day, again sharply detected by the meter while the curves are inversely symmetrical.
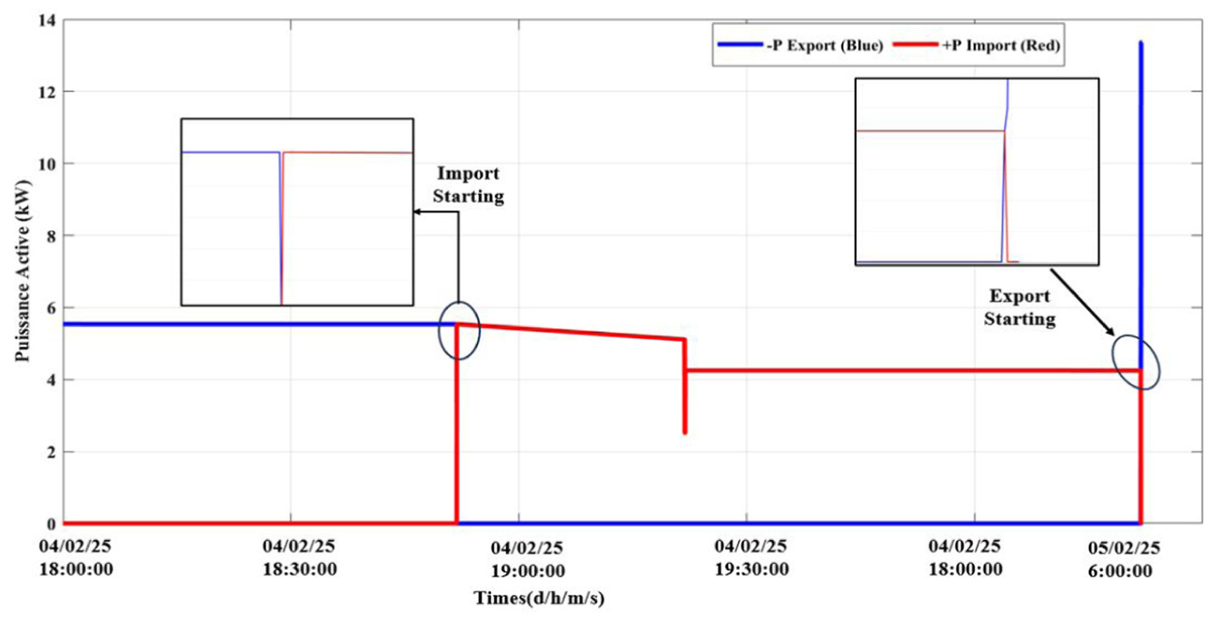
Active power demand in import and export.
This transition from import to export illustrates how the SM can detect and log bi-directional power flows with a high temporal resolution. The distinguishing clarity and accuracy of these switching points demonstrate how robust the measurement architecture is in relating an SM to the dynamic energetic environment of prosumer-based smart grids.
Figure 19 illustrates the daily changes in active and reactive power recorded by the SM. Typical active power is changing most of the time between 10 and 35 kW. The pattern shows that it first elevates during the early hours, then after a short decrease around noon, it remains stable at lower values throughout the afternoon. On the other hand, the reactive power experiences significant fluctuations in most cases; during the early to mid-afternoon, it rises to about 40 kVAr and then gradually decreases until the evening. The fact that the amplitude of the reactive power fluctuations is larger than that of the active power emphasizes the necessity of compensation for a clean power supply to be able to use most of the power both at production and consumption peaks.
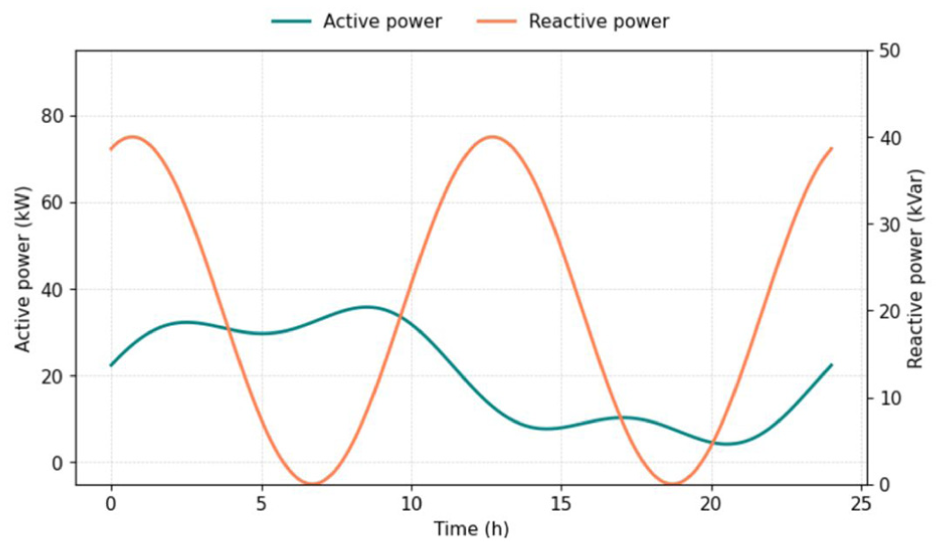
Active and reactive power average.
Power factor
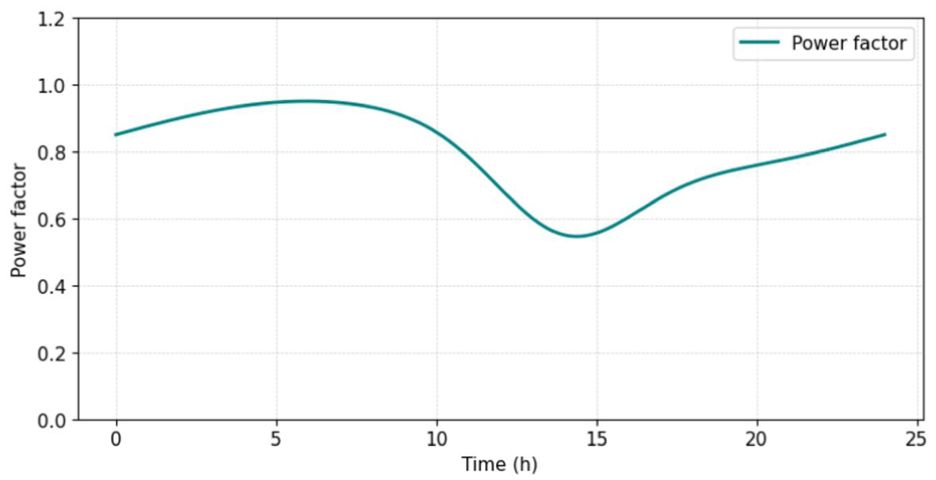
The evolution of the power factor measured by the SM throughout a day of operation is depicted in Figure 19. The initial value is approximately 0.85, which increases slightly to a peak of around 0.95 during the first few hours. Following this peak, the power factor gradually declines, reaching a low of about 0.55 around 2 p.m. This decline indicates a significant imbalance between active and reactive power. After this drop, the power factor gradually recovers, stabilizing again at roughly 0.85 by the end of the day (Figure 20).
Power factor variation.
The observed variation is primarily linked to load fluctuations and the intermittency of renewable energy production, especially when PV generation is most prevalent during midday. These measurements, obtained from the developed SM, validate its capability to monitor changes in power quality indicators in real time.
Phase-resolved harmonic analysis: Smart meter versus GP3050/3 reference
The spectral analysis of the three-phase currents was intended to understand the current waveforms from their harmonic content. This section summarizes the measurement of the Total Harmonic Distortion and the harmonic components for each of the three-phase currents. An IPS4050 from ITRON was used for the spectral analysis so that the harmonic spectrum could be accurately captured, and the high-resolution ITRON logger kept a record of the harmonic analysis. The measurements were completed on the outputs of the SM’s three phases and on the output of the GP3050/3 reference signal generator that was feeding the meter. The reference signal allows for a measurement of the harmonic signatures between the SM and a certified reference source, and the potential for independently assessing the harmonic measurement accuracy of the SM from a known base.
Figure 21 reveals excellent correspondence between the reference signal and the SM reported. The THD of the reference signal was 99.8% and the SM reported a THD value compared to the reference signal of 93.6% for Ia, 89.7% for Ib, and 90.1% for Ic. The various THD values indicate the meter can accurately report harmonic distortion with an acceptable error (<10%) of a certified generator. Additionally, the SM was able to report the prominent low-order harmonics third, fifth, seventh, and ninth. The harmonic spectral profiles of the harmonics as per the SM were close to the reference figures. The phase change of the three phases was in agreement, with the only differences in the amplitudes of the fifth and seventh harmonics, which showed a reliable uniformity of the inter-phase. Beyond the 25th order, the spectral amplitudes of all the signals were the same, which was a clear demonstration of the instrument’s ability to record the components of the higher-order harmonics accurately, even if their energy contribution was low.
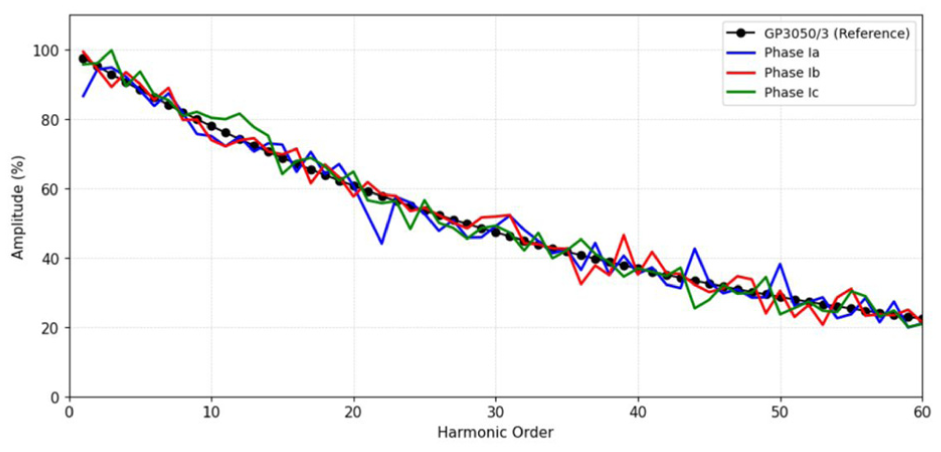
Comparison of Harmonic Spectra: GP3050/3 versus smart meter phases.
Robustness of smart meter against thermal stress
The efficiency of the SM with limited heat is illustrated in Figure 22, which displays the variations of the internal temperature of the enclosure together with the network frequency during a test day. Normal mode (<36°C) is characterized by uniform temperature distribution without significant hot spots; thus, it can be concluded that the working conditions are safe. In alert mode (36°C–40°C), there are heating zones in the local areas that require more frequent checking and preventive measures to avoid performance decrease. Danger mode (>40°C) shows the areas where the device is overheating to the point where it is going beyond the safety temperature thresholds, giving rise to a high risk of component failure and thus the necessity of taking immediate protective measures such as disconnecting the relay.
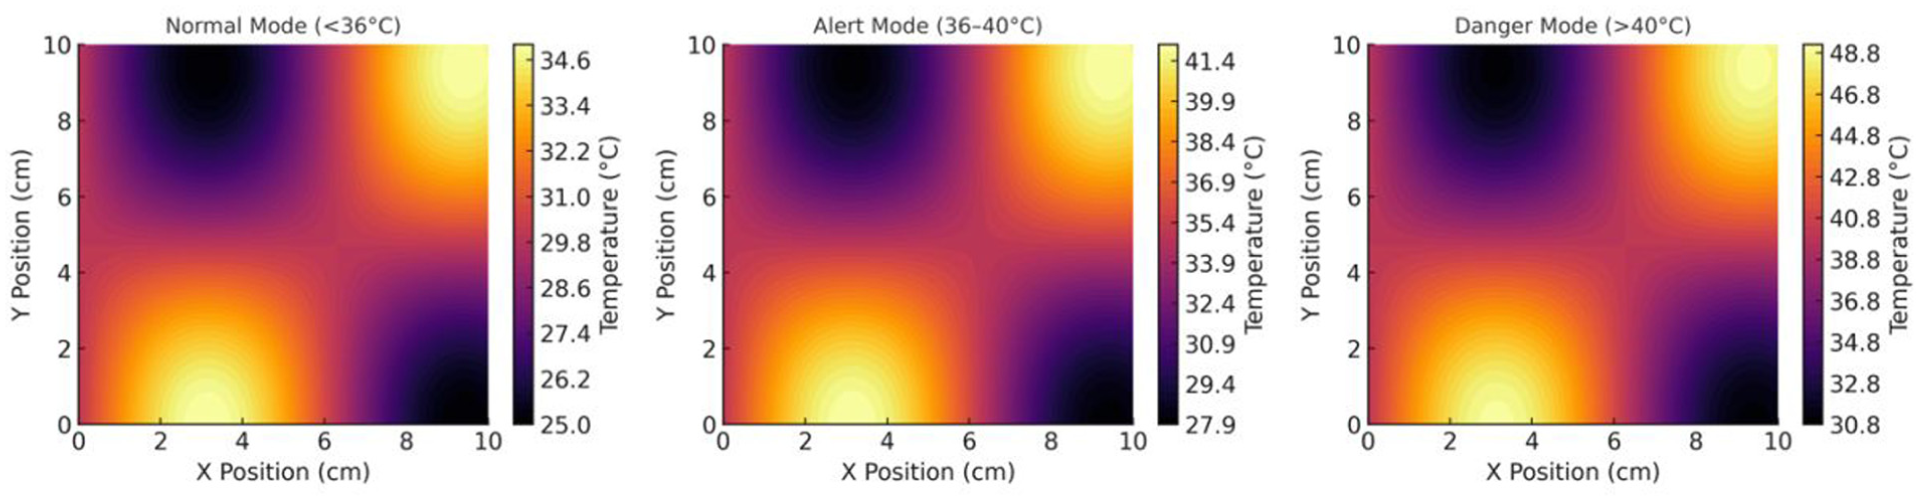
Comparative thermographic maps of the smart meter under three operating conditions.
Theses findings confirm the ability of SM to operate in a stable and reliable manner even under very hot or cold conditions. The stable measurement precision and the stable frequency over time are clear signs that the instrument is tough enough to be exposed to harsh surroundings. As a result, it is a perfect demonstration of the device being a viable candidate for deployment in actual energy systems, where stability is essential not only for the performance but also for the longevity.
Comparative analysis with other studies
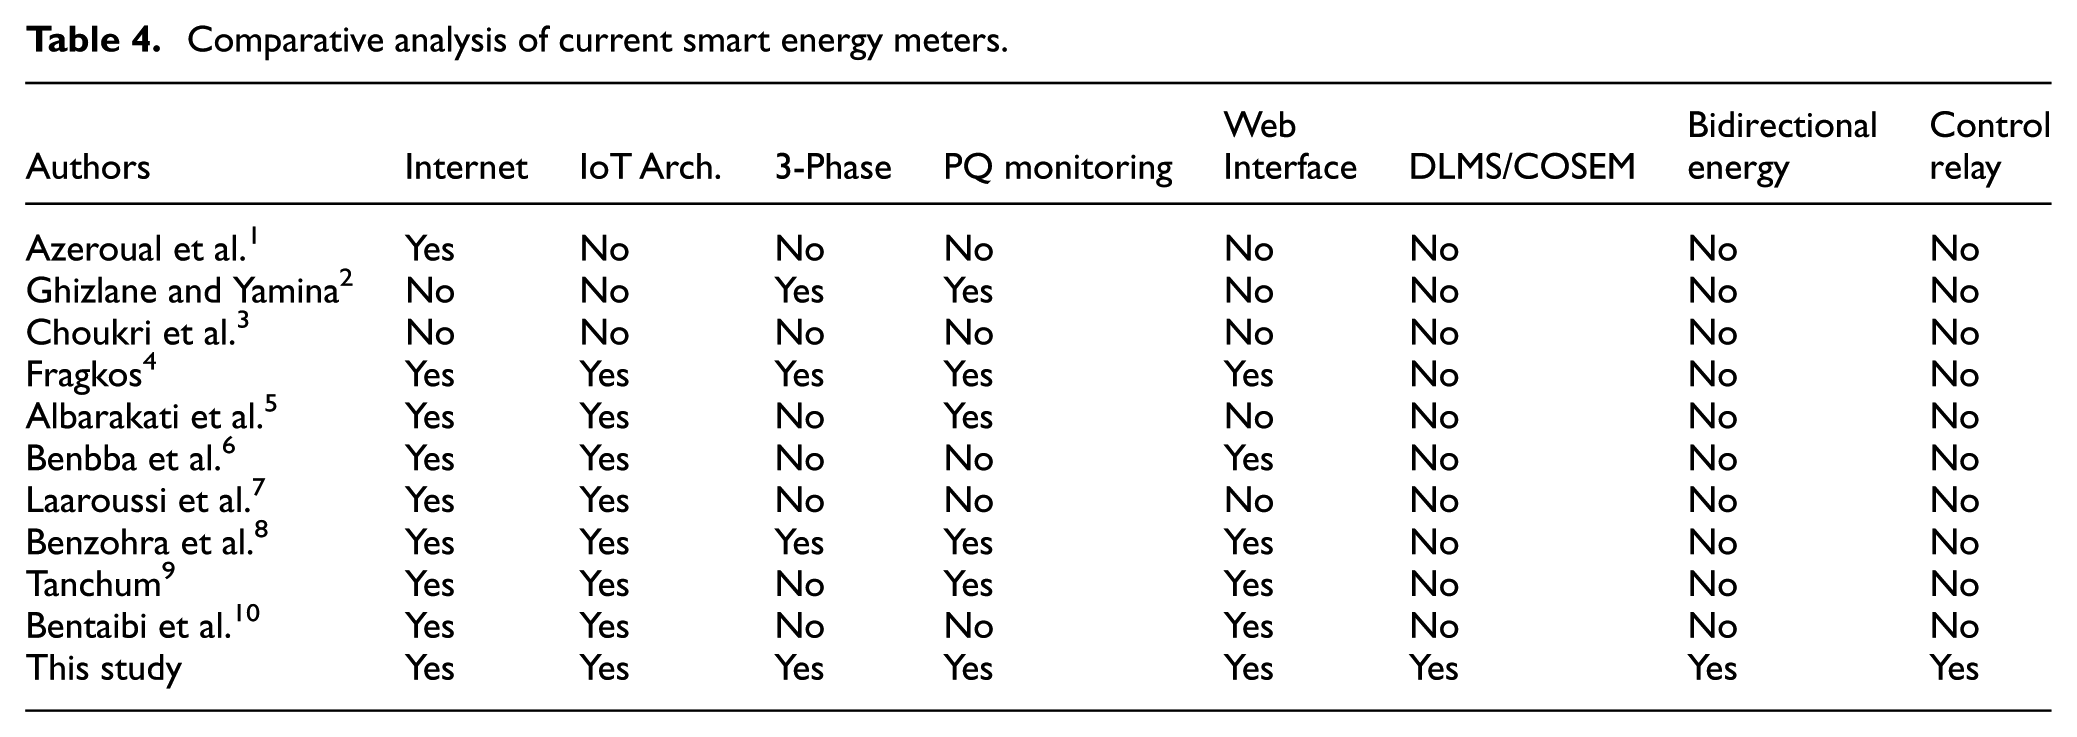
Table 4 provides the details of the previous literature concerning SMs and the system that we have designed for this research work. We took a few relevant parameters to compare the development and the worth of our proposed system. The parameters were whether they used an internet connection to facilitate remote communication, whether they used a simple IoT architecture without an external gateway, and whether they could measure energy in three-phase systems. We then proceeded to consider other parameters, such as whether they used power quality monitoring capabilities, whether they developed a web interface for visually displaying real-time measurements, and whether they conducted experimental validation. Additionally, we included various security mechanisms, such as the DLMS/COSEM protocol that allows secure communications, energy flow monitoring that is bidirectional, and the full integration of a control relay for smart load management and fraud detection in the newly developed SM. The SM for energy that is being suggested has several extra features that can become uniquely valuable when used in a more extensive system, which can be of greater help to the modern energy infrastructure.
Comparative analysis of current smart energy meters.
Discussion
This research puts forward an innovative SM system that concertedly comprises all essential components of future energy infrastructures. As evidenced by the comparison in Table 4, this invention overtakes other systems by a large margin in terms of coverage of functionalities. It stands as a single solution capable of providing simultaneous Internet connectivity, IoT architecture, compatibility with three-phase networks, a power quality monitoring system, a web interface, DLMS/COSEM protocol support, bidirectional energy management, and an integrated control relay. None of the other references support the DLMS/COSEM protocol; hence, this paper is a major contribution toward easier interaction and conformity with global standards. Such compatibility makes it possible to link with present and upcoming energy management systems while also ensuring that all parties in the network communicate securely and in a standard way. Furthermore, the bidirectional energy support is very relevant to the energy transition trend and the rise of prosumers, that is, users capable of producing and consuming energy in a dynamic way. From a technological viewpoint, the addition of a control relay allows the meter to be the one that directly handles the electrical loads, thus making demand-side management scenarios not only feasible but also vital for the stability of smart grids. Moreover, the presence of a web interface is another point that should not be overlooked, as it makes real-time data visualization very easy; therefore, the user experience is to a great extent improved, and that changes decision-making becomes more comfortable.
This revelation has quite a few important implications for public policy. First of all, it would be vital to actively promote the deployment of open standards such as DLMS/COSEM to facilitate device communication from different manufacturers. Secondly, the agents responsible for energy policy should consider these technologies as a topical issue leading the way to smart grid implementation and achieving carbon neutrality goals. Thirdly, the improved interconnection of meters makes them vulnerable to cybersecurity and data protection problems; hence, stringent regulatory frameworks should be established to address this risk. Finally, to ensure the proper implementation of these technologies, there are certain steps, like subsidies and specially designed financing mechanisms, that should be available, especially in the case of remote areas or low-income groups.
This study not only reveals the inventiveness that is possible in the field of SM but also indicates the policy and regulatory changes that would be necessary to ensure that there is a widespread, equitable, and secure uptake of the technology.
Conclusion
This study developed and verified through experiments a multifunctional SM that meets the requirements of advanced smart grid applications. To enable smooth interoperability, it employs an IoT-compatible architecture and the DLMS/COSEM protocol. The proposed system performs excellently in three-phase bidirectional energy measurement (import/export), real-time monitoring via a user-friendly web interface, and active load management by means of an on-board relay, as well as other features like food quality monitoring. Such performance makes it stand out as the only one among the 10 latest designs being able to integrate all eight essential characteristics. Experimental tests were done in actual environments, measuring against a certified SM3050 reference meter with the use of a GP3050/3 power generator. The tests verified very high accuracy, with the errors varying from 0.08% to 0.37% for voltage, current, power, and power factor, respectively, and all being within the strict −1% to +1% tolerance limits. Moreover, the system showed a short response time (around 700 ms) and good thermal stability under different scenarios. The import/export case study that featured 51% solar energy and 49% grid energy demonstrated a viable method for prosumers to localize optimization, detect fraud, and economically valorize self-generated energy. The findings are evidence of the technology’s potential to be scaled up, its cybersecurity compliance, and its suitability for a decentralized, decarbonized microgrid as well as future smart buildings.
The next steps will involve the implementation of a self-calibration feature to facilitate mass production and research on data privacy, user-centric security, and AI-based non-intrusive load monitoring. The programs mentioned make the adoption process easier and create new opportunities for energy efficiency and user behavior analytics.
Footnotes
Ethical considerations
This study did not involve human participants, animals, or sensitive personal data. Therefore, no ethical approval was required. The research complies with all relevant institutional and national guidelines for the ethical conduct of research.
Consent to participate
Not applicable. The study did not involve human participants requiring consent.
Consent for publication
All authors have read and approved the final version of the manuscript and consent to its publication in Measurement and Control.
Funding
The authors disclosed receipt of the following financial support for the research, authorship, and/or publication of this article: This research received no specific grant from any funding agency in the public, commercial, or not-for-profit sectors. The work was supported by internal resources of the Faculty of Sciences and Techniques of Fès, Morocco.
Declaration of conflicting interests
The authors declared no potential conflicts of interest with respect to the research, authorship, and/or publication of this article.
Data availability statement
The datasets generated and analyzed during the current study are available from the corresponding author on reasonable request. All experimental data, design files, and performance records are archived in the Faculty of Sciences and Techniques of Fès internal research repository and can be shared for academic and non-commercial purposes.