
Abstract
Aiming at the problem of tunnel settlement monitoring in complex construction environments, a visual tunnel settlement monitoring system is developed. Due to the poor lighting conditions inside the tunnel, direct measurement of the tunnel’s surrounding rock settlement was challenging. It was necessary to install targets at the monitoring points to indirectly reflect the surrounding rock settlement through the displacement of these targets. Consequently, a self-luminous hanging target specifically designed for engineering tunnels was developed. As the main feature, the two-digit digital tube of the target, became a prerequisite for realizing the tunnel surrounding rock detection targets. Then, a high-precision industrial camera is utilized to collect target images, and then a tunnel target dataset is constructed. Additionally, the improved RT-DETR target detection model is proposed for target recognition. To further increase the model’s ability to capture target features, the EfficientVit is introduced as the backbone network, the attention mechanism ECA-Net is added, and the loss function is improved to SIoU loss to enhance the model’s application efficiency in the industrialized direction. The target displacement is calculated by the ratio between the image pixel value and the measured value, which indirectly reflects the settlement of the tunnel. Finally, the interactive visual interface of the tunnel settlement monitoring platform is also developed to further display various information in the monitoring process. The measurement error of the proposed method was evaluated in a controlled laboratory environment. Within a tunnel viewing distance of 25 m, the relative error was found to be less than 8.7%. A small-scale comparison with total station measurements was conducted, demonstrating that the proposed algorithm meets the accuracy requirements for practical engineering applications.
Introduction
In recent years, underground space resources have been continuously developed, and the number of new highway tunnel projects has increased year by year. Subsequently, the settlement monitoring of surrounding rock during tunnel construction has become a more difficult task, which has a direct impact on the development of the transportation field and social economic construction. The problems of the tunnel support system in the construction process may change the underground space structure, which will lead to a series of chain events, such as a large number of ground bodies or tunneling flooding in, excessive settlement or collapse of nearby ground, construction casualties, and serious delay in project delivery. 1
The tunnel interior is mostly a narrow linear underground structure, with a large number of monitoring points, high monitoring frequency, and a very large amount of data obtained by monitoring. In order to achieve fully automatic monitoring of tunnel settlement, reducing measurement errors and improving safety, various monitoring and measurement techniques are being explored and applied. Evidently, different monitoring methods have advantages and disadvantages in different kinds of condition environments. Most of the traditional tunnel-surrounding rock monitoring methods rely on manual way, which need a lot of manpower and financial resources. Moreover, monitoring on the tunnel construction site will cause harm to the personal safety of personnel. In this study, we refer to the tunnel surrounding rock settlement measurement method based on non-machine learning technology as the traditional tunnel settlement monitoring method.
Traditional method
As a kind of traditional precision measuring instrument, the total station is widely used in the field of fine measurement for large above-ground buildings and deformation monitoring of underground roadway construction. The total station method with relatively mature theory and technology is the non-contact method, which is rapidly realized. The total station method provides the necessary monitoring hardware equipment for the development of tunnel settlement measurement. 2 Luo et al. applied the total station three-dimensional coordinate remote distance measurement (RDM) to measure the tunnel and analyze the measurement accuracy for the crown settlement and wall convergence of tunnel. 3 Zhou et al. established a robotic total station system to automatically monitor the displacement of the subway tunnel, and conducted field verification of the monitoring system in Guangzhou Metro Line 2. 4 However, the tunnels under construction are often accompanied by dust flying and insufficient underground lighting conditions, so the accurate non-contact measurement of the total station has higher environmental requirements, and more specific engineering objectives need to be selected to achieve. 5 There are many monitoring methods and techniques for tunnel displacement. In order to verify the accuracy of monitoring deformation, the results of the new method are often compared with the calculation results of the total station.
The distributed optical fiber sensing technology has the advantages of small volume and small environmental impact in tunnel monitoring methods. The optical fiber can be attached to the surface of the excavated rock mass to be monitored to detect and transmit information. Hong et al. studied the application of Brillouin-based distributed sensors in health monitoring, 6 and Sui et al. proposed a distributed optical fiber monitoring scheme for double-arch tunnels. 7 The distributed fiber optic sensor monitoring technology also needs professionals to process and analyze the data after acquiring the data, which cannot provide real-time feedback of settlement information for the large section monitoring of the tunnel being excavated.
3D laser scanners can provide 3D point cloud data in the captured information of reflected light from the surface of objects, but there are also problems of point cloud registration and data processing. 8 3D laser scanners are often very sensitive to the laser reflected from the surface of the scanned object. Besides the real measured values, some abnormal measured values will appear in the formed point cloud data, and the existence of these abnormal values will also complicate the analysis process. 9 Xu et al. combined photogrammetry and three-dimensional laser scanning technology to monitor tunnel deformation. This new method makes tunnel deformation monitoring more intelligent. 10
Machine learning
Due to the continuous development and updating of technology, machine learning has entered the public’s field of view. Various machine learning models optimized and tested by scholars have also been widely used in the field of geotechnical engineering. Machine learning is divided into supervised learning and unsupervised learning. In terms of tunnel settlement, supervised learning is mainly applied. The trained machine learning model is used to further process the collected tunnel monitoring data and predict the deformation of surrounding rock that may occur in the tunnel construction process. The prediction based on machine learning is characterized by its safety and efficiency, and can better guide the tunnel construction site according to the deformation prediction made by the machine learning model.
Artificial neural network plays a significant role in machine learning. Artificial neural networks are regarded as a new method to solve tunnel engineering problems in the era of big data. There are many factors affecting tunnel deformation during tunnel construction, and the relationship between parameters and settlement is unknown and nonlinear, the settlement is further predicted by dealing with unknown nonlinear problems with a large number of parameters. 11 Mahdevari and Torabi developed a tunnel deformation convergence prediction method based on artificial neural networks, MVR, RBF and MLP were used to predict tunnel convergence, and the predicted value of the model proposed by multi-layer perceptron (MLP) was closer to the measured value. 12 Chen et al. used the ability of BP, RBF and GRNN to predict the ground settlement caused by the earth pressure balance shield, and compared the feasibility of the three artificial neural network methods. Among them, the GRNN algorithm showed the best performance. 13 With the continuous development of artificial intelligence, more swarm intelligence optimization algorithms have been applied to improve artificial neural networks, such as genetic algorithm 14 (GA), particle swarm optimization algorithm 15 (PSO) and artificial bee swarm Random forest 16 (IABC-RF). They can speed up network convergence and make it easier for the network to find global minima. Wang et al. 17 used deep learning methods to predict the surface settlement caused by shield tunneling. The convenience and accurate prediction of artificial intelligence are of great significance for solving engineering problems.
It takes a lot of time and human resources to use methods of artificial intelligence to predict the settlement of shield tunnels. Sometimes, the model needs to learn geological conditions and obtain more reliable settlement measurement data. 11 Reference 18 points out that the construction tunneling parameters of shield tunneling method will also have a certain impact on the ground settlement. This means that relevant methods using machine learning require extensive data analysis to verify the reliability of their predictions. For a tunnel under construction, people often want to be able to provide real-time subsidence information rather than using models to predict it. This will make the construction efficiency significantly reduced, safety is also difficult to be guaranteed. Computer vision is a branch of machine learning that uses captured images and video to solve this problem.
Computer vision
As a key artificial intelligence technology, computer vision is being integrated into a powerful tool for big data analysis and is widely used in the digital transformation of underground buildings. 19 Computer vision is a visual process of restoring three-dimensional shape information from two-dimensional shape information of the target scene to the original scene. Its calibration process is complicated, and it is greatly affected by the unavoidable harsh environment such as tunnel construction. Computer vision can be used for automated and continuous monitoring of construction sites. Computer vision can provide rich information about the construction scene by shooting images or videos, and is applied to the field of construction safety related to on-site images and video information. 20
Chen et al. studied a settlement instrument based on computer vision, used computer vision technology to detect the relative image changes of the settlement of moving points on the designed chessboard, and then calculated the settlement value of the tunnel, which developed a long-term settlement monitoring based on the Internet of things. 21 Ye et al. applied the method of computer vision to the in-situ monitoring of the deformation of ancient towers caused by tunnel construction, and studied the influence of environmental factors, especially temperature factors, on the slight changes in camera position. 22 The field monitoring method of tunnel deformation based on computer vision is based on the image captured by the camera for subsequent analysis. When applied in the case of good environmental conditions, little vibration and good lighting, the field monitoring results are obviously more reliable. 23 From a long-term perspective, although the advantages of computer vision-based monitoring technology are obvious, long-term and stable on-site monitoring is still an important aspect that needs to be invested in more research for tunnel construction parties who expect low-cost monitoring methods and small environmental impact.
Contribution
According to the description of the above methods, there are still some problems with the current monitoring methods of tunnel surrounding rock. Therefore, the study of an efficient measurement method that can remotely monitor changes in the surrounding rock in real time is crucial for tunnel monitoring from the engineering perspective. By assembling the industrial cameras, industrial control machine and targets, the hardware equipment of the tunnel settlement monitoring and measuring system is established. On the whole, a real-time monitoring platform for the tunnel settlement is developed, which integrates a target capture and recognition function module, a settlement curve observation module, and a settlement parameter viewing module. The main contributions of this paper are as follows:
(1) Hardware devices such as the computers, two industrial cameras, several targets, and the wireless bridges are integrated to establish a measurement system in the tunnel to monitor the surrounding rock settlement in real time.
(2) The modified RT-DETR model is proposed for the target detection. The Transformer-based encoder, decoder, and feedforward network (FFN) are crucial innovations that enable end-to-end object detection and streamline the network. Modifying the backbone network to EfficientVit improves the multi-scale feature extraction capability of the backbone network while reducing the network parameters. Besides, the attention mechanism ECA-Net is added to the backbone network. In general, the channel weight vector is further obtained by one-dimensional convolution to avoid the channel dimension reduction operation. Additionally, the loss function of the network is modified to the SIoU loss function, which improves the detection efficiency of the model.
(3) A tunnel hanging target suitable for industrial use was designed and implemented. The dataset of tunnel perimeter rock targets has been established for nine types of targets including light points and target center numbers: 11, 12, 13, 21, 22, 23, 24 and 25. The size of the self-constructed dataset is
(4) The calculation of the target displacement value is realized by the proposed pixel ranging algorithm, which is specifically designed based on the ratio between the image pixels and the real distance. The displacement value of the target indirectly reflects the settlement value of the tunnel to be monitored.
(5) Developed software for the platform that can transmit settlement data between the server and the client through a wireless bridge and database. Another key, the monitoring result information is displayed in the client interface.
Engineering background
The automatic system for monitoring the settlement and the deformation of the tunnel envelope proposed in this paper consists of two parts, which are the server side and the client interface, as shown in Figure 1.
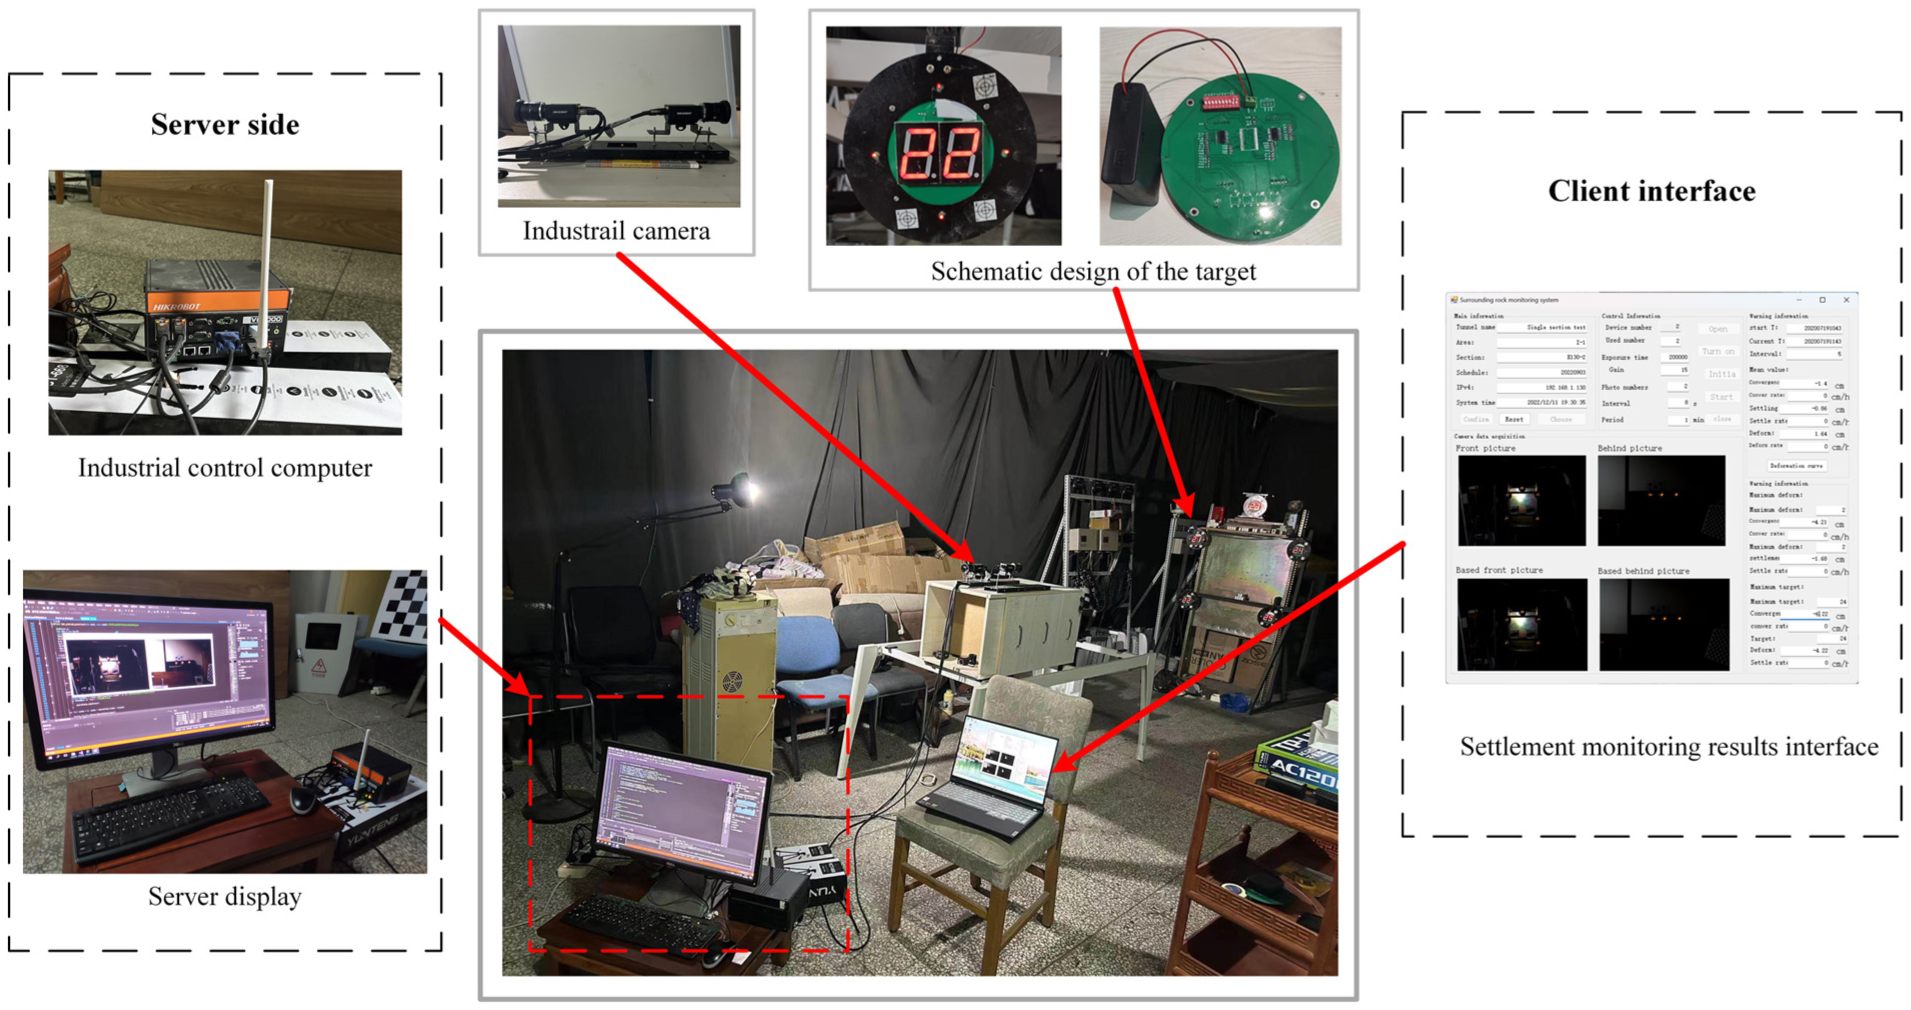
Settlement measurement of simulated tunnel surrounding rock in laboratory environment.
The required hardware equipment includes the industrial cameras, the industrial computer, and a number of designed targets. On the server side, the industrial camera captures the target image. At the same time, the images to be processed are captured and transmitted to the database in the industrial computer. The images’ feature points are recognized by the trained target detection model. Additionally, the settlement values are calculated and saved in the database simultaneously. The purpose of the database is to transmit information such as data and images. The connection between the server and the client is realized through wireless communication. Roughly speaking, the client can visualize the settlement monitoring results and display the monitoring results.
It is difficult to directly monitor the settlement value of the surrounding rock in tunnels under construction. For this reason, an indirect approach is adopted to measure the settlement value of the surrounding rock. The designed target is installed on the surrounding rock, equally important, the monitoring of the surrounding rock settlement is realized by detecting the settlement value of the target.
In view of the engineering background environment, the dusty construction state, the environment of the dark light and other characteristics, the design of the light-emitting target mainly consists of microcontroller, a digital tube, a target disk and other components, it is powered by two AA batteries.
Deployment of the industrial camera and targets
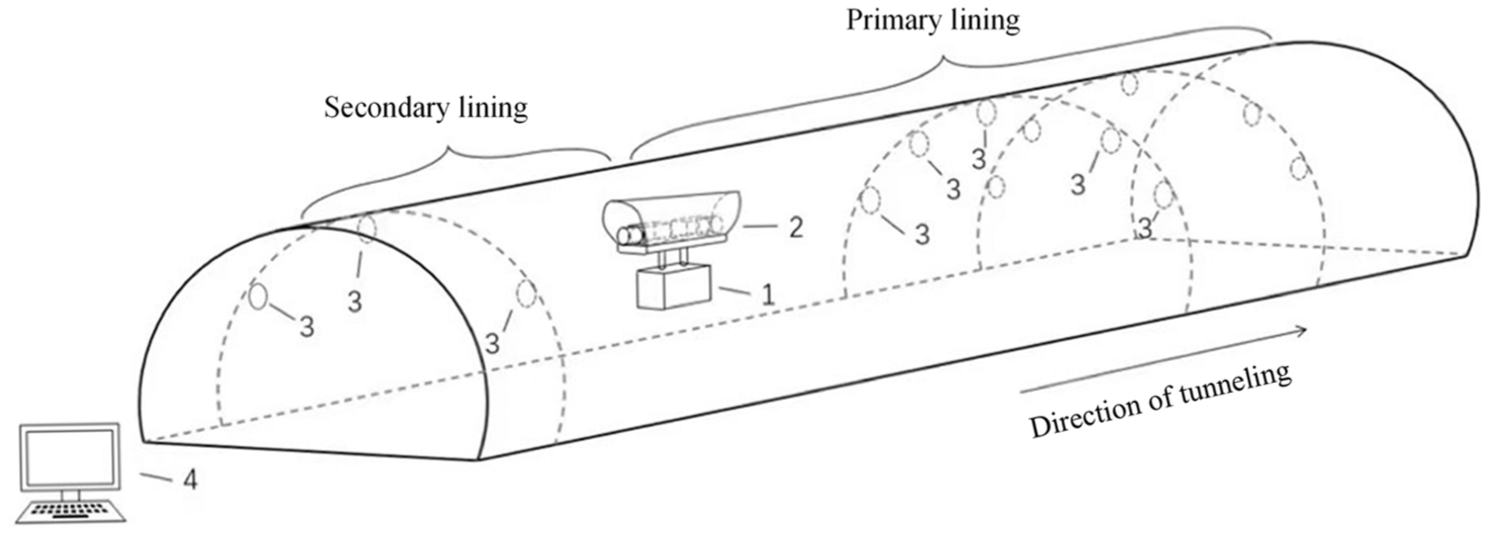
In order to ensure the safety of tunnel construction operations, the tunnel rock settlement monitoring system is used for high-precision deformation measurement of observation points in complex construction environments. As shown in Figure 2, the arrow direction is the construction heading direction, and the tunnel is divided into primary and secondary lining stages.
Interior view of the construction tunnel.
The industrial camera is deployed in the relatively stable secondary lining area of the construction site, and the target point is correspondingly set on the cross-section of the primary lining area of the tunnel. To prevent the impact of vibration and dust on target imaging during tunnel construction, a vibration isolation test platform equipped with a dustproof cover was used to protect the camera. To illustrate, a total of eight observation points are fixed at the tunnel section. Specifically, three settlement observation points are located at the arch roof, two convergence observation points are set at the arch waist, and three reference control points are positioned behind the secondary lining area.
Monitoring dataset construction
Monitoring images of the tunnel settlement were acquired by a Hikvision industrial camera (MV-CS200-10GC). Some images of the dataset show the laboratory environment as well as the camera shots inside the tunnel, as shown in Figure 3. The tunnel surrounding rock target dataset is divided into the data collected in the laboratory environment and the images taken at the tunnel construction site. With an initial pixel size of
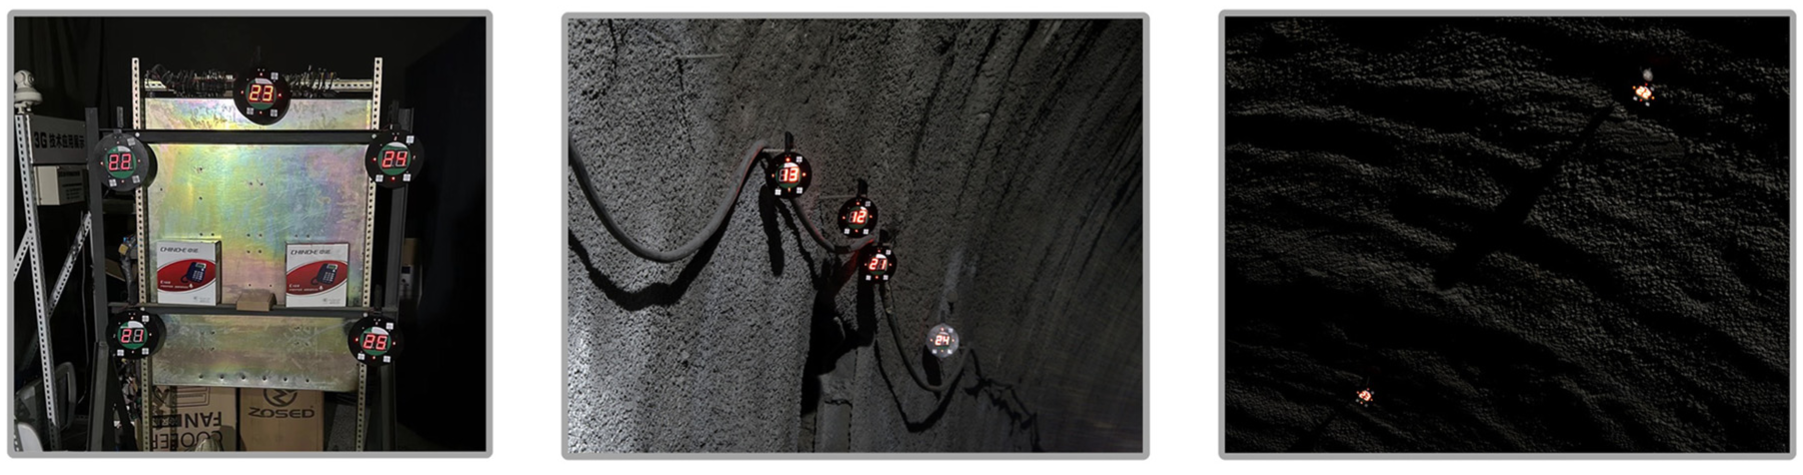
Example graphs of some datasets: (a) lab environmental targets, (b) tunnel sidewall targets and (c) top of the tunnel arch.
On the one hand, the laboratory uniformly adopts low illumination in order to simulate the tunnel environment in real scenes. The background color of the images in the laboratory dataset is dark, and then the target images are generally captured from the front side due to the environmental conditions. On the other hand, the images collected in the tunnel often have more options for shooting methods, using industrial cameras to shoot targets from different angles and multiple distances. In this case, the shooting Angle includes three image distributions of the left side, the right arch waist and the arch roof of the tunnel. Therefore, the dataset is divided into 80%, 10%, and 10% for training, validation, and testing according to the three angles of the captured images.
Methods
Design of the optimum RT-DETR networks
This section consists of three parts. The first part provides an overview of the RT-DETR class object detection model. The second part introduces the backbone network used in the model, and then the third part is the improvement of the model fusion coordinate attention mechanism. Eventually the fourth part is the analysis of the model loss calculation.
Overview of the RT-DETR
The DETR (DEtection TRansformer) 24 is an object detection model based on the Transformer architecture. In the field of object detection, the previous task has been simplified by bypassing the manual design part. Consequently, this includes deleting non-maximum suppression (NMS) and omitting the process of generating anchor boxes, which simplifies the task of object detection. As a result, the detection speed is greatly improved. The Transformer-based encoder and decoder and feedforward network architecture (FFN) are the most important innovations that enable end-to-end object detection and are the reason why the network is so streamlined. The model structure of the DETR mainly consists of three main components: the backbone network, the encoder and decoder, and the detection head network, which is shown in Figure 4.
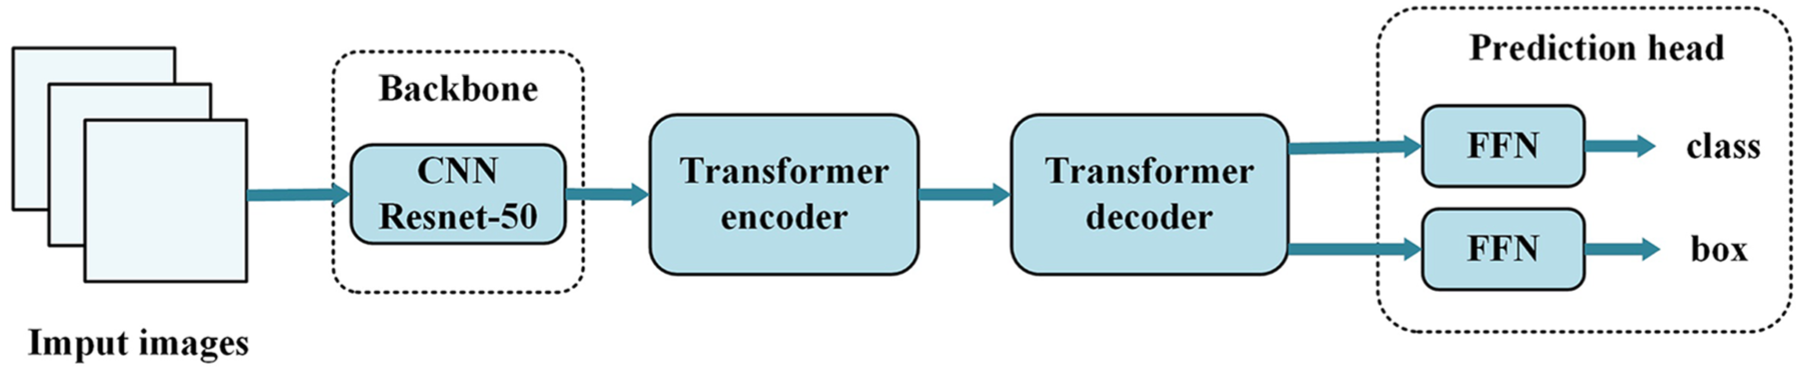
Key components of the DETR network.
Firstly, the features are extracted through the backbone network. Secondly, positional encoding is added to the image features, transforming them into a one-dimensional sequence. This sequence is then sent to the Transformer Encoder for information processing, followed by the Transformer Decoder for prediction. Finally, the number of prediction boxes generated by the model prediction is far larger than the number of objects to be identified in the picture. For this reason, the redundant detection boxes are eliminated to achieve the detection of the object.
In terms of engineering applications, the real-time performance of object detection models is often concerned. In order to make the DETR more efficient in processing, the RT-DETR 25 is a real-time Transformer-based end-to-end object detector, which is superior to the DETR in terms of computational cost and computational speed. The basic model of the detection target studied in this paper is based on the RT-DETR target detection framework, and the network structure is shown in Figure 5.
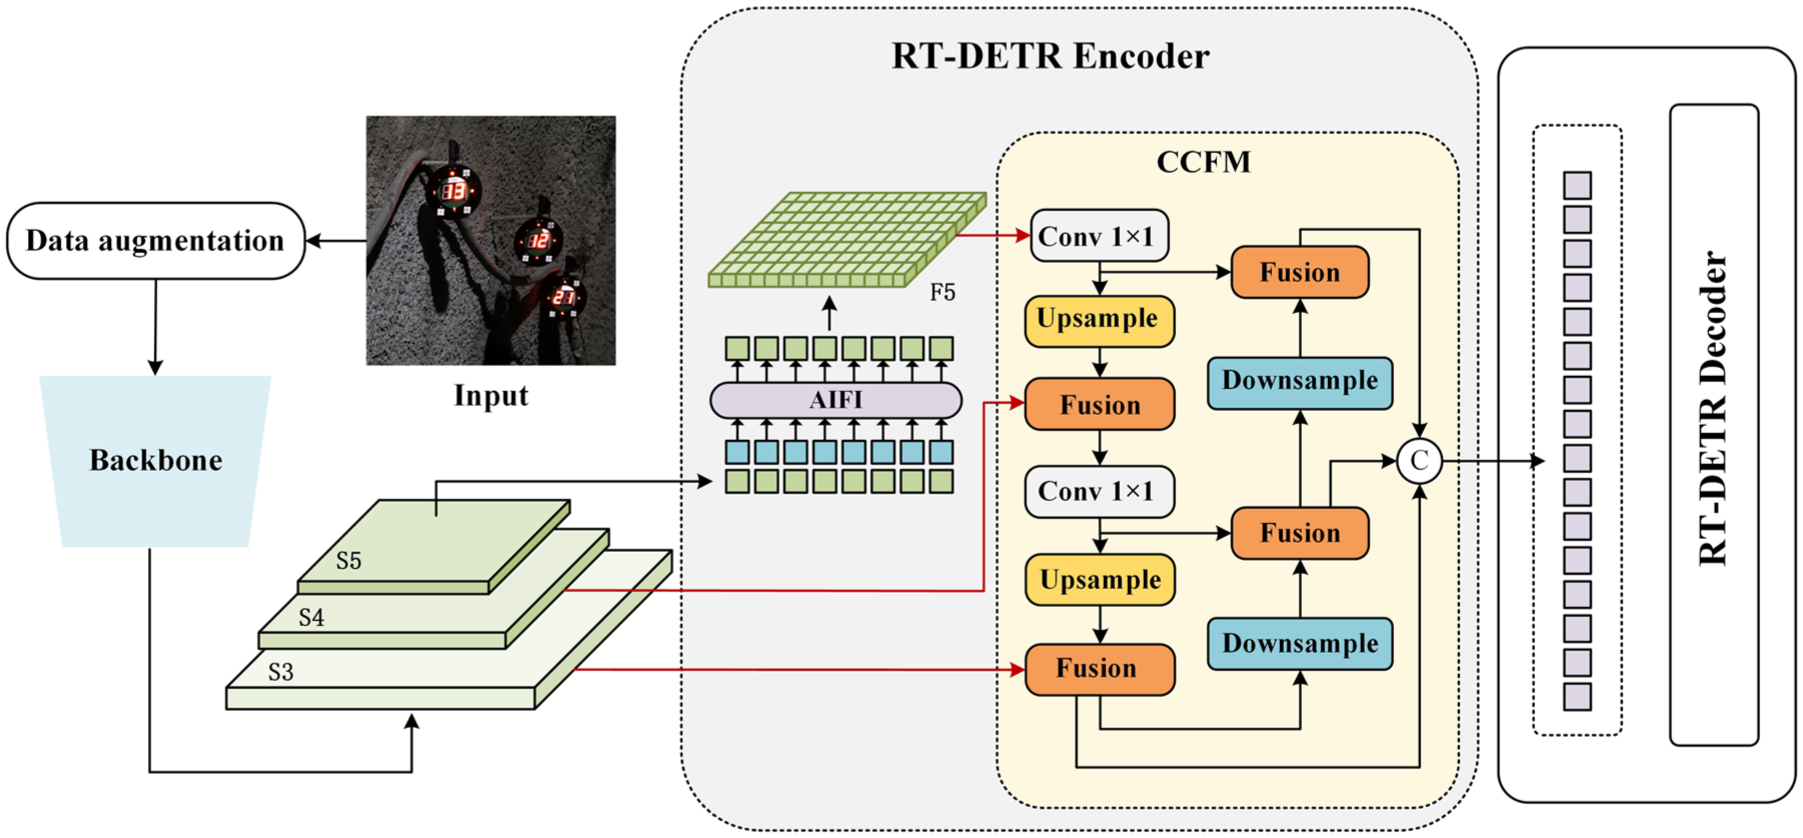
Diagram of the RT-DETR network structure.
The input image is enhanced as the input to the network after enhancement, followed by the backbone part to extract the multi-scale feature values. The feature map S5 with the smallest scale is input into the AIFI module. After that, the input results are fused with the feature maps S3 and S4 of the other two scales for feature fusion, which is the CCFM module in the figure. In the CCFM module, the model further realizes the extraction of features by up-sampling, down-sampling and the convolution module. In the input detection head, the subsequent sequence vectors are processed, which mainly includes Multihead attention for the encoder, Multi-scale Deformable attention for the decoder, and Feed-forward Neural Network (FFN). The final FFN processes the output of the decoder as a prediction head, which ultimately outputs the bounding box coordinates and class probabilities for each target object.
Backbone: EfficientVit
By using different backbones, RT-DETR can adapt to different application scenarios and performance requirements. 26 In order to apply the constructed model to the adaptive detection of tunnel rock targets, and expand the detection horizon, the target detection network is improved and optimized to realize the effective coverage of longer distance. In order to achieve real-time monitoring of tunnel rock settlement, real-time in the application scenario is an indispensable requirement of the detection model. Therefore, the network structure is lightweight processing to improve the detection speed of the model without losing too much detection accuracy. In order to improve the multi-scale feature extraction capability of the backbone part of the target detection network, and to improve the computational efficiency while maintaining high performance, EfficientVit 27 is introduced in the Backbone part, and its network structure is shown in Figure 6.
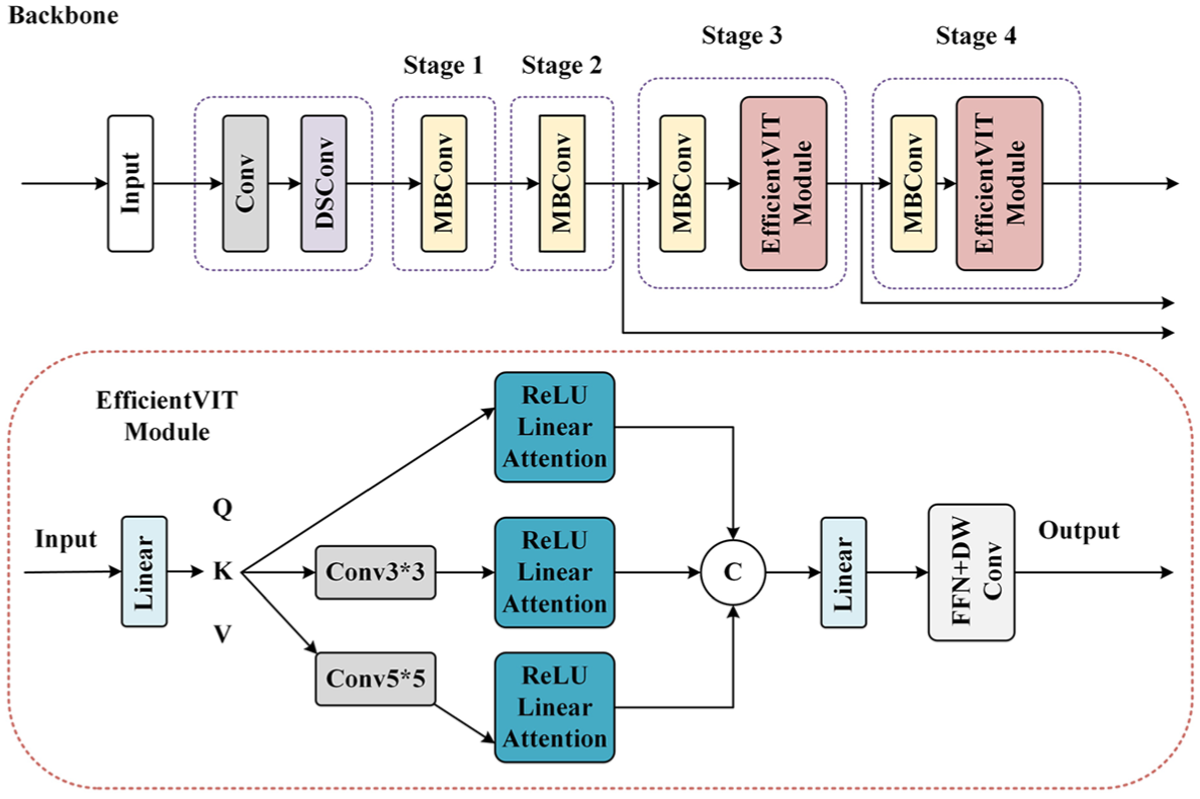
EfficientVit module structure detailed.
The EfficientVit module is a key component of the architecture, consisting of four main stages where the feature map size is progressively reduced. It integrates various convolutional techniques, such as the standard convolution module (Conv), depthwise separable convolution module (DSConv), mobile inverted bottleneck convolution module (MBConv), and a multi-scale linear attention module. These modules are strategically placed in the third and fourth stages of the network to enhance performance. Specifically, 3 × 3 and 5 × 5 convolutions are applied before the input reaches the linear attention module.
A key step in the DSConv module is reducing the number of parameters, which contributes to more efficient computation and reduced model complexity. This is crucial in real-time applications where computational efficiency is important. As illustrated in Figure 7, the MBConv module plays a pivotal role by first using a 1 × 1 up-dimension convolution to increase the feature map’s depth, followed by depthwise convolutions that allow for more efficient computation by focusing on spatial dimensions separately. To further refine the feature representation, the attention mechanism of SE-Net (Squeeze-and-Excitation) is incorporated, enabling the model to learn channel-wise dependencies and adjust the feature maps accordingly. Finally, a 1 × 1 convolution is applied to reduce the dimensionality of the output, allowing for a compact yet expressive feature representation.
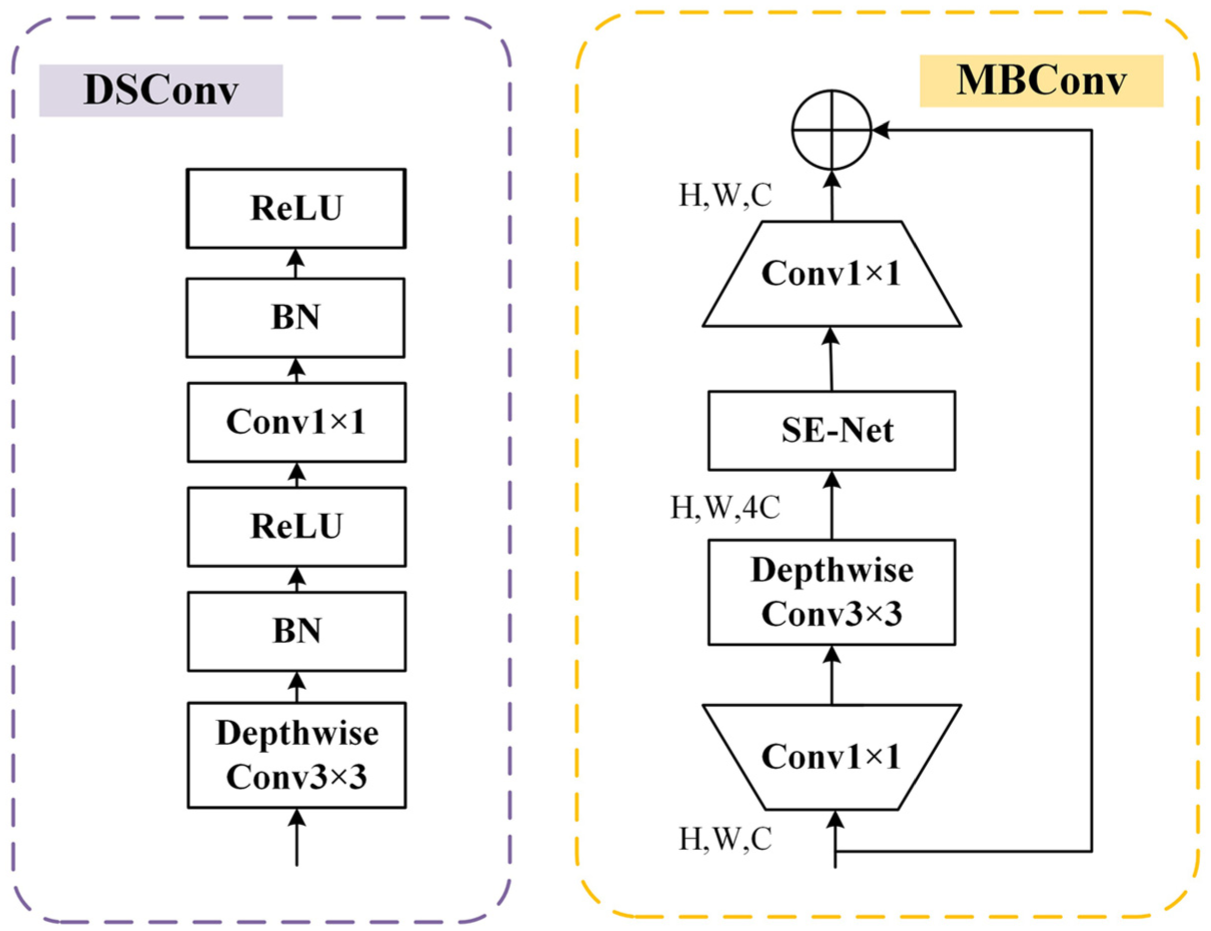
Structure diagram of the DSConv and the MBConv.
At the heart of EfficientVit is a novel lightweight multi-scale attention module that reduces computational complexity while retaining equivalent feature extraction capabilities, and enables a good combination of global sensory fielding and multi-scale learning. The main improvement points are that the backbone network of the original RT-DETR is replaced with EfficientVit, which improves the detection efficiency of the model without reducing the detection accuracy and realizes the real-time recognition of the target.
Efficient channel attention: ECA-Net
The target is designed with an LED digital tube, which is used to display numbers, where different numbers represent that the target is placed in different locations in the tunnel.
The image background information is more complex, and the clarity of some images will be reduced due to the light condition factor and the tunnel shooting conditions, which are not conducive to image detection. Furthermore, because the target established inside the tunnel is a small target, the design of the target is a square LED tube with points of light around it. According to the characteristics of the object to be detected, the detection algorithm is improved to enhance the accuracy of the detection result. In addition, an Efficient Channel Attention (ECA-Net) module is added after the RT-DETR backbone network layer. The ECA-Net module is designed to improve detection accuracy by enhancing the model’s channel-wise attention mechanism. By incorporating this attention mechanism, the model’s ability to detect subtle and small objects in complex environments is significantly improved, contributing to higher accuracy in detection tasks. The structure of the added efficient channel attention module is shown in Figure 8.
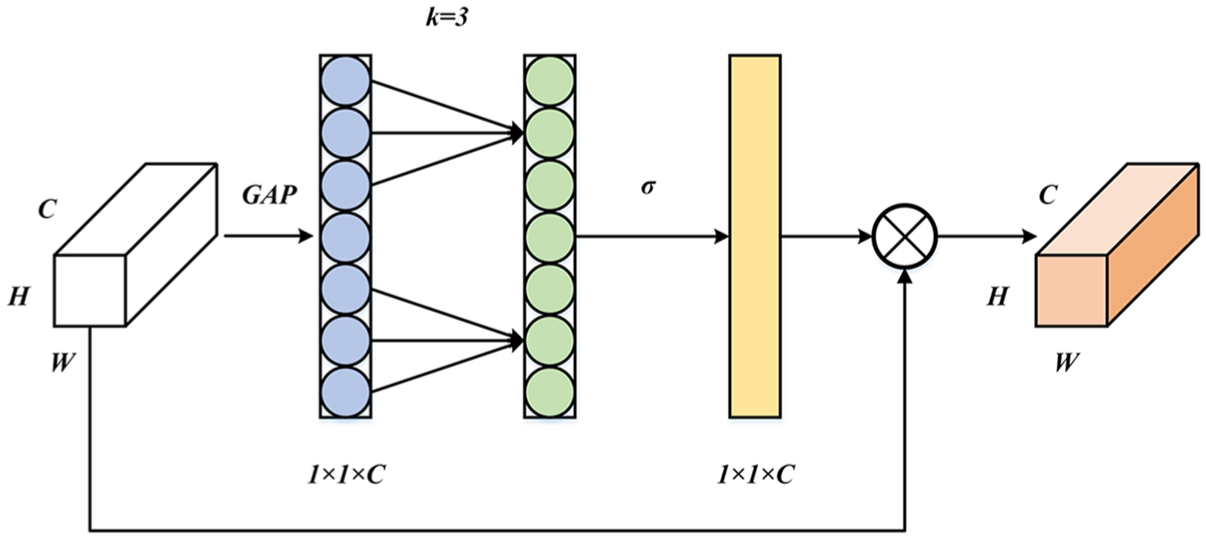
Efficient channel attention module (ECA-Net) network structure.
On the engineering side, an important point to improve the target detection model is to make the model less complex, lighten the model parameters, make fewer rounds of model training, etc. And the role of inserting an attention mechanism is often to make the algorithm focus more on the parts we are interested in and reduce the weight of non-essential regions. Therefore, in the engineering context of this paper, which is based on the real-time measurement of settlement in tunnels, the use of a lightweight, efficient attention mechanism is still necessary.
SE-Net 28 (Squeeze-and-Excitation Networks) is a representative model of channel attention mechanism, which was proposed earlier and widely used in convolutional networks. The channel features are augmented in the input feature map and finally output by the SE module without affecting the size of the input feature map. ECA-Net 29 (Efficient Channel Attention Module) proposes a local cross-channel interaction strategy without dimensionality reduction based on the SE-Net.
Step 1: First, the input feature graph is the cube of
Step 2: The convolution kernel
Step 3: The convolution result is processed by Sigmoid activation function, finally the result is multiplied with the Input original feature graph input channel by channel to obtain the feature graph
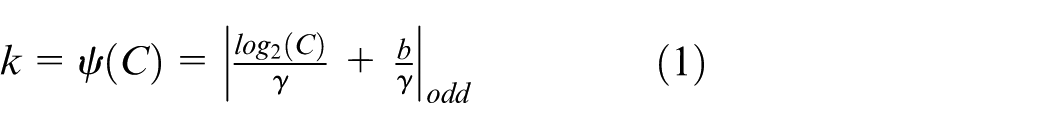
The convolution and adaptive functions are defined as shown in equation (1). Where
SIoU regression loss (smooth intersection over union)
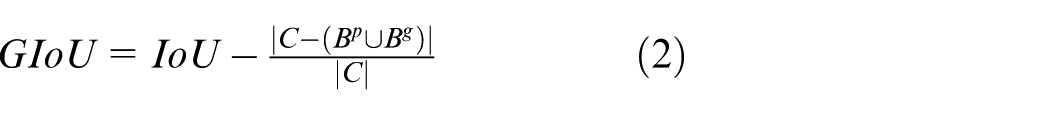
The RT-DETR model loss function uses the Hungarian algorithm, specifically to filter the frames that are optimally matched to the real labeled frames from the 100 (much larger than the number of preclassified categories) predicted frames. In this, the GIoU 30 loss function is used. At present, the bounding box regression loss functions are constantly evolving, and the GIoU loss function was proposed to solve the overlap problem between predicted detection boxes and real detection wild. The expression of GIoU is as follows:

Where
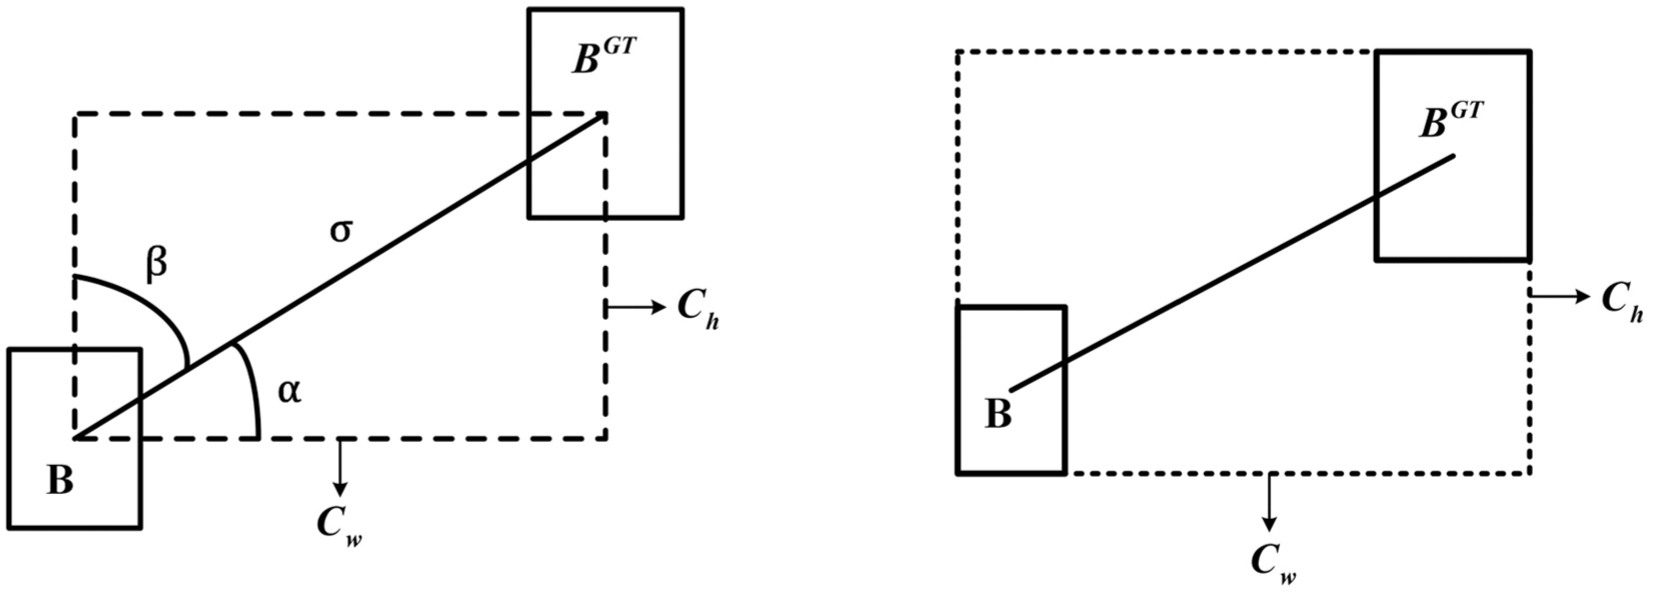
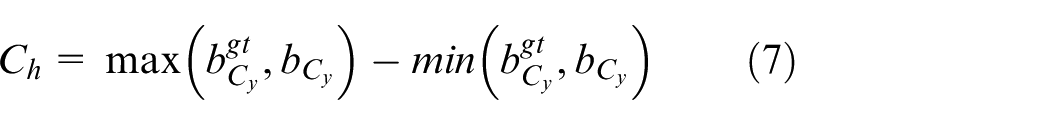
In terms of considering the improvement of the loss function, the DIoU and the CIoU, which improved on the GIoU loss function mostly rely on indicators related to bounding box regression such as distance, overlap area and aspect ratio, and do not consider the vector angle between the truth and the predicted box. This deficiency leads to slower convergence. In order to improve the efficiency of bounding box regression, a more complex SIoU 31 loss function is introduced. The SIoU regression loss contains four parts: angle cost, distance cost, shape cost and IoU cost. It can effectively improve the accuracy of the target detection task reasoning. As shown in Figure 9, are the Angle cost and distance cost of SIOU.
Angle cost and distance cost in SIoU: (a) angle cost and (b) distance cost.
Angle cost
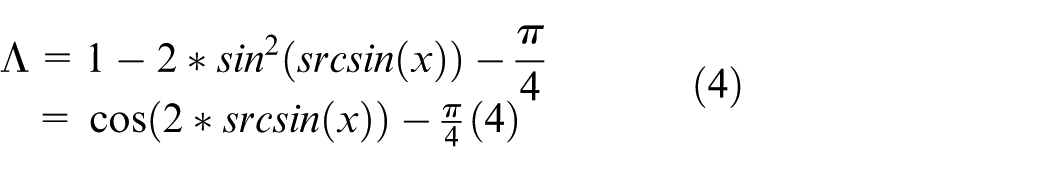

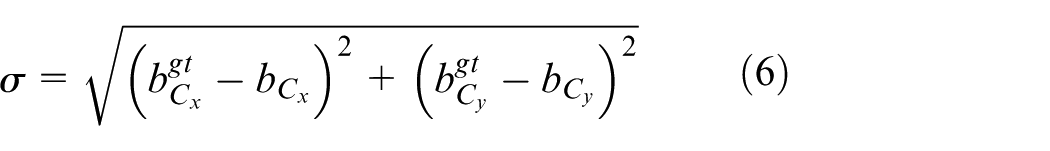
Equations (4)–(7) are the Angle cost where (
Distance cost
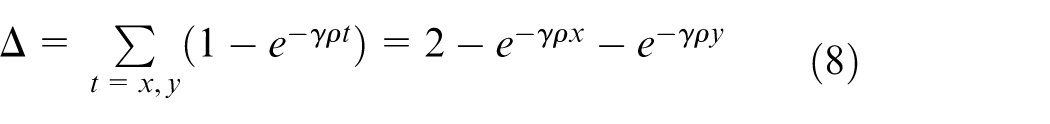
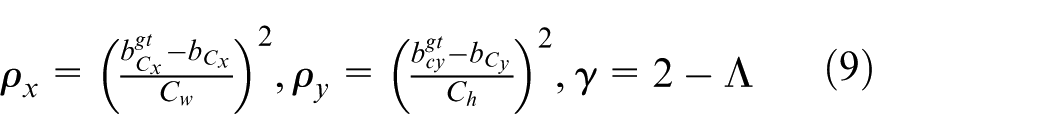
The distance cost is defined in terms of the angle cost. Where
Shape cost
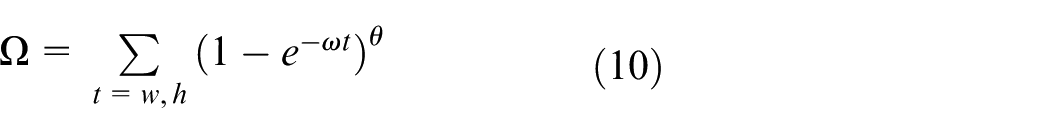
Equations (10) and (11) are the shape cost. The value of
The final regression loss of SIoU is shown in equation (12):

Distance measurement algorithm
After inputting the image into the improved target detection model, as shown in Figure 10, the two points of the target in the image are obtained and noted as
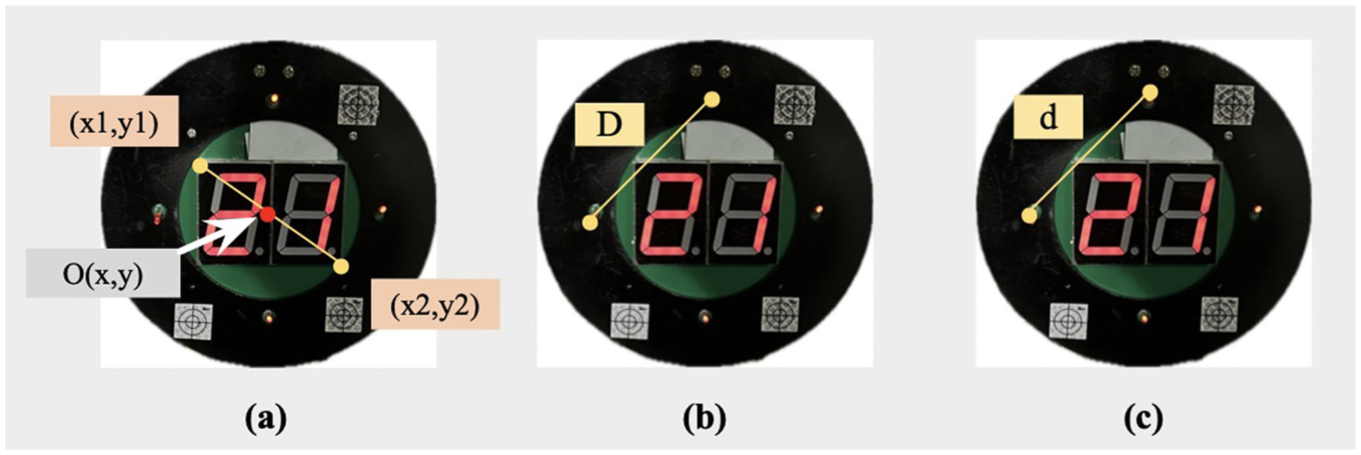
Pixel ranging algorithm diagram: (a) pixel center calculation, (b) distance measured in the image, and (c) distance measured in practice.
As shown in Figure 10, the design of the target contains four LED points up, down, left and right, the distance measured by the adjacent spot is denoted
Experimental results and discussion
Implement details
All algorithms in the paper are implemented using Python3 programing. Models were built based on the Pytorch framework for deep learning and trained on the Windows 11 experimental platform, the AMD Ryzen 7 5800H processor, and the NVIDIA GeForce GTX 3060 6GB GPU.
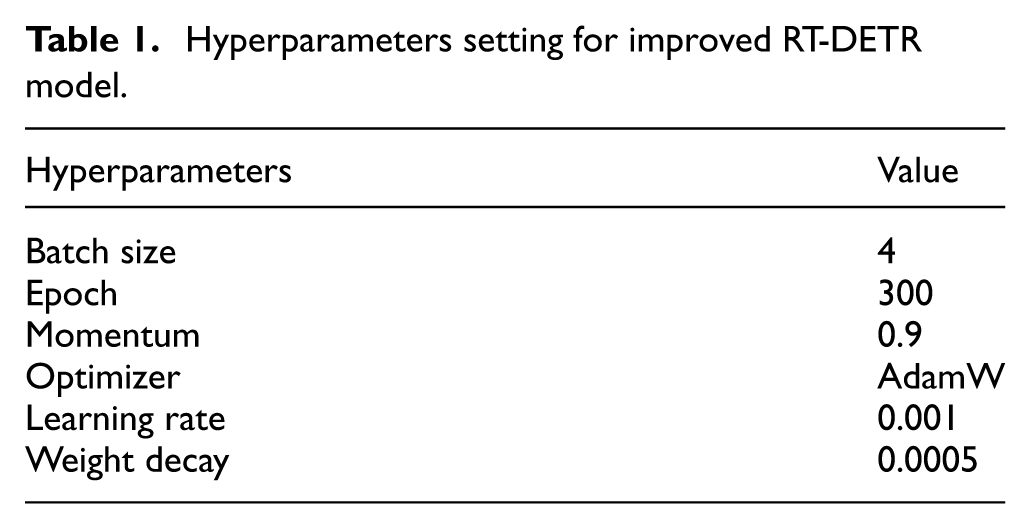
The object detection model is built using Pytorch, and before training, a portion of the model’s hyperparameters need to be set. The model ran for a total of 300 epochs, and the optimizer used was AdamW. The configuration parameters include a batch size of 4, which was set based on the image size and GPU computational capacity. The warm-up period was set to 2000 steps. The momentum coefficient helps the optimizer consider the previous direction of gradient descent when updating model parameters, thus accelerating convergence and reducing oscillations. The learning rate was set to 0.001. The weight decay coefficient was set to 0.0005, which controls the learning speed and effectiveness of the model by dynamically adjusting the learning rate. The hyperparameters for model training are shown in Table 1.
Hyperparameters setting for improved RT-DETR model.
Evaluation metrics
To verify the necessity of improving the object detection model, we introduce the concept of the confusion matrix. The confusion matrix has four different states, namely True Positive (TP), which represents that the classifier predicted positive samples and the actual samples are also positive samples. False positive (FP), which represents that the classifier predicted positive samples but the actual samples were negative. True negative (TN), which represents that the predicted result is negative and the actual result is negative. False negative (FN), which represents that the predicted result is negative, but the actual sample is positive. Extending from the confusion matrix are the most commonly used model evaluation metrics for object detection: precision and recall. (The F1 evaluation metric is deleted here.) The formulas for their calculation are as follows:


Average precision (AP) and mean average precision (mAP) are commonly used metrics for evaluating target detection models. Generally, the better performance of the classifier, the higher the AP value, while mAP indicates the average value of multiple categories. The calculation formula is (15) and (16).
Where
For object detection models, in addition to detection performance metrics, evaluating the computational efficiency and resource consumption of the model is also an important aspect. In this study, the model size is evaluated based on the number of parameters, measured in (M). The real-time detection performance of the model is assessed using FPS. FPS indicates the number of images processed by the model per second. The calculation of FPS is given by the formula (17).
Monitoring system implementation
The software display interface of this paper is shown in Figure 11. The platform for real-time monitoring of tunnel surrounding rock is integrated by the IDE of Microsoft Visual Studio 2019. It is built in the C# language environment, so the trained target detection model needs to be deployed cross-platform in advance. The visual interface makes it easy to see the tunnel information, monitoring area, monitoring equipment management and other information. In the lower part, you can see the real-time image captured by the industrial camera, and then the target shape variable that can be observed in real-time is displayed on the right side. Click the button of “Deformation curve” to visually display the tunnel settlement deformation monitoring curve.
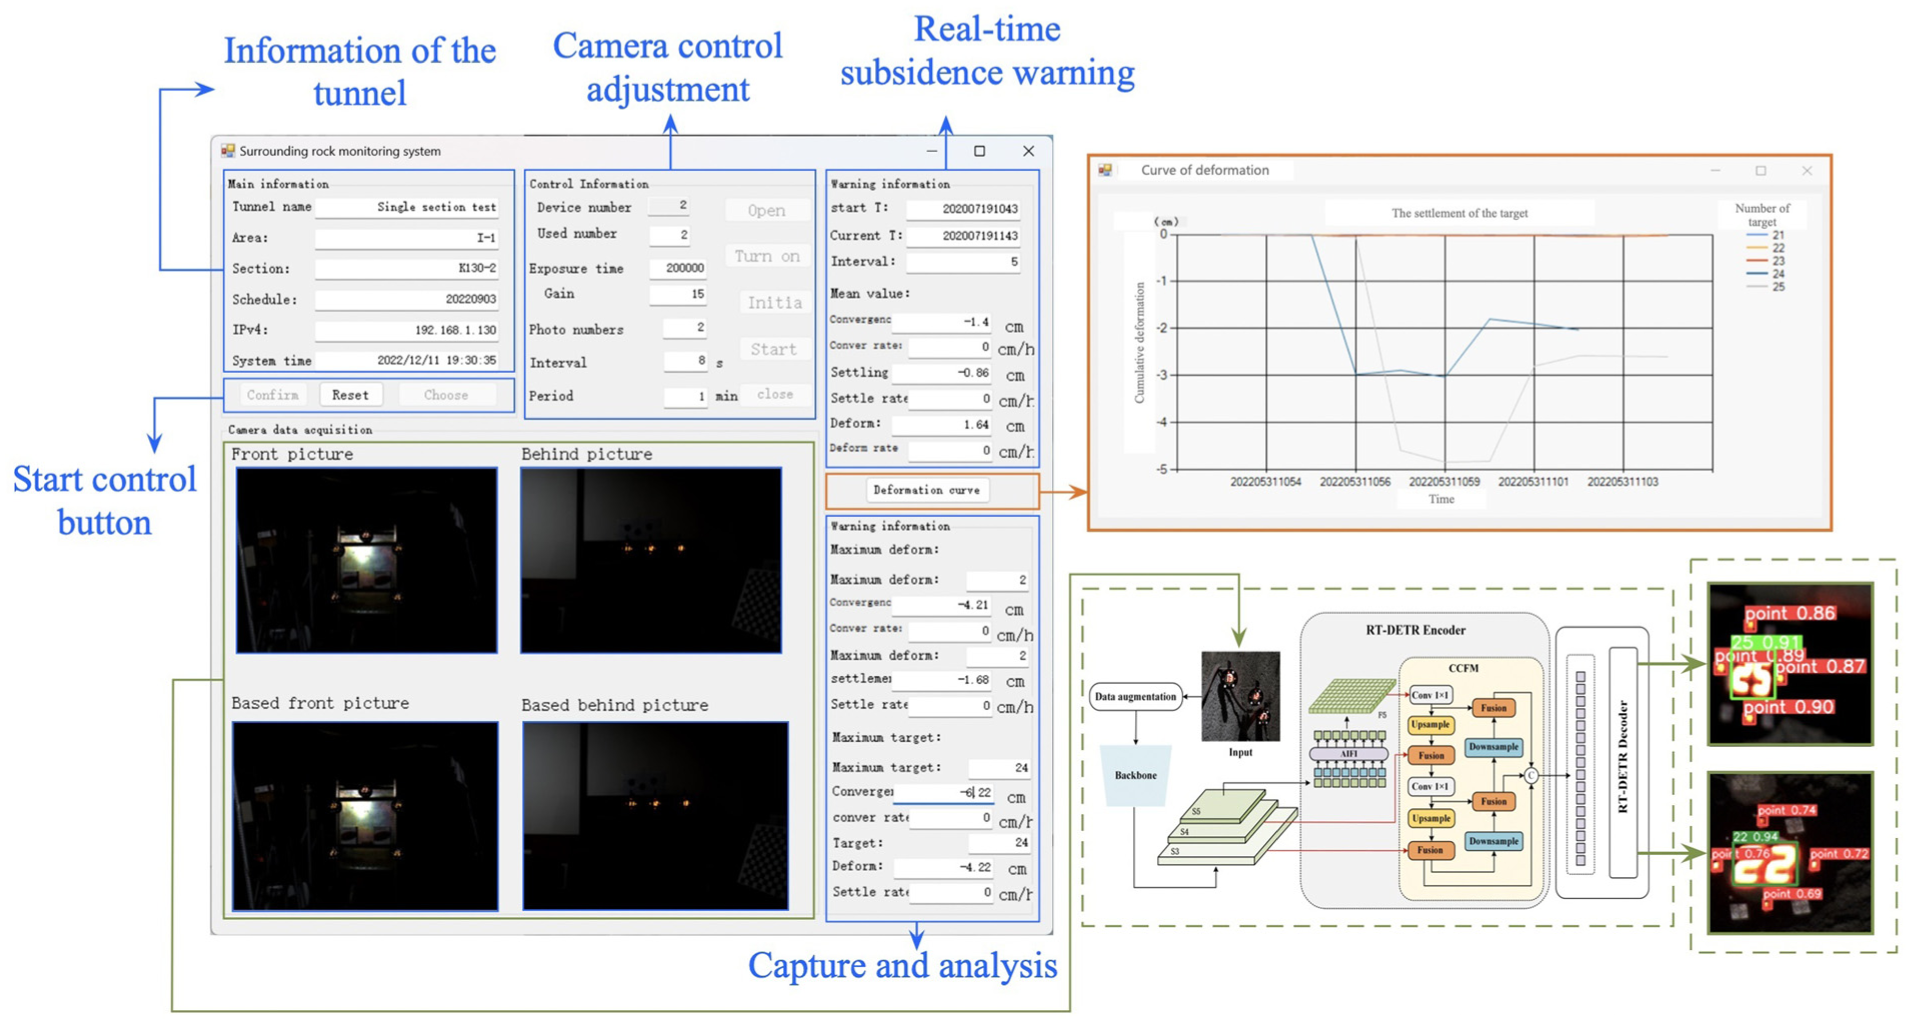
The software interface of the tunnel settlement system.
Comparison of experimental results
In order to visually evaluate the detection performance of the improved model on the tunnel target dataset, this paper conducts ablation experiments and comparison experiments, respectively. During the detection process, the hyperparameter settings of the model are kept consistent, and the number of training rounds is set to 300 in the ablation experiments. In the comparison experiments, since different models are used, training is conducted until each model converges. The results of the ablation experiments are shown in Table 2. In the table, Group 1 represents the baseline RT-DETR model without any improvements. In the other three experiments, “×” indicates that the model does not adopt the corresponding improvement method, while “√” indicates that the model adopts the current improvement method.
Ablation experiments with different module improvements.
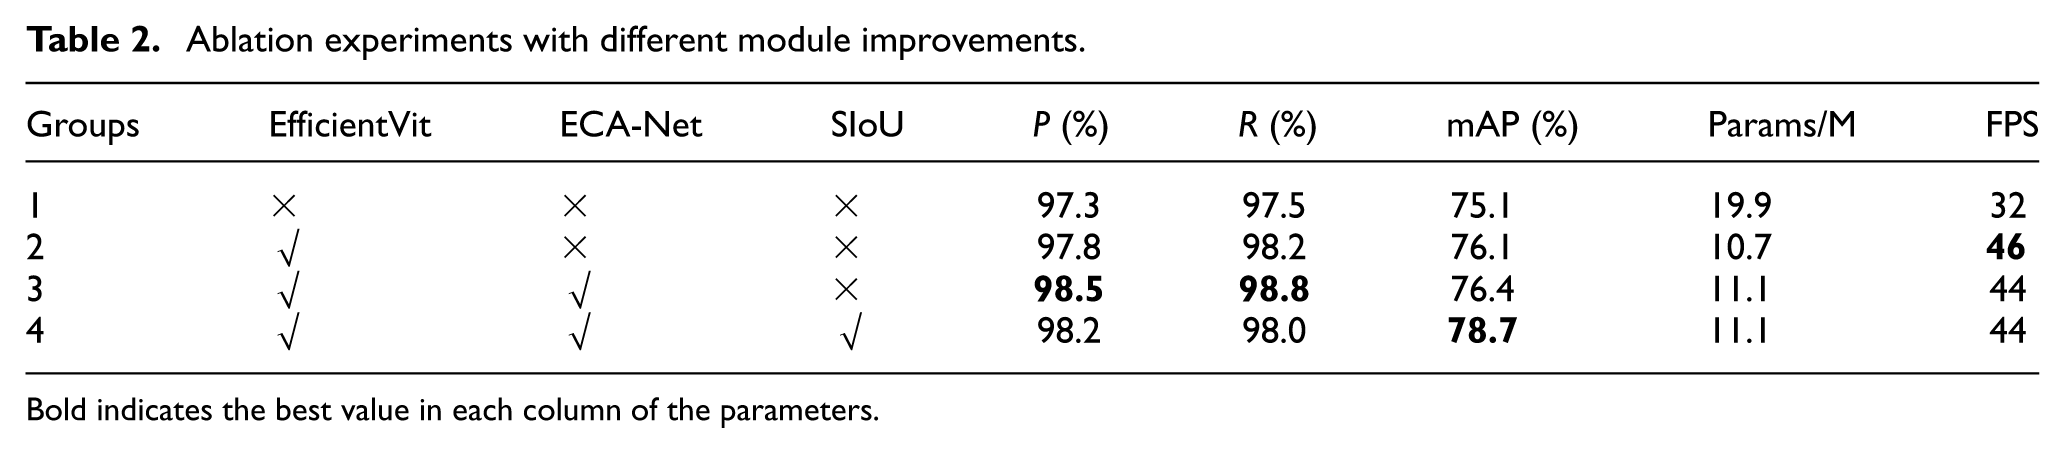
Bold indicates the best value in each column of the parameters.
As shown in Table 2, when using RT-DETR as the baseline model, the number of parameters is 19.9M, with an FPS of only 32. Moreover, there is still room for improvement in terms of accuracy and recall. In Group 2, after replacing the backbone network with EfficientVit, the model’s parameters are significantly reduced, the FPS is improved, and the detection accuracy is also enhanced. This result demonstrates that replacing the feature extraction network can effectively improve detection performance while achieving model lightweighting. In Group 3, adding ECA-Net to the EfficientVit backbone significantly improves precision and recall. This enhancement indicates that ECA-Net, as a lightweight attention mechanism, effectively boosts detection accuracy while maintaining the model’s lightweight nature, without significantly impacting FPS or greatly increasing the number of parameters. In the Group 4 experiment, the combination of EfficientVit, ECA-Net, and SIoU achieves the highest mAP. Although there is a slight decrease in precision and recall, SIoU significantly improves bounding box localization accuracy.
The experimental results show that the improved RT-DETR model demonstrates strong detection performance in target recognition tasks while maintaining a balance between accuracy and computational efficiency.
In Table 2, it can be seen that the improvement of the base model RT-DETR network has achieved better results. However, there are a large number of target detection models, and the selection of one is also particularly important. To further validate the necessity of the selected models for network tunnel settlement monitoring, traditional image recognition models such as YOLO, SSD and Faster R-CNN were selected as experimental comparison methods. The datasets collected from the field targets of the selected tunnel surroundings are kept completely unchanged.
The comparison results are shown in Table 3. Compared with other object detection models, our method has a good advantage, the precision and recall have reached the highest value, which is better than other methods, reaching 0.982 and 0.980, respectively.
Comparison of experimental results of different algorithms in the dataset of this paper.
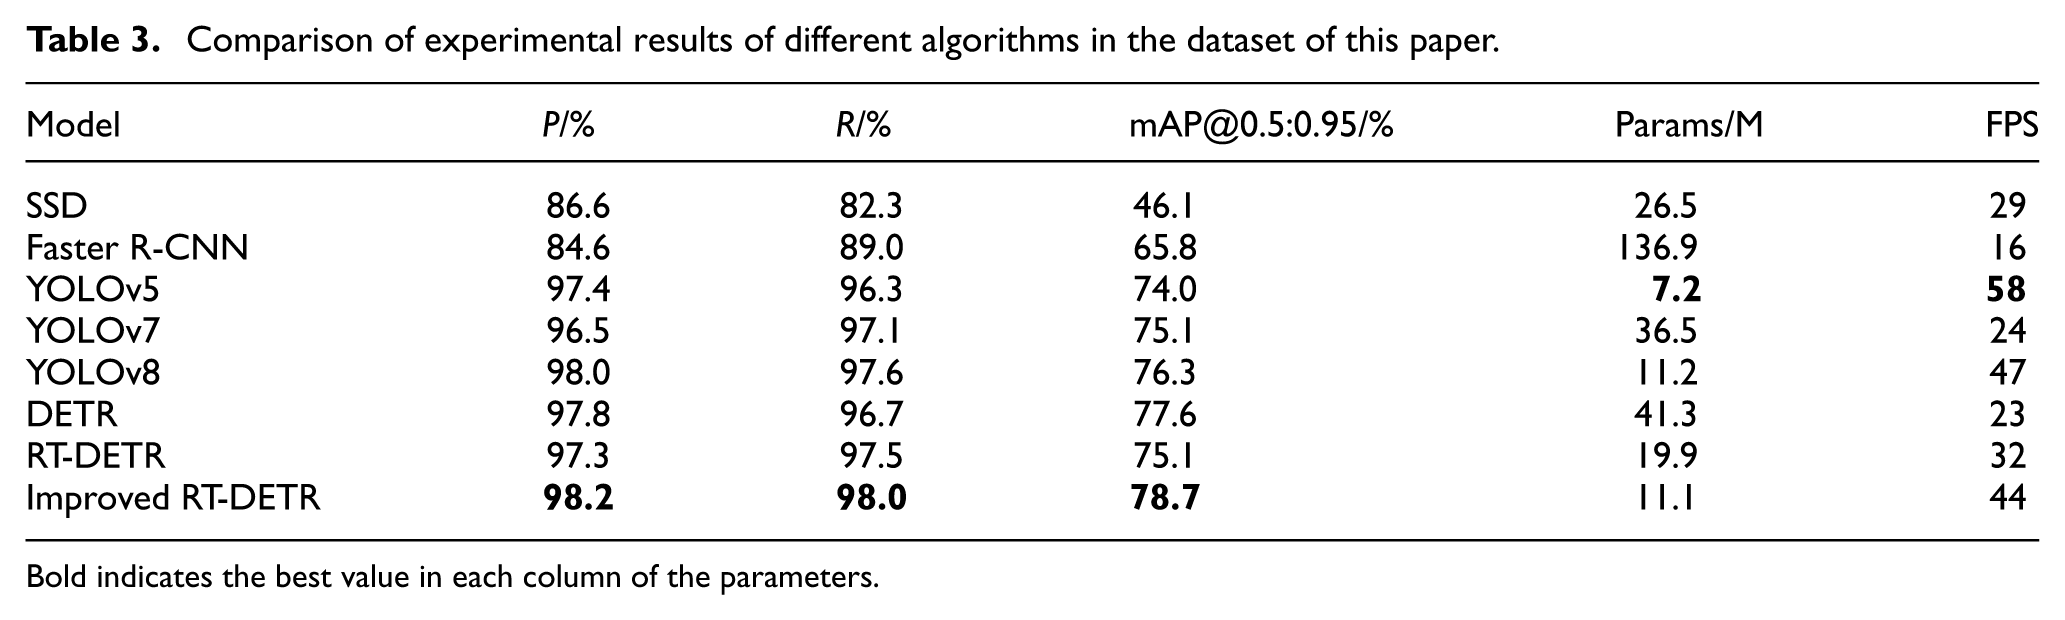
Bold indicates the best value in each column of the parameters.
As shown in the table, the improved RT-DETR algorithm demonstrates higher precision and recall compared to the classic SSD and Faster R-CNN algorithms. It also outperforms these two algorithms in terms of real-time detection. Compared to the classic engineering detection algorithm YOLO series, the improved RT-DETR has a slightly higher model parameter count than YOLOv5, but its detection precision, recall, and mAP values are all higher than those of YOLOv5. The comparison with classic object detection models reflects that the improved model achieves a balance between precision and detection efficiency in tunnel target detection.
In order to make the detection results more intuitive, the focused detection part is in the center of the target mark. The number has with the four surrounding light points, which are placed in the figure as enlarged as possible. For some of the models to visualize the detection demonstration, the results are shown in Figure 12. The Row images represent the initial intercepted target image, the Ground truth is the situation when labeling in LabelImg. The other six groups are the comparative experimental detection results. As can be seen from the figure, some of the traditional models have obvious leakage detection, and the four surrounding light points are not detected. There is also the phenomenon that the detection frame does not surround the light points well, and the confidence level of the detection frame belonging to the category of point and point category is not high. In general, it seems that each model has a better effect on recognizing the digits of the digital tube. Among them, the improved RT-DETR target detection model proposed in this paper maintains the best recognition effect in visual detection results, whether it is a number or a light point.
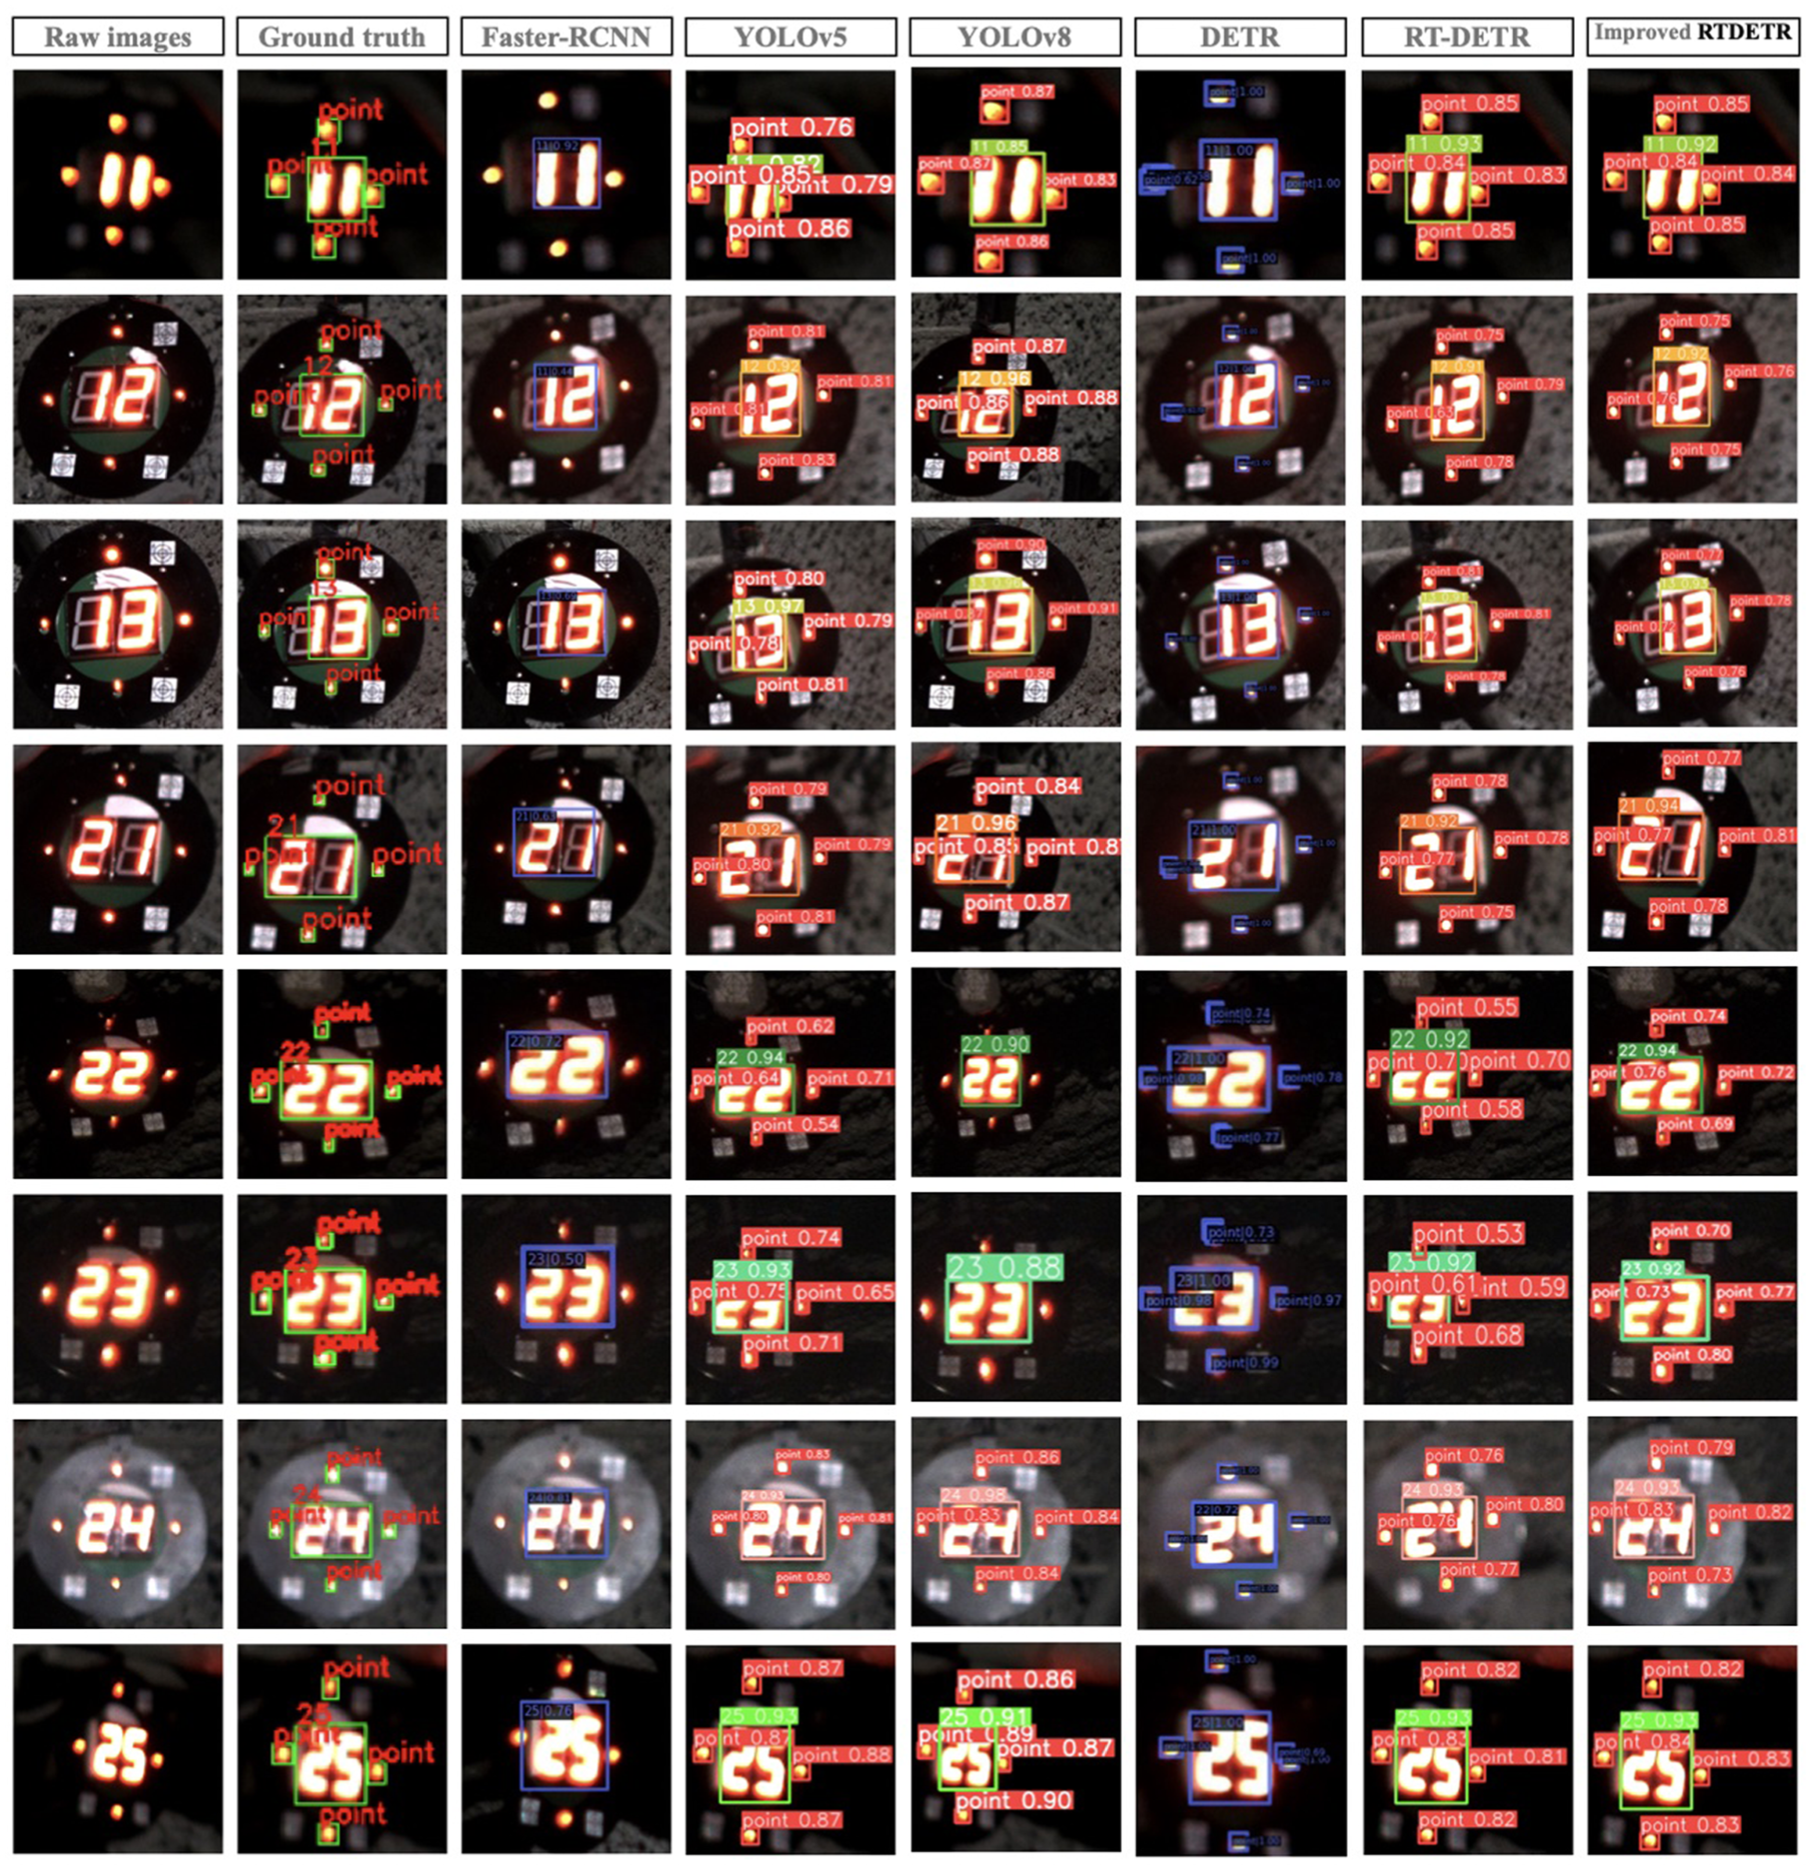
Visual implementation of selected model recognition targets.
Error analysis of tunnel settlement measurement
Measurement errors
To accurately verify the performance of the proposed model in tunnel settlement measurement, an indoor simulation experiment was conducted to evaluate target recognition and localization under different shooting distance conditions. In the experiment, multiple shooting distances were set, and a vision-based measurement method was employed to calculate the target’s settlement displacement. This approach effectively simulates the detection and localization of targets in an actual tunnel environment.
To ensure the accuracy of the measurement results, the displacement values calculated using the proposed method were further compared with the actual displacement values measured by a laser rangefinder. As a traditional high-precision measurement tool, the laser rangefinder serves as a reference standard for validating the accuracy of the model’s calculations. Due to the restrictions of the tunnel environment, the industrial camera at a distance from the target is not clear, so the imaging effect is not ideal. For these reasons, the industrial camera was placed in the range of 0–25 m from the target to take pictures of the target during the experiment, and the settlement value measured in the actual experiment was more reliable.
During the comparison process, both absolute error and relative error were computed. The absolute error reflects the difference between the displacement value obtained by the proposed method and that measured by the laser rangefinder, while the relative error represents the proportion of this difference relative to the laser rangefinder’s measurement. These error metrics provide a comprehensive evaluation of the algorithm’s performance at different shooting distances, further exploring the error range under various conditions and laying the foundation for future improvements in measurement methods. The calculated results are shown in Figure 13.
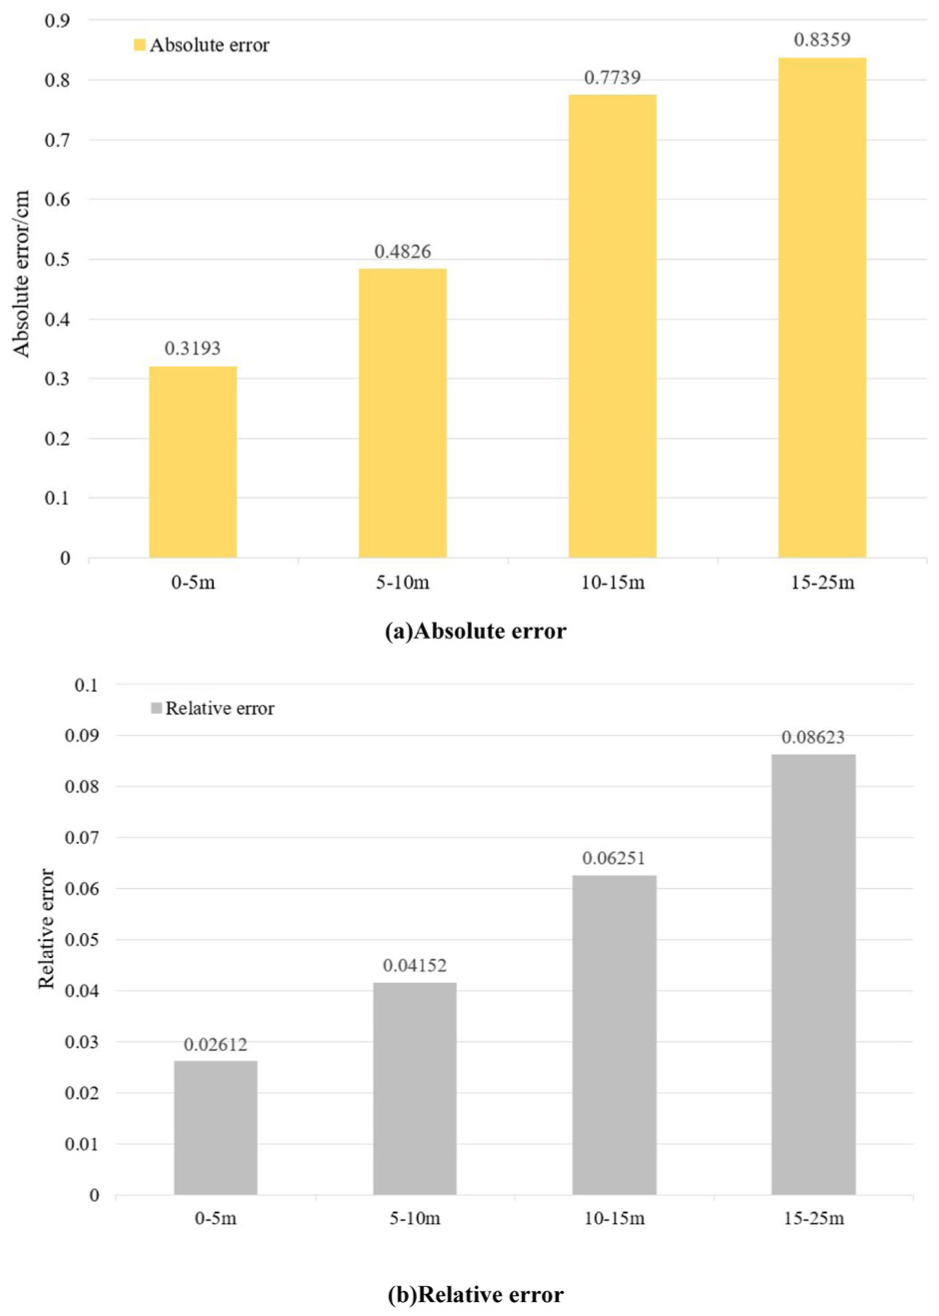
Different environmental distance shooting settlement measurement error: (a) absolute error and (b) relative error.
As shown in Figure 13(a) and (b), the average absolute error and relative error of the measured results are presented, respectively. It can be observed that as the shooting distance increases, the error exhibits a growing trend. Within a 5 m range in the laboratory environment, the absolute error is approximately 0.3193 cm, and the relative error is about 2.612%. When the shooting distance is within the ranges of 5–10 and 10–15 m, the absolute errors between the proposed method and the laser rangefinder measurements are around 0.4826 and 0.7739 cm, respectively, with corresponding relative errors of 4.152% and 6.251%. In the range of 15–25 m, the error increases, with an absolute error of approximately 0.8359 cm and a relative error of 8.623%. As shown in the figures, the proposed method demonstrates relatively low errors in target settlement measurement, with an absolute error of less than 0.84 cm within a shooting distance of 25 m.
To verify the measurement accuracy of the proposed target recognition and settlement measurement method in an actual tunnel environment, we designed and conducted a comparative experiment. In the experiment, we selected five different measurement points inside the tunnel, deployed targets at each location, and used a total station as a high-precision measurement tool to compare the settlement displacements calculated by our method.
As a standard tool in engineering measurement, the total station features high accuracy and strong stability, making it widely used for deformation monitoring in tunnel construction. Therefore, in this experiment, the measurement results obtained from the total station were used as a reference standard to evaluate the applicability of the target recognition-based settlement measurement method in a real tunnel environment. The experiment was conducted within a shooting range of 5–25 m, aiming to simulate measurement conditions under different working scenarios. As shown in Table 4, the monitoring data of tunnel surrounding rock settlement were calculated using the proposed target recognition and photogrammetric measurement method.
Table of surrounding rock settlement data/mm.
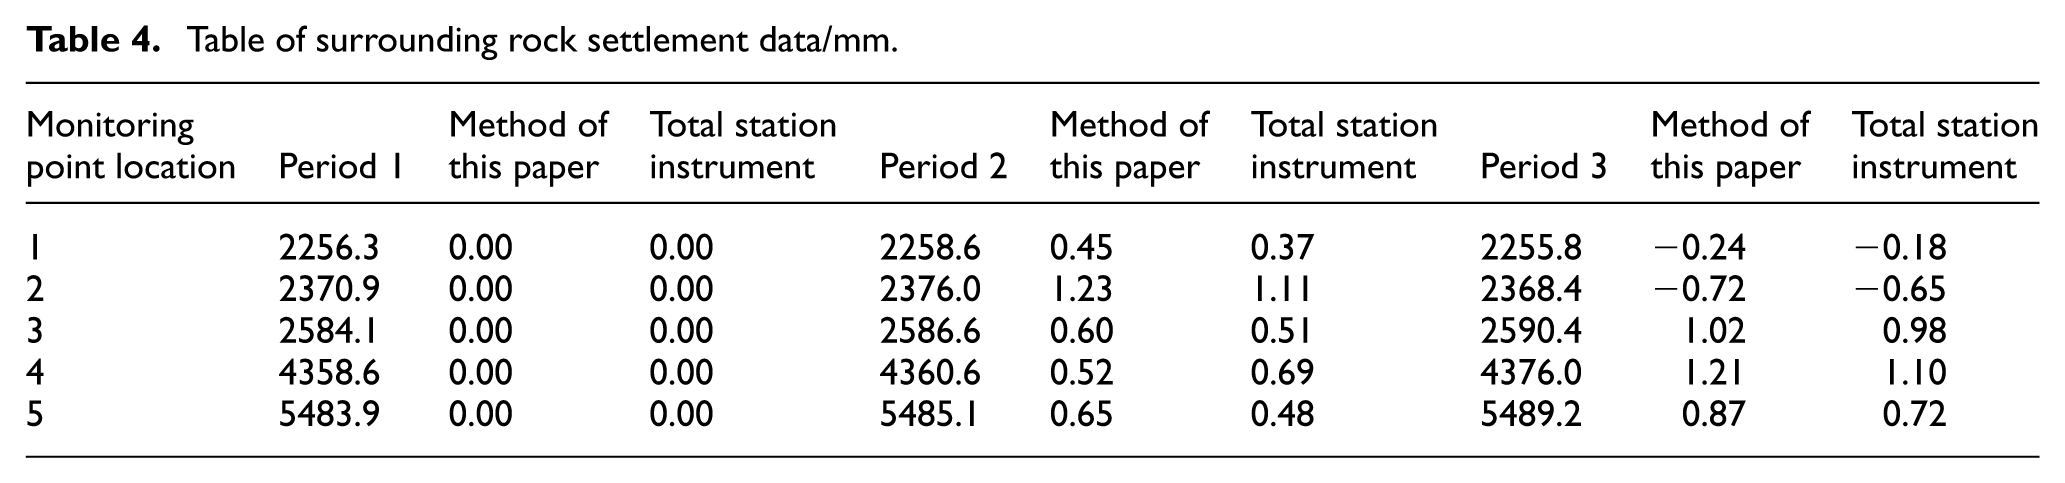
In Table 4, Period 1 is used as the baseline measurement point, so both the method proposed in this paper and the total station measurement values are 0.00. In Period 2 and Period 3, since some periods occurred before the baseline period, the settlement measurement values are negative. From the table, it can be seen that using target detection combined with photogrammetry, the settlement values of the tunnel’s surrounding rock show consistent trends across all monitoring points, which align with the deformation patterns of the surrounding rock during tunnel construction. Additionally, a small-scale comparison was made between the settlement measurements from this method and those obtained from the total station, assuming that the total station measurements are the true settlement values. The results show that the settlement distance accuracy meets the experimental expectations, and the reliability is high.4.3.2 Analysis of influencing factors.
Analysis of influencing factors
In the process of shooting, the construction environment inside the tunnel is complicated and changeable, and the existence of obstacles also has an impact on the shooting angle. At different angles, the shooting target’s four light points are tilted, calculate the error when the actual distance and pixel distance are not accurately proportional. Secondly, the target design LED light point in the dark at a distance when the target is small, it is difficult to accurately identify, and these factors may lead to the errors. Therefore, in this section, we analyze the influencing factors that may cause measurement errors from three aspects: lighting conditions, target size and environmental interference, so as to provide a basis for subsequent improvement of measurement methods and improvement of measurement accuracy.
Influence of lighting conditions
Lighting conditions in tunnel environments are subject to frequent changes, which may lead to fluctuations in image quality, consequently impacting the accuracy of target detection. For instance, intense direct light or insufficient illumination may obscure the target’s contours, resulting in measurement errors. To assess the influence of lighting, we conducted experiments under various lighting conditions using a variable LED light source. The results demonstrate that the designed target exhibits luminous properties, ensuring high recognition accuracy even in low-light environments. This indicates that the proposed method can maintain reliable performance under varying lighting conditions commonly found in tunnel environments.
Influence of target size
The size of the target plays a crucial role in detection accuracy. Smaller targets are often overlooked or misdetected, particularly in tunnel environments where noise and clutter may interfere with detection. As the distance between the camera and the target increases, the corresponding settlement measurement error also increases. This effect is most noticeable for smaller targets, where precision becomes more challenging. Therefore, it is essential to consider target size when designing the target detection and measurement system to ensure accurate measurements over a range of distances.
Influence of environmental interference
Tunnel environments are subject to various environmental factors, such as vibrations and humidity, which can interfere with the target detection process. To mitigate these potential interferences, we equipped the camera system with dust covers and vibration isolation platforms during the experiments. These precautions effectively minimized disturbances caused by vibration and dust, ensuring that the detection process remained stable and reliable. Consequently, the influence of environmental interference was significantly reduced, allowing for more accurate measurement results.
Conclusion
With the expansion of the scale of urban rail transit, tunnel construction is also increasing year by year. Especially, real-time monitoring of the settlement of the tunnel’s surrounding rock has become an important problem to be solved urgently. In order to ensure the safety of tunnel construction, this paper developed a monitoring system of surrounding rock settlement in the complex environment of tunnel construction, which integrated image processing and image method measurement, for real-time monitoring and analysis of tunnel deformation. To show the main work of this paper more intuitively, we describe it in three parts as follows:
(1) Based on the image acquisition mechanism proposed in this paper, we collected the target images taken in the laboratory environment and the tunnel construction environment, further establishing our own target dataset of tunnel surrounding rock.
(2) Integrated computer, industrial cameras and targets constitute a set of hardware facilities for tunnel settlement monitoring. The attention mechanism ECA-Net is embedded into the target detection model based on the RT-DETR network, which improves the target recognition ability of the model in the complex tunnel environment. In order to improve the efficiency of the network in model engineering, EfficientVit is introduced as the backbone network, and the loss function is improved to SIoU Regression Loss. The experimental results indicate that the proposed improved RT-DETR algorithm achieves superior performance in the detection of feature targets, enabling high-precision target recognition while maintaining a lightweight detection framework.
(3) Based on the target detection and recognition task, a tunnel surrounding rock settlement measurement algorithm was further designed to calculate the actual displacement of the target by detecting pixel variations at the target center. During the error analysis phase, comparisons were conducted in a laboratory environment using a laser rangefinder, and on-site experiments were performed in a small range against total station measurements. Experimental results consistently demonstrate the accuracy of the proposed algorithm. Finally, potential sources of error were analyzed from three aspects: lighting conditions, target size, and environmental interference.
(4) A visualization software platform of tunnel surrounding rock settlement monitoring is developed. Through the connection between the client side and the server side, monitoring personnel can use this software to monitor the dynamic changes of tunnel settlement in real time.
To sum up, based on the proposed improved tunnel settlement target detection network, the optimal analysis strategy is selected through experiments to form the current application method of the tunnel surrounding rock monitoring system. How to effectively expand the target data set taken inside the tunnel and how to reduce the settlement measurement error are the key directions of follow-up research. On the other hand, there are some limitations mainly relate to the limited scope of field validation and the absence of long-term monitoring verification. Besides, the engineering applicability are appropriately qualified.
Footnotes
Ethical considerations
This research adheres to ethical principles and guidelines. Since no human participants or animals were involved in the study, ethical approval was not required.
Informed consent/Consent to participate
This study does not involve human participants, human data, or human tissue. Therefore, informed consent is not required.
Funding
The authors disclosed receipt of the following financial support for the research, authorship, and/or publication of this article: The research is jointly supported by the Science and Technology Bureau of Xi’an project, Grant/Award Number: (24KGDW0049) and Scientific research project China Railway 20 Bureau Group Co., ltd. Grant/Award Number: YF2407QT12B and the project of Shaanxi Provincial Department of Transportation, Grant/Award Number: 25-08K.
Declaration of conflicting interests
The authors declared no potential conflicts of interest with respect to the research, authorship, and/or publication of this article.
Trial registration number/date
This study does not involve clinical trials, and thus no trial registration is applicable.