
Abstract
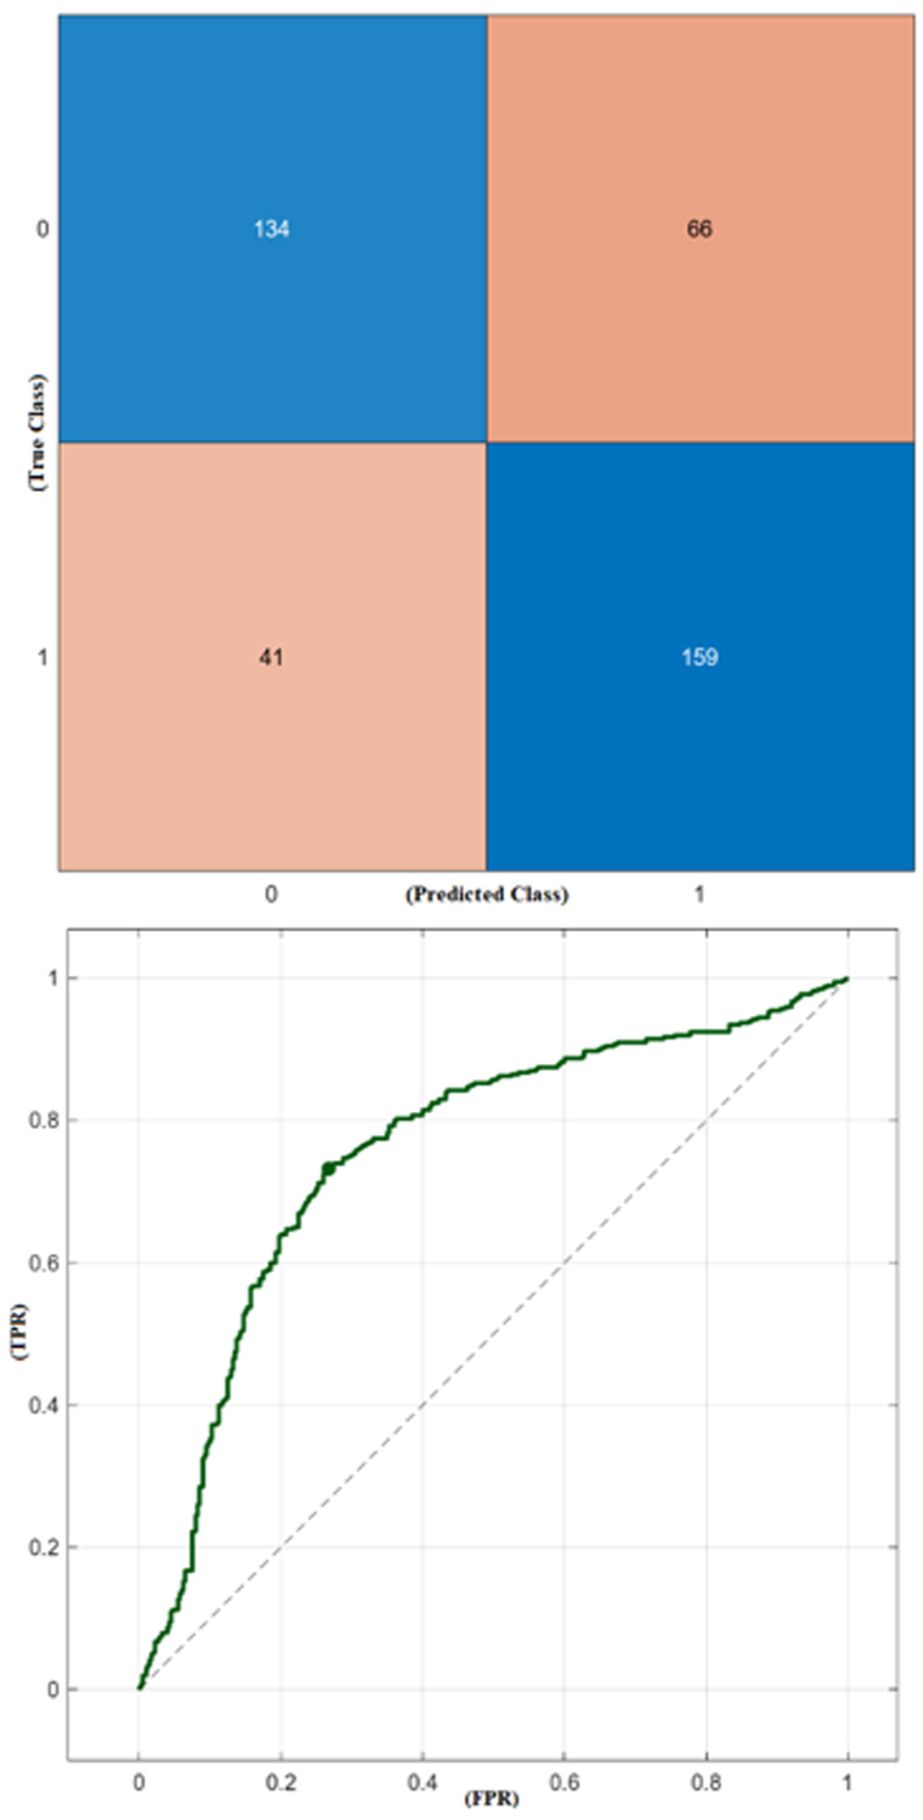
Automatic Electrical energy plays a critical role in the economic and technological development of modern societies. High voltage lines are utilized for the efficient distribution of this energy. These lines enhance energy efficiency and sustainability by minimizing energy transmission losses. Ensuring the safe and uninterrupted transmission of electrical energy is of paramount importance for the robustness and maintenance of the infrastructure. Consequently, the role of high-voltage poles in the effective and efficient transmission of energy is of paramount importance. The objective of this study is to utilize remote sensing and various shallow learning techniques to identify high voltage line poles in the vicinity of Batman. The Sentinel-1 Synthetic Aperture Radar (SAR) satellite was utilized in this study. Sentinel-1 synthetic aperture radar (SAR) imagery was processed on the Google Earth Engine (GEE) platform to derive backscatter information for infrastructure and terrain analysis. Dual-polarization data (VV and VH) from both ascending and descending orbits were acquired between January and June 2025. Standard preprocessing steps, including thermal noise removal, radiometric calibration, and terrain correction using the SRTM 30 m digital elevation model, were automatically applied through the GEE Sentinel-1 GRD pipeline. Median composites were generated to minimize speckle noise and temporal variability. The derived VV and VH backscatter coefficients were subsequently used to extract spatial texture and backscatter difference features that characterize electrical pylons and transformer areas. The dataset was composed of VH (Vertical-Horizontal) and VV (Vertical-Vertical) polarization modes. The analysis of these datasets was conducted using algorithms belonging to the supervised learning model, which included the support vector machine, KNN, decision tree, quadratic discriminant, and naive Bayes algorithms. The findings indicate that the support vector machine model demonstrated an 85.0% success rate, the quadratic discriminant model exhibited an 82.5% success rate, the KNN model achieved an 82.2% success rate, the decision tree model attained a 76.8% success rate, and the naive Bayes model registered a 74.0% success rate. The study demonstrates the efficacy of artificial intelligence in facilitating more precise, expeditious, and systematic control of high-voltage poles. In light of the fact that conventional methods tend to be both time-consuming and costly when it comes to the maintenance of high voltage lines, the objective of this study is to enhance the efficiency of the energy infrastructure by means of contributing to the improvement of the monitoring and maintenance processes of power transmission lines.
Introduction
High-voltage lines play an active role in the efficient transport of electrical energy over long distances, thereby increasing efficiency by minimizing energy transmission losses. The distribution of electricity is facilitated by local distribution networks, with the objective of ensuring a balanced energy supply between urban and rural regions. 1
The stability of electricity supply constitutes a fundamental prerequisite for regional development. Electricity grids serve a pivotal function in the transmission of electrical energy from centralized power plants to individual users. 2 The widespread presence of electricity poles, their diverse appearance, and the complexity of their environmental conditions have led to significant challenges in traditional field inspections, which rely on manual labor and are characterized by a considerable resource expenditure and limited temporal efficiency. UAV (Unmanned Aerial Vehicle)-based field inspections have the potential to outperform traditional methods, yet they face challenges in meeting the demands of real-time monitoring over vast areas and are vulnerable to the environmental effects of tall buildings. 3 The advent of contemporary satellite technologies has engendered a paradigm shift in the realm of environmental monitoring. These advancements have rendered satellite monitoring more pervasive and less susceptible to environmental influences. Consequently, the utilization of remote sensing and artificial intelligence techniques has emerged as a pivotal strategy for expediting and enhancing the efficacy of environmental processes. Some of the most studies using this remote sensing techniques with various shallow learning methods are summarized as follows;
Zha et al. achieved 88% accuracy with a high-precision object detection model to detect electricity poles from remote sensing images and showed that it can improve its performance even under limited data conditions. 4 Erbaş, LiDAR, an active remote sensing system that functions similarly to radar systems, utilized. Precise measurements were made by the laser device attached to the aircraft. After the regions higher than 15 m were detected in the application, a binary image was created with the values of the pixels higher than 15 m as “1” and the values of the other pixels as “0.” The analysis yielded a total of 39.17 km of high voltage lines with a height greater than 15 m. 5 Bakış investigated the Armutlu-Zeytinbağı region of the Marmara Sea, where mucilage is dense, with the Sentinel-1 satellite in May 2021. A total of 1300 points within the specified region were delineated on the Google Earth Engine (GEE) platform and subsequently transferred to the Sentinel-1 satellite. Backscatter values were obtained utilizing VV-VH band parameters, and data sets were generated from these values. Shallow learning and deep learning algorithms were applied to these data sets. The accuracy rate of the Decision Tree (DT) model applied to the VV + VH band is calculated to be 98.2%, as determined by analyzing the results of the application of shallow learning and deep learning models to the data sets. 6 Tian et al. developed deep learning-based models for the identification of electric towers in high-resolution SAR images. A total of 42 electric towers were identified in large-format images in Zhijiang City, 31 of which were located in Hubei Province, yielding a recall rate of 73.8%. It was noted that Synthetic Aperture Radar (SAR) imagery can provide higher accuracy by eliminating a high proportion of distortions in complex backgrounds. The accuracy of the results was influenced by the complexity of the background, which included the presence of power towers. Various environmental factors, such as farmland, rivers, buildings, and mountain forests, contributed to the variability of the results. Consequently, it was determined that by expanding the sample set and incorporating operations such as characteristic enhancement, the recall rate and accuracy of power tower detection can be enhanced. 7 Qiao et al. targeted the detection of electric poles. Given the inefficiencies associated with manual detection, this study proposes the implementation of deep learning methodologies for the identification of power poles within high-resolution remote sensing images. The present study involves the empirical evaluation of the performance of 10 detectors that are based on deep learning and that possess a variety of features. A comprehensive experimental study was conducted on a dataset comprising 1500 images, with a focus on assessing adaptability to complex scenarios. The experimental findings demonstrate the applicability of deep learning methodologies to the task of lamppost detection. 3 Xiong et al. demonstrated the presence of high voltage poles and lines to engender hazardous scenarios for aircraft operating at low altitudes. The solution to this problem is presented in the following proposal: a millimeter wave (MMW) radar system that utilizes Hough transform (HT) and convolutional neural network (CNN). Although HT employs straight-line extraction to identify lines, CNN utilizes deep feature extraction and learning capabilities to detect real power lines. 8 Jwa et al. emphasized that timely and accurate monitoring of high-voltage line characteristics is important to prevent potentially dangerous situations. A novel methodology, designated as Voxel-based Piece-wise Line Detector (VPLD), has been developed for the automated reconstruction of three-dimensional high voltage line models utilizing airborne LiDAR data. The study demonstrated the efficacy of the proposed VPLD approach in extracting high voltage lines from the LiDAR data set, with an average point distance of 1.4 m and a 93.8% success rate. 9 Zeybek proposed a methodology for the segmentation of high-voltage lines from three-dimensional irregular point clouds obtained with an airborne LiDAR system. Initially, the point cloud is organized, and ground filtering is applied. Subsequently, the segmented non-ground points undergo normalization with respect to ground points, and AGL (Above Ground Level) is calculated. Non-ground AGL values were rasterized, and edge detection was performed. In conclusion, the extraction of high-voltage lines was achieved through the implementation of the Hough transform approach, which was founded on 3D segmentation and 2D image processing methodologies. The detectability of high voltage lines in different terrain conditions was evaluated. 10 Ko et al. employed remote sensing to identify trees that posed a threat to high-voltage power line infrastructure. They accomplished this by calculating geometric features for trees using high-intensity laser scanner data and utilizing the Random Forest shallow learning method to classify tree species. The three-dimensional mapping capability of LiDAR was employed to derive tree metrics related to the geometry of trees. The dominant growth direction of trees is a useful tool for identifying trees that are leaning toward transmission lines. Preliminary findings indicate that trees growing within the minimum vegetation clearance distance have been identified, as have tall trees with the potential to fall over high voltage lines. 11 Acar proposed an approach to utilize shallow learning methodologies and Sentinel-1 SAR images to identify unregistered electricity distribution transformers within agricultural regions. The study was methodically structured into four primary phases: feature extraction, selection of the most suitable shallow learning technique, feature selection, and detection. In the initial phase, two backscattering parameters of VH and VV polarizations were obtained on 32 distinct dates, and a feature vector of 64 units was generated for each sample point. In the second stage, the most appropriate shallow learning technique was determined, and in the third stage, the most meaningful and effective features were selected. The detection process was executed by employing the determined technique and a curated selection of features. The employment of shallow learning methodologies enabled the successful detection of electricity distribution transformers, with an average accuracy rate of 85.47%. 12 Jamali and Parham introduced a novel digital algorithm for adaptive single pole auto-reclosing of power transmission lines, utilizing zero-sequence voltage to differentiate between arcing and permanent faults, thereby enhancing system reliability. 13 Additionally, Guo et al. employed a Multi-scale Geographically Weighted Regression (MGWR) model to analyze factors influencing port cargo throughput, revealing spatially varying impacts of macroeconomic variables and infrastructure development on port performance. 14 These studies highlight the significance of integrating spatial analysis and adaptive algorithms in infrastructure management, offering insights applicable to electrical infrastructure mapping and monitoring. Recent studies have demonstrated the effectiveness of high-resolution remote sensing data combined with machine learning for infrastructure monitoring and traffic analysis. UAV-based approaches have been used to extract precise vehicle trajectories and predict short-term traffic flow, applying ensemble detection, kernelized correlation filters, wavelet denoising, and artificial neural networks to achieve high accuracy.15,16 Similarly, high-resolution trajectory data combined with models such as SVM, Random Forest, XGBoost, and Multilayer Perceptron have been applied for safety evaluation on freeways, highlighting the influence of environmental and operational factors on risk prediction. 17 Multi-scale geographically weighted regression has been successfully employed to analyze spatially heterogeneous factors affecting port cargo throughput, emphasizing the importance of capturing local variations. 14 In the energy domain, adaptive algorithms for fault detection and auto-reclosing in high-voltage transmission lines have shown that zero-sequence voltage-based approaches can reliably distinguish between arcing and permanent faults, enhancing system reliability. 13 Fine-resolution lane-changing trajectory analysis further illustrates how microscopic data can inform traffic modeling and scenario-dependent behavior prediction. 18 Building upon these approaches, the present study employs Sentinel-1 SAR data to extract VH and VV backscatter features, derive VV–VH differences and squared differences, and apply classical machine learning models (SVM, KNN, NB, QD, DT) to accurately detect and classify electrical infrastructure (poles and transformers). This integration of high-resolution remote sensing, feature extraction, and supervised learning demonstrates the potential for replicable, scalable monitoring of energy infrastructure in diverse geographic settings.
Although deep learning approaches have been applied for pole detection in previous studies (e.g. Zha et al., 2023; Qiao et al., 2020), this study prioritizes shallow learning methods, such as SVM, KNN, NB, DT, and QD. The main reasons are the relatively small size of the available dataset, which limits the applicability of data-hungry deep learning models, the lower computational requirements of shallow learning, and the interpretability of the results, which facilitates understanding of feature importance and model behavior. This choice provides a practical and reproducible approach for electrical infrastructure mapping under constrained data conditions.
The proposed study has fundamental contributions in many aspects. The methods employed in this study diverge from those utilized in other studies documented in the extant literature. In other studies, high spatial resolution satellite images, deep learning algorithms, and LIDAR data were utilized. In this study, backscattering values obtained with Sentinel-1 SAR, VH-VV band data were organized in digital data format and shallow learning methods were applied. The classification results were then compared. The employment of shallow learning methodologies, leveraging the reflectance values of satellite imagery, yielded favorable outcomes.
The rest of the manuscript is organized as follows: the image pre-processing and data collection steps is detailed in Section II. Afterward, the experimental results on determining of the VV and VH band modes are presented in Section III. A comprehensive discussion is given in Section IV. Finally, the proposed approach is summarized in Section V.
Materials and methods
The experimental area
In the study, the province of Batman and its environs were selected as a pilot area. To identify high voltage poles in this area, a sample of 200 poles and 200 random points was selected. The geographical area under consideration is delineated in Figure 1.
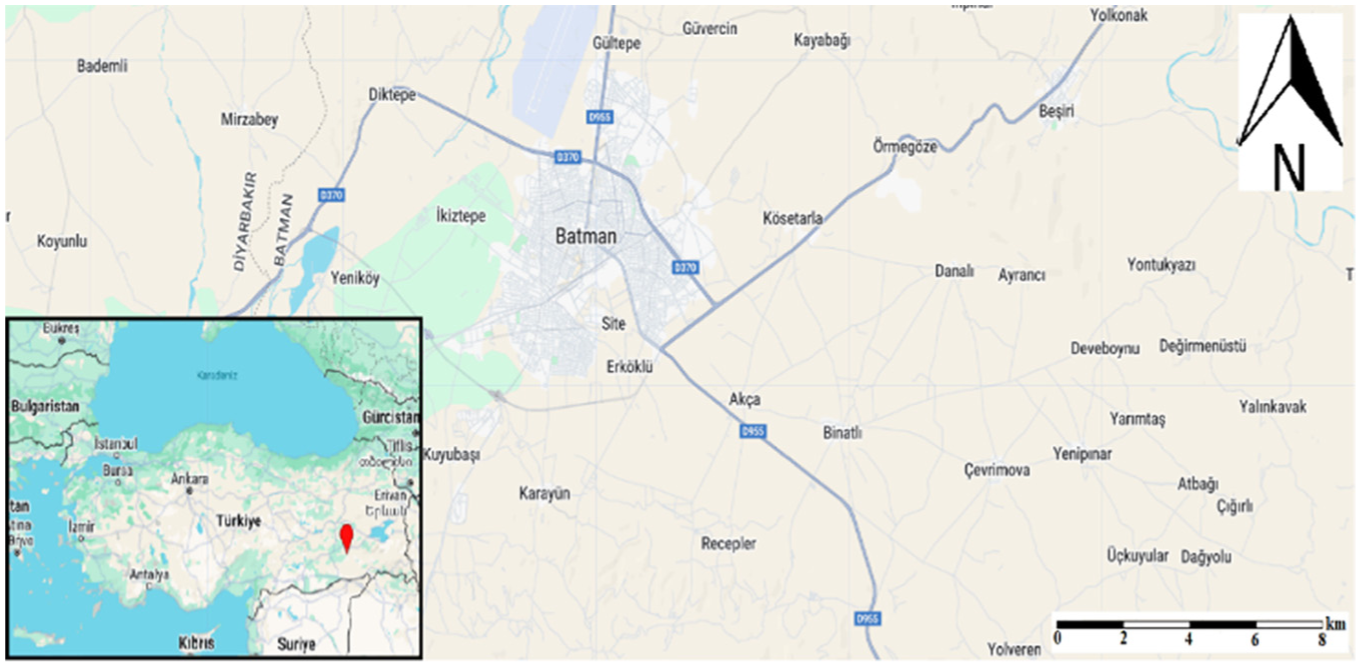
The position of the experimental area.
Sentinel-1 data pre-processing, feature extraction and data acquisition
Sentinel-1 Ground Range Detected (GRD) data (collection ID: COPERNICUS/S1_GRD) were processed using the Google Earth Engine (GEE) cloud platform. 19 The analysis covered the period from 1 January 2025 to 30 June 2025 within the defined region of interest (ROI). Both ascending and descending passes were considered to minimize geometric distortion and to capture multiple look angles.
The preprocessing chain implemented in GEE follows the European Space Agency (ESA) Sentinel-1 GRD standard workflow (Filipponi, 2019) and includes:
Thermal noise removal: elimination of additive noise present in the GRD product.
Radiometric calibration: conversion of DN values to sigma-naught (σ0) backscatter coefficients (in decibels).
Terrain correction: application of Range–Doppler orthorectification using the SRTM 30 m DEM to project the data to ground range (WGS84/UTM).
Border noise masking: removal of edge artifacts using the ESA Sentinel-1 mask layer.
Dual-polarization channels (VV and VH) were separately extracted and filtered according to orbit direction (ASCENDING and DESCENDING) using metadata filters:
instrumentMode = IW (Interferometric Wide Swath)
orbitProperties_pass = ASCENDING or DESCENDING
transmitterReceiverPolarisation = VV and VH
For each orbit and polarization, temporal median composites were computed to reduce speckle noise and represent the average backscatter characteristics across the time window. 20 The resulting median composites were visualized using a backscatter range of −25 dB to −9 dB for VH and −16 dB to −3 dB for VV.
Additional features were derived from the median Sentinel-1 VV and VH composites to enhance the detection of electrical infrastructure. The backscatter difference (Δσ0 = VH – VV) was computed to emphasize structural and dielectric contrasts, as VH polarization is more sensitive to complex and vertically oriented metallic elements, while VV responds mainly to smoother surfaces. In addition, the squared difference (Δσ02) was calculated to accentuate strong scattering anomalies typically associated with metallic structures such as transmission pylons and transformers. These derived layers were subsequently integrated as input features for the classification and interpretation of electrical infrastructure areas, ensuring consistent and reproducible processing within the Google Earth Engine (GEE) environment.
Synthetic aperture radar (SAR) imagery plays a critical role in object detection by leveraging the reflection properties of microwave waves to provide high-resolution images in variable weather conditions. 21 This technology boasts significant advantages over optical imaging methods. SAR utilizes reflected microwave signals to identify and analyze natural variations in targets, such as size and structure. 22 In circumstances where meteorological conditions impede the acquisition of optical data, the utilization of SAR (synthetic aperture radar) imagery proves to be a particularly advantageous approach. In contrast to optical satellites, SAR satellites possess the capability to provide clear and continuous imagery, even in cloudy weather conditions. This enhancement of SAR’s capacity for effective data collection in a variety of challenging environmental conditions has been demonstrated (Sameen et al.). Furthermore, Sentinel-1 SAR images have the capacity to provide day and night data. 23 Sentine-1 Satellite VV and VH band images of the selected experimental area are given in Figure 2.
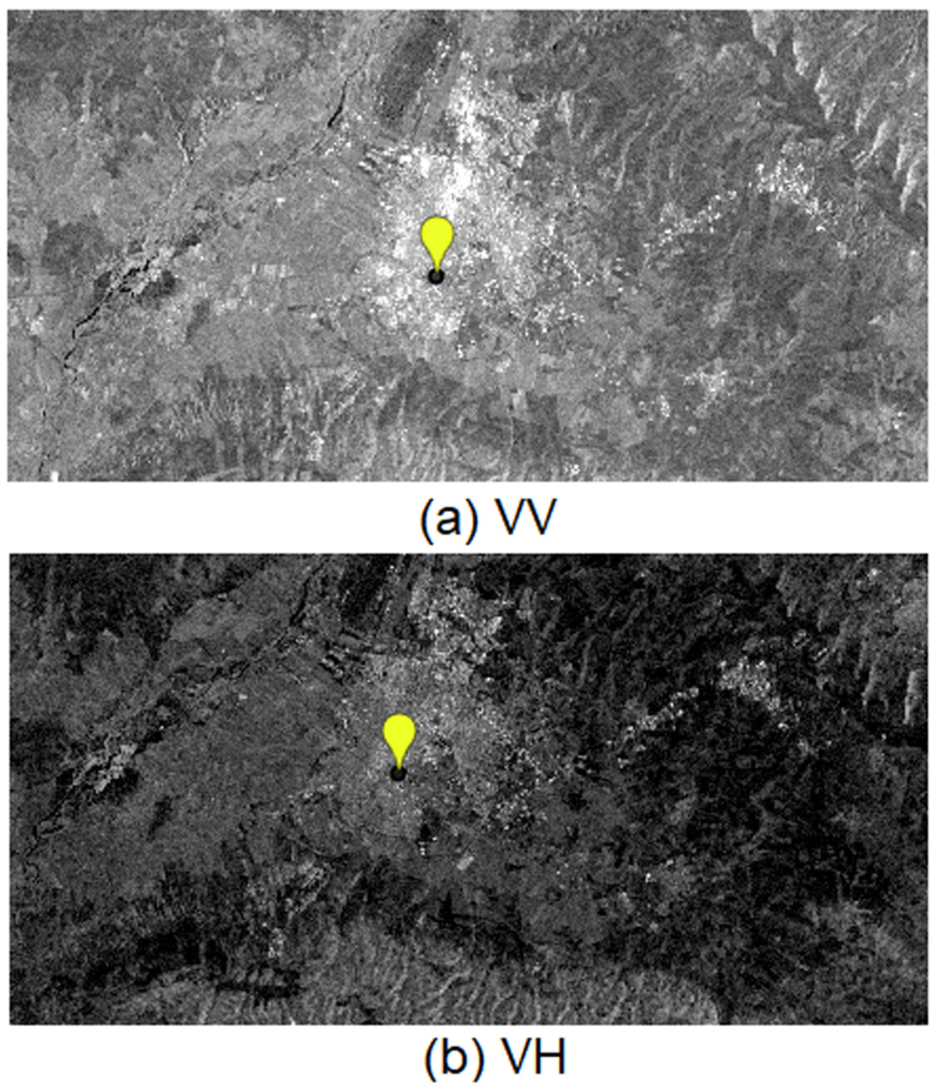
Sentine-1 satellite VV and VH band images of the selected experimental area.
Sampling points selection
A total of 400 sample points were selected within the study area, consisting of 200 pole locations and 200 background points. The screening criteria and labeling rationale for pole points involved visual interpretation of high-resolution Google Earth imagery, cross-referencing with the OpenStreetMap Humanitarian layer, and on-site verification using a Garmin GPSMAP 60CSx device to ensure spatial accuracy. The background points were randomly generated within the region of interest while avoiding overlap with known infrastructure areas. This process ensured that all sample points were accurately labeled, representative of the landscape, and suitable for subsequent machine learning analysis. The resulting dataset provides a validated foundation for training and evaluating models, supporting both classification and interpretation of radar backscatter features associated with electrical infrastructure.
The constructed dataset was divided into four subgroups using the K-fold cross validation method (K = 4). In each iteration, onefold was used as a validation set while the remaining threefolds were employed for training, ensuring that each fold served as validation once. The K value was also tested with different settings in preliminary experiments to optimize overall model performance. This procedure allows for reliable assessment of the models’ generalization ability beyond the training data, and the dataset was subsequently used to train and evaluate various shallow learning models including SVM, KNN, NB, QD, and DT.
Ground data collection
The GEE platform was utilized to detect high voltage poles in and around Batman province, employing Sentinel-1 satellite imagery. Poles and random points were identified and selected in the images obtained, and the relevant polarization backscattering values were obtained using this platform. In the context of Sentinel-1 satellite imagery, a sample of 400 points was meticulously selected, with 200 of these points representing masts and the remaining 200 points selected at random. The satellite image of the selected points is displayed in Figure 3.
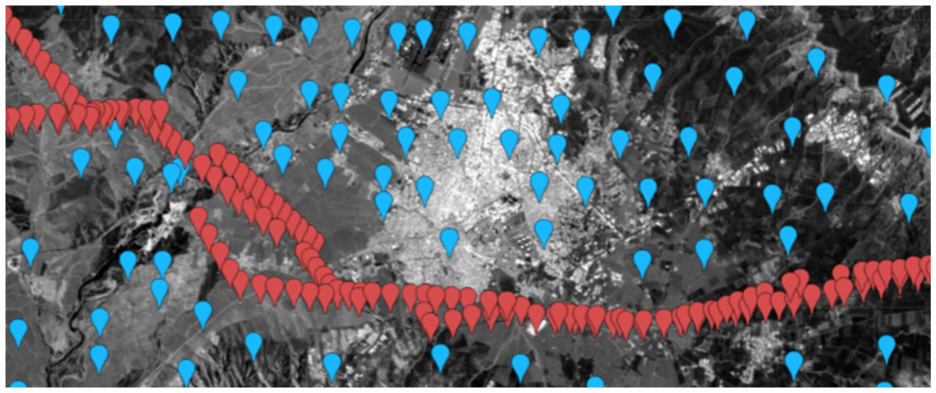
Importing of the geographical coordinates of 200 different high-voltage poles (red points) and 200 non-high-voltage poles (yellow points) into the color Sentinel-1 image.
Shallow learning
Shallow learning is an inevitable system during the progress of artificial intelligence studies. 24 A system that is in a changing enviromental should have the ability to learn; if it is keeps on making the same mistakes over and over, we will hardly call it intelligent. 25 Machine learning techniques are providing additional tools for aiding the construction of high-performance expert systems. 26
In this study, five shallow learning models were used. These models are SVM, NB, DT, KNN, QD.
Support vector machine (SVM)
Support Vector Machine (SVM) is an approach based on statistical learning and supervised learning. The working principle of SVM is based on estimating the optimal decision function that can best separate two classes. This is achieved by defining a hyperplane that optimally separates the two classes. 27 This method was developed for use in classification and curve fitting problems by minimizing structural risk. 28 SVM aims to find the optimal boundary that separates two classes and maximizes the margin between support vectors. The SVM classifier is binary in nature and determines a single boundary between two classes. However, this problem can be overcome by repeatedly applying the classifier for each possible combination of classes, in which case the processing time increases exponentially as the number of classes increases. 29
The SVM model was implemented using MATLAB’s fitcsvm function with default parameters. A linear kernel (KernelFunction = “linear”) was used, with a box constraint of 1 (BoxConstraint = 1) and no feature standardization (Standardize = false). These settings provide a baseline for linear separation of classes.
Naïve Bayes (NB)
Bayesian classification is a widely employed shallow learning classification approach. As the name suggests, the objective of a Bayesian classifier is to ascertain conditional probabilities of classes based on attributes. The most prevalent Bayes classifier is the Naïve Bayes (NB) classifier. This particular classifier is designated as “Naïve” due to the assumption that the attributes are independent of each other. Algorithms that incorporate the relationship between attributes in the calculation of conditional probability are non-Naïve or semi-Naïve Bayes classifiers. 30 Bayes’ theorem is a conditional calculation formula invented by Thomas Bayes in 1812. It finds the probability of an event occurring given the probability of another event occurring that has already occurred. Bayes’ theorem is mathematically expressed as follows. 31
Gaussian Naive Bayes was used with the default DistributionNames = “normal.” The Width parameter, controlling kernel smoothing if applicable, was left automatic. This approach assumes normally distributed features and provides a probabilistic classification baseline.
Decision tree (DT)
Decision tree algorithms are among the heuristically simplest classifiers. The decision tree algorithm is an iterative partitioning of input data. 32 This method is used in various fields such as shallow learning, pattern recognition, and statistics. Researchers propose to extend decision trees to various data sets and use them in many application areas such as medical disease analysis, text classification, smartphone user classification, and image processing. The widespread use of this method has attracted attention due to the clarity and accuracy it provides in data analysis and classification problems. Decision trees are effective tools that reveal the hierarchical structure of data, thus enabling more in-depth analysis of data. 33
Decision Trees were implemented using MATLAB’s fitctree function with Gini’s diversity index as the split criterion (SplitCriterion = “gdi”). The maximum number of splits was set to the default (MaxNumSplits = size(data,1)-1), and the minimum number of observations per leaf was 1 (MinLeafSize = 1). These parameters allow the tree to grow sufficiently to capture patterns in the data while maintaining interpretability.
K-nearest neighbor (K-NN)
The K-Nearest Neighbor (K-NN) algorithm is a fundamental and effective method for data discrimination, especially when working with uncertain data. Developed in 1951 by Fix and Joseph Hodges, this algorithm is used when it is difficult to determine probability densities by parametric estimation. 34 Although the K-NN algorithm can be used for both classification and regression tasks, it is mainly preferred for object classification. It is also a very useful algorithm for imputing missing values and resampling data. The “K” in K-NN refers to the number of neighbors of the new data point, and correctly determining this value is the most critical step of the algorithm. Choosing the right value is necessary to achieve better accuracy, and this process is called “parameter tuning.” Too low a K value (e.g. 1 or 2) can lead to noisy results, while too high a K value can sometimes cause confusion depending on the data set. 35 In this model, various distance calculation algorithms are available and Euclidean, Manhattan, Chebyshev, Hamming, Minkowski, Manahalobis, Havarsiene, Levenshtein, Sorensen-Dice, Jacckard are the distance calculation algorithms for K-NN model. 6
KNN classification was performed with the number of neighbors set to 4 (NumNeighbors = 4) to balance bias and variance, based on cross-validation experiments. The Euclidean distance metric (Distance = “Euclidean”) and uniform weighting (DistanceWeight = “Equal”) were applied. This configuration allows the model to consider the nearest four neighbors equally when assigning class labels.
Quadratic discriminant algorithm (QDA)
One of the standard approaches to supervised classification problems is the quadratic discriminant (QD) method. QD works by modeling the probability distribution of each class as a Gaussian (normal) distribution. 36 In this method, posterior distributions are used to predict the class for a given test point. QD classifies using non-linear cutoffs and assumes that the covariance matrix of each class is different. These features make QD an effective classification method for heterogeneous data sets.
QD is a powerful technique used in shallow learning to solve classification problems. In particular, QD is used to classify data points into different classes and works effectively when each class has different covariance matrices. QD generates discriminant functions for each class, and these functions determine which class the data points belong to. The discriminant functions are calculated using the means and covariance matrices of the classes.
Quadratic Discriminant Analysis used default regularization parameters (Gamma = 0, Delta = 0) to stabilize covariance estimates. This model computes class-specific covariance matrices to allow quadratic decision boundaries, suitable for distinguishing classes with non-linear separability.
Statistical metrics
Five performance metrics were computed for proposed system by employing the following equations. Furthermore, confusion matrix, ROC curve and Accuracy Graphs were used for demonstrating the success of shallow learning methods used.


Here, TP, TN FP, and FN represent true positive, true negative, false positive, and false negative numbers, respectively.
Result and discussion
In the study, the Batman province and its environs were selected as the pilot area. The objective of the study was to detect the high-voltage poles in the vicinity of Batman. The GEE platform was utilized to manually detect high-voltage poles in and around Batman province. This process resulted in the creation of a data set comprising backscattering values derived from Sentinel-1 SAR satellite VH and VV polarizations. The generated data set was then divided into subgroups through the implementation of the K-fold cross-validation method. In this process, the objective was to maximize the success of the system by modifying the K value. In this study, K value was set to 4, and the dataset was employed to train various shallow learning models. The data set was analyzed using different shallow learning methods (SVM, KNN, NB, QD, DT) and the most successful methods were determined according to the results. The image of a selected sample pole is presented in Figure 4.
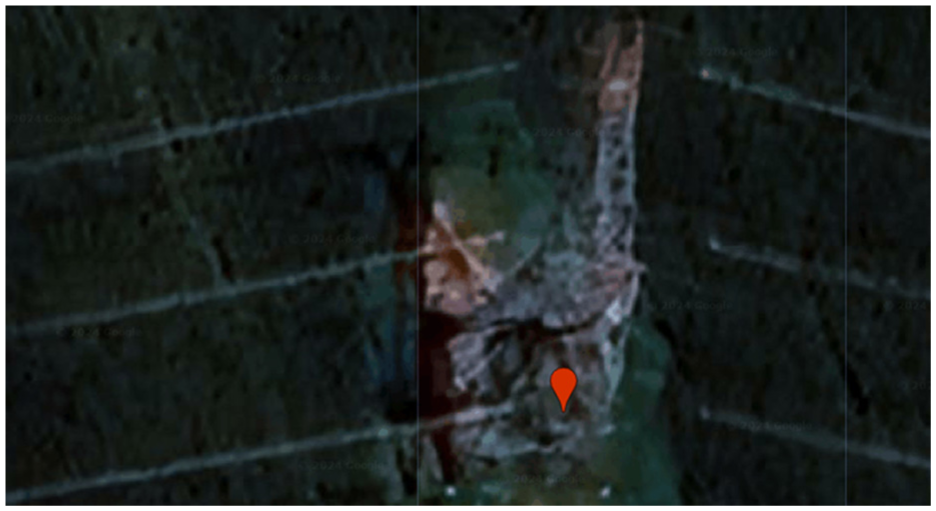
The image of a selected sample pole.
Obtaining results on VH polarization descending trajectory
In this stage, the Sentinel-1 satellite VH polarization dataset of 200 high voltage poles and 200 randomly selected points was created using the GEE platform. A variety of shallow learning methodologies were employed to analyze the dataset, including DT, NB, KNN, QD, and SVM. A subsequent analysis of these results indicates that shallow learning methods, including DT, NB, KNN, QD, and SVM, demonstrate higher levels of efficacy in comparison to alternative methods. The most efficacious method is the Support Vector Machine model, which has achieved a 69.5% success rate. The confusion matrix and ROC curve of the SVM model with the highest accuracy are shown in Figure 5, respectively. In addition, the comparison results of the shallow learning methods employed in the study are presented in Table 1.
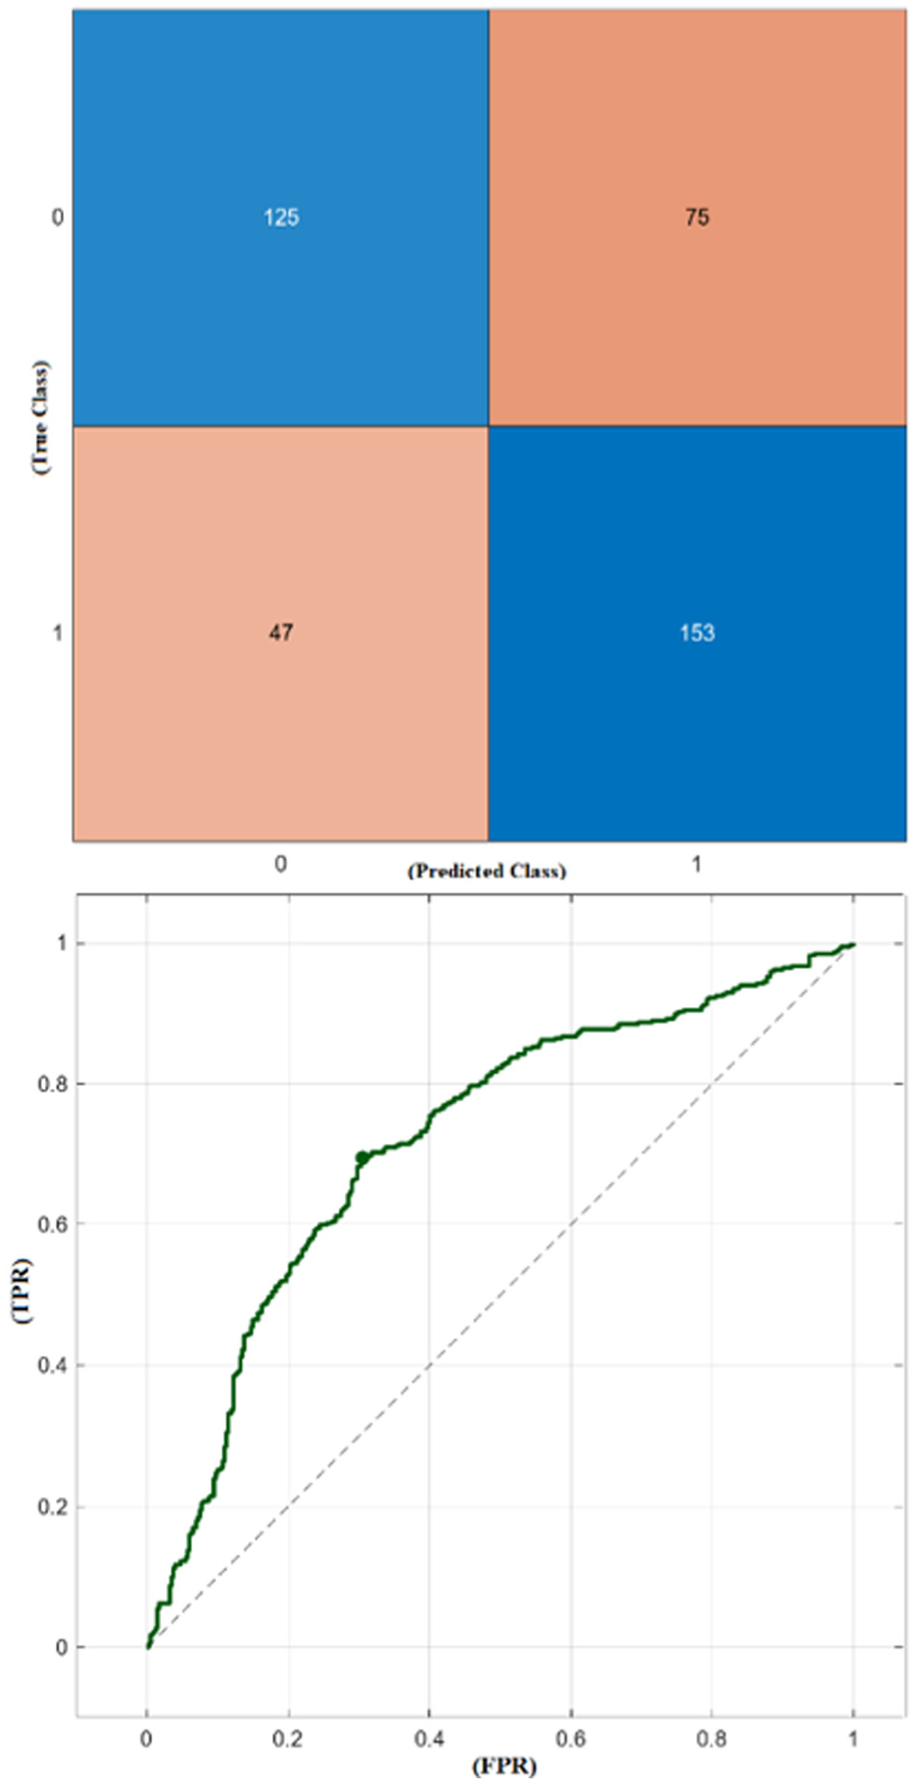
The confusion matrix and ROC curve of the SVM model with VH polarization descending trajectory, respectively.
The comparison results of the shallow learning methods for descending VH polarization.
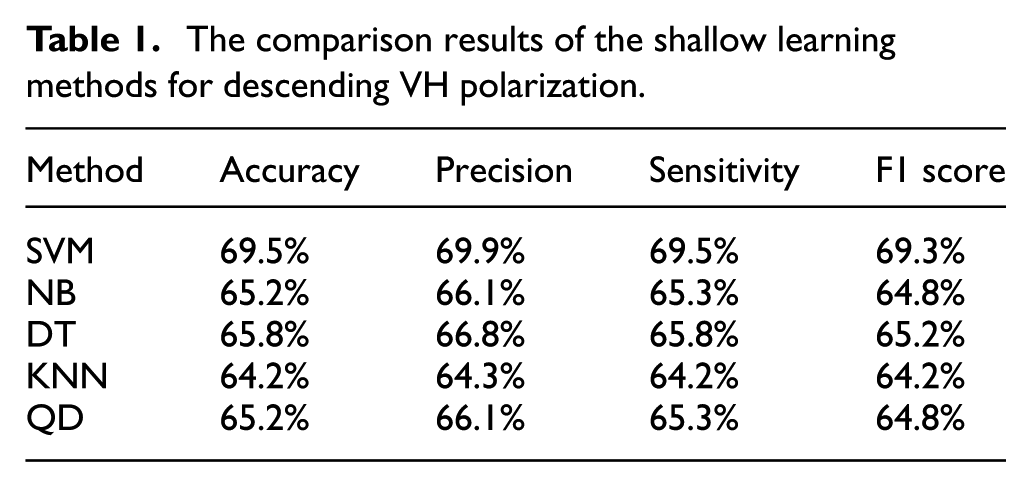
Obtaining results on VH polarization ascending trajectory
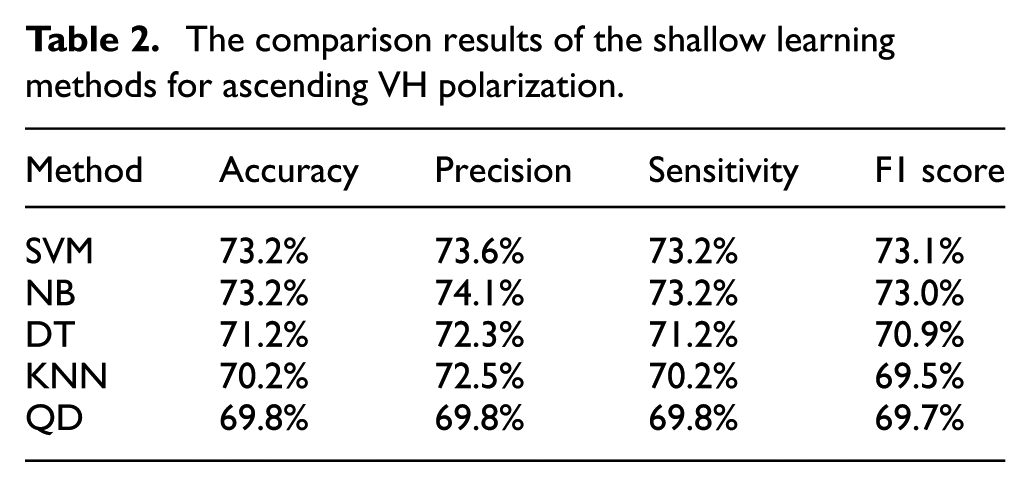
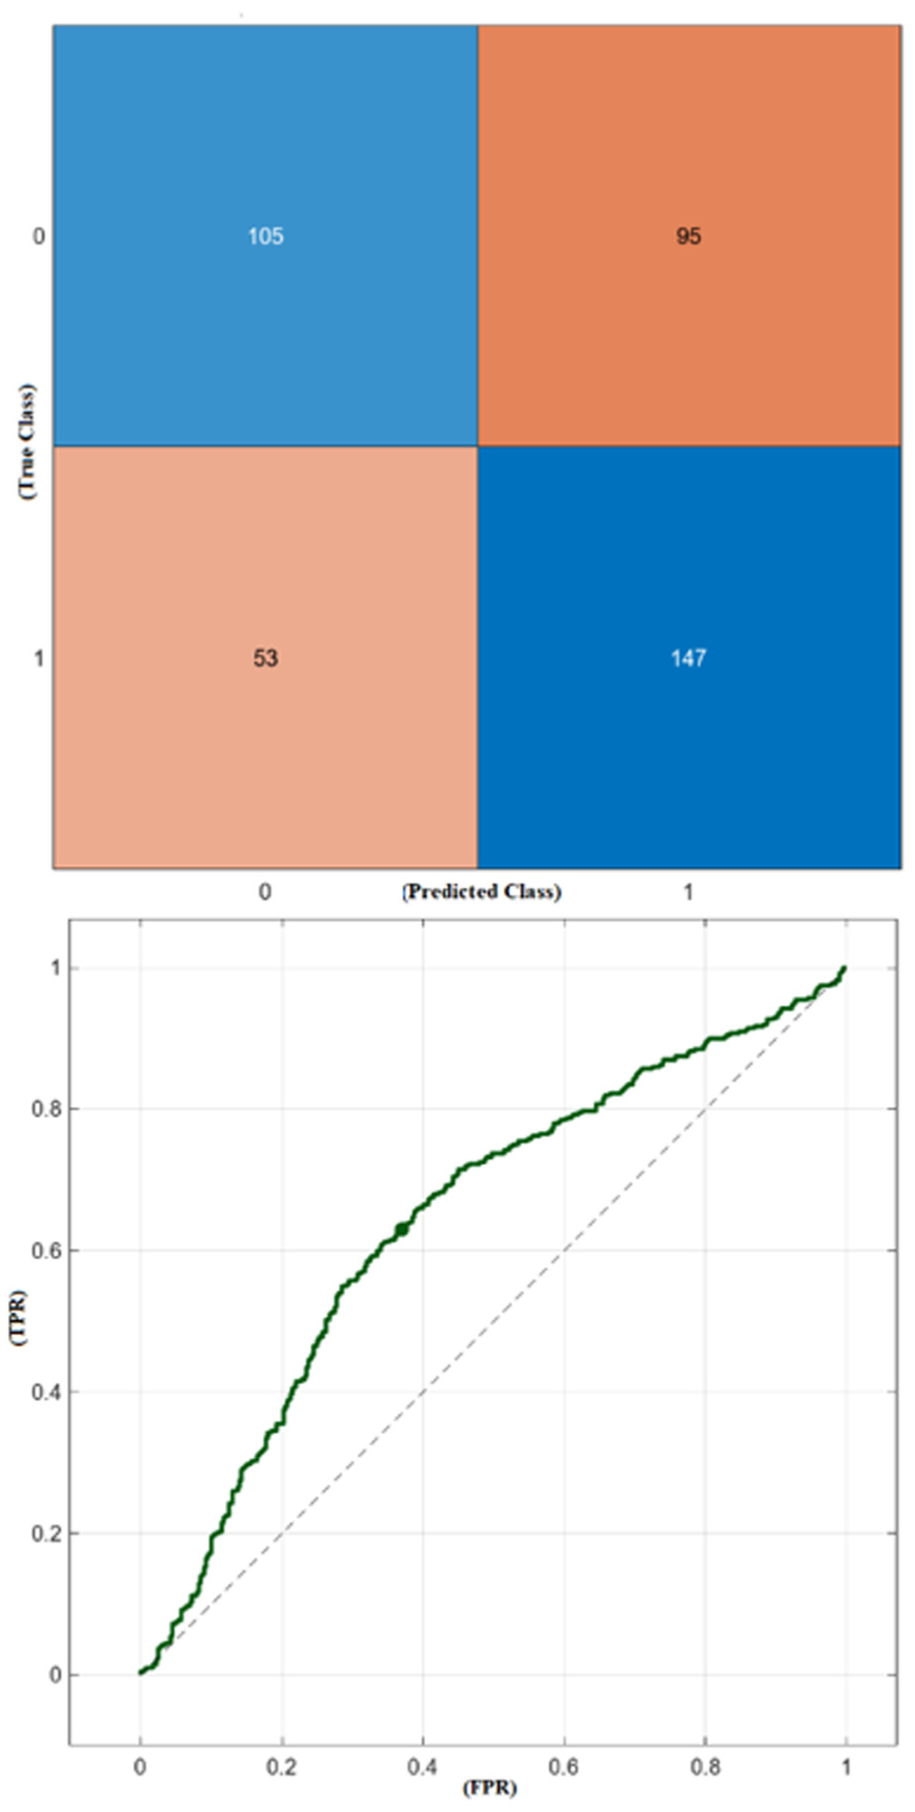
In this step, the Sentinel-1 satellite VH polarization dataset of 200 high voltage poles and 200 randomly selected points was created using the GEE platform. A variety of shallow learning methodologies were employed to analyze the dataset, including DT, NB, KNN, QD, and SVM. A subsequent analysis of these results indicates that shallow learning methods, including DT, NB, KNN, QD, and SVM, indicate higher levels of efficacy in comparison to other methods. The most efficacious method is the Support Vector Machine model, which has achieved a 73.2% success rate. The confusion matrix and ROC curve of the SVM model with the highest accuracy are shown in Figure 6, respectively. In addition, the comparison results of the shallow learning methods employed in the study are presented in Table 2.
The confusion matrix and ROC curve of the SVM model with VH polarization ascending trajectory, respectively.
The comparison results of the shallow learning methods for ascending VH polarization.
Obtaining results on VV polarization descending trajectory
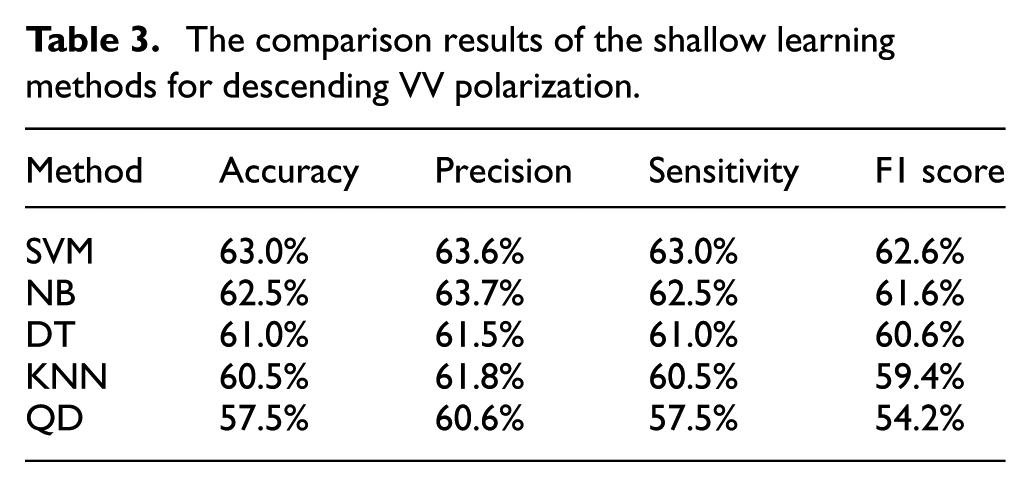
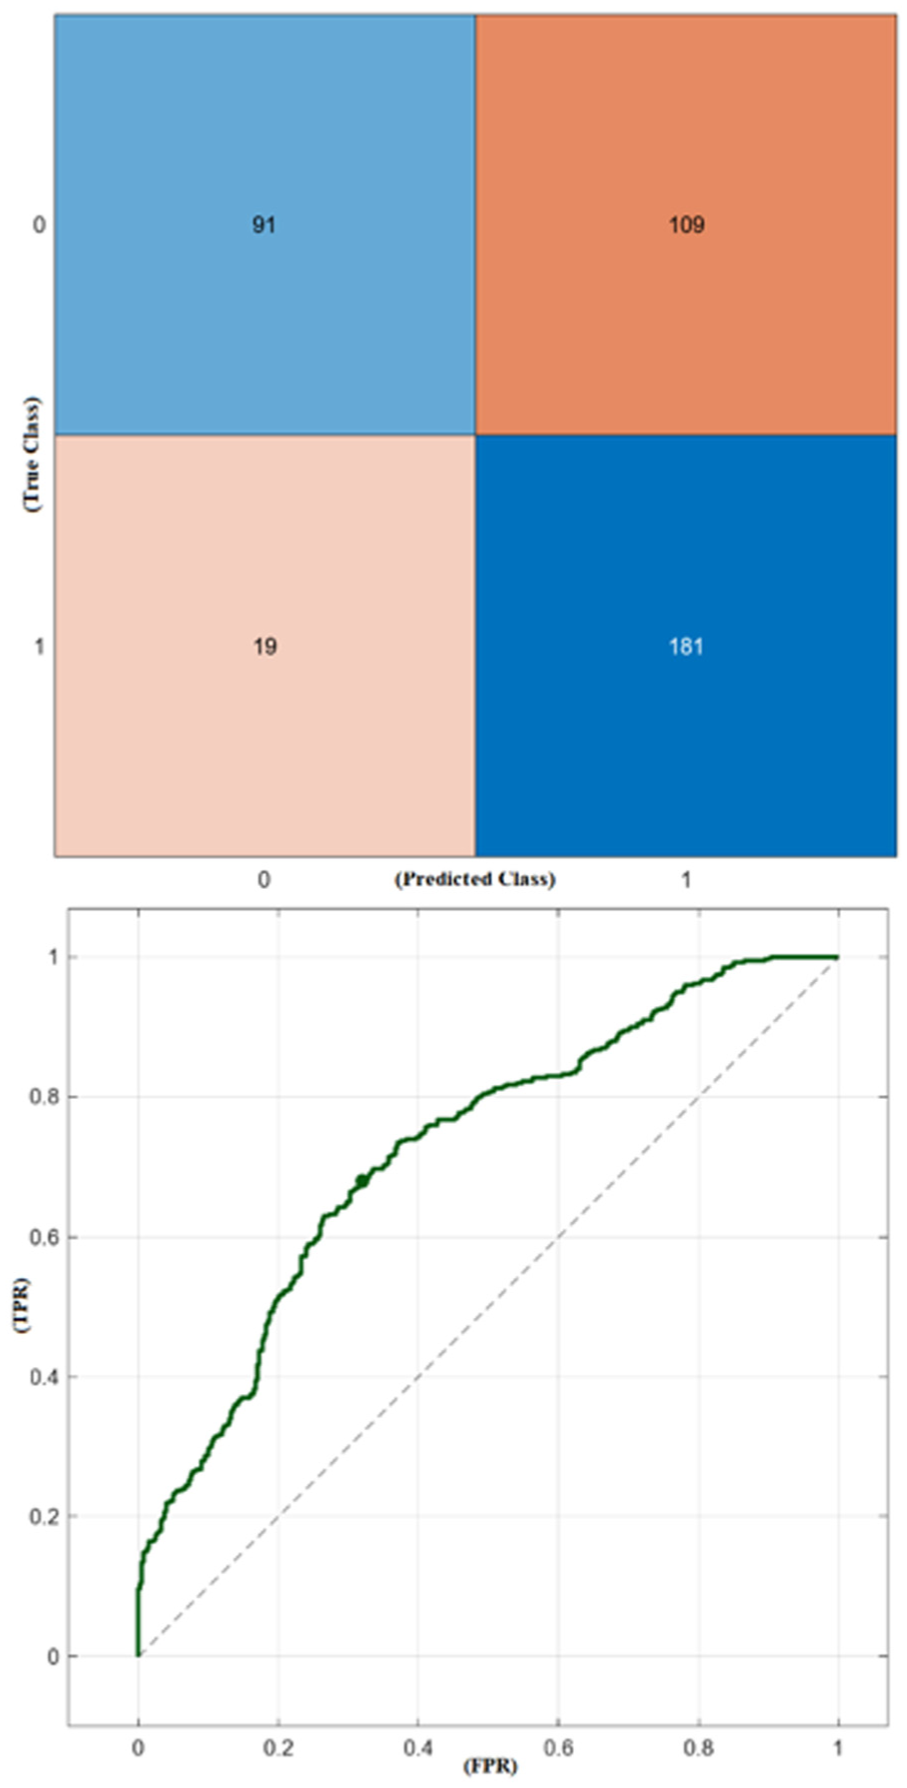
In this phase, the Sentinel-1 satellite VV polarization dataset of 200 high voltage poles and 200 randomly selected points was created using the GEE platform. A variety of shallow learning methodologies were employed to analyze the dataset, including DT, NB, KNN, QD, and SVM. A subsequent analysis of these results indicates that shallow learning methods, including DT, NB, KNN, QD, and SVM, show higher levels of efficacy in comparison to alternative methods. The most succesfull method is the Support Vector Machine model, which has achieved a 63.0% accuracy rate. The confusion matrix and ROC curve of the SVM model with the highest accuracy are shown in Figure 7, respectively. In addition, the comparison results of the shallow learning methods employed in the study are presented in Table 3.
The confusion matrix and ROC curve of the SVM model with VV polarization descending trajectory, respectively.
The comparison results of the shallow learning methods for descending VV polarization.
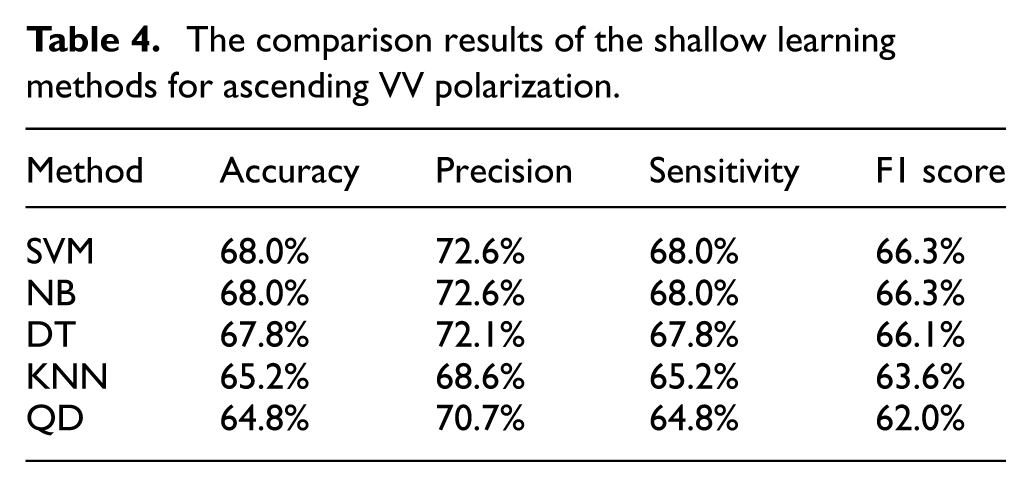
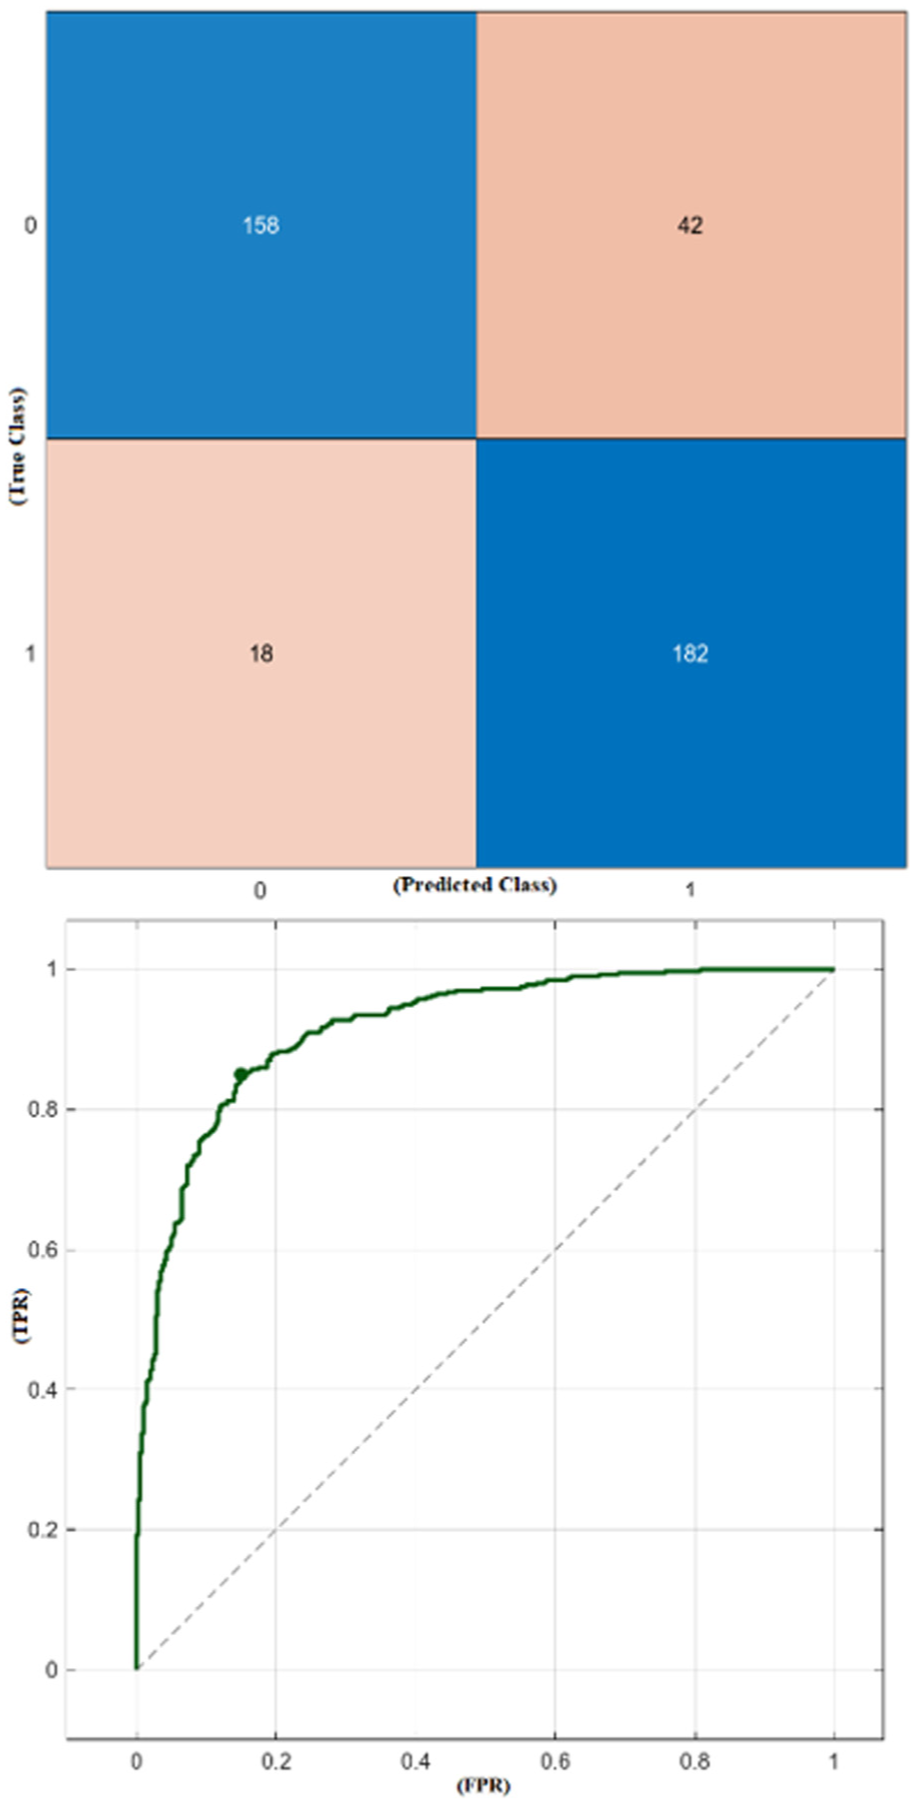
Obtaining results on VV polarization ascending trajectory
In this chapter, the Sentinel-1 satellite VV polarization dataset of 200 high voltage poles and 200 randomly selected points was created using the GEE platform. A variety of shallow learning methodologies were employed to analyze the dataset, including DT, NB, KNN, QD, and SVM. A subsequent analysis of these results indicates that shallow learning methods, including DT, NB, KNN, QD, and SVM, give information about higher levels of efficacy in comparison to alternative methods. The most efficacious methods is the Quadratic Discriminant (QD) and Naïve Bayes (NB) models, which have achieved a 68.0% success rate. The confusion matrix and ROC curve of the QD model with the highest accuracy are shown in Figure 8, respectively. In addition, the comparison results of the shallow learning methods employed in the study are presented in Table 4.
The confusion matrix and ROC curve of the QD model with VV polarization ascending trajectory, respectively.
The comparison results of the shallow learning methods for ascending VV polarization.
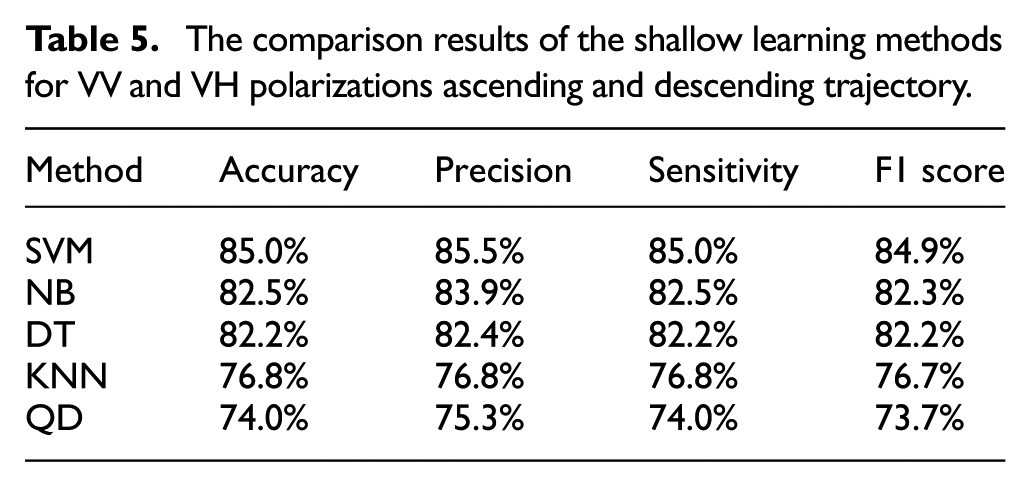
Obtaining results on VV and VH polarizations combined ascending and descending trajectory
In this stage, the Sentinel-1 satellite VH and VH polarizations dataset of 200 high voltage poles and 200 randomly selected points was created using the GEE platform. A variety of shallow learning methodologies were employed to analyze the dataset, including DT, NB, KNN,
QD, and SVM. A subsequent analysis of these results indicates that shallow learning methods, including DT, NB, KNN, QD, and SVM, show higher levels of efficacy in comparison to alternative methods. The most efficacious method is the Support Vector Machine model, which has achieved a 85.0% success rate. The confusion matrix and ROC curve of the SVM model with the highest accuracy are shown in Figure 9, respectively. In addition, the comparison results of the shallow learning methods employed in the study are presented in Table 5.
The confusion matrix and ROC curve of the SVM model with VV and VH polarizations ascending and descending trajectory, respectively.
The comparison results of the shallow learning methods for VV and VH polarizations ascending and descending trajectory.
Proposed approach
The block diagram of propesed approach is demonsrated in Figure 10.
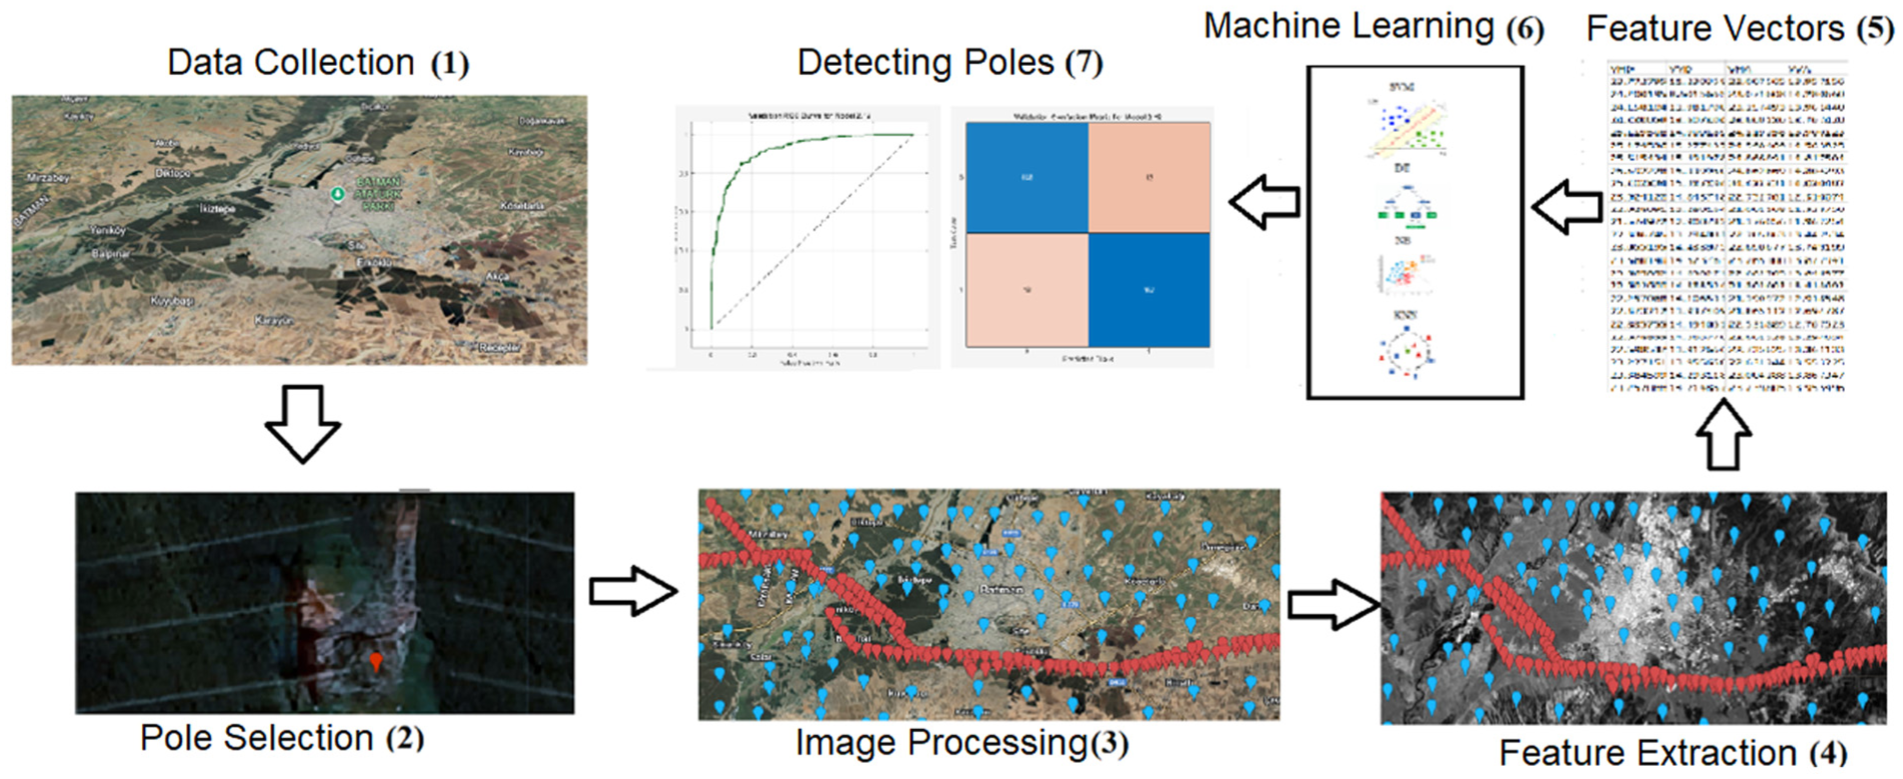
Work flow diagram of proposed approach.
The work flow chart consists of the following stages:
Using Sentinel-1 satellite as a remote sensing method
Detection of high voltage poles via this satellite
Processing of the data received from this area
Feature extraction from processed data
Determination of feature vectors
Application of shallow learning methods to the obtained data sets
Identification and analysis of the poles as a result of the applied methods
Conclusion
The research question, which was determined to be the subject of the study, was as follows: “Can artificial intelligence be used to detect high-voltage line poles and analyze band values by shallow learning method from Sentinel-1 satellite images using remote sensing?” The study concluded that this is indeed possible by using remote sensing methods and artificial intelligence. The utilization of remote sensing methodologies and artificial intelligence has become increasingly prevalent in recent times. The study places particular emphasis on the use of remote sensing methodologies and artificial intelligence in the identification of high voltage line poles.
In this study, Sentinel-1 satellite imagery and shallow learning techniques are employed to detect high voltage line poles in and around Batman province. The primary objective of the present study is to demonstrate the potential of remote sensing and shallow learning methods for safe and efficient monitoring and maintenance of power transmission lines.
The findings indicate that the integration of remote sensing data and shallow learning algorithms is a highly effective approach for identifying high voltage line poles with a high degree of precision. It was determined that the methods employed offer time and cost efficiency for pole detection, while minimizing human intervention and reducing operational risks.
The study’s findings suggest that the proposed model has the potential to provide innovative and effective solutions in the management of energy infrastructure. Furthermore, the findings substantiate the viability and dependability of the developed methodologies for the routine monitoring and maintenance of power transmission lines. This study can serve as a reference for similar applications in the energy sector in the future and can contribute to the development of new approaches in the management of energy transmission lines.
The applicability of the proposed methods within the scope of the research should be examined in different geographical regions and under different climatic conditions. The findings should be supported by larger-scale studies. Consequently, more comprehensive and generalizable solutions for monitoring and maintenance of energy transmission lines can be provided and disseminated.
This study presents a robust framework for detecting and analyzing electrical infrastructure using Sentinel-1 SAR data combined with machine learning approaches. Key contributions include the implementation of a reproducible preprocessing workflow in Google Earth Engine, the creation of a validated sample dataset integrating high-resolution satellite imagery, OpenStreetMap Humanitarian data, and field GPS verification, and the derivation of radar features such as VV–VH backscatter difference and squared difference to enhance the identification of poles and transformers. The proposed methodology demonstrates high reliability in classifying infrastructure elements and offers practical applications for monitoring electrical networks, supporting maintenance planning, and assessing structural risk. Overall, the study highlights both the scientific significance and real-world applicability of the approach, providing a foundation for future research and operational deployment in infrastructure management.
Although the study demonstrates promising results in Batman, Turkey, the generalization of the proposed methodology to other geographical regions remains to be evaluated. Applying the approach to areas with different terrain, climate conditions, or pole densities would further validate its broader applicability for global energy infrastructure management. It should be noted, however, that in hilly or elevated regions, the backscatter values measured by Sentinel-1 may be affected by terrain-induced distortions, potentially leading to less accurate detection of electrical infrastructure. Future studies should consider incorporating terrain correction refinements or complementary datasets to improve performance in such areas, ensuring more robust and reliable mapping across diverse landscapes.
The dataset of 400 points (200 positives and 200 negatives) is relatively small, which may increase the risk of high variance, overfitting, and optimistic evaluation bias. To address this, K-fold cross validation (K = 4) was applied to assess model performance across independent subsets of the data, providing a more reliable estimate of generalization ability. The dataset was carefully constructed and validated using high-resolution satellite imagery, OpenStreetMap data, and field GPS verification to ensure representativeness. Future studies should focus on expanding the dataset to include additional regions and infrastructure types, which would further improve model robustness and reduce potential evaluation bias.
In the future, the proposed approach will be refined through the integration of diverse satellite images and deep learning techniques, thereby enhancing its performance.
Footnotes
Appendix
Acknowledgements
The authors wish to thank the Dicle Electricity Distribution Company.
Ethics Considerations
This study did not involve human participants, animals, or personally identifiable data. Therefore, ethical approval was not required. All data used in this study were obtained from publicly available sources, specifically the Sentinel-1 SAR datasets provided by the European Space Agency (ESA) under an open-access license.
Consent Statement
Informed consent was not required for this study, as no human participants were involved.
Author contributions
Hasan S: Methodology, Research, Conceptualization, Writing, Data Collection. Acar E: Conceptualization, Writing, Review, Supervision. M Cengiz Arslanoglu: Research, Supervision, Editing&Controlling. Bakış E: Review, Research, Language Embellishment. Yılmaz M: Conceptualization, Review, Supervision.
Funding
The authors received no financial support for the research, authorship, and/or publication of this article.
Declaration of conflicting interests
The authors declared no potential conflicts of interest with respect to the research, authorship, and/or publication of this article.
Data availability statement
The experimental data of this work are available from the corresponding author upon request.