
Abstract
In response to the problem of low accuracy in traditional power metering equipment. Driven by the goal of carbon neutrality, This article has designed a high-precision carbon meter based on Time Division Multiplier (TDM) energy metering chip. The design scheme adopts frequency domain analysis method to quantify the errors in TDM structure, eliminating phase shift errors using a modulator with a phase compensation branch; Simultaneously constructed a dynamic carbon emission measurement model for a stepped electric energy meter group, Its principle is to divide the output of the power meter group into multiple intervals, with different carbon emission factors in each interval, to simulate the fluctuation of carbon emission factor values under different output states of the power meter group, and accurately calculate the total carbon emissions of the system; Finally, use LED to display all values. Through experimental verification, the design scheme proposed in this article can effectively achieve power metering driven by carbon neutrality, with an accuracy of 92%.
Introduction
With the increasingly severe global climate change, carbon neutrality has become a global focus of attention. In order to achieve the goal of carbon neutrality, China has put forward a series of policies and measures, including optimizing energy structure, improving energy utilization efficiency, and clean energy. As an important part of China’s energy system, the carbon emissions of power industry account for more than half of the total emissions in China, so the carbon-neutral transformation of power industry is of great significance to achieve the goal of carbon neutrality in China.
Driven by the goal of carbon neutrality, the power industry will face a series of challenges. Among which power and measurement accuracy are the key links. Accuracy of power and measurement mainly includes accurate measurement and calculation of power generation, load forecasting, power grid operation, and so on. Under the background of carbon neutrality, the importance of electricity and measurement accuracy has become increasingly prominent.
In the existing technology, the literature 1 real time monitoring, waveform harmonic elimination, anti-theft detection, and load forecasting of smart meters through integration with the Internet of Things. Fourier analysis is used to decompose harmonics, and distortion is reduced by 30% through sensor technology. The study also used anti-theft algorithms to identify abnormal situations by comparing the total electricity consumption with the electricity consumption of individual meters. Using Long Short Term Memory (LSTM) neural network for next day’s load forecasting, although this method can control the absolute percentage error within 7.56%. But carbon emissions were not taken into account, and resulting in a large amount of data calculation. Literature 2 has used maximum likelihood method to train and extract features from the obtained data information, which can achieve good classification performance. It also constructs a precise judgment function through XGBoost algorithm to improve the search ability of hyperparameter data. It can also improve the accurate judgment ability of energy meter measurement errors and achieve intelligent energy meter measurement error detection. However, this method is prone to misjudging data information. Literature 3 has used deep learning algorithm to comprehensively evaluate the online operation status of equipment such as information dispatching, electric energy metering point management and distribution, and realizes the dynamic operation and fault diagnosis of power metering equipment, but it did not perform well in dealing with small sample problems. Literature 4 has studied smart meter technology in electric energy metering, but the obtained data accuracy was relatively low.
Based on the above-mentioned shortcomings, this paper adopts the high-precision analog electric energy metering chip of TDM and a dynamic carbon emission metering model of stepped Electric energy meter group to finally realize design of high-precision carbon meter equipment-high-precision electric carbon meter. In short, the accuracy of power and measurement driven by carbon neutrality is of great significance to achieve the goal of carbon neutrality in China This article will discuss the key technical challenges and trends of power and measurement accuracy in depth in order to provide reference for the carbon neutral transformation of China’s power industry.
Integrated design of electric energy meter
The innovation of this study is to use the frequency domain of the multiplier to get the error value that affects the performance of the multiplier. A high-precision electric carbon meter based on TDM electric energy metering chip is proposed, which effectively improves the accuracy of electric energy metering driven by carbon neutrality. 5 Made significant contributions to achieving more convenient grid control and refined energy management.
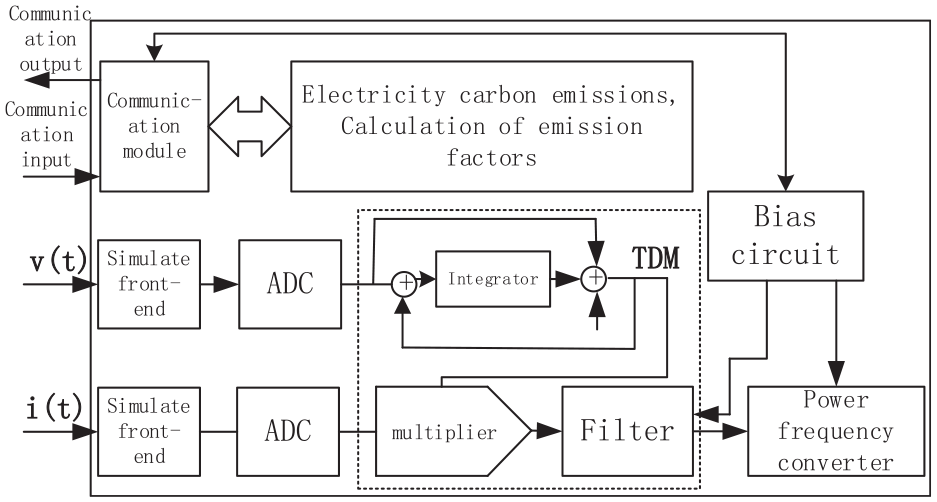
According to the definition of electric energy, two physical quantities, power P and time T, are needed to measure the electric energy consumed on a certain load In essence, watt-hour meter mainly measures the power on the load The integrated design principle of electric energy meter is shown in Figure 1
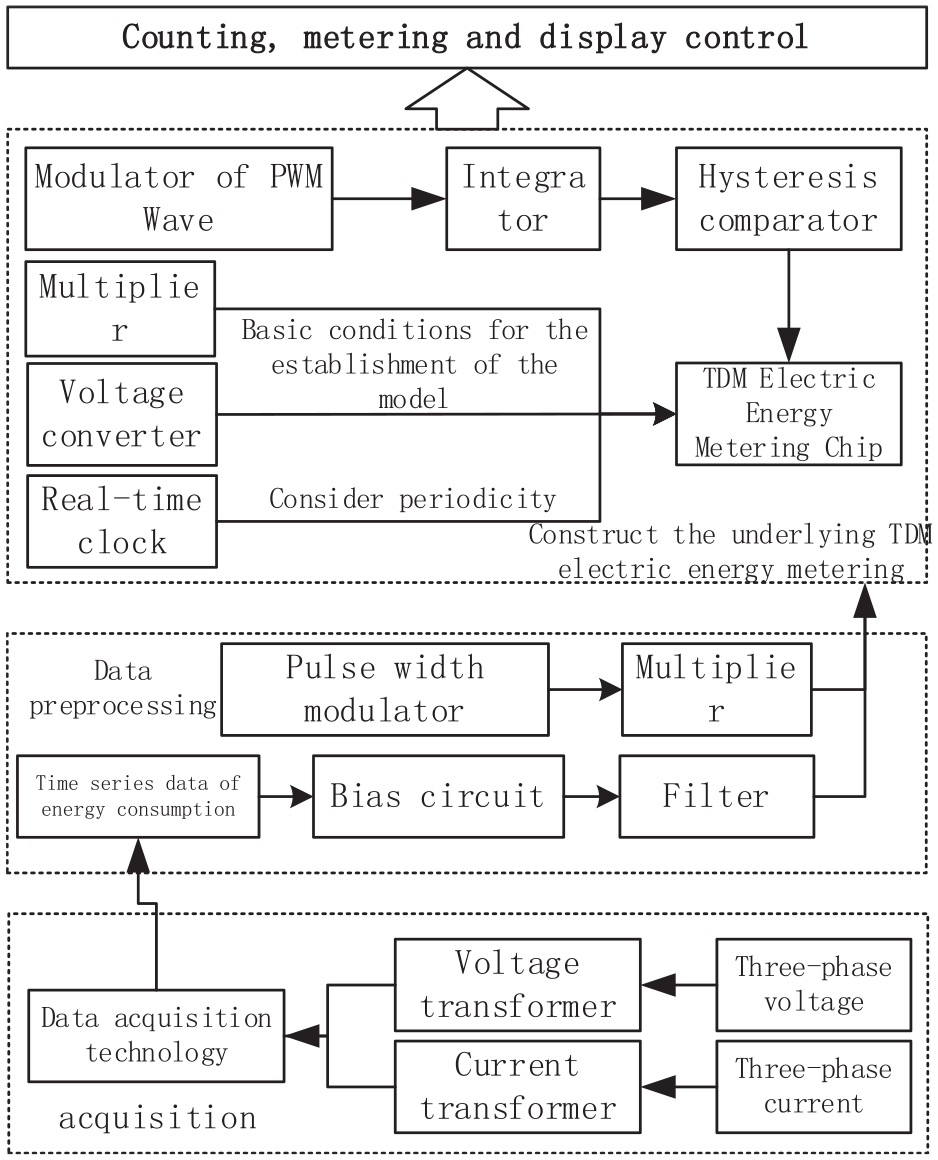
Schematic diagram of integrated design of electric energy meter.
In the design of Figure 1. Goldberg TDM is mainly composed of three modules, and its essence is the realization of multiplication operations. Under the control of TDM energy metering chip, different modules are put into working state. Voltage transformers and current transformers receive data information of three-phase voltage and three wire current, calculate the received data information through energy consumption timing data, and calculate the data information in the circuit through bias circuit. The TDM energy metering chip is also connected to a voltage frequency converter, multiplier, PWM wave modulation, integrator, hysteresis comparator, etc. The final terminal displays the output waveform.
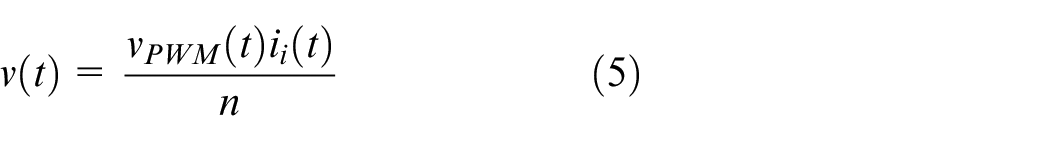
For a single-phase sinusoidal power system, 6 the instantaneous power p(t) of a certain number is obtained by multiplying the instantaneous voltage v(t) and the instantaneous current i(t) at the same node on the load:
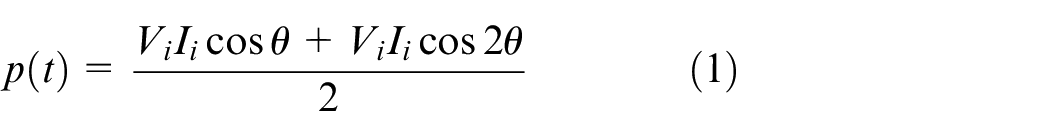
In equation (1),
In TDM, the voltage needs to be converted into pulse wave by modulator. 7 The output expression of modulator is:
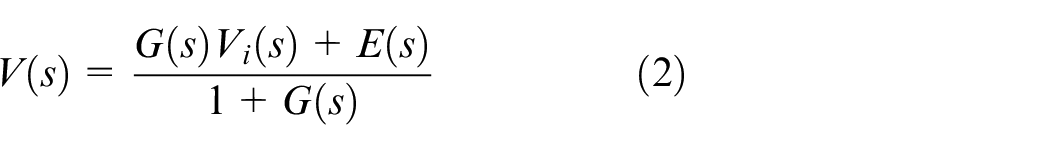
The function multiplied by the input in equation (2) is referred to as the Signal Transfer Function(STF) and the function multiplied by the quantization noise is referred to as the Noise Transfer Function(NTF).
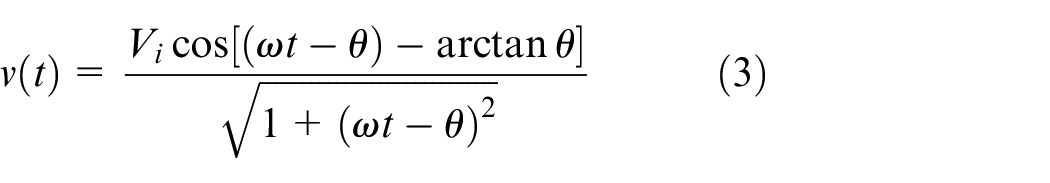
Both amplitude and phase in equation (3) change and are related to the input and integrator parameters in the modulator. The noise part of the modulator output is determined by the NTF determined by the integrator
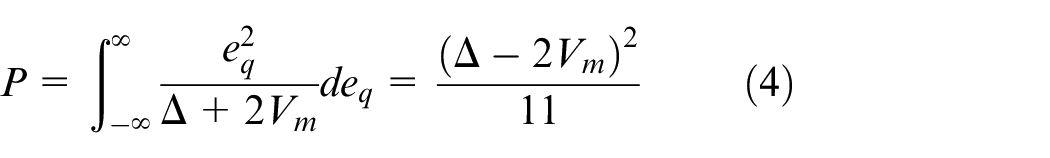
In equation (4),
The output of the modulator is the output of the quantizer. Usually there are only two numerical values. The amplitude modulation module can be abstracted as a special digital-analog hybrid multiplier which multiplies analog and digital The output of the amplitude modulation module can be expressed as:
The binary multiplication after abstracting the output of the modulator makes the multiplier achieve relatively high linearity According to Fourier Transform Theory, the multiplication operation in time domain is transformed into convolution in frequency domain Active power is the DC component of instantaneous power, 10 Therefore, all components in the spectrum except the DC component can be considered as errors and should be filtered out In addition, if the module in TDM directly affects the DC component, the DC point in the spectrum also contains errors If the measurement error is positive, it means that the watt-hour meter is more included in the electric energy, 11 otherwise, it is less included. The integrated part of the electric energy meter system mainly converts the input power signal into an integrable pulse signal proportional to the active power, and the error can be defined as:
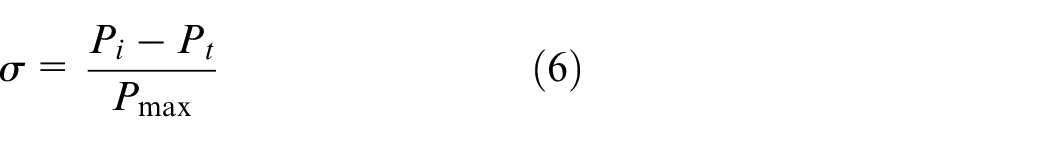
In equation (6),
Realization of electric carbon meter metering based on TDM high precision electric energy metering chip
Carbon emission calculation model
This carbon emission calculation model adopts power flow tracking method, which is based on the principle of proportional sharing. Calculate the node carbon potential matrix M of each node in the power system and the carbon emission matrix W at the load node to obtain the real-time carbon potential of the system node, so as to clarify the emission responsibility of the load node. 12
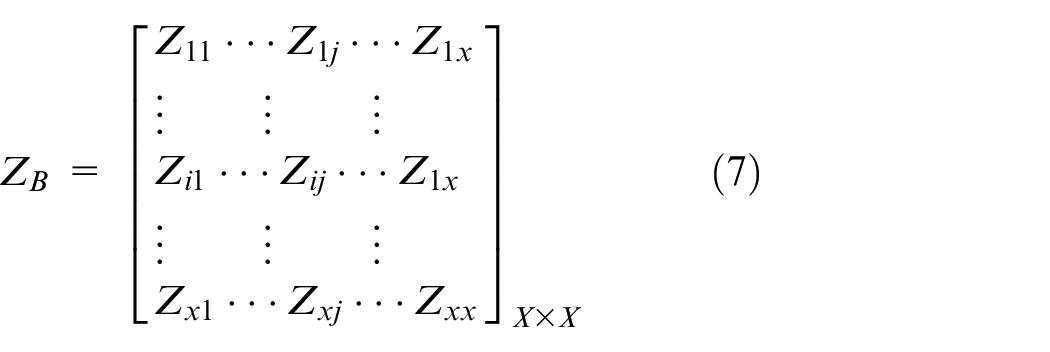
It is known that the lossless system network has X nodes, including A electric energy meter group injection power nodes and Y load nodes Branch power flow distribution matrix
When Nodes
Using power flow calculation, the injection power of generating electric energy meter group can be described by the injection distribution matrix of generating electric energy meter group in power system under the network connection relationship as follows:
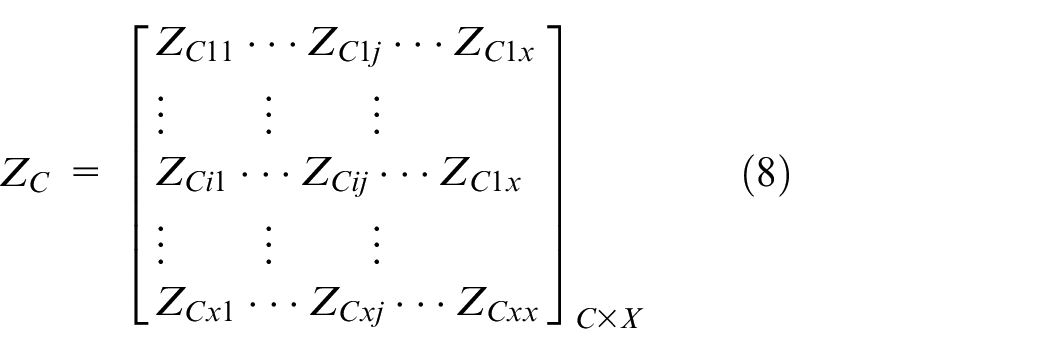
When the c-th power generation meter group is connected to the system at node
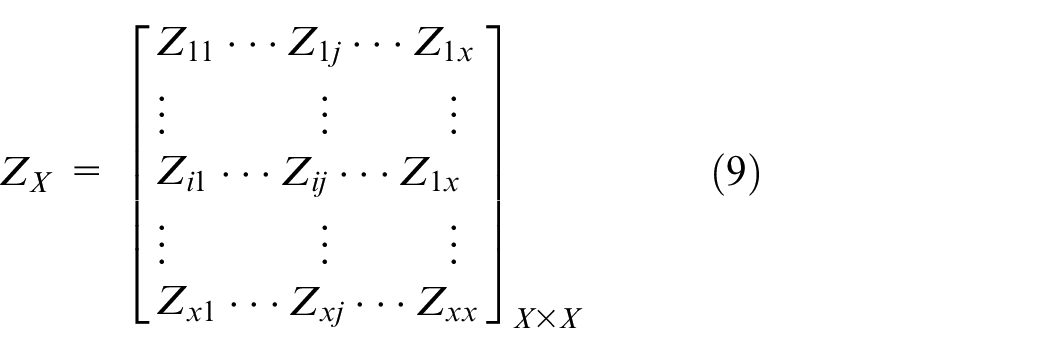
Define the power flux
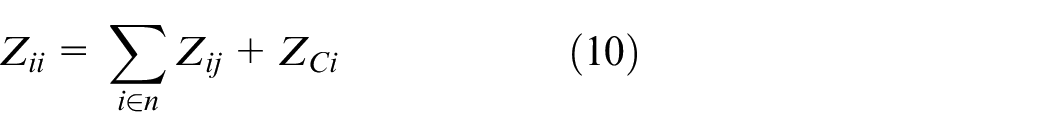
In equation (10),

In equation (11),
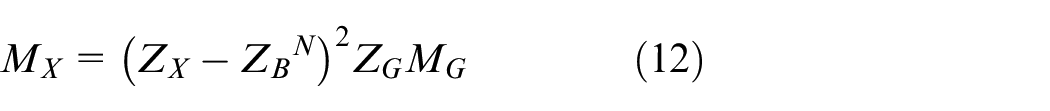
In equation (12),

When the element
Hardware design of electric carbon meter
In order to avoid the influence of the voltage and current of tens of thousands of volts and hundreds of amperes on the high-precision electric carbon meter system in the power transmission system. The high-precision electric carbon meter system adopts voltage transformer and current transformer to reduce the voltage and current in the transmission system to the safety level of tens of volts and several milliamperes. 16 After that, the voltage and current output by the transformer are directly input into the multiplier unit of the high-precision electric carbon meter The output of the multiplier unit is expressed as DC of active power magnitude. In an ideal situation. The output of the multiplier unit is proportional to the active power of the input.
The electric energy metering part of high-precision electric carbon meter is composed of analog front-end analog-digital conversion, electric energy calculation, power conversion, and other parts. The difference between high-precision electric carbon meter and electric carbon meter is that the communication module in high-precision electric carbon meter not only transmits the data input from the transmission energy data receiving system, such as the emission factor of upper-level electric carbon meter, but also calculates the carbon emission factor and greatly improves the accuracy of data. The principle of high-precision electric carbon meter is shown in Figure 2.
Schematic diagram of high precision electric carbon meter.
As shown in Figure 2, the TDM-based high-precision electric energy metering chip used in this study includes four main parts: pulse width modulator, multiplier, filter and voltage converter. The bias circuit is used to provide bias voltage or current to the three main parts of the metering chip. In this case, the output of the multiplier is DC However, the output of the multiplier needs to be input into the VFC and converted into a pulse proportional to the input DC voltage in order to be processed by the subsequent digital circuit. Since the architecture of Figure 2 has no feedback branch, the performance of the chip mainly depends on the performance of each module.
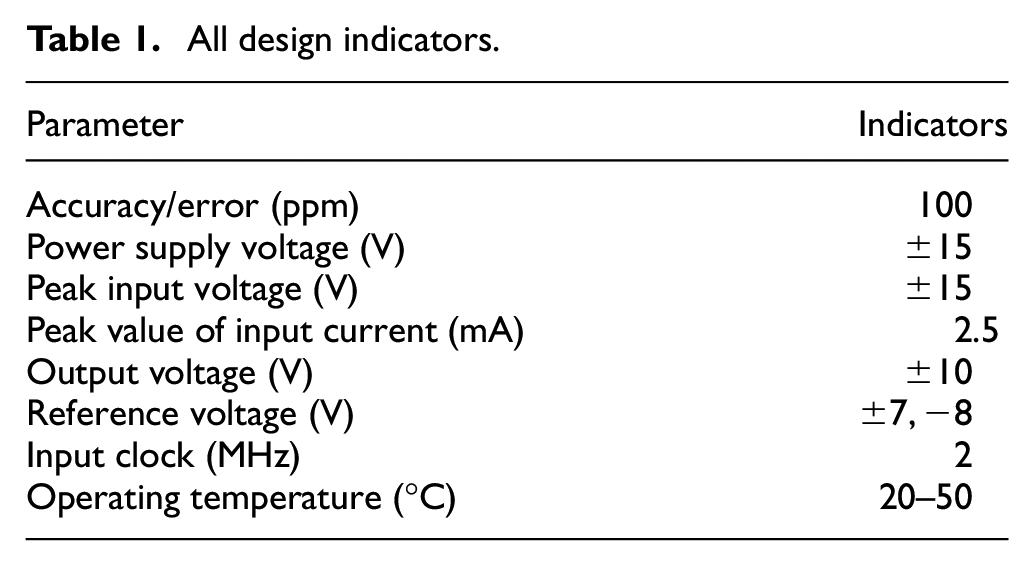
For compatibility, the power supply voltage of the chip in the technical index of the electric energy metering chip is ±15 V. The input current can be shunted through a larger MOS transistor to ensure the current carrying capacity of the chip. The peak value of voltage and current can be realized by the transformer of measuring instrument, so the influence on the circuit of electric energy and power instrument when the chip is replaced. All design indexes are shown in Table 1.
All design indicators.
The integrator circuit used in this study is shown in Figure 3. The structure of the integrator connects the capacitor between vp and ground as compared to the structure of the integrator of When the amplifier is in the linear region and Vb = 0 and R1 = R2, the voltage on the capacitor is 50% of the output voltage, so the nonlinear error of the capacitor caused by the voltage will be smaller. The feedback coefficient in the negative feedback structure changes from 1 to 1/2.
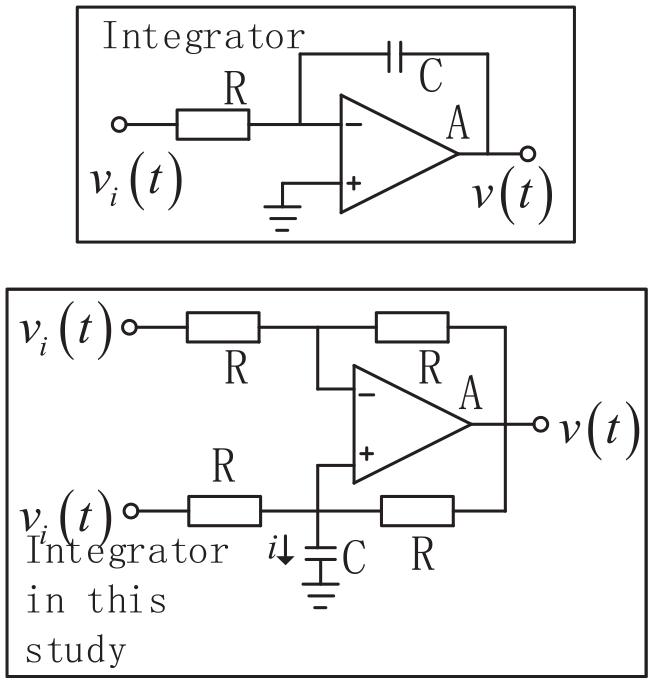
Comparison diagram of two integrator circuits.
As shown in Figure 3, the integrator circuit becomes more complex as the resistance and input voltage increase. The integrator circuit typically uses an operational amplifier with an inverting configuration, which means that the input signal is connected to the inverting input of the operational amplifier. The integrator circuit converts the voltage of the input signal into the output voltage through the charging and discharging process of the capacitor over time (integration), thereby achieving integration operation. In an inverting integrator, the capacitor is connected to the output of the operational amplifier through a feedback resistor (Rf).
When a capacitor is charged, the voltage across the capacitor increases, causing the output voltage of the operational amplifier to decrease.
Due to the virtual short principle of operational amplifiers (i.e. the potential of the inverting input terminal is equal to that of the non inverting input terminal), the change in output voltage will generate a current opposite to the charging current of the capacitor through the feedback resistor Rf, thereby achieving the integration process.
The time constant of the integrator can be displayed more intuitively through the integration characteristics of the integrator circuit.
The circuit of the pulse width modulator is shown in Figure 4. The negative sign in the PWM structure of the circuit is implemented through the inverting hysteresis comparator in the circuit, rather than using a feedback loop. The time constant of the integrator in PWM is determined without input. The circuit implementation of the hysteretic comparator uses a typical structure. The threshold voltage can be expressed as:
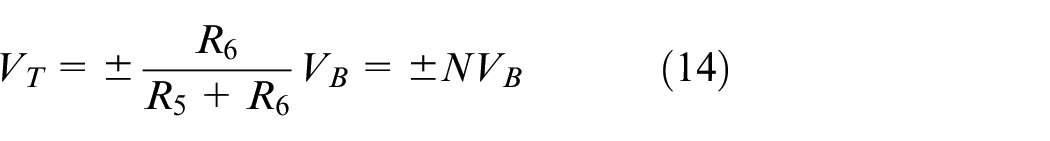
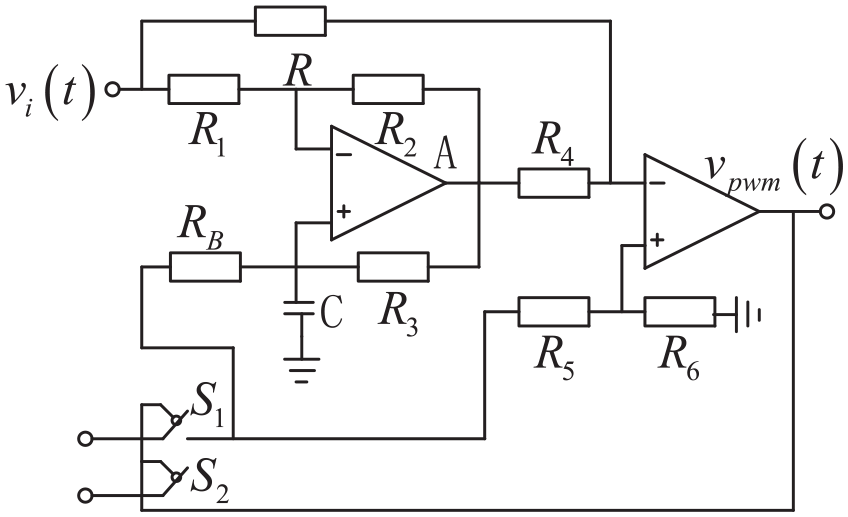
Circuit diagram of pulse width modulator.
Test results and analysis
The performance of operational amplifier in the circuit determines the performance of the whole electric energy metering circuit. In order to verify the accuracy of the high precision electric carbon meter designed in this study, the AC simulation of operational amplifier is carried out based on MATLAB. The hardware used in the experiment includes Huawei EcoStruxure standard energy meters, Schneider EcoStruxure power systems, programmable power loads such as the David series, real-time recording of reading data from carbon meters and standard energy meters, HIOKI WT300 series, and Tektronix PA3000 series energy meter calibrators. We are currently building an experimental platform, equipped with a computer with an Intel Xeon Gold 6230R CPU and 16 GB of memory. The environmental temperature for the experiment is 22.4°C, the relative humidity is 70%, the power supply is 220 V, the frequency is 50 ± 0.5 Hz, and the waveform distortion coefficient is not greater than 5%.
The physical diagram of the electric carbon meter is shown in Figure 5
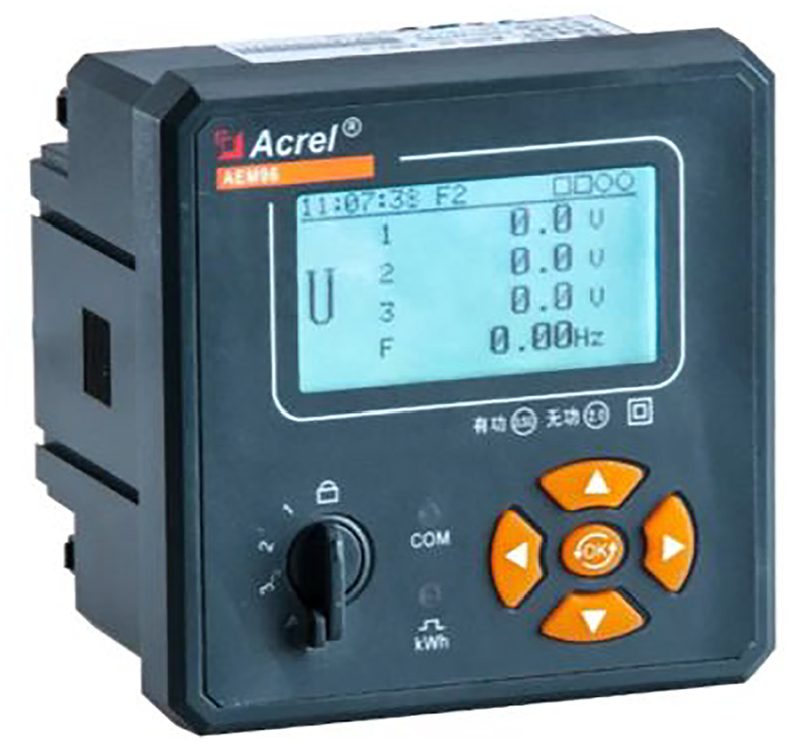
Physical diagram of electric carbon meter.
The schematic diagram of on-site measurement is shown in Figure 6.
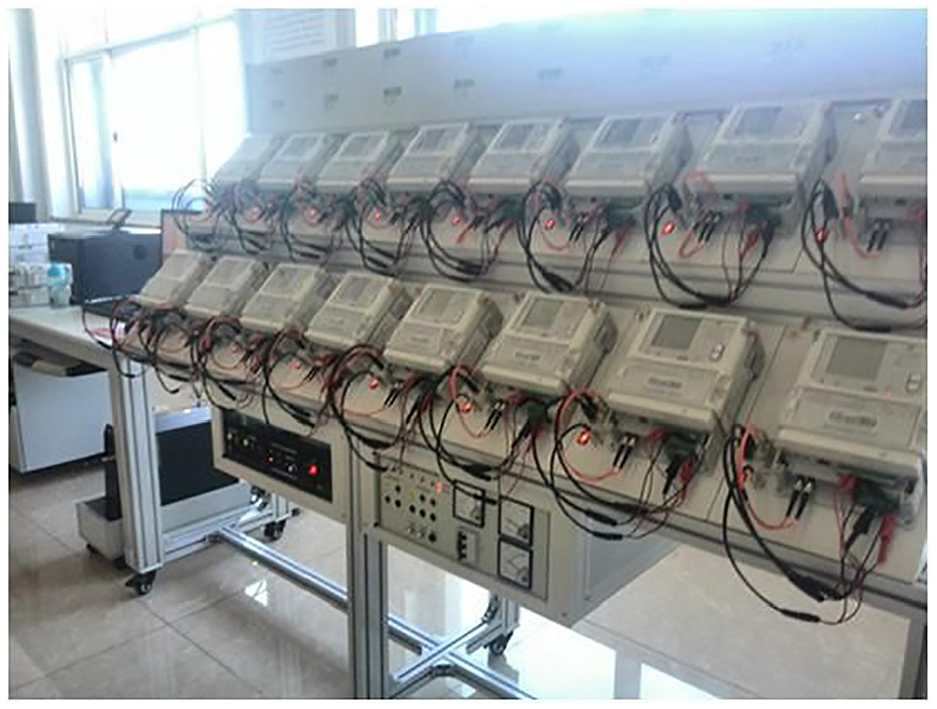
Schematic diagram of on-site measurement.
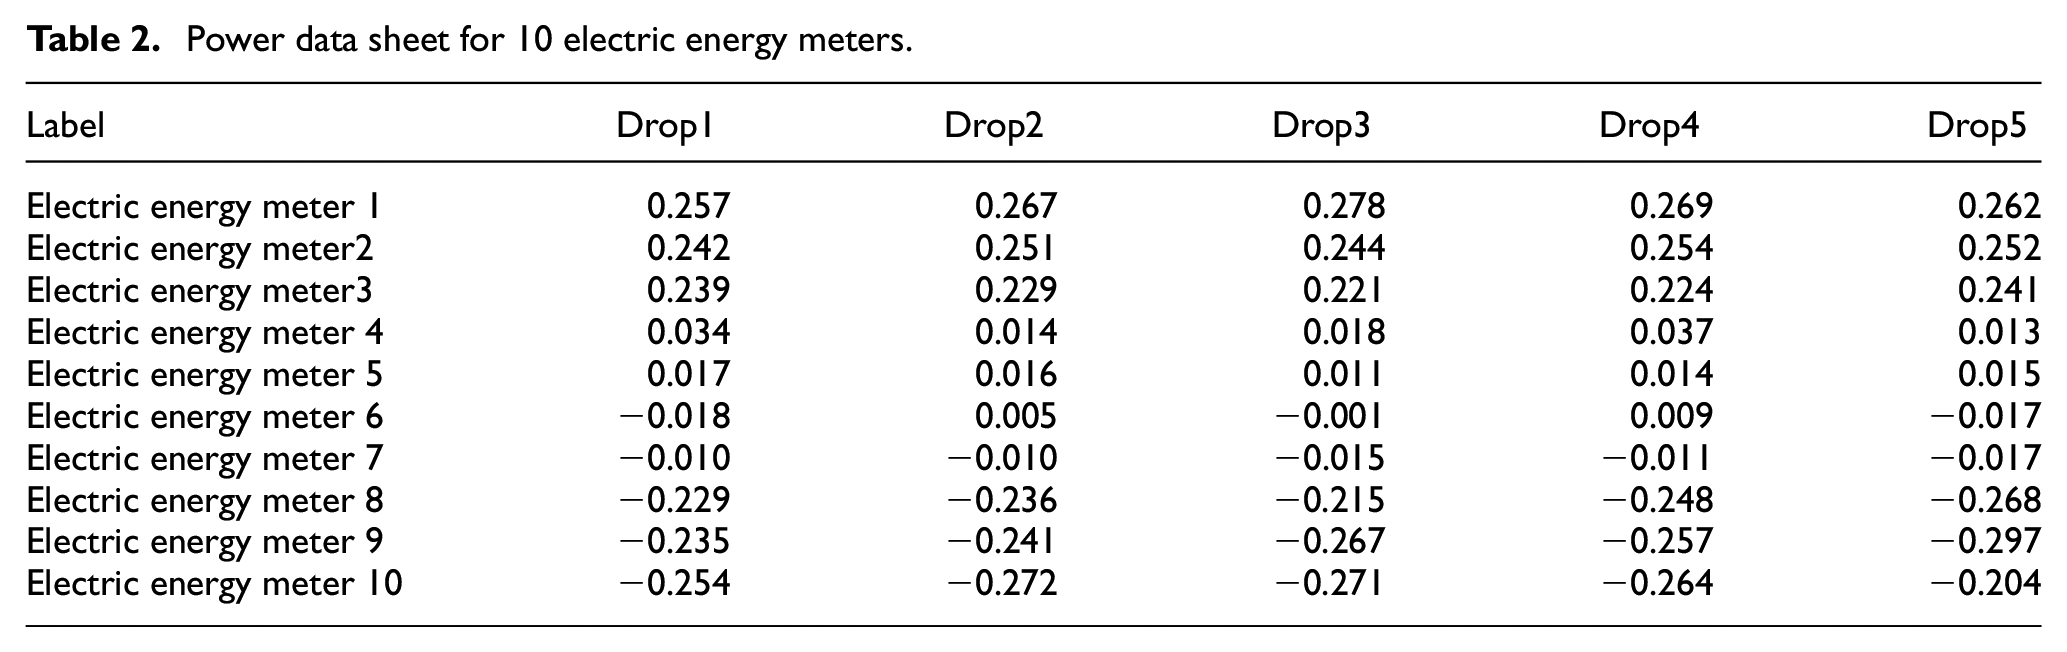
On site measurement was conducted using 10 electric energy meters for data information measurement. After 5 h of measurement, the data information shown in Table 2 was obtained.
Power data sheet for 10 electric energy meters.
The simulation results are shown in Figure 7.
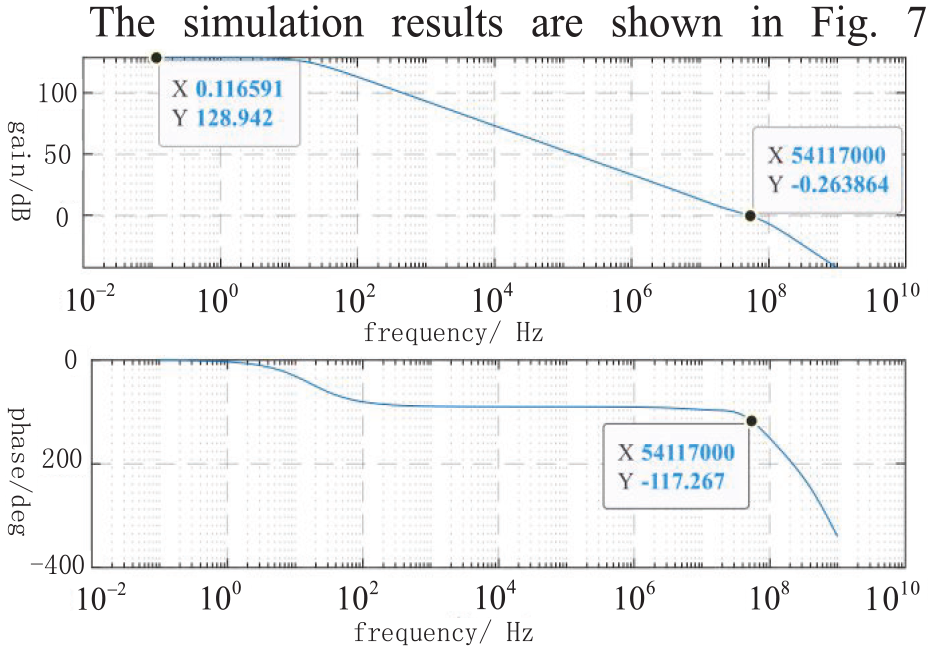
AC simulation results of operational amplifiers.
The operational amplifier needs to have a sufficiently high open-loop gain to suppress the overall nonlinearity of the operational amplifier. The gain is proportional to the high linearity under unit negative feedback. As shown in Figure 7, the open-loop gain of the operational amplifier in this study reaches 129 dB. At the same time, the phase margin of the operational amplifier is 63. Therefore, the amplitude-frequency curve of the operational amplifier will go down without spiking under the unit negative feedback. If the negative feedback amplifier contains spikes, there will be significant time-domain noise on the output of TDM, that is, dynamic error, subsequently, the performance of the chip may be damaged under the influence of multiplication operations. In addition, the bandwidth of operational amplifier reaches about 3 MHz under the unit negative feedback structure. Although the feedback coefficient of the operational amplifier in the modulator is 0.5, the operational amplifier can also meet the design requirements of high precision for the higher frequency flip in the modulator.
In order to verify the accuracy of dynamic carbon emission in the electric carbon table, an improved IEEE example is used to verify the example, which includes 6 conventional thermal power generation electricity meter group and 1 wind farm with a capacity of 100 MW The basic parameters of the electricity meter group are shown in Table 3.
Basic parameters of electricity meter group.
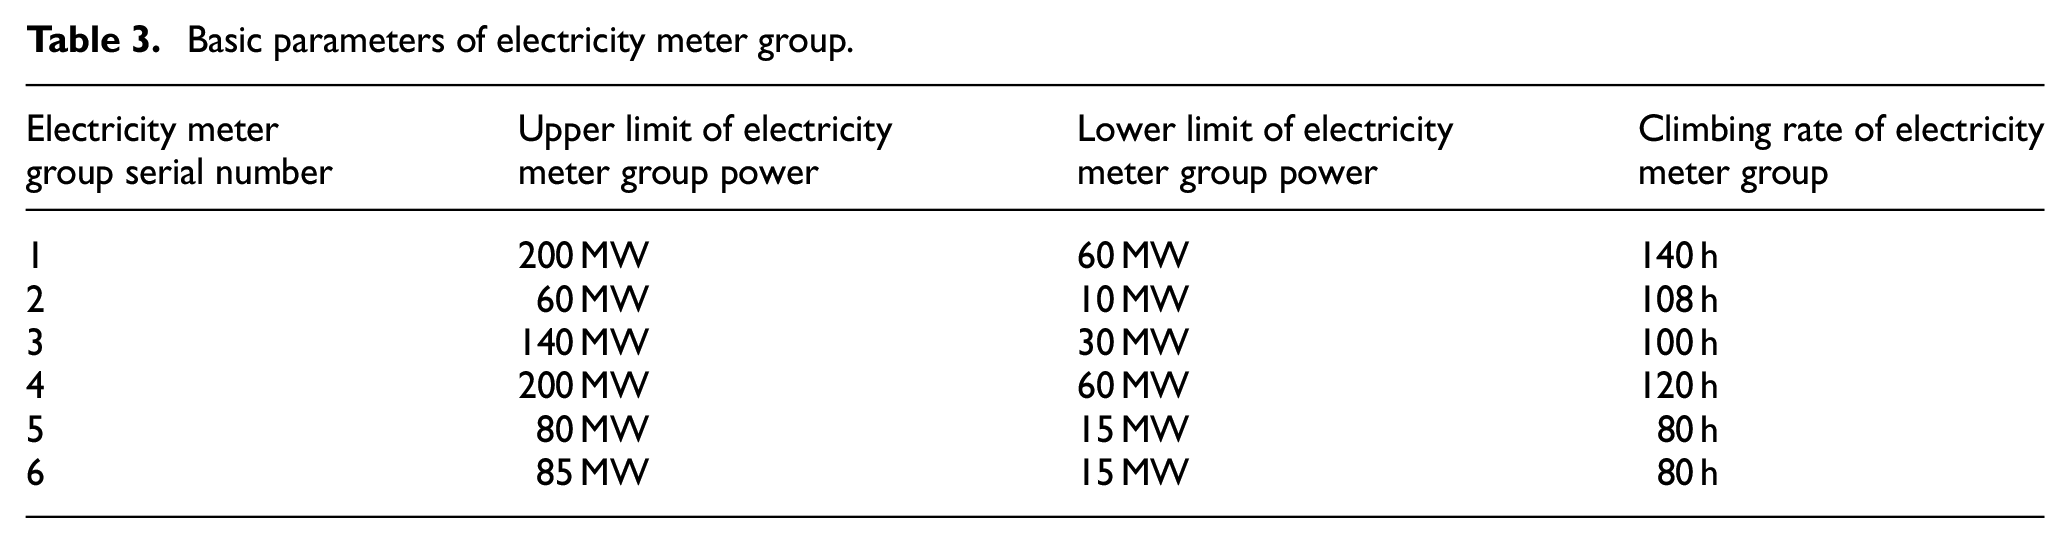
In the running time, “-1” indicates that the electricity meter group has been shut down for 1 h, and the rest indicates that the electricity meter group has been running before the start of the scheduling cycle The interval length of dynamic carbon emission is 20 MW, considering the relationship between emission intensity and unit output, the increasing range decreases step by step, and the value is 5%–20% In the deterministic constraint of wind power plant, the confidence level is 0.9, and the lowest satisfaction of users with the change of demand response is 0.9 Because the load has little influence on the carbon dioxide emission generated by the start-up and shutdown state of the generator electricity meter group, the carbon emission during the start-up and shutdown stage of the generator electricity meter group is not considered Comparing the experimental error results with reference 1 and reference, 2 the results are shown in Figure 8
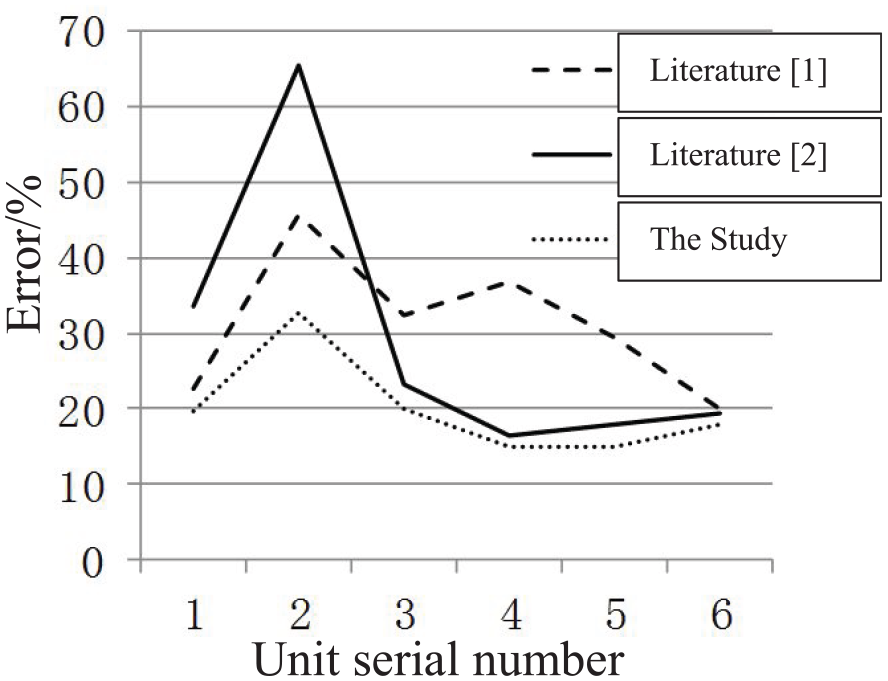
Comparison of error results.
It can be seen from Figure 8 that the error of dynamic carbon emission measurement data calculated in reference 1 reaches the maximum in electricity meter group 2 relative to reference 2 and this study, and the errors in units 3–6 are smaller than reference 2 and have little difference with this study data. However, it can be clearly seen from Figure 8 that the measurement data of this study is more stable and the accuracy of dynamic carbon emission measurement is higher. The accuracy is above 92% and the error is below 6%.
Assuming 10 iterative calculations, the stability comparison test diagram between Goldberg TDM algorithm model, conventional econometric algorithms use the least squares method to estimate the optimal values of parameters, minimizing the sum of squares of data errors.
Conventional measurement algorithm is shown in Figure 9.
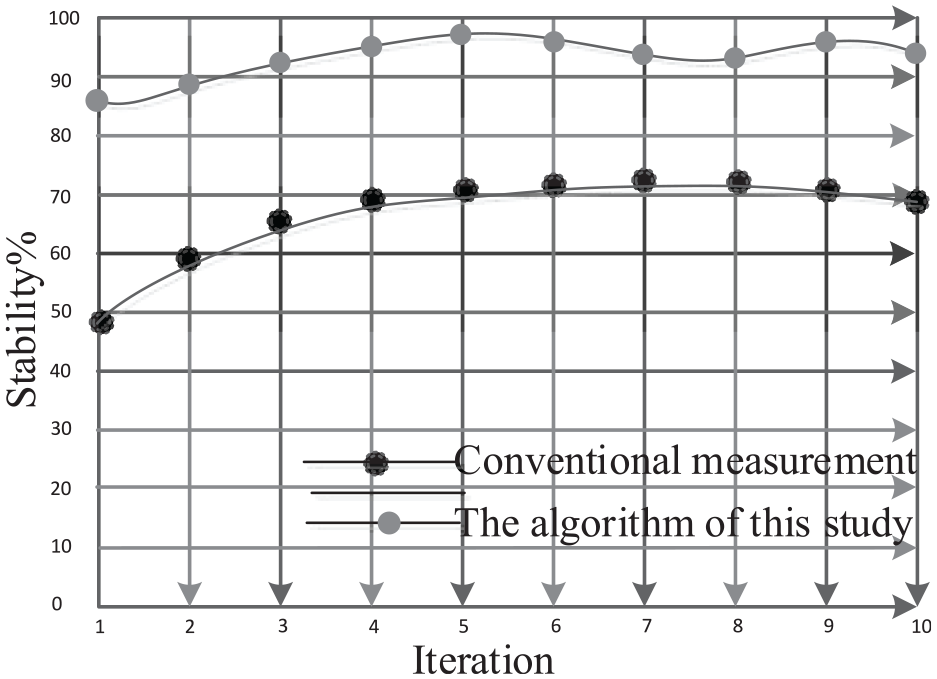
Schematic diagram of algorithm stability comparison.
It can be seen from Figure 9 that through 10 iterations, The stability of the algorithm has been improved to 92%. The stability of this study is higher, and the stability of the conventional metrological algorithm without classification function is worse, which is obviously lower than that of this study.
To sum up, the high-precision electric carbon meter designed in this study has the characteristics of high measurement accuracy, advanced measurement model and intuitive display, etc. It is expected to be widely used in power system, industrial production and other fields, and contribute to the realization of green and low carbon in China.
Conclusion
This study is based on a time division multiplier electric energy metering chip, combined with a dynamic carbon emission metering model of a stepped electric energy meter group, to design a high-precision electric carbon meter. The integrated design of energy meters based on TDM energy metering chips has improved the accuracy of energy metering. By using a carbon emission calculation model, the node carbon potential matrix M of each node in the power system and the carbon emission matrix W at the load node are calculated to obtain the real-time carbon potential of the system nodes, which can improve the carbon emission assessment capability in a carbon neutral environment. Through simulation experiments, although it has certain positive significance, how to be compatible with multiple applications in complex environments, how to improve accuracy and conduct real-world testing are still urgent technical problems that need to be solved. This research lays the foundation for the next step of technical research.
Footnotes
Declaration of conflicting interests
The author(s) declared no potential conflicts of interest with respect to the research, authorship, and/or publication of this article.
Funding
The author(s) disclosed receipt of the following financial support for the research, authorship, and/or publication of this article: Institution: State Grid Heilongjiang Power Supply Service Center
Num: 5700-202318258A-1-1-ZN; 5700-202321624A-3-2-ZN
Ethical statement
This study does not require any ethical statement.
Informed consent/Patient consent
There are no human participants in this article and informed consent is not required.
Trial registration number/date
2024/1/11
Data availability statement
Data sharing not applicable to this article as no datasets were generated or analyzed during the current study.