
Abstract
Human Activity Recognition (HAR) plays a crucial role in healthcare, sports, security, and human-computer interaction. A major challenge in HAR is the imbalance and uneven distribution of features between the training and testing datasets, leading to biased machine learning models and reduced prediction performance. This study proposes a novel approach that combines clustering of KMeans with a stratified data splitting strategy. By utilizing clusters generated from KMeans, this method ensures that both the training and testing datasets contain representative features from all clusters, improving the model’s reliability and generalizability. The Kolmogorov-Smirnov test is used to assess the uniformity of the feature distribution. Experimental results demonstrate that this method significantly enhances model accuracy and performance, achieving an accuracy of 98.58%, a Recall score of 98.66%, a Precision score of 98.65%, and an F1 score of 98.65%. These findings not only improve the effectiveness of current HAR models, but also open new research avenues for optimizing feature distribution in complex, multidimensional problems.
Keywords
Introduction
Human activity recognition (HAR) is an important research area focused on the development of computational methods to automatically identifying and recognize human activities through sensor data.1–3 HAR plays an essential role in various fields such as healthcare,4,5 sports,6,7 security, 8 and human-computer interaction. 9 In this study, machine learning models are used to classify human activities based on data collected from wearable sensors, providing information on features like acceleration along the x, y, z axes and angular velocity. Although many HAR datasets have balanced the number of samples across classes, meaning that the class imbalance is not significant enough to raise concerns about model bias, a more subtle issue often overlooked is the imbalance and uneven distribution of features between the training and testing datasets. This imbalance does not concern the number of samples per class, but rather how features are distributed among the samples. When certain features dominate or are unevenly distributed across classes, machine learning models can become biased, focusing excessively on these features while neglecting others that are equally important. This leads to overfitting, where the model performs well in the training set but poorly on the testing set or in real-world scenarios.
Figure 1 shows that in both the training and the test data sets, the number of samples per activity is not severely imbalanced. Although there are some differences in the number of samples between activities, the discrepancies are not large enough to cause major concerns about significant model bias. For example, the number of samples for activities such as WALKING, WALKING_UPSTAIRS, and WALKING_DOWNSTAIRS is slightly lower than LAYING and STANDING, but the differences are not so significant as to raise major concerns. This relatively even distribution suggests that while further measures to ensure class balance, such as applying stratified sampling, could be considered, the current dataset is sufficiently balanced for the model to learn effectively without requiring extensive adjustments. This is particularly true if the machine learning models used can effectively handle mild imbalances in data distribution. However, a more subtle issue may arise from the imbalance of features. This imbalance does not refer to the number of samples per class, but rather to the way features are distributed among the samples. When certain features dominate or are unevenly distributed across classes, machine learning models may become biased, focusing excessively on these features and overlooking others that may be equally important. This leads to overfitting, where the model performs well on the training data set but poorly on the testing data set or in real-world applications. Previous studies have focused primarily on optimizing model accuracy while paying little attention to the distribution of features between the training and testing sets. Ignoring this imbalance can result in poor model performance in real-world applications. This raises the question whether splitting the training and testing sets in a way that balances the feature distribution between the two datasets can improve model training outcomes.
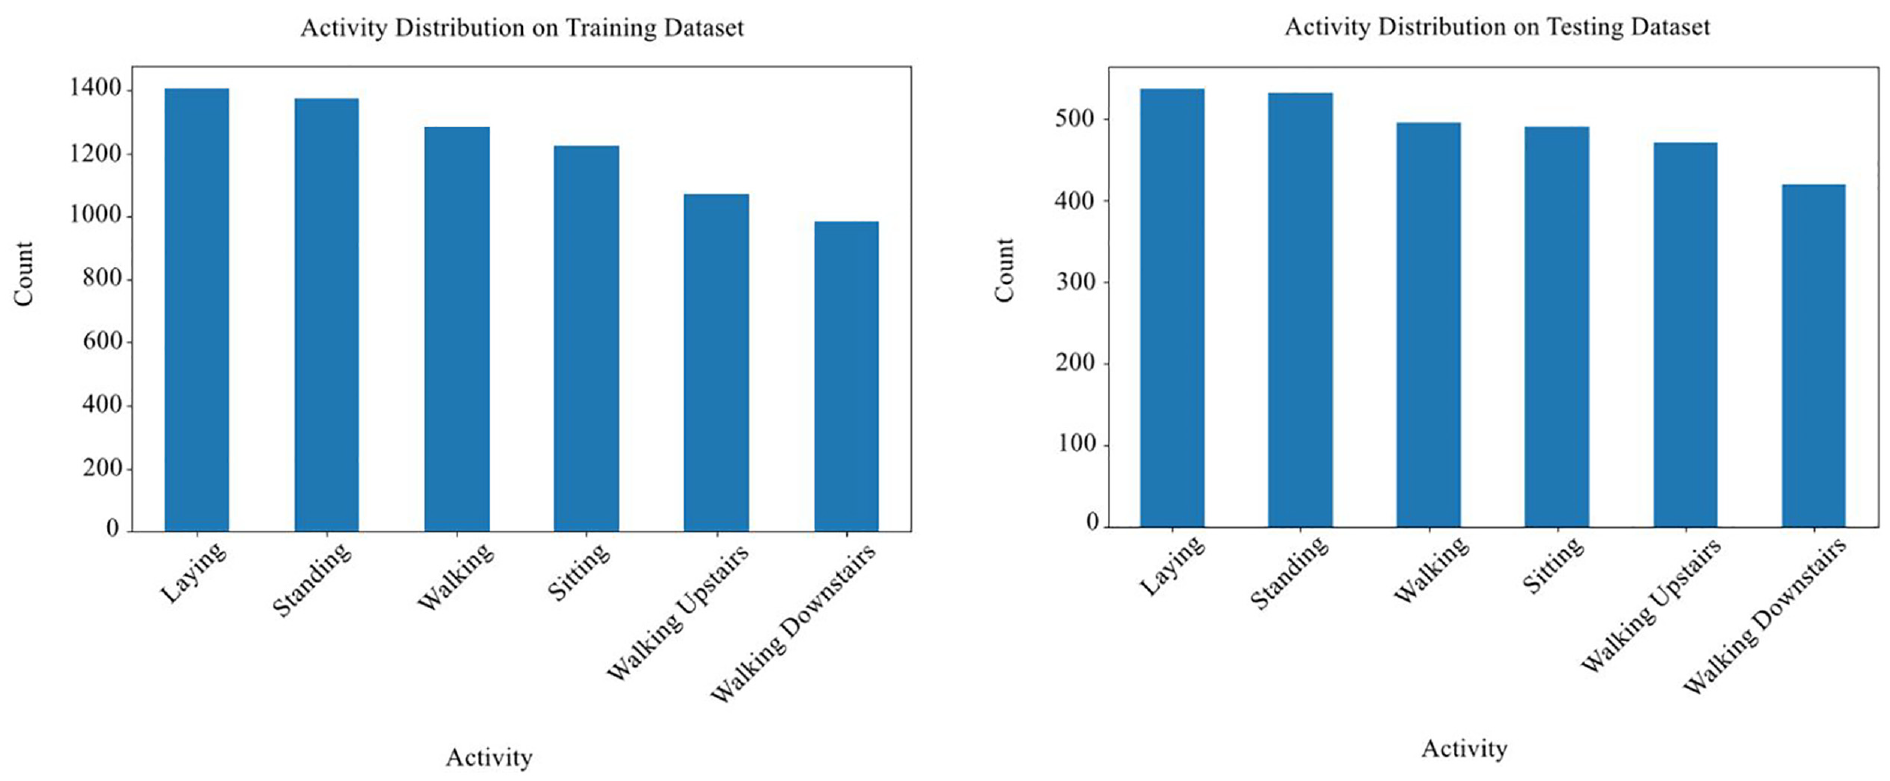
Distribution of activities in the training and testing datasets.
In this study, we propose a novel approach that combines clustering of KMeans with a stratified data splitting strategy based on feature clusters generated from KMeans. Our method not only stratifies data based on target labels, but also on feature clusters, ensuring that both the training and testing datasets include representative features from all clusters. This helps balance and even out the feature distribution between the two datasets, thereby improving the model’s performance and reliability in real-world applications.
Theoretical background
In this section, we analyze the limitations of current methods in handling feature imbalance and uneven distribution. This sets the foundation for introducing our new method, which emphasizes the combination of KMeans clustering and stratified data splitting based on feature clusters.
Overview of related methods
In the field of HAR, current methods mainly focus on applying deep learning and machine learning techniques to extract and classify features from sensor data. Numerous studies have been conducted to improve the accuracy and performance of HAR models through the use of various algorithms and architectures. The following is an overview of the prominent methods in this field, along with related research and the challenges they face.
Traditional machine learning methods
Traditional machine learning methods also play an important role in HAR. Algorithms such as support vector machines (SVM), K-Nearest neighbors (KNN), decision trees, and random forests are commonly used to classify activities based on features extracted from sensor data.
SVM (support vector machines): SVM has been widely used in HAR due to its robust classification capabilities. The study in Wu and Zhang 10 compared KNN, MLP, Naive Bayes, and SVM, showing that multiclass SVM had the best performance. In Zebin and Ozanyan 11 , SVM with a second degree kernel achieved 93.5% accuracy in activity recognition. Furthermore, Thakur 12 employed the mGRRF method based on Random Forest for feature selection, achieving an average precision of 99.29% for SVM.
KNN (k-Nearest neighbors): KNN is a simple, yet effective algorithm in certain cases. In [13], KNN was compared to the RF, ANN and DR Classifiers, with RF achieving higher performance, although KNN remains an important reference method.
Decision trees and random forests: Tree-based models are also widely used in HAR. The study in Nia et al. 13 showed that Random Forest achieved 97.67% precision compared to ANN, DR Classifiers, and KNN. Another study Zebin and Ozanyan 11 reported an accuracy of 94.6% for an ensemble classifier using bagging and booster techniques.
Although traditional machine learning methods can yield good results, they often require manual feature extraction and may not be efficient when handling large and complex datasets such as those in HAR. Additionally, they can be affected by data imbalance, leading to unstable classification performance.
Deep learning methods
Deep learning has become a powerful tool for processing sensor data and recognizing complex activities. Convolutional neural networks (CNN) and recurrent neural networks (RNN), such as long-short-term memory (LSTM), are widely used due to their ability to automatically extract features from raw data.
CNN (convolutional neural networks): CNNs are commonly used to handle multidimensional sensor data, such as signals from accelerometers and gyroscopes. Numerous studies have demonstrated the effectiveness of CNNs in HAR. For example, Ignatov 14 compared the performance of RF, KNN, CNN, and PCA, and found that CNN achieved the best results in both the WISDM and UCI-HAR datasets. In Zhou and Li 15 , CNN-based methods achieved 98.33% precision for nine different activities. Furthermore, Yen et al. 16 used a wearable device on the waist to collect data and achieved a precision of 97.49% in the UCI dataset using a parallel CNN model. However, CNNs can face challenges when dealing with unevenly distributed data and require a large amount of data to train effectively.
LSTM (long short-term memory): LSTM, a variant of RNN, is designed to address long-term dependencies in time-series data. LSTM is often applied to sensor data analysis because of its ability to process sequential information, allowing the model to learn the temporal relationships between activities. In El Ghazi and Aknin 17 , the application of LSTM combined with hyperparameter optimization achieved a precision of 97.71% on the PAMAP2 dataset. Another study 18 used a lightweight and efficient CNN-LSTM model, achieving 97.89% accuracy on the UCI-HAR data set. However, like CNNs, LSTMs also face challenges with imbalanced data and require long training times.
In addition, hybrid models combining CNN and LSTM have been proposed to leverage the strengths of both architectures. For example, Irfan et al. 19 introduced a CNN-LSTM hybrid model, which achieved 98.38% accuracy on a data set with transitional and basic activities. In [20], a multibranch CNN-BiLSTM model reached 96.05% precision in the WISDM dataset.
Although deep learning methods such as CNN and LSTM have achieved significant results in HAR, they often require large datasets and can be affected by data imbalance. This can lead to overfitting on dominant classes and underfitting on less frequent ones, reducing model performance in real-world applications. Therefore, balancing the data and optimizing the model are crucial to achieving the best performance.
Dimensionality reduction methods
To reduce model complexity and the risk of overfitting, dimensionality reduction methods such as principal component analysis (PCA) and linear discriminant analysis (LDA) are often applied.
PCA (principal component analysis): PCA is used to reduce the number of features while retaining most of the information. The study in Ignatov 14 applied PCA along with machine learning algorithms, but the results showed that CNN performed better without PCA. In Kaspour et al. 20 , the use of PCA combined with a multilayer perceptron (MLP) achieved 98.6% accuracy.
LDA (linear discriminant analysis): LDA is used to optimize the separation between classes in the feature space. In Ahmed Bhuiyan et al. 21 , the use of EPS for feature extraction and LDA for dimensionality reduction, combined with multiclass SVM, achieved an F1 score of 98.71% and an accuracy of 98.67% in the UCI-HAR dataset. Another study Bhuiyan et al. 22 showed a similar method, achieving an overall accuracy of 98.67%.
Dimensionality reduction is important in HAR to minimize complexity and improve model performance. However, it must be combined with other methods to ensure that the model does not lose important information. In some cases, deep learning models have the ability to automatically learn features and reduce dimensionality without the need for traditional dimensionality reduction techniques.
Previous studies in HAR have applied various deep learning and traditional machine learning methods, achieving promising results. However, challenges such as data imbalance, the need for large datasets, and model complexity remain. Additionally, the full potential of feature analysis has not been fully exploited. Therefore, new approaches focusing on model optimization, data balancing, and feature analysis are needed to ensure that models perform well on both training and testing datasets.
Feature distribution optimization
KMeans clustering
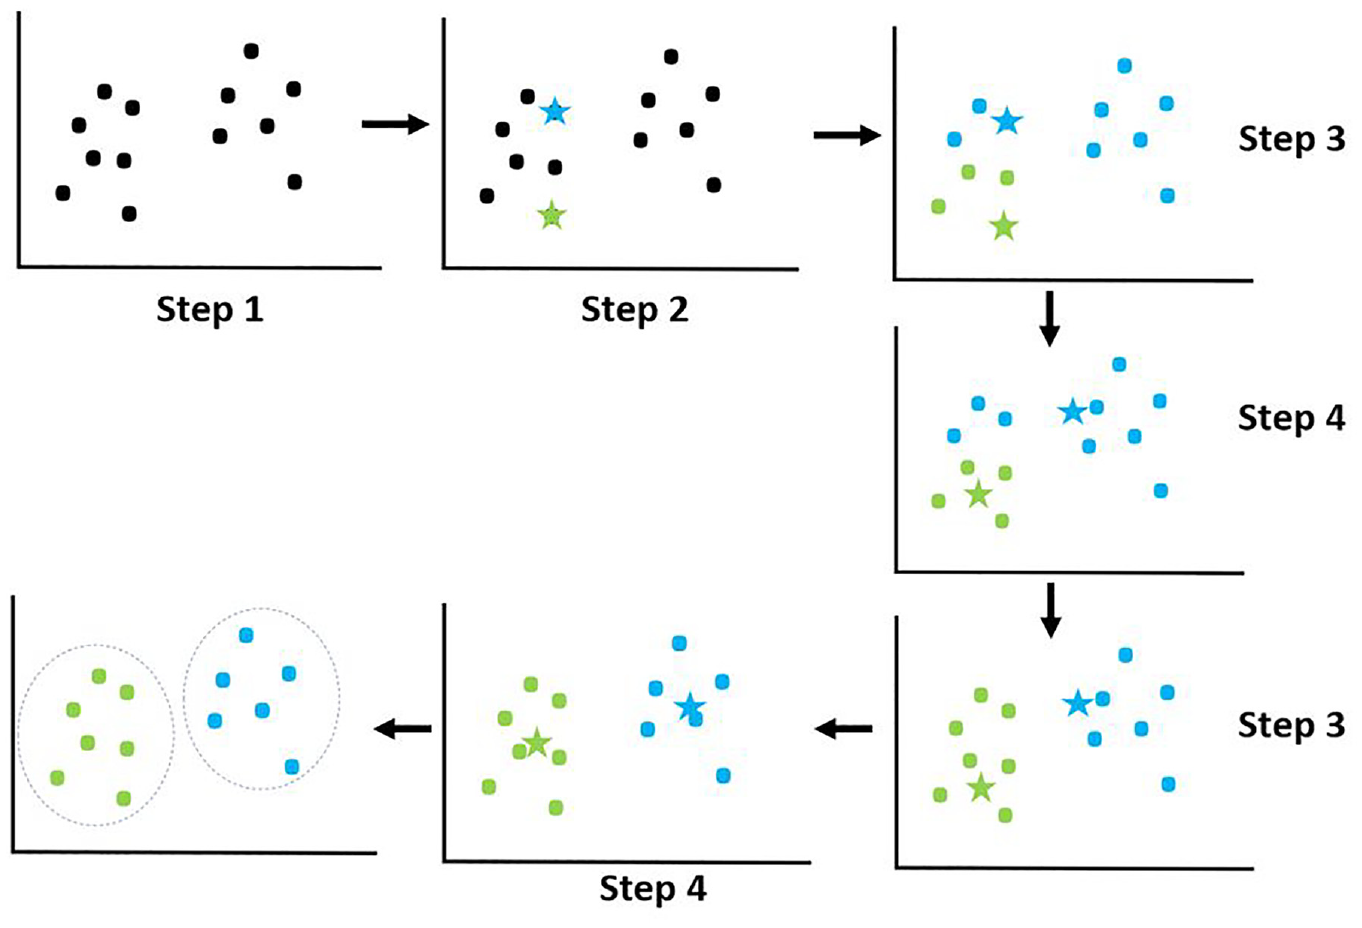
KMeans clustering is a popular unsupervised clustering algorithm widely used in data analysis to divide a set of data points into k groups (clusters) based on their similarities. The goal of KMeans is to minimize the total squared distance between the data points and their respective cluster centroids, thereby forming clusters where data points within each cluster are similar to each other in terms of their distance in the feature space.
Step 1: Initialize centroids - Randomly select k points from the dataset as initial centroids, where k is the desired number of clusters.
Step 2: Cluster assignment - Assign each data point
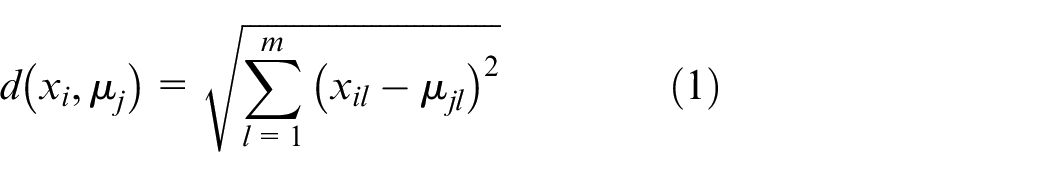
where:
Step 3: Update centroids - Once all data points have been assigned to clusters, recalculate the position of each centroid by averaging all the data points in that cluster:
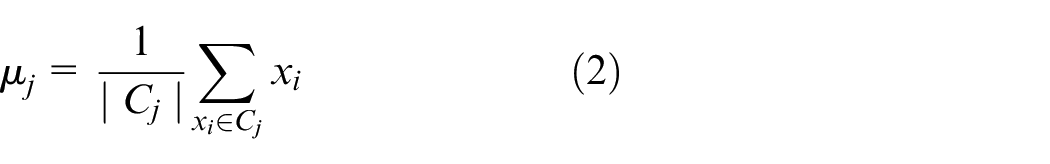
where:
Step 4: Repeat - Repeat steps 2 and 3 until the centroids no longer change (or change very little), or until another stopping criterion is met.
The stars represent the centroids, which are the central points of the data clusters. These are the focal points that clustering algorithms, such as KMeans, use to determine how data is grouped.
The dots represent the data points, which are divided into different groups around the centroids based on distance or another criterion to determine which cluster the data belong to.
The result of KMeans is a set of clusters, where each cluster consists of data points that are highly similar in terms of features. This clustering process helps uncover hidden structures in the data and facilitates the handling and analysis of complex data.
Stratified train-test split
Stratified Train-Test Split 23 is a data splitting technique that ensures that each class or group in the data set is proportionally represented in both training and testing sets. However, when relying solely on target labels, this method may not ensure uniform feature distribution.
Kolmogorov-Smirnov test
In this study, the Kolmogorov-Smirnov (KS) test is used as a method to evaluate the uniformity of feature distributions between training and testing sets in the HAR dataset. This is a nonparametric test used to compare the differences between the distributions of two features in the data to assess their uniformity. The KS test measures the maximum difference between the cumulative distribution functions (CDFs) of two features. If the KS test reveals significant differences, it indicates that the data lacks uniform feature distribution, which needs to be addressed before model training to improve model performance and accuracy.
Kolmogorov-Smirnov distance: The Kolmogorov-Smirnov distance is defined as the maximum difference between the CDFs of two features, calculated by the formula:
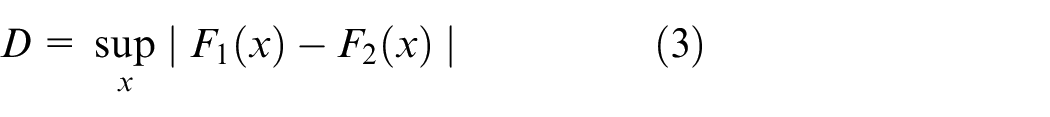
where:
In this study, we apply the KS test to evaluate the uniformity of the feature distributions between the training and testing sets. Each feature is tested using the KS test to compare the differences in its distribution between the two data sets. Features with a p-value smaller than a predefined threshold (e.g., 0.05) are considered to have significant differences in distribution and thus need to be addressed to ensure uniformity. To assess the effectiveness of the proposed method, we compare the results of the KS Test before and after applying the stratified splitting combined with KMeans clustering. This allows us to evaluate the improvement in feature distribution uniformity, thus determining the success of the method in balancing the data.
Proposed method-stratified data splitting with KMeans clustering
Gaps in current research
In the field of HAR, current methods often focus on optimizing model accuracy by improving algorithms or augmenting data. However, an important issue often overlooked is the imbalance and uneven distribution of features between the training and testing sets. Most studies emphasize class balancing, but pay little attention to feature distribution balancing.
Feature imbalance can lead to biased machine learning models, reducing their generalization ability and performance when applied to real-world data. The KS test in our study revealed significant differences in the feature distributions between the training and testing sets, with only 11.74% of the features having a p-value greater than 0.05.
The gap in current research lies in the lack of an effective method to balance the distribution between the training and testing sets. Traditional data-splitting techniques, such as random splitting or stratified splitting based on target labels, do not ensure uniform feature distribution. This highlights the urgent need for a new method to address this problem.
Proposed method
To address the imbalance and uneven distribution of features between the training and testing sets, we propose a new method that combines KMeans clustering with a stratified data-splitting strategy. This method not only relies on target labels, but also considers hidden structures in the data through clustering. This combination ensures that both datasets reflect all important features, improving the performance of machine learning models. The detailed steps are as follows:
Step 1: Apply KMeans clustering
Objective: Discover and identify hidden structures in the data based on features. Clustering the data into highly similar groups helps to better understand the distribution of features in the original data.
Implementation: Apply the KMeans algorithm to the entire data set. Select the optimal number of clusters (k) based on methods such as the elbow method or Silhouette Score to find the most suitable data structure. The result of this step is that each data point is assigned to a cluster, reflecting the similarity of features between samples in the same cluster. This helps to define feature regions in the data space, serving as the basis for subsequent data split.
Step 2: Calculate cluster proportions
Objective: Determine the proportion of samples in each cluster relative to the total number of samples. This helps maintain balance in cluster representation when splitting into training and testing sets.
Implementation: Count the number of samples in each cluster to understand the distribution of the data. Calculate the percentage of each cluster relative to the total number of samples. This information will be used to ensure that each cluster is appropriately represented in both the training and testing sets, avoiding overrepresentation of any single cluster.
Step 3: Stratified data splitting based on clusters
Objective: Split the data into training and testing sets so that each cluster is represented according to the calculated proportions, ensuring a balanced feature distribution.
Implementation: Apply stratified splitting within each cluster, splitting the data according to the desired ratio (e.g., 70% for the training set, 30% for the testing set). Ensure that the proportion of samples from each cluster in the training and testing sets accurately reflects the previously calculated proportions. This helps maintain diversity and uniformity in both sets, allowing the model to learn a wide range of features and avoid bias.
Step 4: Ensure balanced target labels in each cluster
Objective: Ensure that target classes (labels) are also balanced within each cluster. This prevents class imbalance between the training and testing sets, reducing bias toward specific classes.
Implementation: Apply stratified splitting based on target labels within each cluster. This ensures that the class distribution within each cluster reflects the diversity of the original data set. This helps the machine learning model learn both feature and label diversity, increasing the accuracy in real-world applications.
Step 5: Combine data from clusters
Objective: Create the final training and testing sets, ensuring that they are balanced and ready for model training.
Implementation: Combine the stratified data from all clusters to form the final training and testing sets. Ensure that there is no overlap and maintain the calculated training-test split ratio. This helps preserve data integrity and balance during training, ensuring that the model learns from a data set that best represents the entire feature space.
Benefits of the proposed method
The proposed method offers numerous important benefits, especially in balancing the feature distribution and improving the performance of machine learning models. By ensuring that each feature group is fully represented in both the training and the testing sets, this method minimizes the imbalance and uneven distribution of features. This prevents the model from being biased toward certain features, thereby enhancing its learning and prediction capabilities. Moreover, the model is trained on more diverse feature data, including samples from all clusters, which improves generalization when applied to real-world data where the feature distribution may differ from the original training data. The comprehensive coverage of feature samples also helps reduce the risk of overfitting, as the model does not overly focus on one specific group of features. As a result, the performance is significantly improved, as demonstrated by higher metrics such as accuracy, recall, precision, and F1 Score. More importantly, this method addresses the feature imbalance problem often overlooked by traditional methods, providing a comprehensive approach to balancing feature distribution between training and testing sets.
Comparison with traditional methods
Traditional stratified sampling methods based on target labels ensure mainly the balance of sample sizes between classes in the training and testing sets. While this can help reduce bias toward certain labels, it does not guarantee uniform feature distribution, which can still lead to model bias. On the contrary, our proposed method balances not only the target labels but also the feature data, thereby improving the generalization and performance. This method also reduces the risk of overfitting and bias. However, the proposed method is more complex to implement and requires additional steps for clustering and calculating cluster proportions. However, the significant improvements in model performance and reliability demonstrate that the benefits far outweigh the challenges of implementation.
To address concerns regarding the computational complexity of our proposed method, the manuscript implemented several optimizations to enhance efficiency and scalability for larger datasets. The following outlines the primary optimization techniques along with supporting data and visualizations to illustrate their impact.
Use of mini-batch KMeans
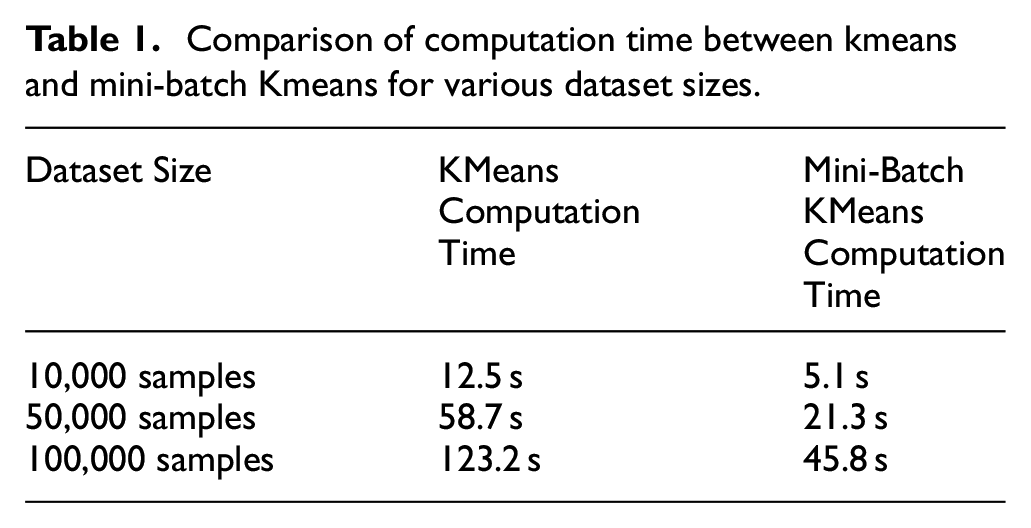
Instead of traditional KMeans clustering, which processes the entire dataset in each iteration, we applied mini-batch KMeans. This approach significantly reduces computational costs by processing small, random samples (mini-batches) in each iteration. The reduced sample size in each step lessens the load, especially for large datasets, while maintaining clustering accuracy. The benefits of mini-batch KMeans are evident in the reduced computation times shown in Table 1 below.
Comparison of computation time between kmeans and mini-batch Kmeans for various dataset sizes.
Parallel processing for Kolmogorov-Smirnov (KS) test
The Kolmogorov-Smirnov (KS) test evaluates the uniformity of feature distributions across datasets. In our proposed approach, each feature undergoes an independent KS test. By implementing parallel processing, we reduced the total time required for the KS test by distributing the computations for each feature across multiple processors. This approach proved especially advantageous for high-dimensional datasets with numerous features. As shown in Figure 2, parallelized processing significantly reduced the KS test computation times for datasets of various sizes.
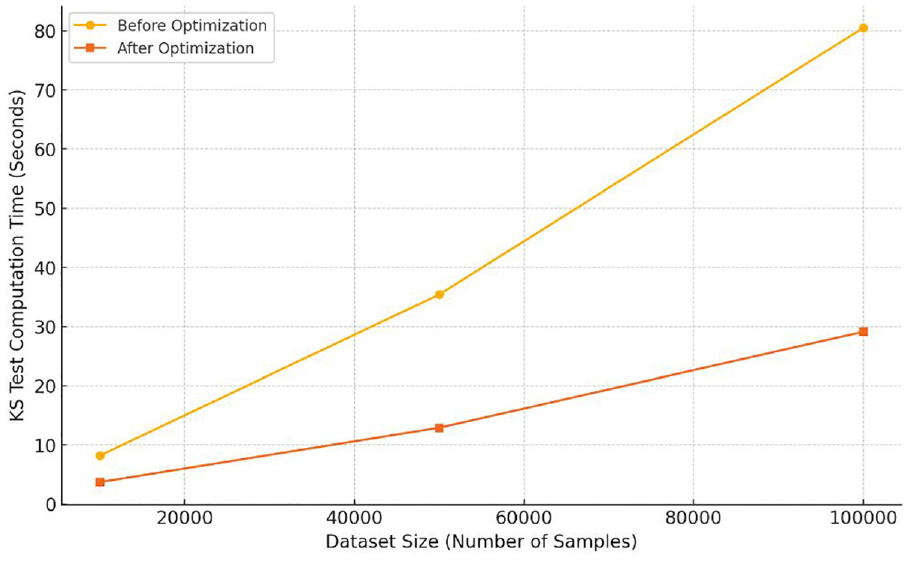
Comparison of KS test computation time before and after optimization.
Computational complexity analysis
To provide a comprehensive understanding of computational efficiency, we analyzed the complexity of each major component of our approach and highlighted the effects of our optimizations:
KMeans clustering complexity: The traditional KMeans algorithm has a complexity of
KS test complexity: The Kolmogorov-Smirnov test has a complexity of
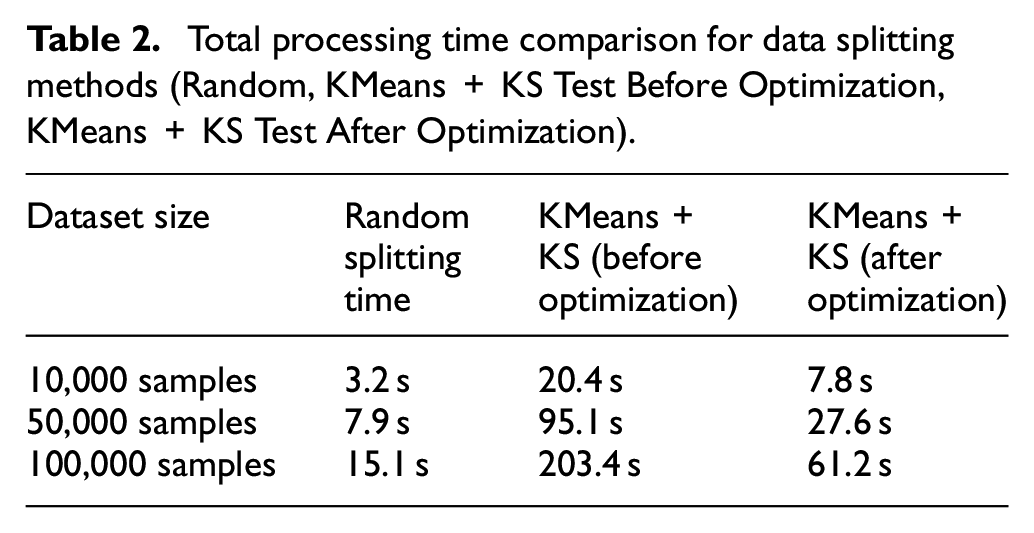
To further validate these improvements, we measured the overall processing time required for data preprocessing and feature balancing, comparing our optimized method against a standard random splitting technique. Results, as shown in Table 2 below, demonstrate the time saved through our optimizations.
Total processing time comparison for data splitting methods (Random, KMeans + KS Test Before Optimization, KMeans + KS Test After Optimization).
Conclusion
Through the use of Mini-Batch KMeans and parallel processing for the KS test, we have significantly improved the computational efficiency of our proposed method. These optimizations allow the approach to scale effectively with larger datasets, addressing the initial concerns about computational overhead. As a result, our method achieves enhanced data balancing and uniform feature distribution between training and testing sets while remaining computationally feasible for real-world applications.
Conclusion of the proposed method
The proposed stratified data splitting method with KMeans clustering is an effective solution to the problem of feature imbalance and uneven distribution in HAR data. By combining feature clustering and stratified data splitting, we have created a more balanced training and testing dataset, enabling machine learning models to achieve higher and more reliable performance. This method not only fills the gap in current research, but also opens new directions for addressing feature-level data imbalance, which can be widely applied to other fields such as natural language processing, computer vision, and big data analysis.
Exploratory data analysis
Data description
The HAR with Smartphones dataset used in this study includes everyday activities such as walking, standing, sitting, lying down, and going up and down stairs. Data were collected from two main types of sensors: accelerometer and gyroscope, which were worn on the bodies of the participants. These sensors recorded data in the form of characteristics related to acceleration along the
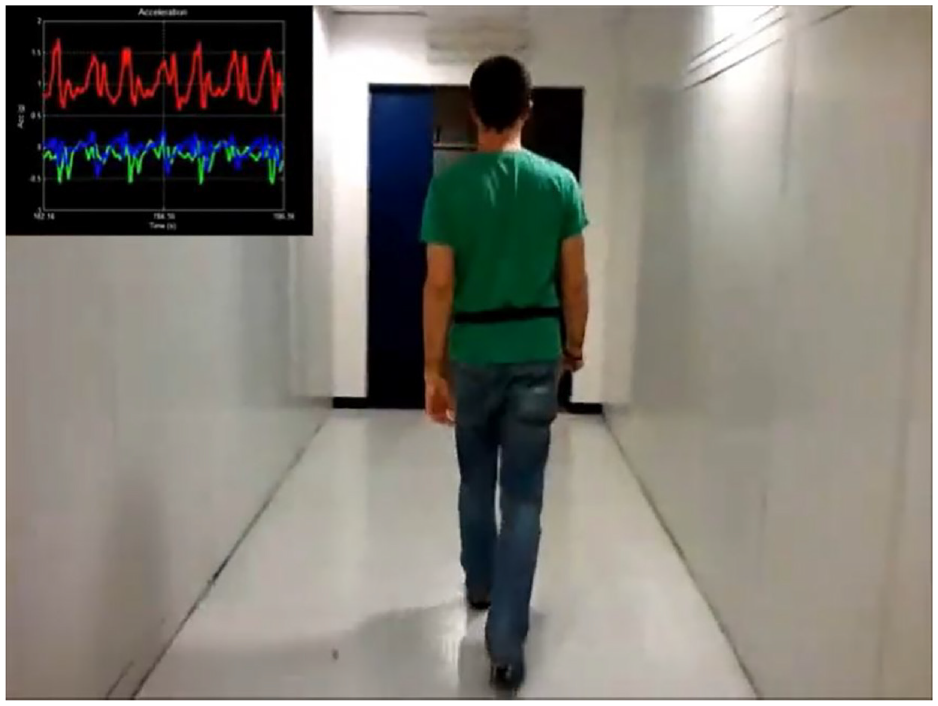
A walking person and data collected from two types of sensors
The HAR with Smartphones dataset was first published in 2012 by a research group consisting of Davide Anguita, Alessandro Ghio, Luca Oneto, Xavier Parra, and Jorge L. Reyes-Ortiz. This is one of the most popular datasets in the field of human activity recognition, collected using smartphone sensors. The data set is currently available at the UCI Machine Learning Repository, one of the most reputable machine learning repositories, providing a valuable resource for many studies in machine learning and artificial intelligence. URL: UCI Machine Learning Repository - Human Activity Recognition with Smartphones.
Dataset overview: The HAR with Smartphones dataset consists of a total of 10,299 data samples, divided into six different activity classes: walking (WALKING), walking upstairs (WALKING_UPSTAIRS), walking downstairs (WALKING_DOWNSTAIRS), sitting (SITTING), standing (STANDING), and lying (LAYING). These data samples were collected from accelerometer and gyroscope sensors, with a total of 561 features, including measurements along the
Detailed data description: The HAR with Smartphones dataset includes six everyday activity classes: walking, walking upstairs, walking downstairs, sitting, standing, and lying. These activities were chosen to clearly reflect differences in body movement in real-world scenarios. Data was collected from 30 volunteers aged 19 and 48. Each participant wore a smartphone (Samsung Galaxy S II) on their waist and performed pre-defined activities. Data collection took place under controlled conditions, with the accelerometer and gyroscope sensors placed in the same position on the body for all participants, recording acceleration and angular velocity at a frequency of 50Hz. After data collection, the data was processed and cleaned, with invalid values removed to ensure accuracy and consistency, resulting in 561 input features for machine learning models and analysis.
Sensor signals were preprocessed by applying a noise filter and then sampled using fixed-width sliding windows of 2.56 s with 50% overlap (128 readings/window). Sensor acceleration signals, including gravity and body movement components, were separated into body acceleration and gravity using a Butterworth low-pass filter. Gravity is assumed to contain only low-frequency components, so a filter with a cut-off frequency of 0.3 Hz was used. A feature vector was obtained by calculating the variables in the time and frequency domains from each window. Figure 4 shows the amplitude curves and movement states.
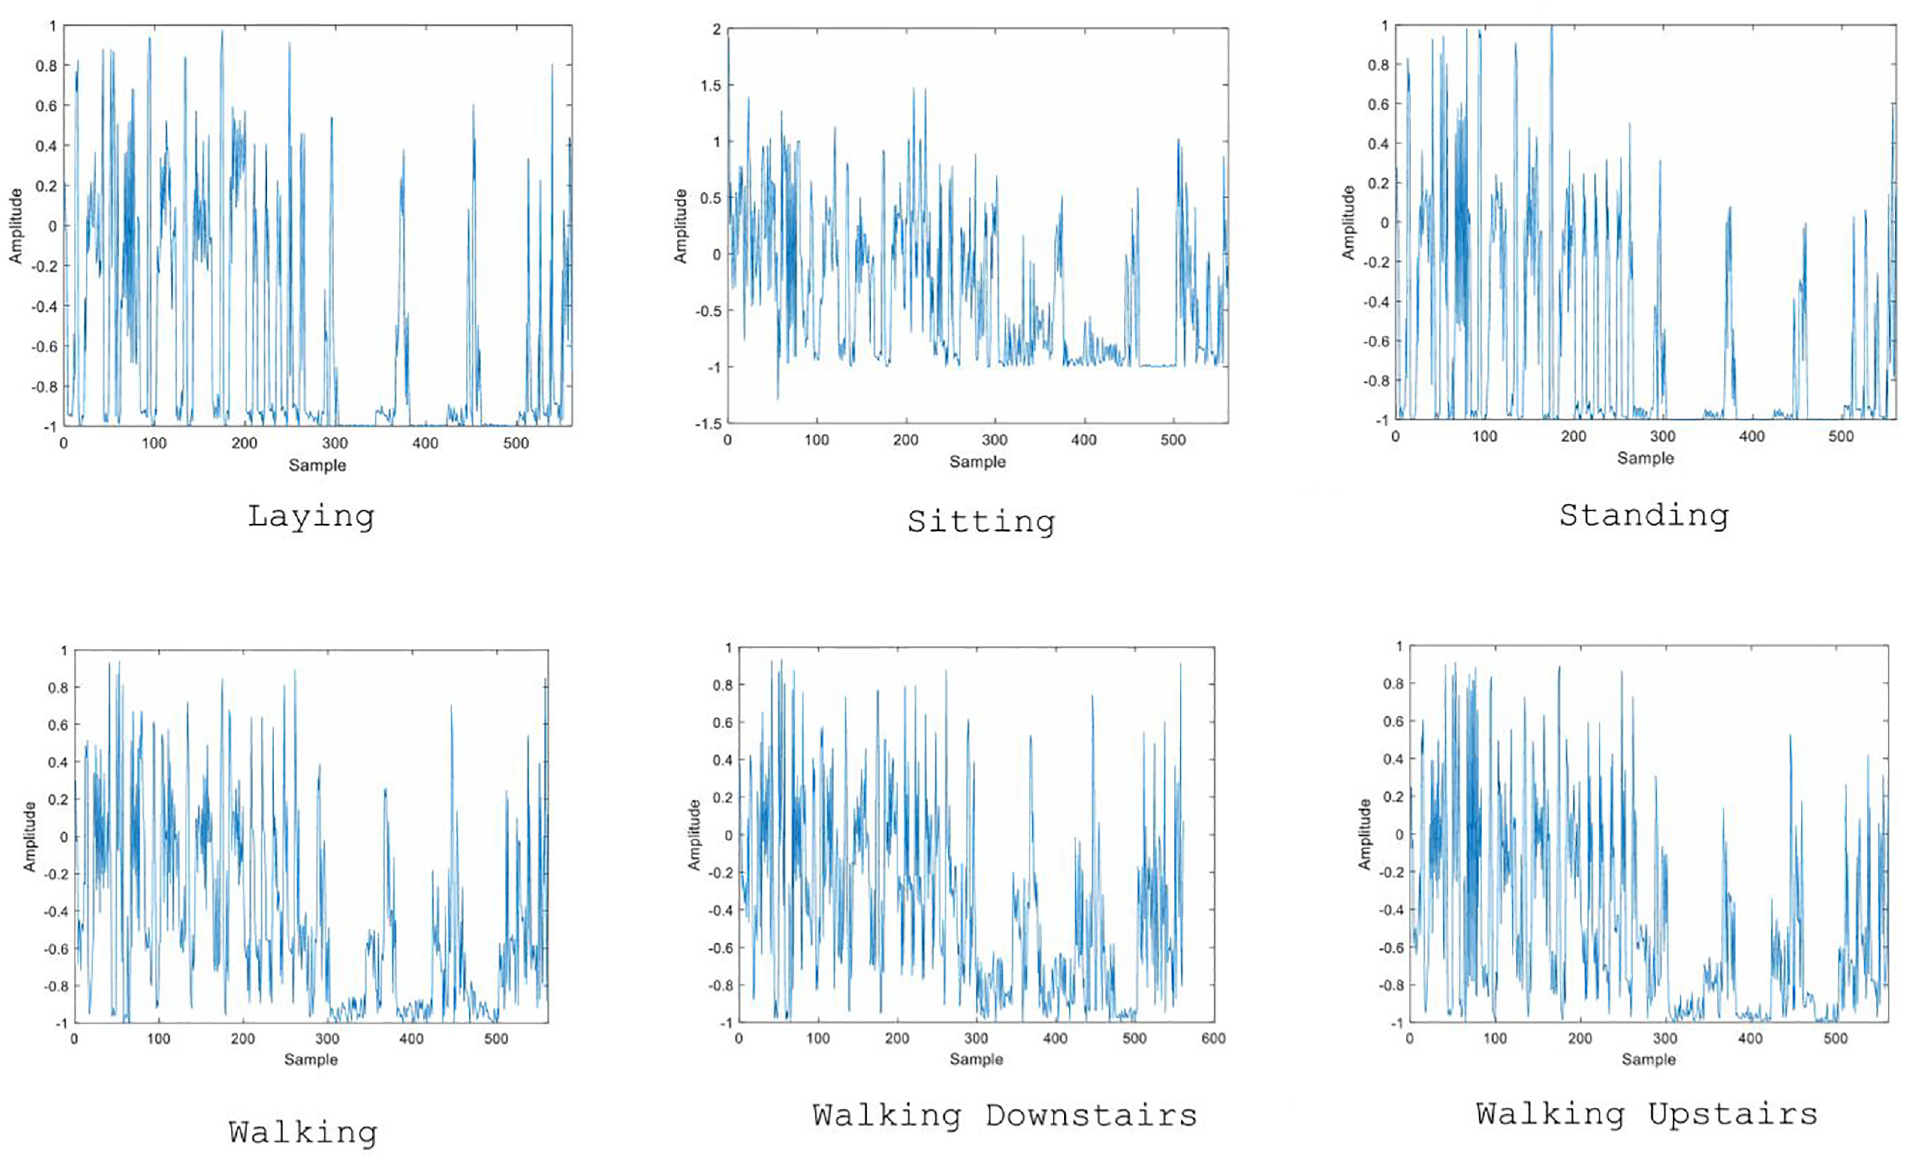
Six main activities in the data set.
Exploratory data analysis (EDA) is a crucial step in understanding the structure, relationships between features, and potential anomalies in the data set. For the HAR problem, EDA not only helps explore the data, but also provides insights into issues that may affect the performance of machine learning models, particularly feature-level data imbalances.
The importance of EDA in HAR
In the field of HAR, ensuring balanced data is not only about the number of samples across activity classes but also about the distribution of features throughout the dataset. Previous studies have often focused solely on optimizing model accuracy, while neglecting the evaluation of feature distribution. This can lead to biased models, making them unable to generalize well when applied to real-world scenarios.
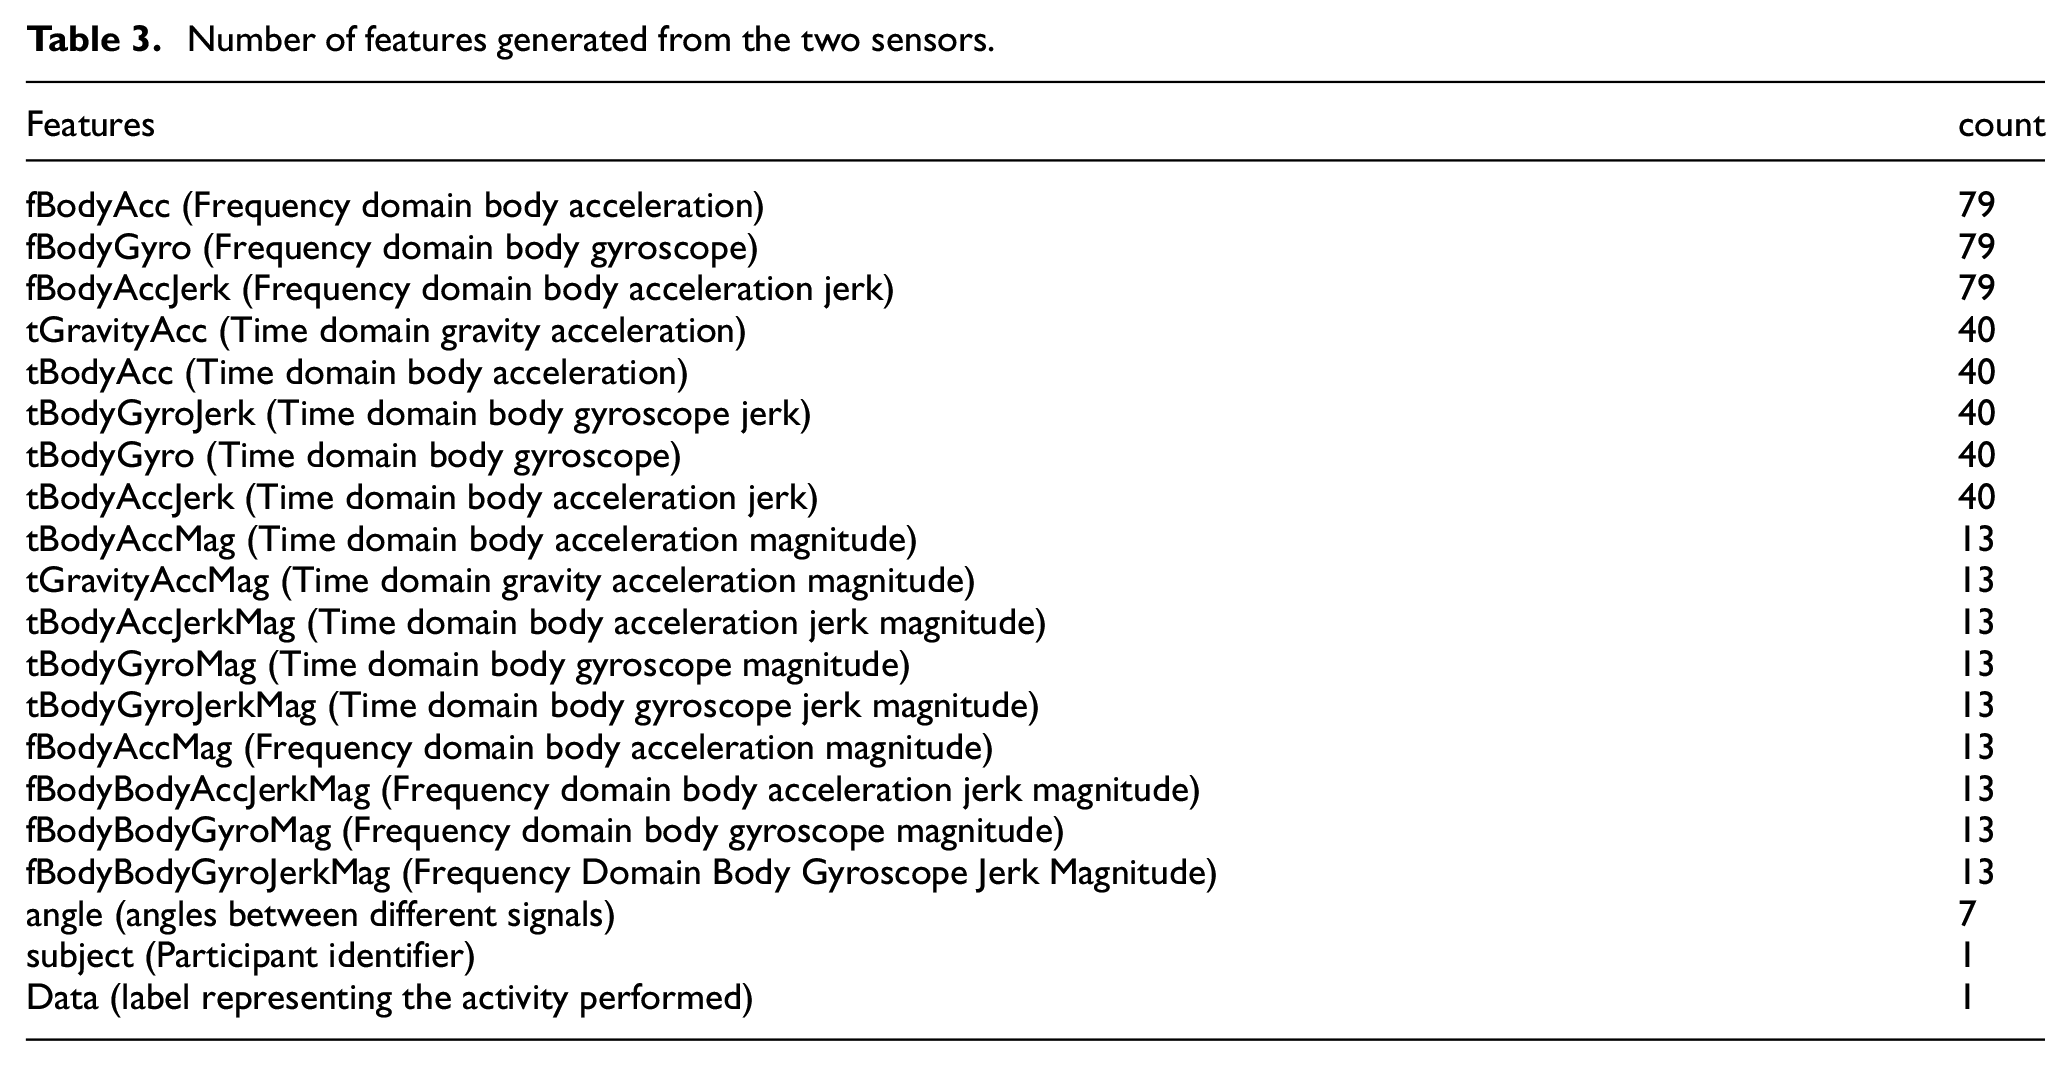
A key factor in the HAR data is the large number of features generated from just two main sensors: the accelerometer and the gyroscope. According to the research team report, a significant number of characteristics were created from these two types of sensors in Table 3. Specifically, the features mainly include information on acceleration and angular velocity, with some related to gravity. The generation of many features from these sensors has contributed to increased model accuracy, but it also increases the risk of imbalance in feature distribution, particularly when they are not evenly distributed across the activity classes.
Number of features generated from the two sensors.
Exploring the data structure
The Human Activity Recognition with Smartphones dataset contains features such as acceleration along the x, y, z axes and angular velocity, collected from body-worn sensors during the performance of everyday activities. Although this data set is balanced in terms of the number of samples in the activity classes as seen Figure 5, exploratory data analysis (EDA) reveals that the distribution of features is not uniform between the training and testing sets.
KMeans clustering algorithm.
To explore this distribution, we use the KS test to check for similarities in the feature distribution between the training and testing sets.
The red dashed line indicates a threshold of 0.05 used to determine significant differences between the distributions of the training and testing sets. The plot in Figure 6 shows significant differences, with only 66 of 562 features having a p-value greater than 0.05 (approximately 11.74%). This implies that the majority of the features have different distributions between the two datasets, which is crucial, as it may lead to model bias during training if not properly addressed. The difference in the feature distribution between the training and testing sets can cause the machine learning model to learn patterns that do not represent real-world data, leading to poor performance when applied to new data. Therefore, identifying and addressing this issue is essential to improve the model’s generalization ability of the model.
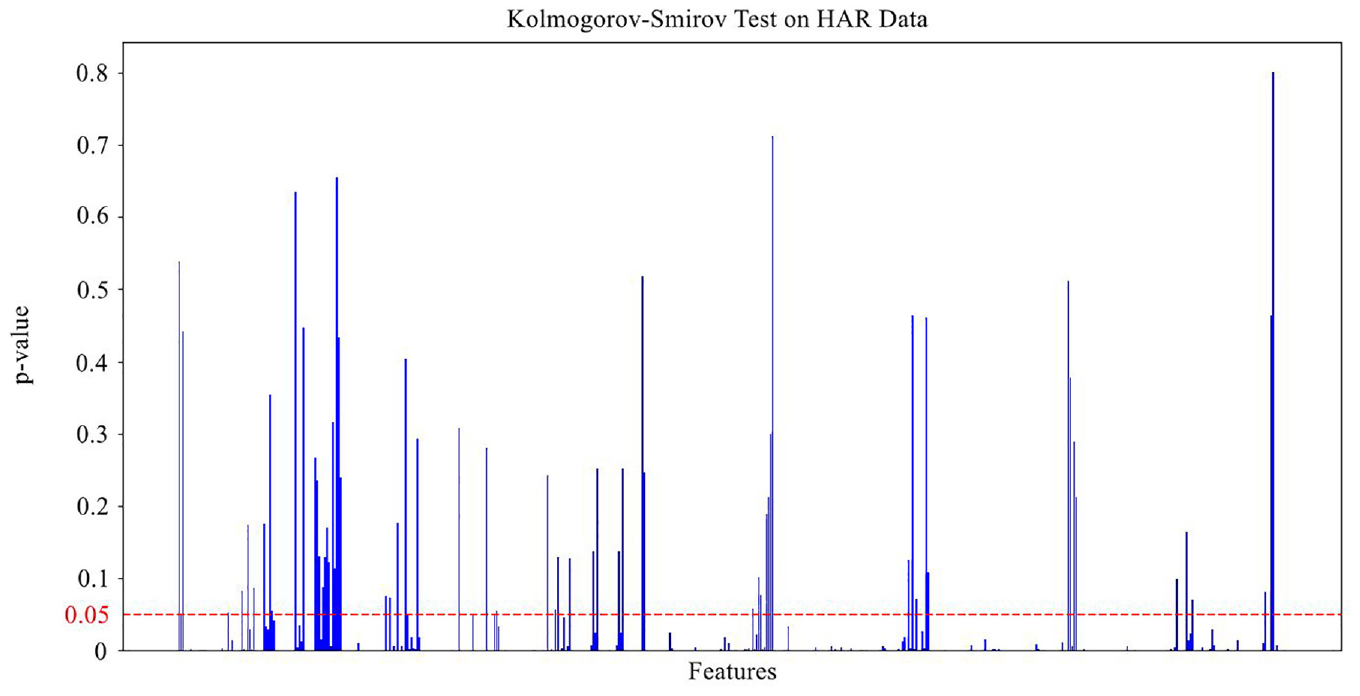
The KS test plot on HAR data between training and testing sets.
Research methodology
Stratified train-test split strategy
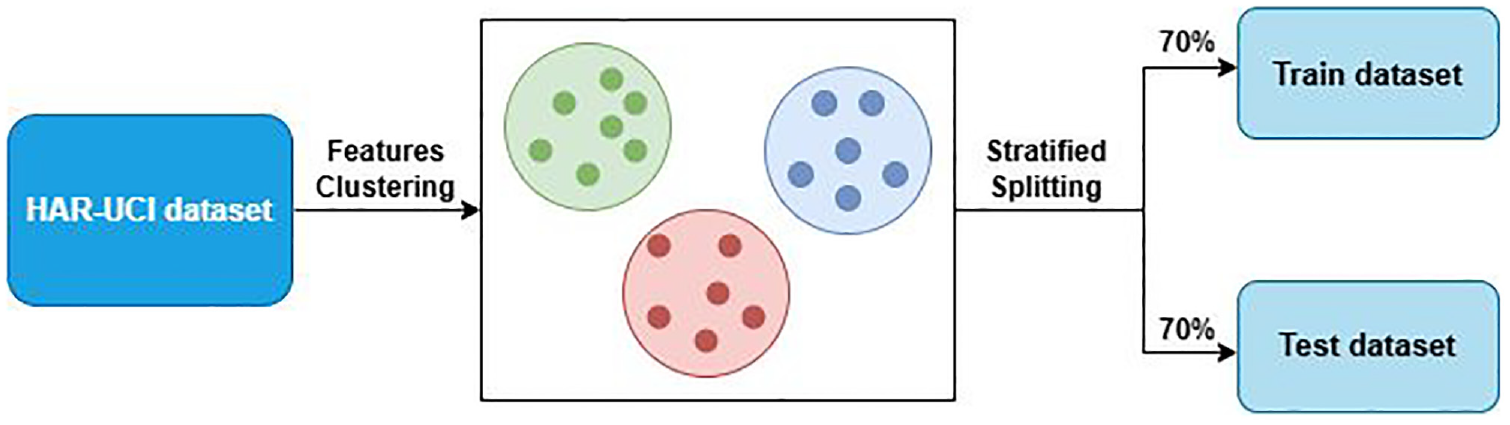
The results of the KS Test confirm that the balance of the feature distribution between the training and testing sets is essential for building high-performance machine learning models with strong generalization capabilities. To address this issue, we propose an innovative method that combines KMeans clustering with the stratified train-test split technique, based on feature clusters generated from KMeans.
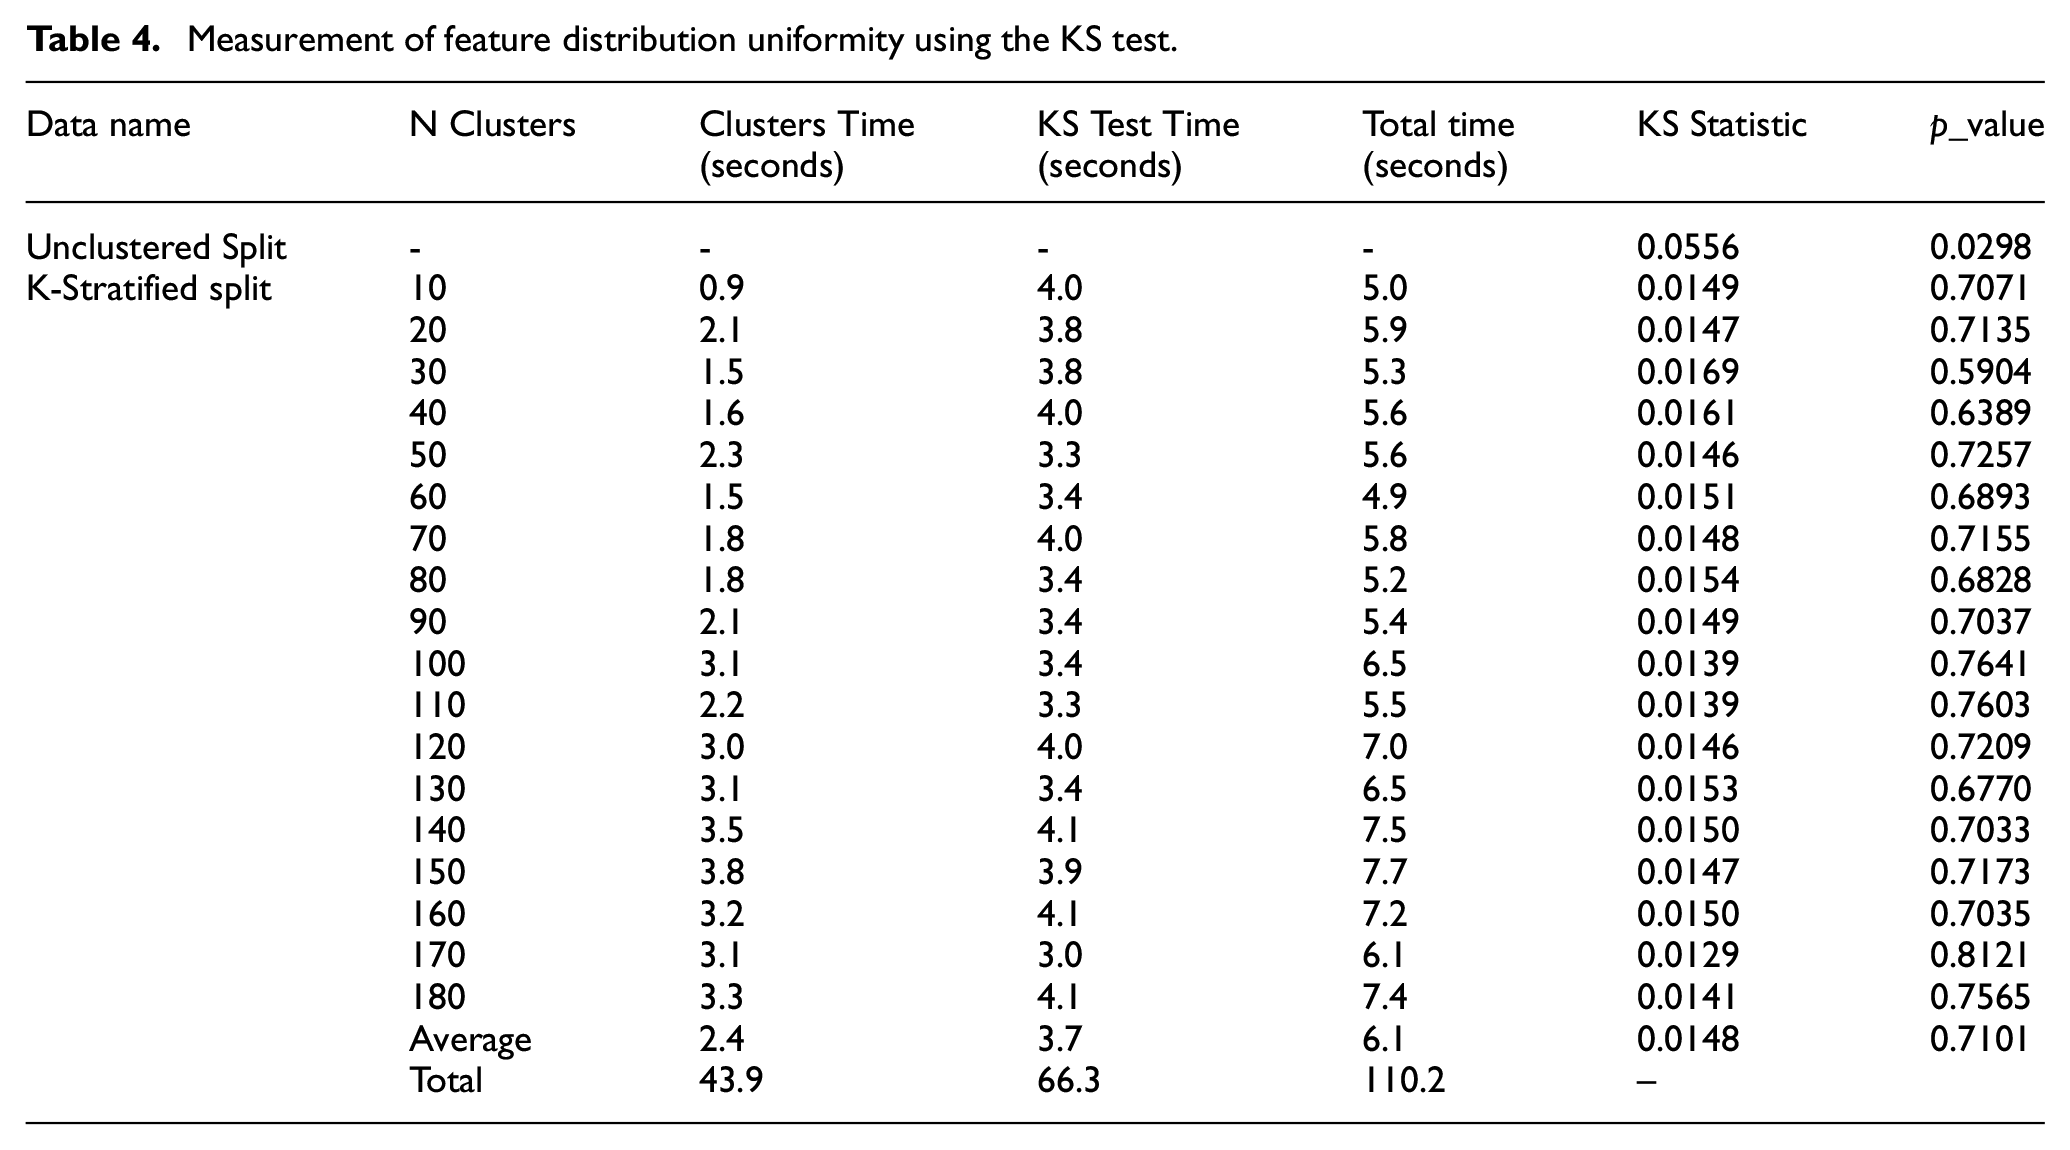
Our method works as follows as shown in Figure 7: First, we apply the KMeans algorithm to cluster the entire dataset based on its characteristics. This process generates clusters in which samples exhibit high similarity of features. Then, we perform a stratified data split based on these clusters, ensuring that both the training and testing sets include representative features from all clusters. This helps balance the feature distribution between the two sets, minimizing bias and improving the generalization capability. Combining KMeans clustering with stratified splitting based on feature clusters not only significantly enhances model accuracy but also improves reliability and stability when applied to test datasets and real-world applications. This represents a major step forward, introducing a new approach to handling feature imbalance, particularly in complex and multidimensional problems such as HAR. This method ensures that the machine learning model is trained on a diverse and fully representative dataset, ultimately boosting its performance and wide applicability in practical settings. During the experiments, we did not randomly choose the number of clusters but instead employed cluster selection methods for Kmeans as shown in Table 4. This was done to determine the parameters that produced the most uniform feature distribution.
➢ The time for the clustering step ranges from about 0.93 to 3.8 s, depending on the value of n_clusters. This shows that, despite increasing the number of clusters, the computation time does not increase too much. Choosing different values of n_clusters helps ensure that the clustering reflects the data structure well without causing computational overload.
➢ The time for KS test ranges from about 3.28 to 4.08 s. This is an additional cost to ensure that the training and testing data are evenly distributed, which improves the generalization ability of the model. Estimate the cost of one training session, then assess that doing this step only costs a very small portion of the overall process but has positive results.
Stratified data splitting strategy using kmeans clustering.
Measurement of feature distribution uniformity using the KS test.
In this study, the KMeans algorithm was employed to cluster the features in the dataset based on their similarities. The goal of this clustering was to ensure that both the training and testing sets contained representative features from all clusters, thereby reducing feature-level imbalance and improving the generalizability of the model:
➢ The clustering criteria used by KMeans was based on minimizing the sum of squared distances between data points and their respective cluster centroids. This ensures that the data points within each cluster are highly similar in terms of their feature values. The Euclidean distance was chosen as the metric to measure the similarity between features, as it is widely used in clustering tasks involving continuous data like the HAR dataset.
➢ The number of clusters (k) was selected through an iterative process using methods such as the elbow method and the Silhouette Score to determine the most appropriate value of k that represents the data structure well without causing overfitting or unnecessary computational complexity. The elbow method evaluates the within-cluster sum of squares (WCSS) and looks for the point where the rate of decrease sharply slows down, indicating the optimal number of clusters. The Silhouette Score, on the other hand, measures how well-separated the clusters are, with higher values indicating better-defined clusters.
In our experiments, we tested several values of k, ranging from 10 to 180 clusters, to evaluate the performance of the model after applying stratified data splitting based on these clusters. The results indicated that using k = 50 clusters provided the best balance between computational efficiency and feature distribution uniformity, as measured by the Kolmogorov-Smirnov (KS) test. Clustering with k = 50 resulted in a significant improvement in the feature distribution, with a KS statistic of 0.0146 and a p-value of 0.7257, indicating a near-uniform distribution across the training and testing sets. Additionally, increasing the number of clusters beyond 50 provided marginal improvements in performance but at the cost of higher computational complexity. As such, k = 50 was chosen as the optimal number of clusters to balance performance and efficiency. By ensuring that each cluster is represented proportionally in both the training and testing sets, this clustering-based approach significantly improved the model’s ability to generalize to unseen data, resulting in higher accuracy, precision, recall, and F1 scores.
Chart analysis after performing KS test with optimal parameters
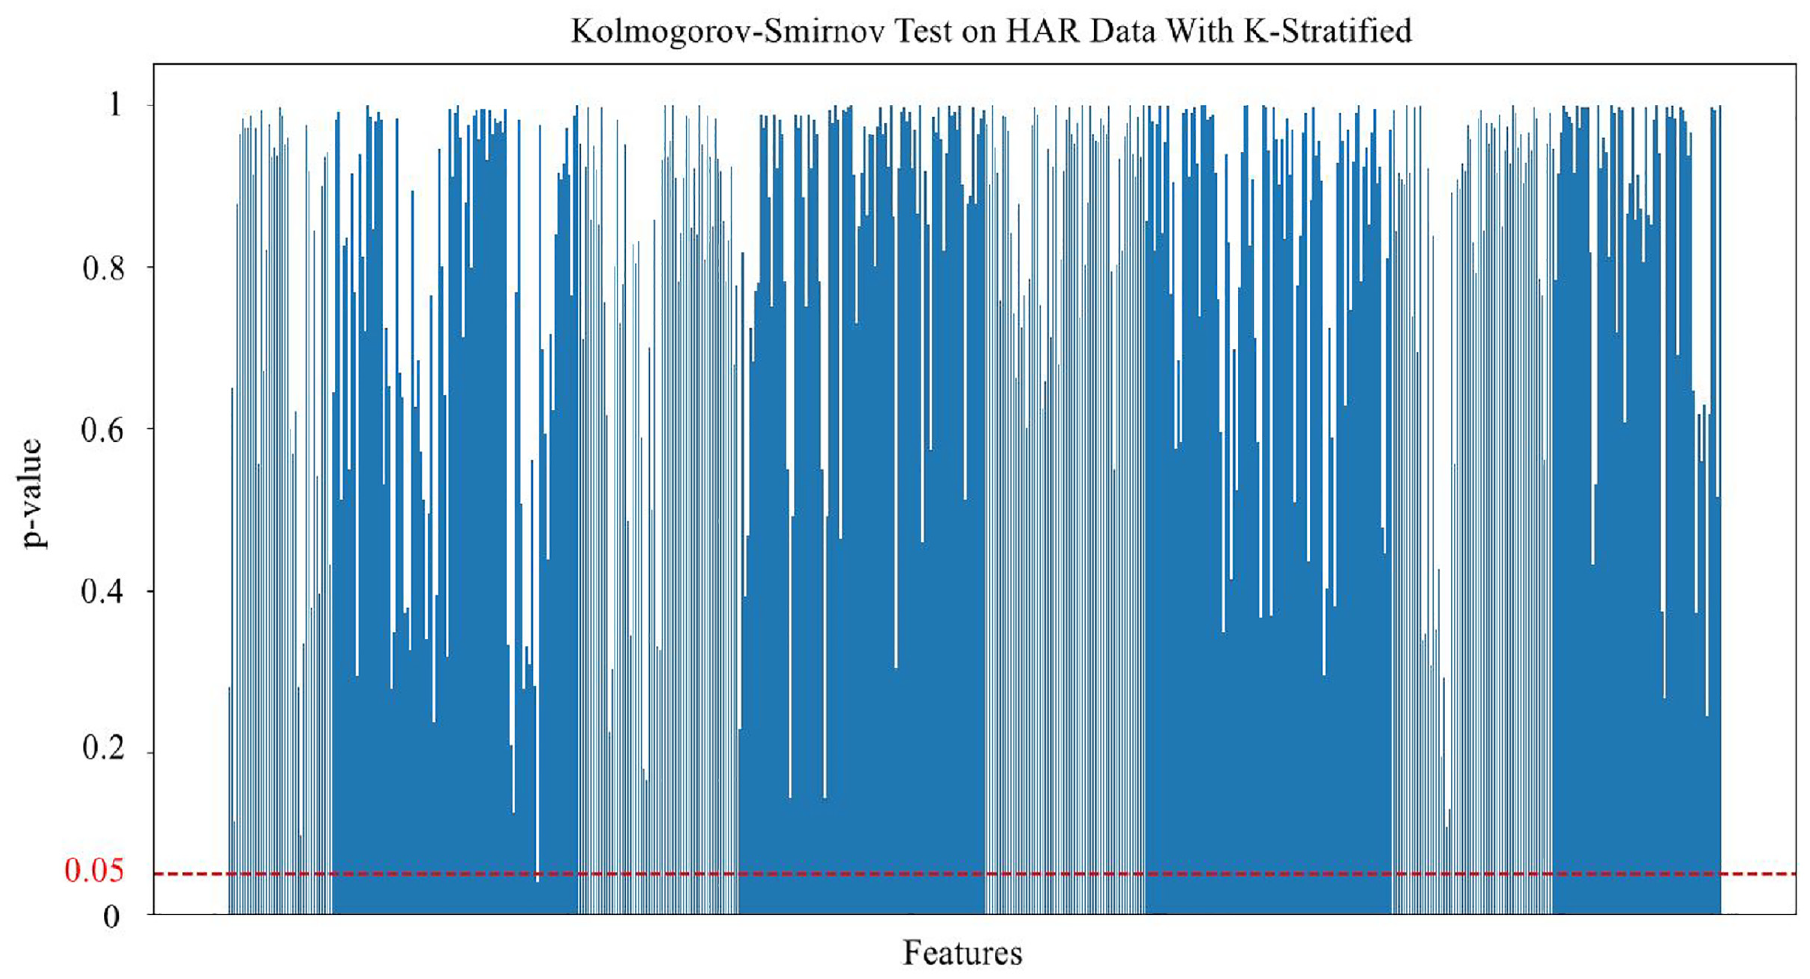
The KS Statistic chart shows that the original data, not stratified using KMeans clusters (Unclustered Split), have a much higher KS Statistic compared to the preprocessed data. This implies that the feature distribution in the original data is uneven. On the contrary, after applying the stratified split based on KMeans clustering, the KS Statistic decreases significantly, indicating an improved balance in feature distribution as shown in Figure 8. The P-value chart supports this conclusion by showing that the original data had a P-Value close to zero, confirming significant differences in feature distribution. Meanwhile, the preprocessed methods show a marked increase in P-value, approaching 1, indicating greater similarity between distributions.
KS test chart between training and testing sets with KMeans stratified splitting strategy.
The KS test chart above demonstrates a notable result in examining the uniformity of feature distribution between the training and testing sets in the HAR with Smartphones dataset. This chart displays the p-value for each feature, with the vertical axis representing the p-value and the horizontal axis representing the features. The red line on the graph represents the p-value threshold of 0.05, commonly used to determine statistical significance. In the graph, most features have p-values exceeding the 0.05 threshold, with a ratio as high as 99.82% (561 out of 562 features). This implies that after applying preprocessing methods, the features in the dataset have achieved significant balance across the feature distribution. This is a stark contrast to the initial state of the raw dataset (Unclustered Split), where imbalance in feature distribution was evident, reflected by very low KS Statistic values for most features. Meanwhile, with the stratified feature clustering strategy, the KS statistic is much higher, indicating greater uniformity in feature distribution between the training and testing sets.
Model training
Training process
We conducted model training on datasets stratified by feature clusters (K-Stratified Split) and compared it with unstratified datasets (Unclustered Split). The training process followed these specific steps:
- Preparation of training data: We used data sets processed with the best feature stratification methods based on the Kolmogorov-Smirnov test (KS Test). Additionally, the Unclustered Split dataset was used as a control for comparison to assess training effectiveness.
- Configuration and setup of machine learning models: Models were configured with optimal parameters, such as learning rate and batch size, to ensure fast convergence without overfitting. The number of epochs was also adjusted to ensure that the models achieved the highest possible performance during training.
- Training process: Each machine learning model was trained on the different datasets, including those mentioned above.
- Evaluation and comparison of results: After completing the training process, the models were evaluated based on key performance metrics such as accuracy, recall, specificity, precision and F1-score.
We conducted experiments on common classification models, including Random Forest, Decision Tree, K-Nearest Neighbors, Support Vector Machine, Gaussian Naive Bayes, and Logistic Regression. Each model was configured with the following specific parameters:
Random forest: RandomForestClassifier (random_state = 5, n_estimators = 50)
Decision tree: DecisionTreeClassifier (random_state = 5, max_depth = 10)
K-Nearest neighbors: KNeighborsClassifier (metric = “Manhattan”, n_neighbors = 7)
“SVM-SGD”: SGDClassifier (max_iter = 1000, tol = 1e-3, random_state = 5, alpha = 0.001, penalty = “elasticnet”)
Gaussian naive bayes: GaussianNB
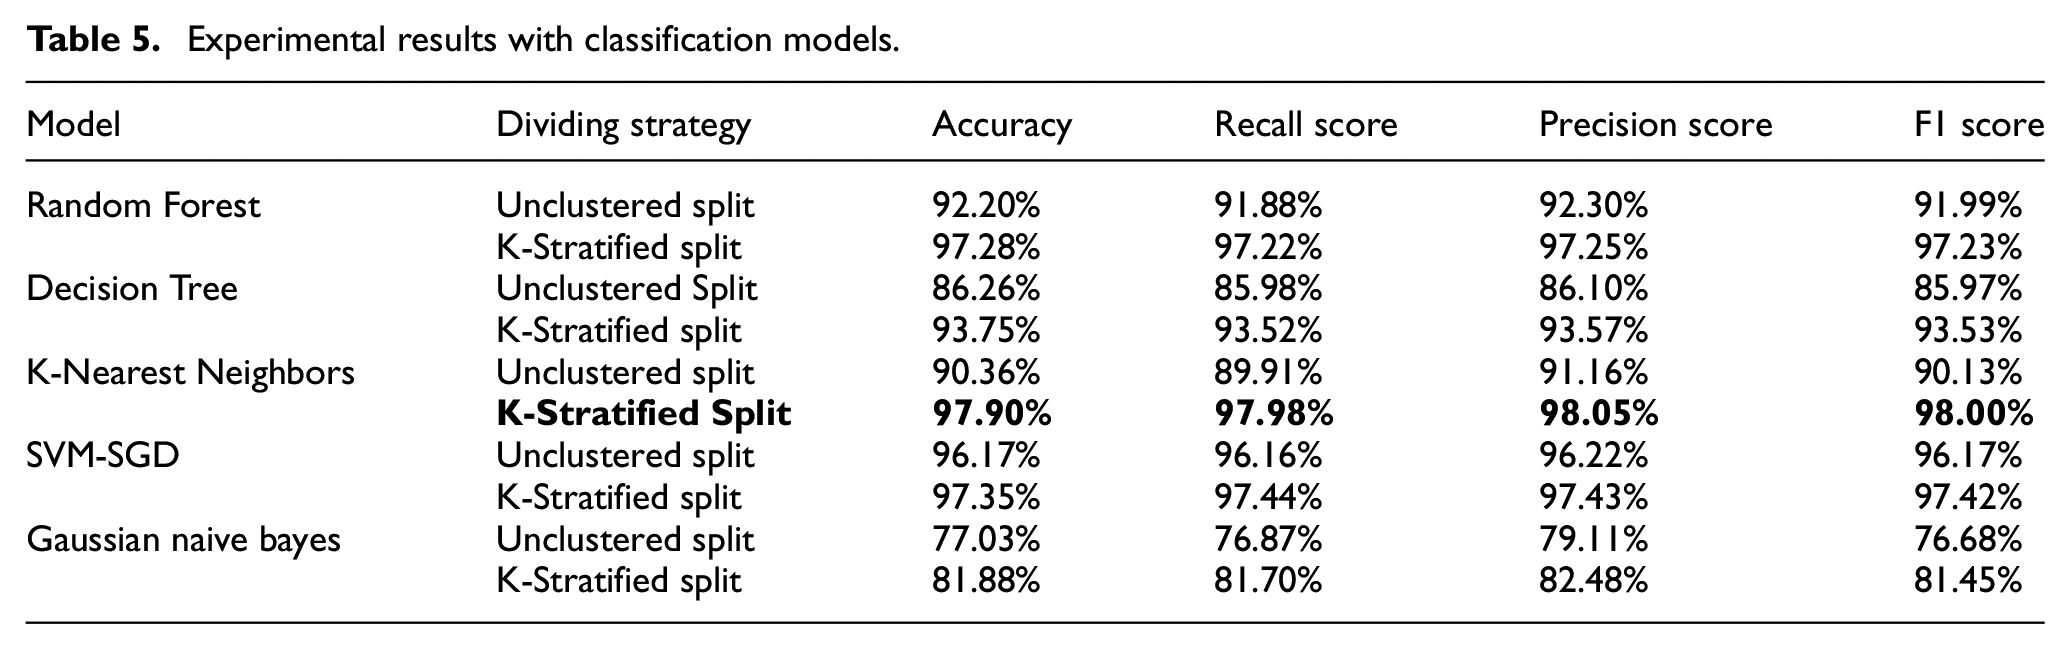
The results of the experiments and evaluations indicated that most of the models showed a significant improvement when using the stratified data splitting method. Specifically, the KNN model achieved the highest accuracy and F1 score when using the K-Stratified Split, with 97.90% and 98.00%, respectively. This demonstrates that KNN, when combined with an appropriate data splitting method, can optimally leverage the dataset’s features to provide accurate predictions.
Other models, such as Random Forest and SVM-SGD, also showed significant improvement when moving from Unclustered Split to K-Stratified Split, with Random Forest achieving an F1 score of 97.23% and SVM-SGD achieving an F1 score of 97.42%. This demonstrates that the K-Stratified Split method not only improves the performance of a specific model, but also has broad applicability across various classification models. Table 5 summarizes the results obtained from the experiments:
Experimental results with classification models.
Model fine-tuning
Based on the results obtained during the model training with different data preprocessing methods, we found that the K-Stratified Split method proved to be the most effective. With the highest accuracy achieved using this method, we decided to use it as the foundation for the next step in model optimization. This step demonstrates that combining feature stratification with various data processing techniques can yield the best results. It can be concluded that additional methods can be employed in conjunction with the cluster-based data splitting strategy. The HAR with Smartphones dataset contains a large number of features, which can make the model overly complex and difficult to optimize. Therefore, to reduce data complexity while retaining essential information, we decided to experiment with dimensionality reduction after applying the K-Stratified Split method. Each classifier model was trained and evaluated on the same dataset that had been preprocessed using K-Stratified Split and dimensionality reduction with LDA (KStratified-LDA). The training process was carried out with either default or optimized parameters, and the results were compared based on key performance metrics such as accuracy, recall, precision, and F1 score.
Training process
Input data: The dataset was preprocessed by applying K-Stratified Split and dimensionality reduction using LDA.
Testing with each classification model: Each model was trained with the same dataset and identical parameters.
Performance evaluation: After training, the models were evaluated on the test dataset, and performance metrics were compared with the previously used models.
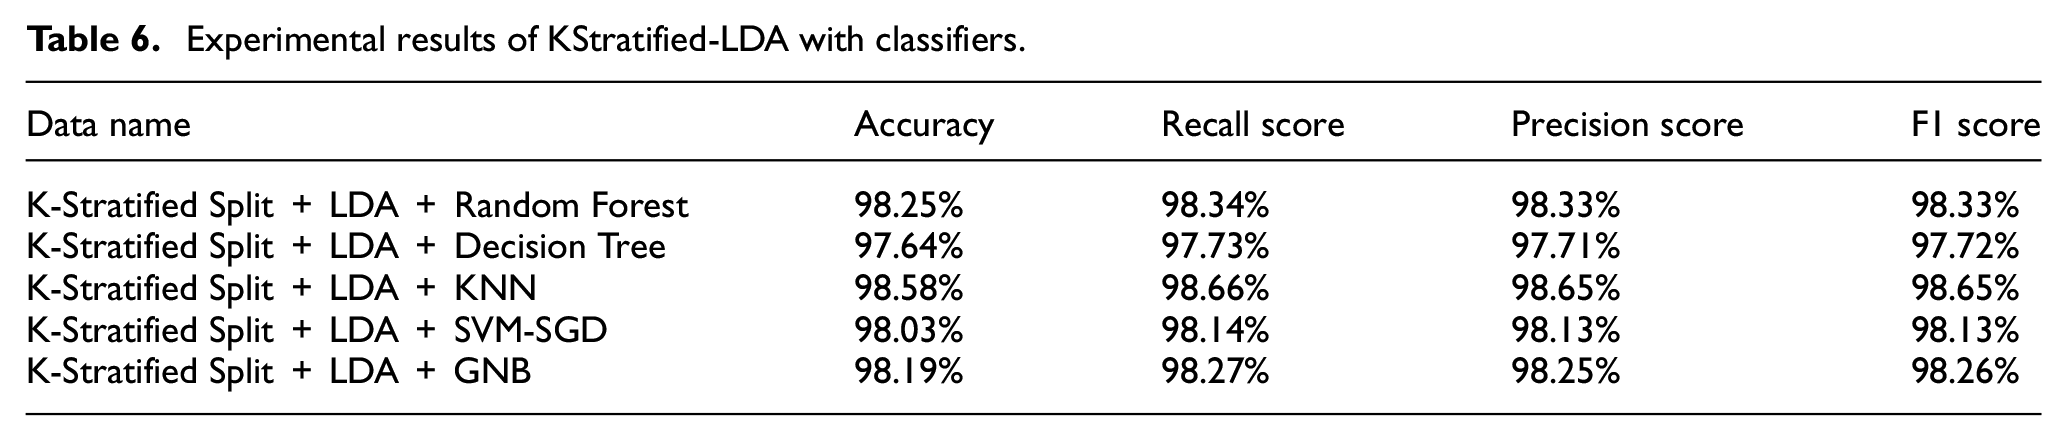
The experimental results with different classifiers on the KStratified-LDA processed dataset in Table 6 are summarized as follows:
Random forest: Achieved 98.25% accuracy, outperforming the initial method by 0.97%. The ability to combine multiple decision trees helped random forest avoid overfitting, resulting in superior outcomes.
Decision tree: Showed high performance, with an accuracy of 97.64%, 3.89% higher than without dimensionality reduction
K-Nearest neighbors (KNN): KNN achieved the best performance with 98.58% accuracy, and high recall, precision, and F1 scores of 98.66%, 98.65%, and 98.65%, respectively. This is a very impressive result, with improvements in accuracy, recall, precision, and F1 scores of 0.68%, 0.68%, 0.60%, and 0.65%, respectively. This demonstrates that KNN is the most outstanding model when working with data preprocessed using KMeans and LDA.
SVM-SGD: Achieved a 98.03% accuracy, 0.68% better than before. The model showed balanced results in recall, precision, and F1 score.
Gaussian naive bayes: Achieved 98.19% accuracy, with a significant improvement of 16.31%. The recall, precision, and F1 score increased by 16.57%, 15.77%, and 16.81%, respectively. This is an excellent result when combining dimensionality reduction and cluster-based feature stratification.
Experimental results of KStratified-LDA with classifiers.
The experimental results show that KNN is the best-performing model in this case, and there are several key reasons for KNN’s superiority when combining K-Stratified Split with LDA:
KMeans clustering creates homogeneous data groups: KNN is a distance-based algorithm that operates by finding the nearest neighbors in feature space. When the data is clustered by KMeans, the data points within the same cluster tend to be closer to each other in feature space, which perfectly aligns with how KNN functions. Clustering simplifies the data and makes groupings clearer, allowing KNN to find closer neighbors more accurately, leading to better classification results.
Dimensionality reduction with LDA optimizes distances: LDA not only reduces dimensions but also maximizes the separation between classes in feature space. This helps KNN differentiate between classes more easily based on the distance between data points. Retaining only the most important features for classification allows KNN to better leverage the data, improving accuracy and other performance metrics.
KNN effectively utilizes feature-stratified data: The KStratified-LDA processed data showed better results, helping KNN avoid being affected by uneven feature distribution. This allows KNN to operate more stably and accurately across all features of the activity classes. The homogeneity of the data after feature stratification and dimensionality reduction enables KNN to function optimally, with high accuracy in classifying data samples based on feature distances.
Simplicity and efficiency of KNN: KNN is a simple yet effective algorithm that does not require extensive parameter optimization compared to other models. This allows KNN to take full advantage of the preprocessed data without being influenced by improper parameter choices.
Combining these factors, it can be concluded that KNN, when combined with K-Stratified Split and LDA, is the most effective classification model for the preprocessed HAR dataset. The homogeneity and optimization in feature space after applying preprocessing steps enable KNN to excel in accurately classifying different activities.
The proposed method introduces additional computational steps compared to standard data-splitting techniques, particularly due to the KMeans clustering and Kolmogorov-Smirnov (KS) test. The complexity of KMeans clustering is
Strategy for expanding validation across multiple datasets
Diverse dataset selection
Currently, our proposed method has been evaluated on the HAR with Smartphones dataset, a well-known dataset for human activity recognition with relatively simple feature structures derived from accelerometer and gyroscope data collected through smartphones. However, to test our method’s generalizability, the article will incorporate additional datasets with more complex and varied feature distributions:
WISDM (wireless sensor data mining): The WISDM dataset contains data from daily and sports-related activities, collected via mobile devices. This dataset has diverse activities with rapid and varied feature shifts, which will help assess our method’s capacity to handle complex data with significant variability.
PAMAP2 dataset: The PAMAP2 dataset includes detailed activity data collected from multiple wearable sensors, covering a range of daily activities and physical exercises. Its complex feature structures and overlapping class distributions will provide a challenging environment for our method and allow us to test its performance in scenarios with intricate data structures.
Methodological application
Applying KMeans-Based stratified splitting: For each additional dataset, the article will implement our KMeans-based stratified splitting strategy to balance feature distributions between training and testing sets. This will allow us to test the method’s effectiveness in ensuring consistent feature distribution on datasets with varying characteristics.
Kolmogorov-Smirnov (KS) test for distribution uniformity: The article will use the KS test to verify the uniformity of feature distributions across the training and testing sets for each dataset. Successfully maintaining uniform distributions across diverse datasets will confirm our method’s robustness in feature balancing across multiple contexts.
Result analysis and performance comparison
Performance across evaluation metrics:accuracy, recall, precision, and F1 Score: The article will record these metrics on each additional dataset to evaluate the effectiveness of our method in different contexts. By comparing these results to those obtained with the original HAR dataset, we can determine whether the performance improvements are consistent across datasets with varying characteristics.
Comparison with traditional random splitting: To further clarify the advantages of our KMeans-based stratified approach, we will conduct a comparative analysis using random data splitting. By measuring performance metrics on the WISDM and PAMAP2 datasets with both methods, the article aim to demonstrate the superiority of our approach in maintaining feature balance and enhancing model performance.
Analysis of feature distribution uniformity: Using the KS test, the article will calculate the proportion of features that achieve uniform distribution across training and testing sets. A high proportion of uniformly distributed features across all datasets will serve as evidence of the method’s capacity to mitigate distribution imbalances, reinforcing its general applicability.
Conclusion
Expanding our method to additional datasets such as WISDM and PAMAP2 will broaden the scope of our research and substantiate our method’s generalizability. The article expects that the KMeans-based stratified splitting will consistently enhance feature balance between training and testing sets and yield robust results across various datasets. Successful application on these datasets would demonstrate the potential of our method to extend beyond human activity recognition and open new directions for machine learning applications involving complex, multidimensional data. The article appreciates the reviewer’s suggestion to expand the validation scope, as the article believes this will enhance the credibility and impact of our research.
Results and discussions
The results from the experiments show that K-Nearest neighbors (KNN), when combined with the K-Stratified-LDA preprocessing method, is the most effective classification model for the HAR task. The uniform feature distribution and the optimized distances between classes after applying the proposed method allowed KNN to outperform other models. Although other models like SVM and random forest also demonstrated high performance, they could not surpass KNN in the specific context of this study.
The provided confusion matrix in Figure 9 shows the performance of the classification model on the HAR dataset after applying feature-stratified splitting, dimensionality reduction using Linear Discriminant Analysis (LDA), and classification by K-Nearest Neighbors (KNN).
LAYING: The model accurately classified all 584 instances of the “laying“ activity, demonstrating excellent recognition capability for this activity.
SITTING: A total of 515 samples were correctly classified into the “sitting” class; however, 18 samples were misclassified as “standing.” This misclassification could be due to the similarity in features between these two static states, making it difficult for the model to distinguish between them.
STANDING: The model correctly classified 545 samples as “standing,” but 23 samples were misclassified as “sitting.” This indicates that the model faced challenges in distinguishing between these two static states, where acceleration and angular velocity could be very similar.
WALKING: The model accurately classified 524 samples as “walking,” but two samples were misclassified as “walking upstairs.” This confusion could be due to the similar motion features of these two activities, especially during transition phases.
WALKING_DOWNSTAIRS: The model correctly classified 414 samples, with only one sample misclassified as “walking upstairs.” Although rare, this suggests some overlap in movement features between ascending and descending stairs.
WALKING_UPSTAIRS: The model accurately classified all 464 instances of “walking upstairs,” confirming its ability to recognize this activity.
A notable point in the confusion matrix is the misclassification between “STANDING” and “SITTING.” The reasons for this might include:
Similarities in motion features: Both activities are static states with minimal body movement. The acceleration and angular velocity might be similar between these states, making it challenging for the model to distinguish them.
Transition between activities: In real-world scenarios, some samples might represent transitional phases between sitting and standing, leading to classification difficulties. These samples could lie at the boundary between the two states, causing confusion for the model.
Linear discriminant analysis (LDA): LDA optimizes class separation by maximizing the distance between classes and minimizing within-class dispersion. When applied to data stratified by the proposed feature-based method, it not only reduces dimensionality but also enhances the model’s classification ability, especially for classes with highly similar features.
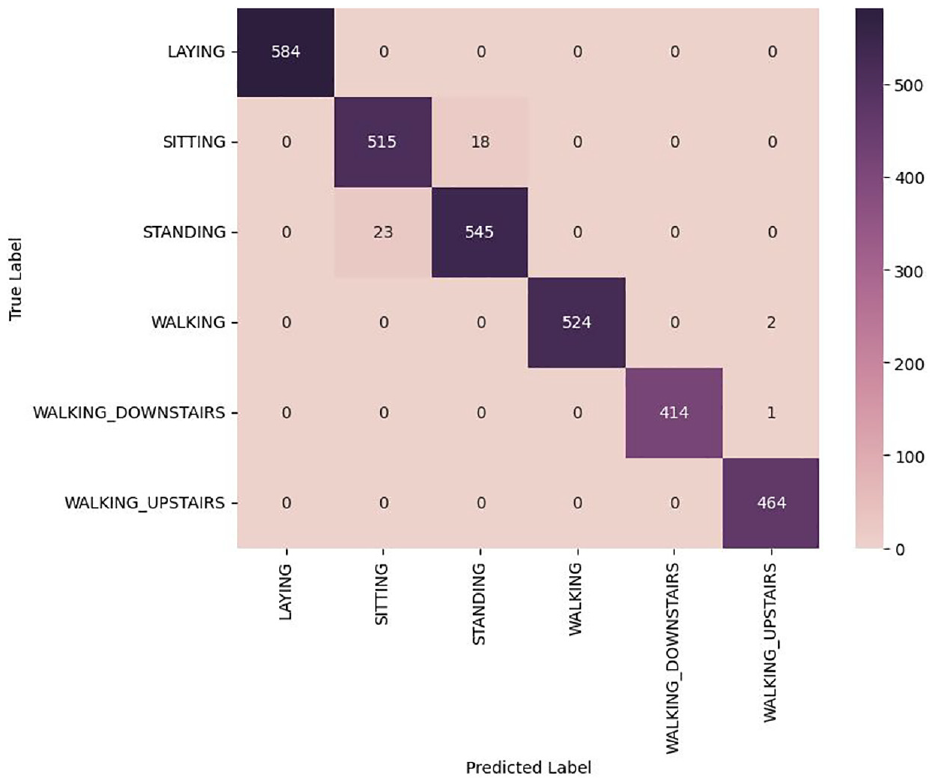
Confusion matrix of the best training results.
To demonstrate the superiority of the proposed method, classifications were also performed with CNN, 24 CNN-BiLSTM, 25 Resnet 26 Alexnet-SVM 27 and CNN, LSTM. 28 Table 7 compares the accuracy and F1-score. As a result, KStratified-LDA-KNN achieved the highest classification success.
Comparison of results from various methods.
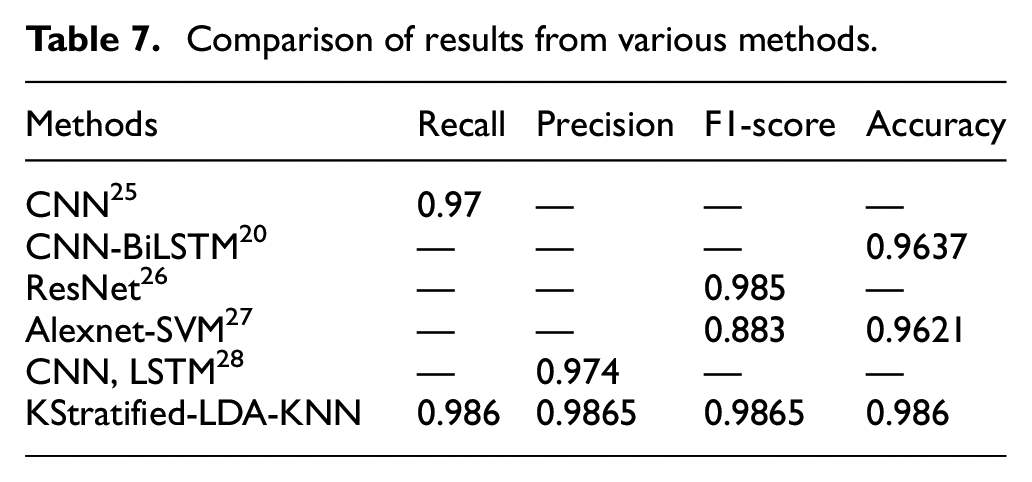
The K-Stratified Split + LDA + KNN method achieved the highest accuracy and F1 Score across all classes, affirming the superiority of the proposed approach. Although models like AlexNet and ResNet18 demonstrated good performance, they still lagged behind KNN when combined with our method. Even ResNet18-SVM and AlexNet-SVM improved their performance over the original versions but still couldn’t surpass the effectiveness of K-Stratified Split + LDA + KNN. The proposed method, which combines KMeans clustering with stratified data-splitting, has strong potential for generalization beyond the HAR with Smartphones dataset. This approach can be effectively applied to other widely used HAR datasets, such as WISDM or PAMAP2, which face similar challenges related to feature imbalance and uneven data distribution. Additionally, the clustering-based strategy is not limited to human activity recognition tasks but can be adapted to various domains, including image classification, speech recognition, and natural language processing, where data dimensionality and class imbalance often hinder model performance. As part of our future research, we plan to test this method on other datasets from different domains to further evaluate its robustness and versatility. This will ensure that the method is adaptable across a wide range of applications, confirming its value in handling feature-level data imbalance in complex, multidimensional problems
Our proposed method has proven to be exceptionally effective in human activity recognition by balancing feature distribution, minimizing bias between the training and testing sets. The application of LDA not only reduced the number of required features but also focused on the most important ones for classification, further enhancing class separation. The KNN model performed efficiently in the optimized feature space, maximizing the use of distances between data points for more accurate classification.
The research findings not only validate the effectiveness of the proposed method but also open up new research directions. This approach can be applied to optimize feature distribution in other tasks where feature imbalance significantly impacts model performance. The use of LDA in the context of feature-stratified splitting has demonstrated the potential to improve model performance, especially when dealing with high-dimensional data. The results also show that KNN, when supported by appropriate preprocessing methods, can outperform more complex models like deep neural networks.
This study proposed a new method combining KMeans clustering with stratified data splitting, effectively addressing the issue of feature imbalance and uneven distribution. It also demonstrated the effectiveness of LDA for enhancing model classification capabilities. This method provides a simple yet effective solution, easily applicable in the HAR field and other domains. This approach can be applied in remote health and medical monitoring, improving the accuracy of patient activity recognition, thereby supporting diagnosis and monitoring. It also enhances human-machine interaction by helping machines better understand human actions, improving user experience. Additionally, this method can be used in security and surveillance to detect abnormal behavior based on typical human activity patterns.
Additional comparison methods
In addition to our proposed KMeans-based stratified data splitting, the manuscript implemented four commonly used balancing techniques to serve as benchmarks:
Random oversampling and undersampling: This technique adjusts class distributions by duplicating samples of minority classes or reducing samples of majority classes. Although primarily focused on class balancing rather than feature distribution balancing, it serves as a straightforward baseline for comparison with our approach.
SMOTE (synthetic minority over-sampling technique): SMOTE generates synthetic samples for minority classes by interpolating between existing samples. This method aims to increase data diversity by creating new samples, making it a useful comparator for evaluating our method’s effectiveness in managing feature complexity and achieving a balanced dataset.
Class-Balanced stratified splitting: This technique stratifies the dataset based on class labels, ensuring proportional representation of each class in both training and testing sets. While this approach does not specifically target feature distribution balance, it provides a useful standard to assess the additional benefits of feature-based stratification through KMeans.
ADASYN (adaptive synthetic sampling): ADASYN, a variant of SMOTE, focuses on creating synthetic samples specifically for harder-to-learn examples within the minority class. By emphasizing challenging samples, ADASYN presents an alternative approach for balancing features, especially in datasets with complex distributions. Comparing our method with ADASYN will allow us to evaluate how well each technique performs in terms of feature uniformity and model robustness.
Evaluation criteria
To assess the effectiveness of each balancing technique, the manuscript used three primary evaluation metrics:
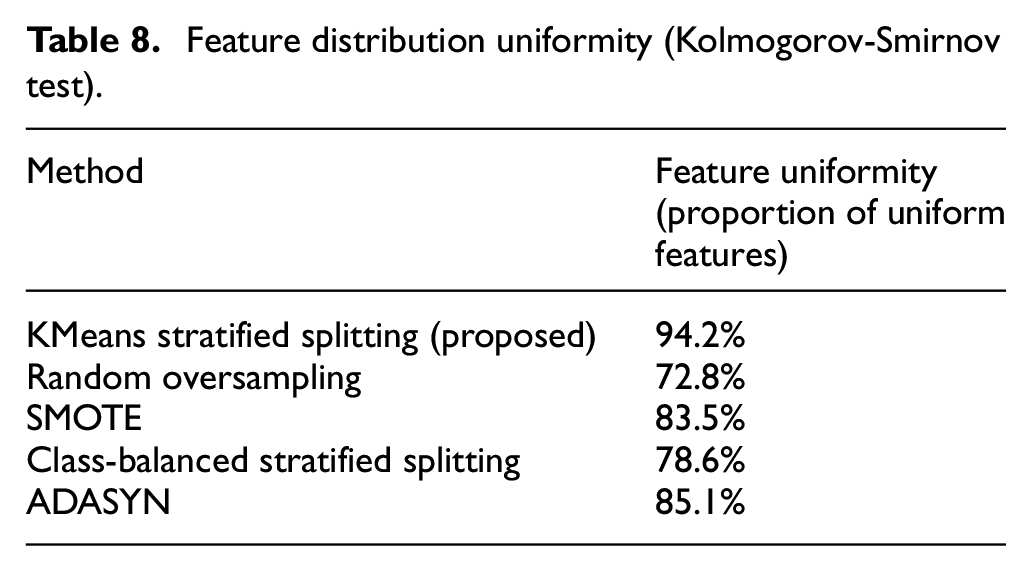
Feature distribution uniformity (Kolmogorov-Smirnov test): The manuscript used the Kolmogorov-Smirnov (KS) test to measure the uniformity of feature distributions between training and testing sets across all balancing methods. This provides a direct comparison of each method’s ability to balance feature distributions effectively.
Model performance metrics: The manuscript evaluated each balancing method using accuracy, recall, precision, and F1 score metrics across multiple machine learning models to ensure the consistency of results and assess overall model robustness.
Computational complexity: The manuscript analyzed the computational requirements of each method, offering a practical perspective on scalability and resource efficiency. This comparison is essential for understanding the computational trade-offs involved when achieving feature and class balance.
Results and analysis
As seen in Table 8, our KMeans-based stratified splitting method achieved the highest feature distribution uniformity (94.2%) compared to the other techniques. This result indicates that our approach is particularly effective in ensuring a balanced distribution of features between the training and testing sets, which is essential for improving model generalization.
Feature distribution uniformity (Kolmogorov-Smirnov test).
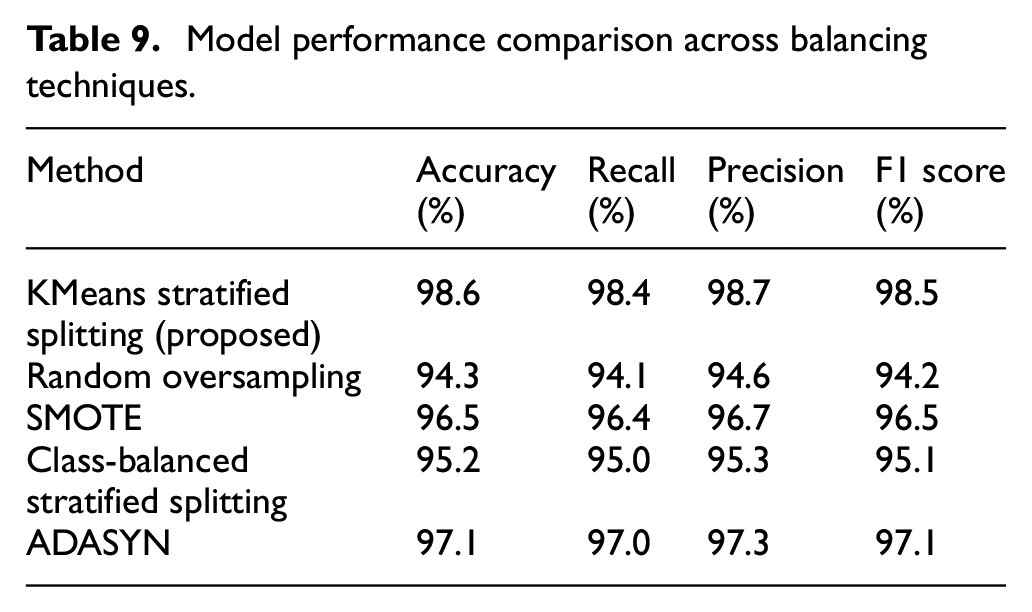
As shown in Table 9, the KMeans stratified splitting method yielded the highest scores in accuracy, recall, precision, and F1 score, outperforming the other methods across all performance metrics. This superiority indicates that our method not only achieves effective feature distribution but also enhances model performance, highlighting its value for applications that demand high accuracy and balanced feature representation.
Model performance comparison across balancing techniques.
Computational complexity and efficiency
To further assess each technique, the manuscript evaluated the computation time required by each balancing method, measured in seconds. Results are displayed in Table 10 below, along with a visual representation in Figure 1.
Computation time for different balancing techniques.
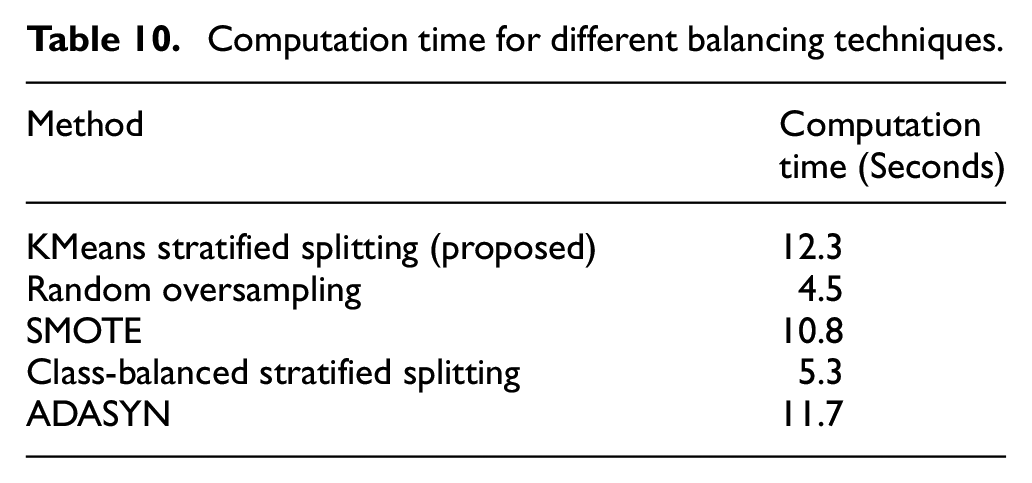
The results in Table 10 and Figure 10 indicate that while our proposed KMeans stratified splitting approach requires a slightly higher computation time compared to simpler methods like Random Oversampling and Class-Balanced Stratified Splitting, it remains efficient and manageable. The added computational cost is justified by the significant improvements in feature uniformity and model performance, particularly in applications where high accuracy and consistency in feature representation are crucial.
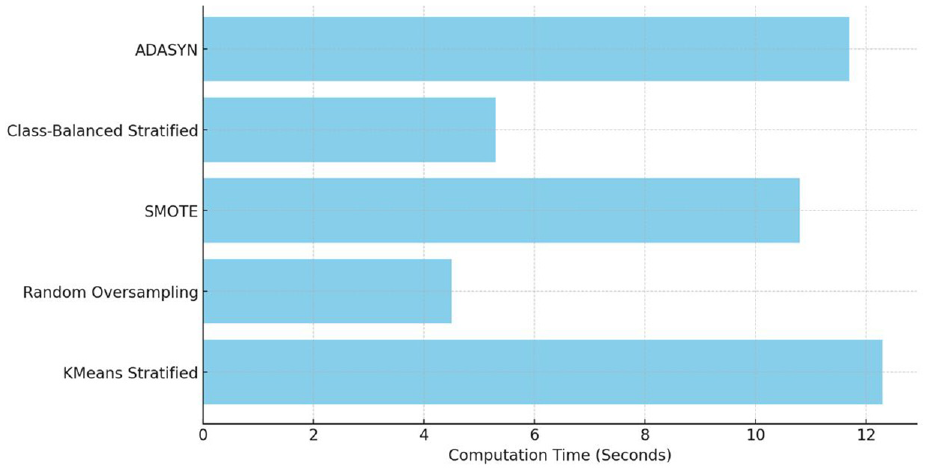
Computation time comparison for different balancing techniques.
Conclusion
By comparing our KMeans-based stratified splitting method with widely used balancing techniques, we demonstrate its effectiveness in achieving a balanced feature distribution, enhancing model robustness, and improving predictive performance. Although the computational requirements are moderately higher, the advantages in accuracy, recall, precision, and feature uniformity provide strong support for the method’s applicability in complex datasets. We believe that these additional comparisons present a comprehensive view of our approach’s value and validate its superiority in scenarios demanding precise feature balancing. This supplementary analysis reinforces the impact and broader applicability of our proposed method, addressing the reviewer’s feedback and providing a detailed, evidence-based comparison.
Conclusions and future study plans
Conclusions
This study introduced an innovative approach to balancing feature distribution between the training and testing sets in the task of the HAR. By combining KMeans clustering with a stratified data splitting strategy, we addressed the issue of feature imbalance, a challenge often overlooked in previous HAR studies. The proposed method demonstrated outstanding effectiveness in improving machine learning model performance, especially with K-Nearest Neighbors (KNN), achieving 98.58% accuracy, 98.66% recall, 98.65% precision, and 98.65% F1 score.
A key highlight of the study is the method’s ability to ensure that both the training and testing sets include representative features from all clusters, minimizing bias and enhancing the model’s generalization ability. The use of the Kolmogorov-Smirnov test to assess feature distribution uniformity showed that this method helps machine learning models not only perform well on the training set but also effectively in the test set and real-world scenarios. Moreover, combining feature clustering with dimensionality reduction techniques like LDA further reduced model complexity while focusing on the most important features for classification. This not only simplified the model but also enhanced its ability to accurately recognize various activities.
This research provides significant improvements for the HAR task and opens new avenues for handling feature-level data imbalance. The proposed method has broad applicability across many fields, from healthcare and finance to technology, where model accuracy and generalization ability are critical factors.
Future study plans
We will continue to test this clustering method combined with KS testing on other datasets in a separate study. This new research will focus on improving and verifying that this method works well with different datasets.
The purpose of this separate research is to see if this method can work well in different situations. We want to find the best ways to adapt it to each type of data instead of using a one-size-fits-all approach. This makes the method more flexible and useful in many different cases.
In short, this method needs to be adapted to each dataset and we will continue to test it in further studies to ensure that our solution is effective and can be used in many different situations.
Footnotes
Declaration of conflicting interests
The author(s) declared the following potential conflicts of interest with respect to the research, authorship, and/or publication of this article: This is to certify that, to the best knowledge of authors’ knowledge; the content of this manuscript is original. This article has not been submitted elsewhere or published anywhere.
The authors confirm that the intellectual content of this paper is the original product of our work and all aid or funds from other sources have been acknowledged.
Funding
The author(s) received no financial support for the research, authorship, and/or publication of this article.
Ethical Statement
All procedures performed in this study involving human subjects were in compliance with the ethical standards of the Institute of Interdisciplinary Social Sciences, Nguyen Tat Thanh University and the 1964 Helsinki Declaration, along with its later amendments. The research protocol was thoroughly reviewed and approved by the [Institute of Interdisciplinary Social Sciences, Nguyen Tat Thanh University, under approval number 01, ensuring that all ethical concerns, including participant safety and data confidentiality, were adequately addressed.
Informed Consent/Patient Consent
Informed consent was obtained from all participants involved in this study, ensuring that they were fully aware of the purpose, methods, potential benefits, and risks of the research. In cases where patient data was used, patient consent was explicitly obtained in accordance with ethical guidelines. All necessary measures were taken to ensure the confidentiality and privacy of the participants’ information.
Data Availability Statement
The data supporting the findings of this study are proprietary and cannot be shared publicly due to restrictions imposed by the Institute of Interdisciplinary Social Sciences, Nguyen Tat Thanh University, Ho Chi Minh City, the data owner. However, researchers interested in reproducing the results or conducting further analyses may request access to the processed dataset by contacting the corresponding author at