
Abstract
When it comes to agricultural tractor ergonomics, vibration is one of the most important factors to consider. However, little research has been done to evaluate this parameter and its impact on workers’ health. Therefore, the aim of this study was to fabricate a portable vibration measurement unit (PVMU) based on an Arduino microcontroller and a vibration sensor (accelerometer ADXL335). The PVMU performance was tested in combination with a commercially available three-axis USB vibration measurement device (VB10). Furthermore, the vibration measurements were used to calculate the tractor driver’s whole-body vibration load according to ISO 2631-1 along three perpendicular axes (X, Y, and Z) during soil tillage using a disk harrow under different tillage speeds of 4.0, 5.5, and 7.0 km/h at a tillage depth of 15 cm in a sandy loam soil. Performance tests of the PVMU and the commercially available three-axis USB vibration meter (VB10) revealed a highly significant level of agreement based on a correlation coefficient of 0.9822. It was found that the vibration level increases with increasing tillage speed. The highest vibration level, 0.80 m/sec2, was observed in the vertical direction (Z-axis) at a tillage speed of 7.0 km/h. The lowest vibration level, 0.12 m/sec2, was observed in the lateral direction (Y-axis) at a tillage speed of 4.0 km/h. The dominant frequency range of vibration transmitted to the tractor seat was found to be between 2.04 Hz and 20.14 Hz. The daily exposure values that is, A (8) determined during this study to assess the health hazards due to vibration for tractor drivers ranged from 0.01 m/sec2 to 0.06 m/sec2 lower than the recommended exposure action value (EAV) limit that is, 0.5 m/sec2. This means that there is no health risk for the driver during the soil tillage using a disk harrow plow. The PVMU proposed in this study is very reliable and can be used as a vibration assessment tool for other agricultural tractor-implement combinations.
Introduction
Agricultural machinery is often exposed to different vibrations depending on field conditions, equipment conditions, attachments, driving modes, etc., and the vibrations are transmitted to the whole body of the worker. 1 Among agricultural machinery, tractors play an important role for farmers in agricultural production. Tractors can perform up to 80% of various agricultural tasks. 2 However, the tractor, accompanied by uneven field interface, releases vibrations that convey into the driver’s body over various contact settings that is, tractor seat, gear lever, chassis, steering wheel, position levers paddles, etc.3,4 It has been found that tractor drivers are often exposed to whole-body vibration (WBV) above the recommended exposure action value limit (EAV) that is, 0.5 (m/sec2). 5 Moreover, continued exposure to such vibrations can affect driving comfort at the workplace. 6 This may be due to the vibrations being transmitted to the human body with high acceleration amplitudes and frequencies close to those of the human body.7,8 This can lead to a variety of health problems related to the musculoskeletal system, especially lower back pain, as there is a significant relationship between vibration and lower back pain in professional drivers.9,10
Maintaining the health and comfort of agricultural tractor drivers is an important aspect of the development of agricultural machinery, which has led to the development of devices to improve working conditions, such as soundproof cab and driver’s seat suspension. 11 Vibrations are one of the factors that most affect health and comfort that result from the properties and interactions of certain tractor parts (tires, axles, chassis, cab). To improve their products, manufacturers have developed prototype cabs with automatic leveling systems. Its purpose is to keep the operator’s spine in the correct position during heavy work such as soil tillage with heavy implements. 11 However, measuring vibration during actual field work, especially during tillage work, is more difficult than on flat ground or road conditions, because the hard and uneven terrain conditions during tillage work can generate high amplitude whole-body vibrations. These vibrations, when transmitted through various parts of the machine, can penetrate into the driver’s body and cause musculoskeletal disorders. 11 Therefore, to improve driving comfort and driver health in the long term, it is necessary to develop systems that can attenuate unwanted amplitudes and frequencies. Numerous studies have been carried out to evaluate whole-body vibration in agricultural wheel tractor operators.12–14 To record the vibration levels of tractors, data had to be collected under different driving conditions and on different surfaces. 15
Triangular, lateral, and vertical axes are the three perpendicular directions through which vibration is transmitted to the tractor seat. Depending on the attached agricultural machinery, the operating speed, the field topography, the tractor design, and condition, the whole-body vibration can be very high. 16 To reduce tractor vibration during soil work, first select a road surface that avoids bumps, ruts, and potholes as much as possible. Furthermore, working hours should not exceed 4 h and a break must be taken before resuming. 17 On the other hand, vibration frequencies that affect the operator’s health, activity and comfort are between 0.5 and 80 Hz. 18 Long-term exposure to such vibrations can cause a variety of health problems, including back pain, spinal disorders, abdominal pain, digestive and visual problems, activity disorders, and discomfort that can lead to injuries. 19 The main natural frequency range of a tractor (1–7 Hz) is within the critical frequency range of the human body (e.g. the natural frequencies of the human trunk and lumbar spine are 4–8 Hz and 4–5 Hz, respectively), which makes the comfort problem of a tractor ride even more severe. 20
Improving the efficiency, reliability, quality, and economy of tractor equipment is one of the most important challenges of modern society.2,21–23 Therefore, researching, developing and advancing technologies in the field of instrumentation and sensing is crucial to ultimately meet health and safety requirements in the workplace, especially those using heavy vehicles such as agricultural tractors. 23 Therefore, reducing the impact of vibrations on the driver’s body by developing effective shock absorption systems and comfortable seats, as well as installing sensors and performance monitors in the tractor cab, has become one of the most important challenges for agricultural machinery manufacturers these days. Despite these great advances in safety and comfort of modern agricultural tractors, some older agricultural tractors do not take these recent developments into account and continue to be used on farms. Furthermore, using the Internet of Things (IoT) to monitor the behavior and health of agricultural workers can improve their well-being and productivity. 24 IoT technologies to monitor and improve vehicle comfort can have a significant impact on the health and safety of tractor drivers. For example, IoT systems can be implemented in tractors to monitor vibrations and their impact on the driver. 25 Tractor design can be improved to improve driving comfort by using machine learning techniques to analyze and predict vibration exposure. 26 A key feature of tractor driving in the transition to digital agriculture is that operator performance and health must be a top priority. Vibration analysis has been the focus of most research, but there is still no practical way to reduce high vibration levels. 23 New wireless sensing and communication technologies can be effectively used for worker safety for various work purposes. This allows the development of affordable, tailor-made monitoring devices that can be easily used during worker activities. 27 Meanwhile, soil preparation is also an important point in agricultural production. Soil preparation can make the soil in the field more suitable for crop growth. Traditional agricultural machinery such as disc harrows require stronger tractor traction force. 28 In contrast, disk harrow is an established method of primary tillage as it loosens and aerates the soil, making it more suitable for planting and ensuring higher crop yields. Moreover, the complex on-site operating environment, agricultural machinery is often exposed to strong vibrations caused by excitation from multiple sources during operation, which reduces the reliability of the machinery and leads to poor work quality.29,30 However, the corresponding vibration can help reduce resistance during tillage and reduce the tractor’s power consumption. 28 For this reason, it is necessary to know the vibration characteristics of the tractor during soil tillage. 28 In this context, this study proposes a portable vibration measurement unit (PVMU) based on an Arduino microcontroller and tests its performance in combination with a commercially available 3-axis USB vibration measurement device (VB10). Therefore, the levels of vibration transmitted from the tractor seat to the driver were measured according to the standard ISO 2631-1:1997. 18 This is then used to evaluate the whole-body vibration exposure of tractor drivers during tillage operation. It has been shown that soil tillage using a disk harrow can affect workers’ health and comfort due to exposure to low-frequency vibrations close to the natural frequency of the human body. 31
Materials and methods
Design and construction of the vibration measurement unit
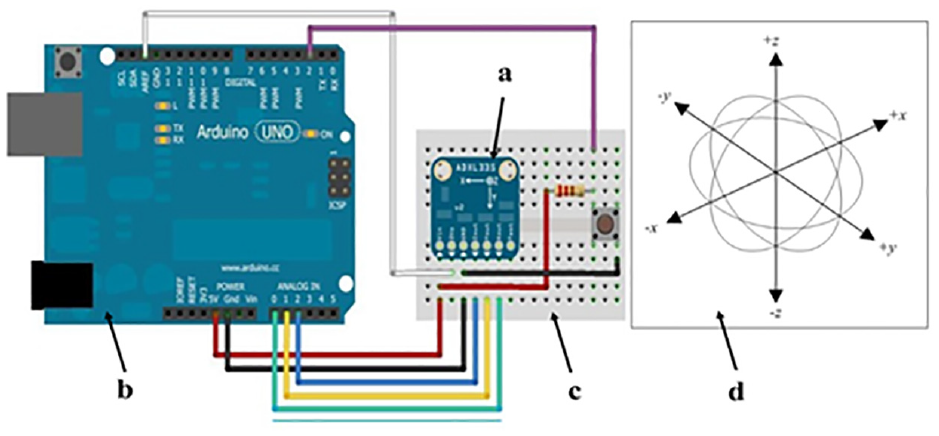
The PVMU is mainly based on an Arduino board, and its main features are that it is easily programmable and usable. It is portable, simply designed, and manufactured from available low-cost components, making it adaptable for use in a variety of vibration data collection applications. The main part of the PVMU was the Arduino Uno. It is a microcontroller board based on the ATmega 328 chip. It has 20 input/output pins, 14 of which can be used as digital input/output and 6 as analogy inputs, a 16 MHz ceramic resonator, a USB port, a power jack, ICSP (In Circuit Serial Programing), and a reset button. It operates on 5 V (7–12 V recommended) and can be powered via USB or an external power adapter. A 9 V capacity dry cell battery from Energizer was used as an external DC power source to provide sufficient voltage across the components if the meter was to be made portable. A Data Acquisition Shield from (Adafruit Company) was installed via a female header, providing a real-time clock (RTC) to add a timestamp to the stored data, and a memory card interface that works with FAT16 or FAT32 formatted cards. On top of the mounted Arduino board. A 20 × 4 character LCD display (part number: WH2004G) on the controller module (RW1063) was used to display the vibration intensity for each axis during the measurement.
Accelerometer sensor (ADXL335)
A Micro-Electro-Mechanical Systems (MEMS) accelerometer (model: ADXL335 from Adafruit company) with three analogy outputs for X, Y, and Z- axis measurements on a 0.75″ × 0.75″ breakout board (Figure 1). It can measure acceleration with a full-scale minimum of ± 3g (29.43 m/sec2). It operates from 5 V and regulates this to 3.3 V using an output pin. The analogy output is ratio-metric, meaning that a 0 g measurement output is always half the 3.3 V output (1.65 V), 3 g is at 0 V and 3 g is at 3.3 V with full scaling in between.
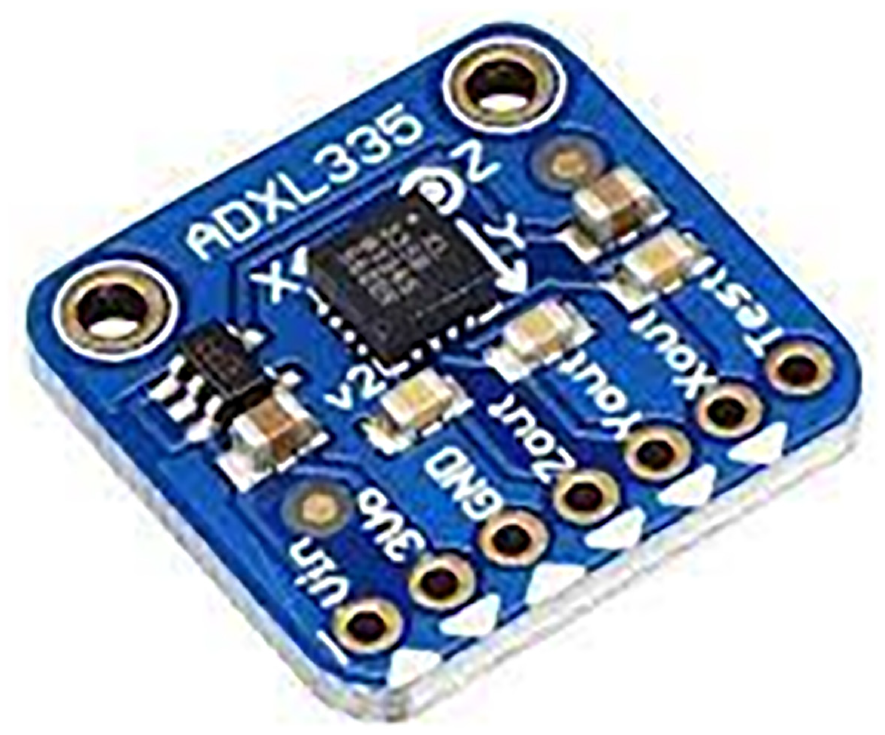
Accelerometer sensor (ADXL335).
Commercial 3-axis USB vibration meter (VB10)
To validate the developed measurement device, a VB10 3-axis USB vibration/acceleration data logger (model: VB10, General Tools & Instruments, Inc., NY, USA) was used as a reference device. The vibrometer (Figure 2) has a measurement range of ± 16 g, an accuracy of ± 0.5 g, and a frequency sensitivity range of range of 0–60 Hz.
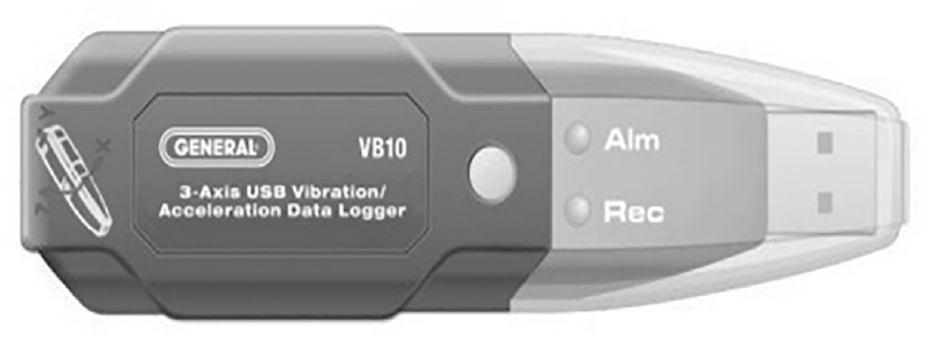
Acceleration data logger (VB10).
Laboratory shaker
A wrist action shaker model 75 (Figure 3) from Burrell, Pennsylvania, USA, was used as the vibration platform for validation of the PVMU.
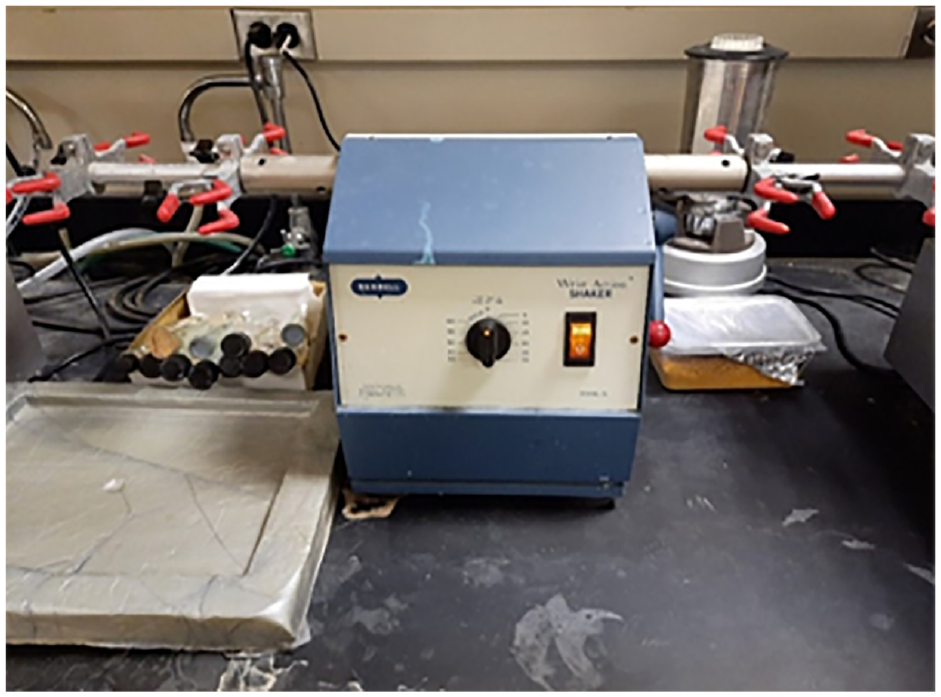
The vibration generator.
Hardware stage
The first stage of the PVMU design was completed by assembling all the components and wiring them correctly to an Arduino Uno microcontroller. To make the device compact and portable, a compatible case was designed (see Figure 4). The accelerometer was wired with a 2 m long data cable to facilitate the measurement process. The next stage of the PVMU design process after hardware configuration was to program and identify all the components of the measurement unit so that they can communicate with each other in harmony during the vibration measurement process (see the flowchart in Figure 5). The integration code was implemented using Arduino software (IDE) to convert the signals sent by the sensors into vibration units (m/sec2) and store them in the unit’s memory card for further analysis.
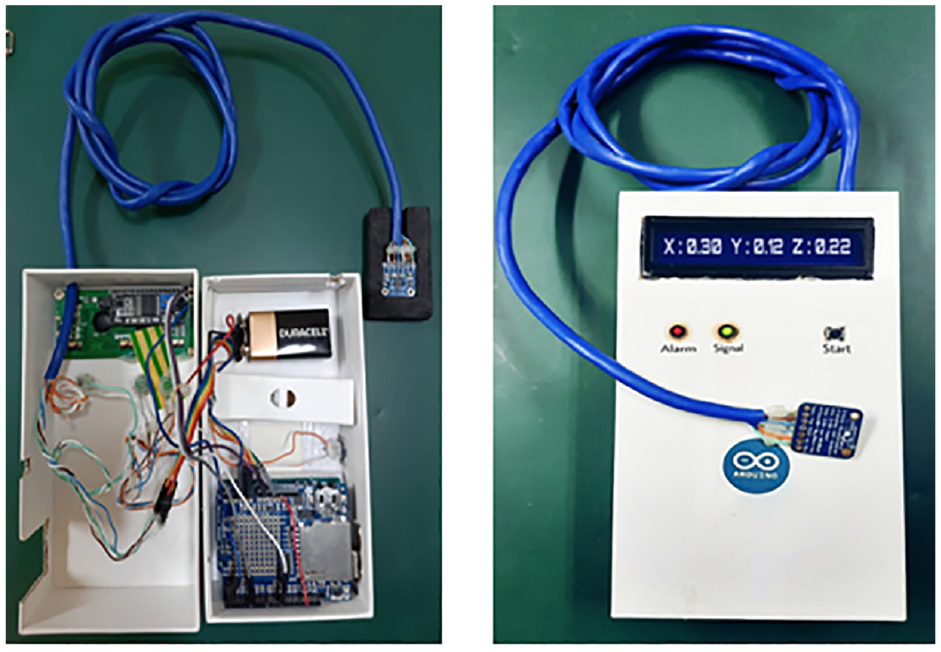
Vibration measurement developed unit.
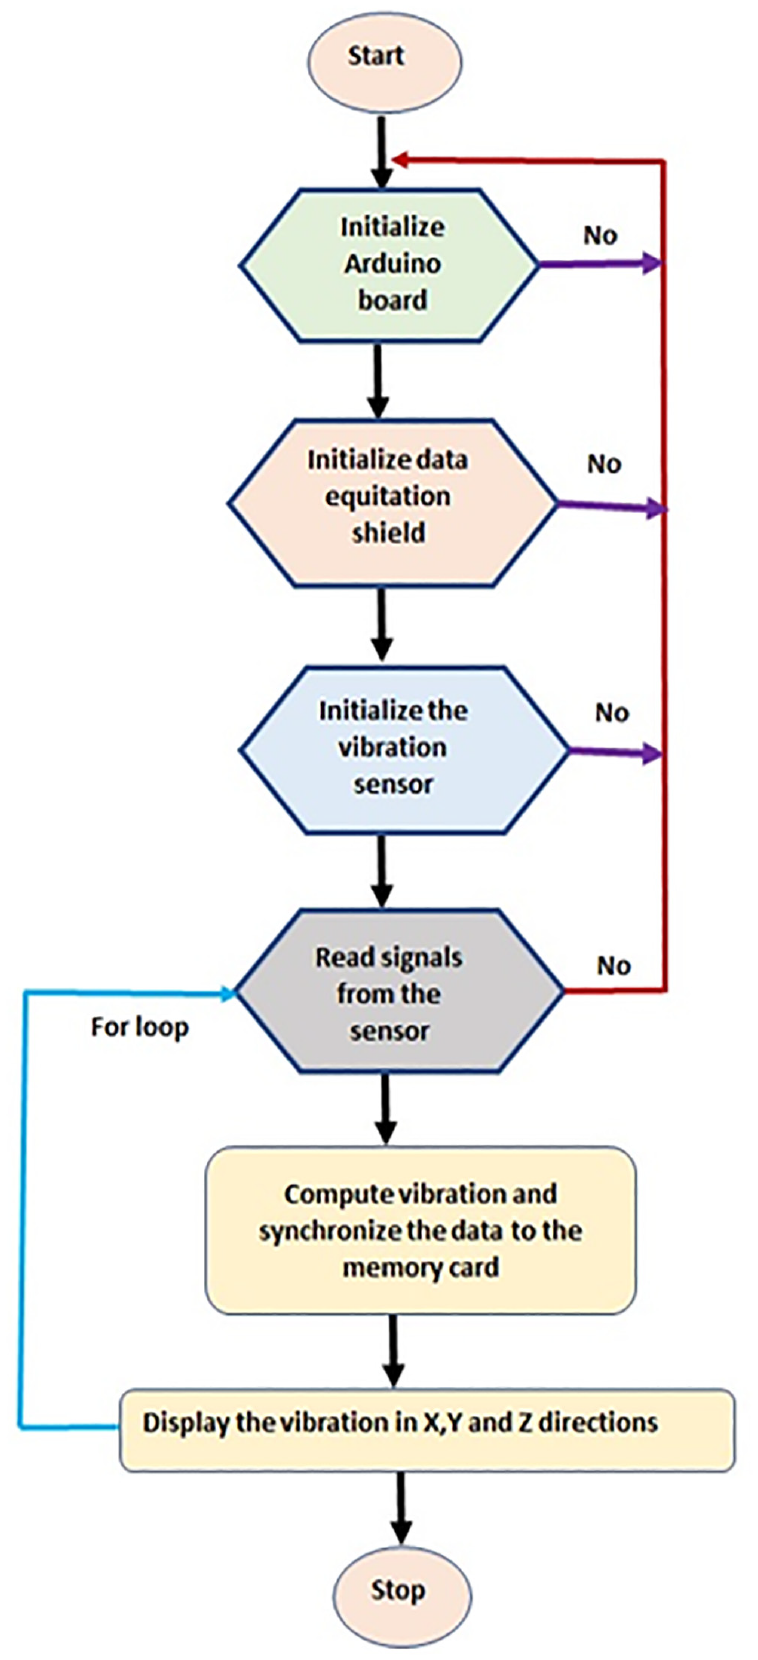
Operational flow chart.
Calibration of the PVMU
According to Earl, 32 gravity is a convenient constant force that provides a convenient and precisely calibrated reference. Therefore, we calibrated each axis when it was exactly aligned with the gravity axis and used the sensor output as zero (g) in the final code of the unit we created. To align the sensor for calibration, we first mounted the sensor on a small breadboard to create a set of precise reference planes. As shown in (Figure 6), the microcontroller was connected to the accelerometer along with the necessary components (resistance wires and a calibration button). The specific calibration code was uploaded to the unit developed using the Arduino IDE software. Before running the code, we placed the breadboard with the sensors on it on a flat surface and pressed and held the calibration button until the Arduino IDE serial monitor displayed “Calibrate” This process was repeated for all the accelerometers in the XY and Z directions.
Sensor calibration procedures scheme: (a) acceleration sensor, (b) microcontroller, (c) breadboard, and (d) calibration orients.
The validation tests for PVMU
To validate the developed unit (PVMU), several tests were conducted using a professional vibration measurement device (VB10) as a reference device. Nine comparative tests, totaling 18 min, were conducted at three different vibration levels in a laboratory located at the Department of Food Science and Nutrition, College of Food and Agriculture Sciences, King Saud University, Saudi Arabia. The PVMU and reference device were held together with electrical tape and attached to a shaker holder, as shown in Figure 7. Simultaneous readings of both units were recorded for further analysis. A correlation analysis was performed to determine the degree of agreement between the PVMU and the reference device (VB10).
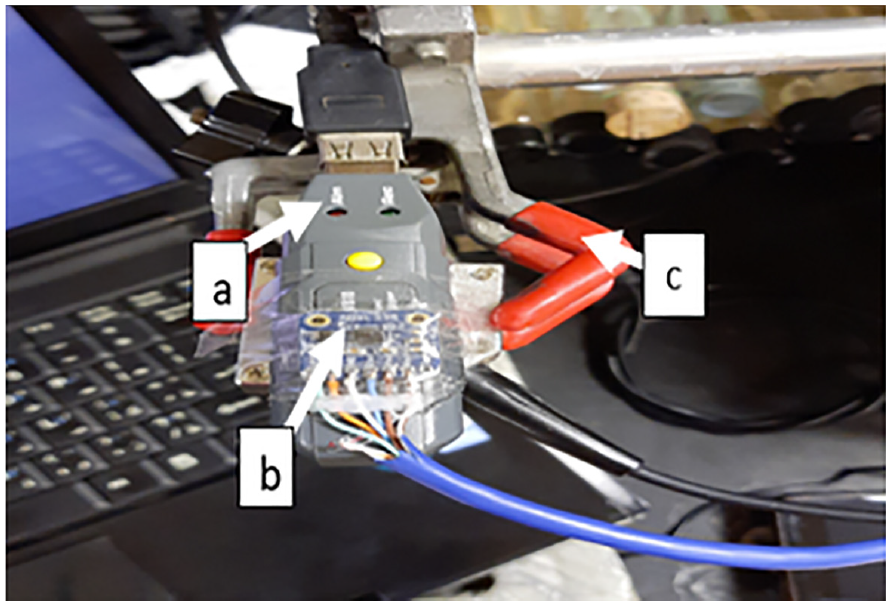
The validation process: (a) reference device, (b) developed device sensor’s, and (c) shaker holder.
Field experimental work
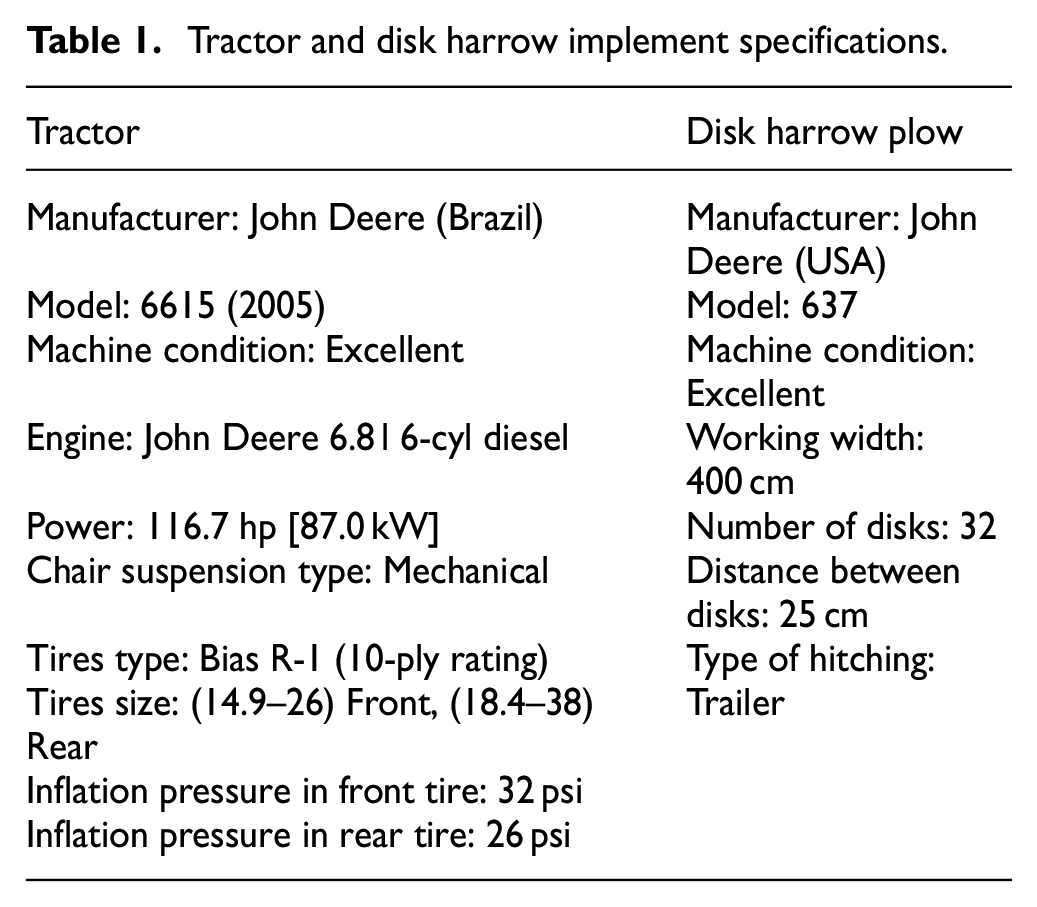
The tillage experiment was carried out in the summer of the 2020/2021 season at an agricultural research and experimental station in the Dirab region of Riyadh, Saudi Arabia. It is located about 50 km southwest of Riyadh, the capital of Saudi Arabia. According to Madugundu et al., 33 latitude and longitude are respectively 24°20′35″ and 24°20′51″ N and 46°31′41″ and 46°45′34″ E. Additionally, According to Madugundu et al., 33 the Dirab region is dominated by dry continental climate with hot summers and mild to moderate winters, with an average temperature of 35°C. The soil texture is classified as sandy loam. 34 Soil samples were collected at depths of 0–15 cm and 15–30 cm with an average volume of 835 cm3. Samples were dried in an electric oven at 105°C–110°C for 24 h. During the tillage experiment, the soil bulk density and soil moisture content were 1.52 g/cm3 and 6.05% db, respectively. To achieve the objectives of this study, three different tillage speeds 4.0 km/h, 5.5 km/h, and 7.0 km/h with a fixed tillage depth of 15 cm were used. Tillage treatments were replicated three times on an experimental area of 0.25 hectares. The PVMU was tested using a John Deere tractor and disk harrow plow. The specifications of the tractor and disk harrow used are listed in Table 1.
Tractor and disk harrow implement specifications.
The PVMU was secured with electrical tape under the bottom of the cab while observing Z-axis up and down vibration, X-axis measures front-to- back vibration, and Y-axis lateral measures side-to-side vibration as shown in Figure 8 and the all measurements were in accordance with to the standard ISO 2631-1:1997. 18 The raw acceleration data were collected using the PVMU and stored on an external memory card for later analysis. Approximately 36,000 raw acceleration data were recorded along three axes (X, Y, and Z) over a period of 180 s at a sampling rate of 200 rad/s to achieve a target frequency of 80 Hz.
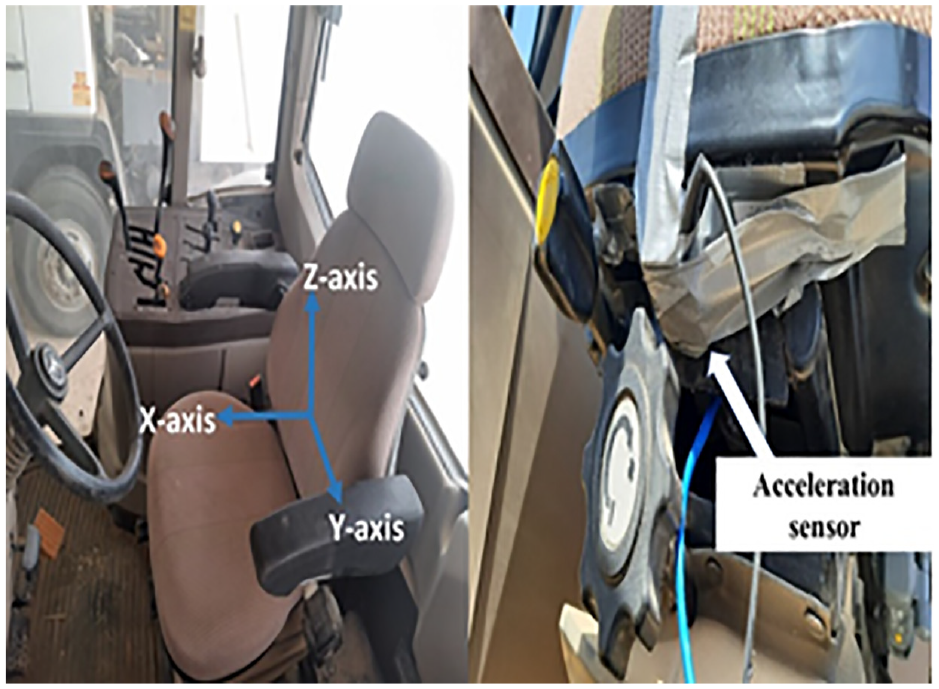
Acceleration sensor set-up on the driver’s seat pan.
Evaluation of whole-body vibration exposure
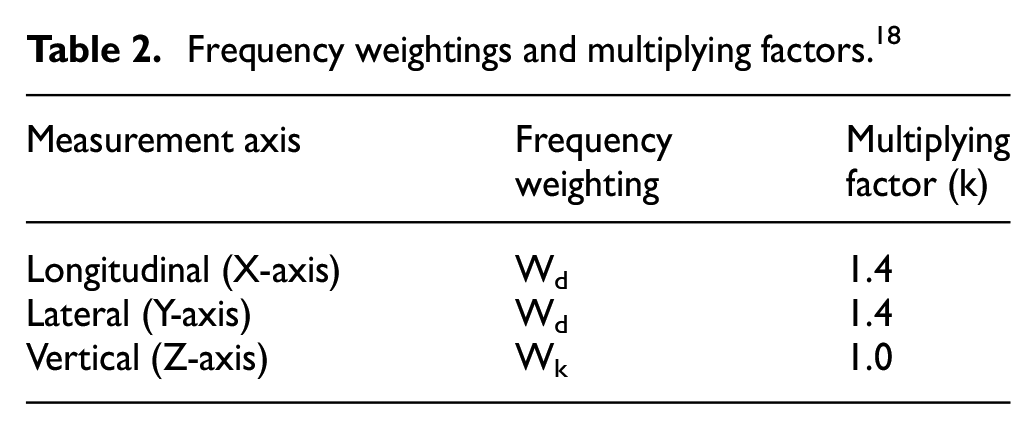
The assessment of whole-body vibration is based on the basic method using frequency-weighted root mean square (r.m.s) as reported in ISO 2631-1. 18 Using this method, WBV was assessed for different devices. 35 Frequency weighting was calculated using a special vibration signal analysis package coded by Irvine, 36 as recommended in ISO 2631-1, 18 to apply appropriate weighting and scaling factors to the acceleration data. This was performed using MATLAB software. To examine the health effects in this study, two human health-related frequency weighting filters (Wd and Wk) with multiplication factor (k) given for a seated person were applied to the main vibration axis (Table 2). The frequency-weighted acceleration was calculated according to the following equation 18 :
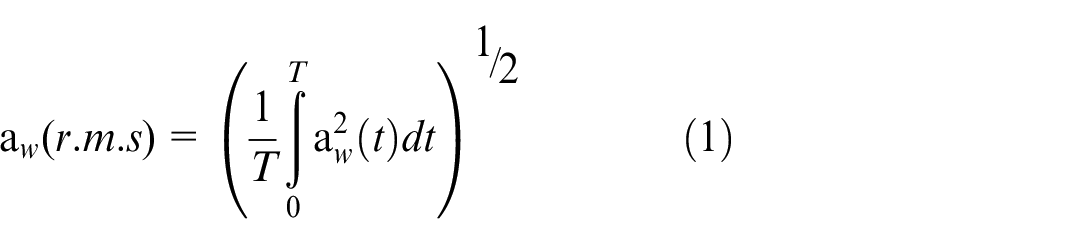
Where
Frequency weightings and multiplying factors. 18
To assess the health hazard along the translational axes X, Y, and Z of each test, an 8-h equivalent vibration exposure value, designated A (8), was calculated. The maximum daily stress value results obtained from each translational axis in the experimental run were determined with an exposure limit value (ELV), that could not exceed 0.9 m/sec2 and an exposure action value (EAV) of 0.5 m/sec2 as specified for the health guideline warning zone in ISO 2631-1. 18 However, the daily exposure, A (8), is used to determine the potential health risk. The daily exposure A (8) was calculated using the following equation 9 :

Where
Results and discussion
The PVMU validation tests
The results of the validation test of the PVMU against the reference device (VB10) showed that there was highly significant agreement between the two devices, as shown in Figure 9. Van Hees et al. 37 reported that a good reliability criterion for agreement between measurement methods based on correlation coefficient values is 0.70–0.97. However, the correlation coefficient is 0.9822 (Figure 9), so, 98.22% of variation in measurements by PVMU is explained by the reference device, thus, the error between the two devices can be ignored in the data analysis.
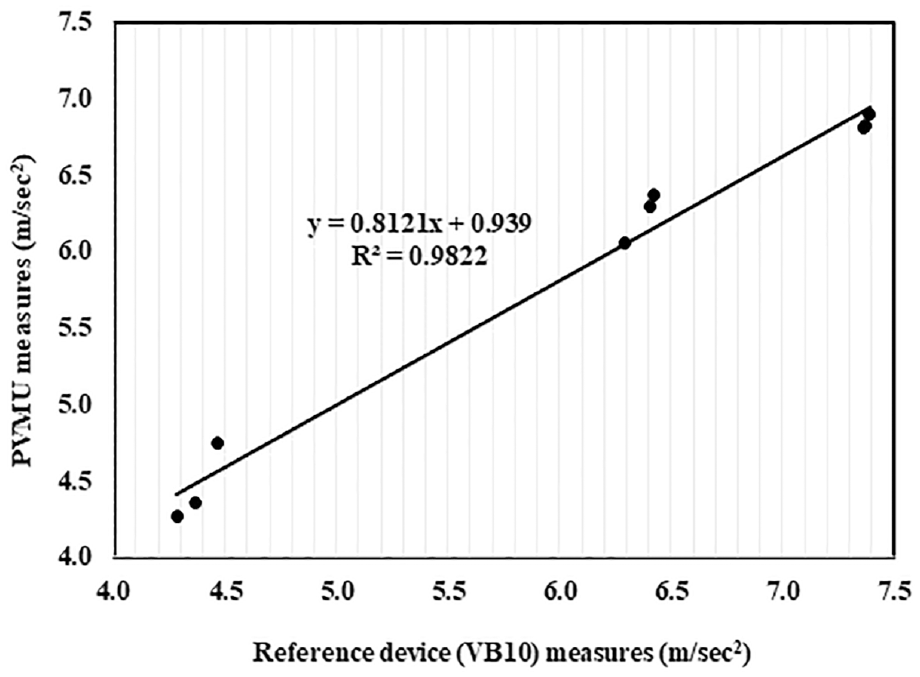
Correlation between average acceleration from the PVMU and reference device (VB10).
Effect of the tillage speed on vibration level at X, Y, and Z axes
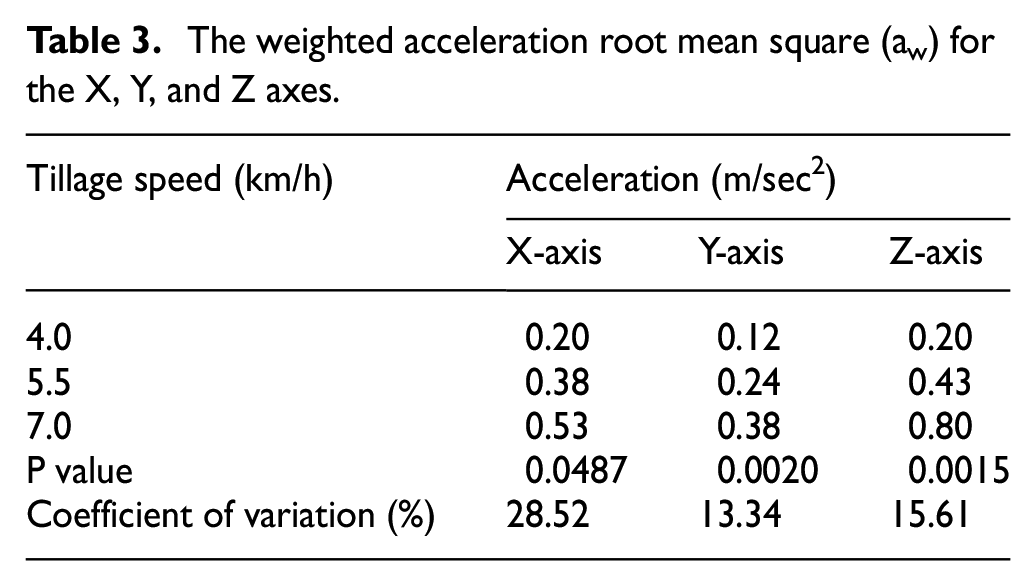
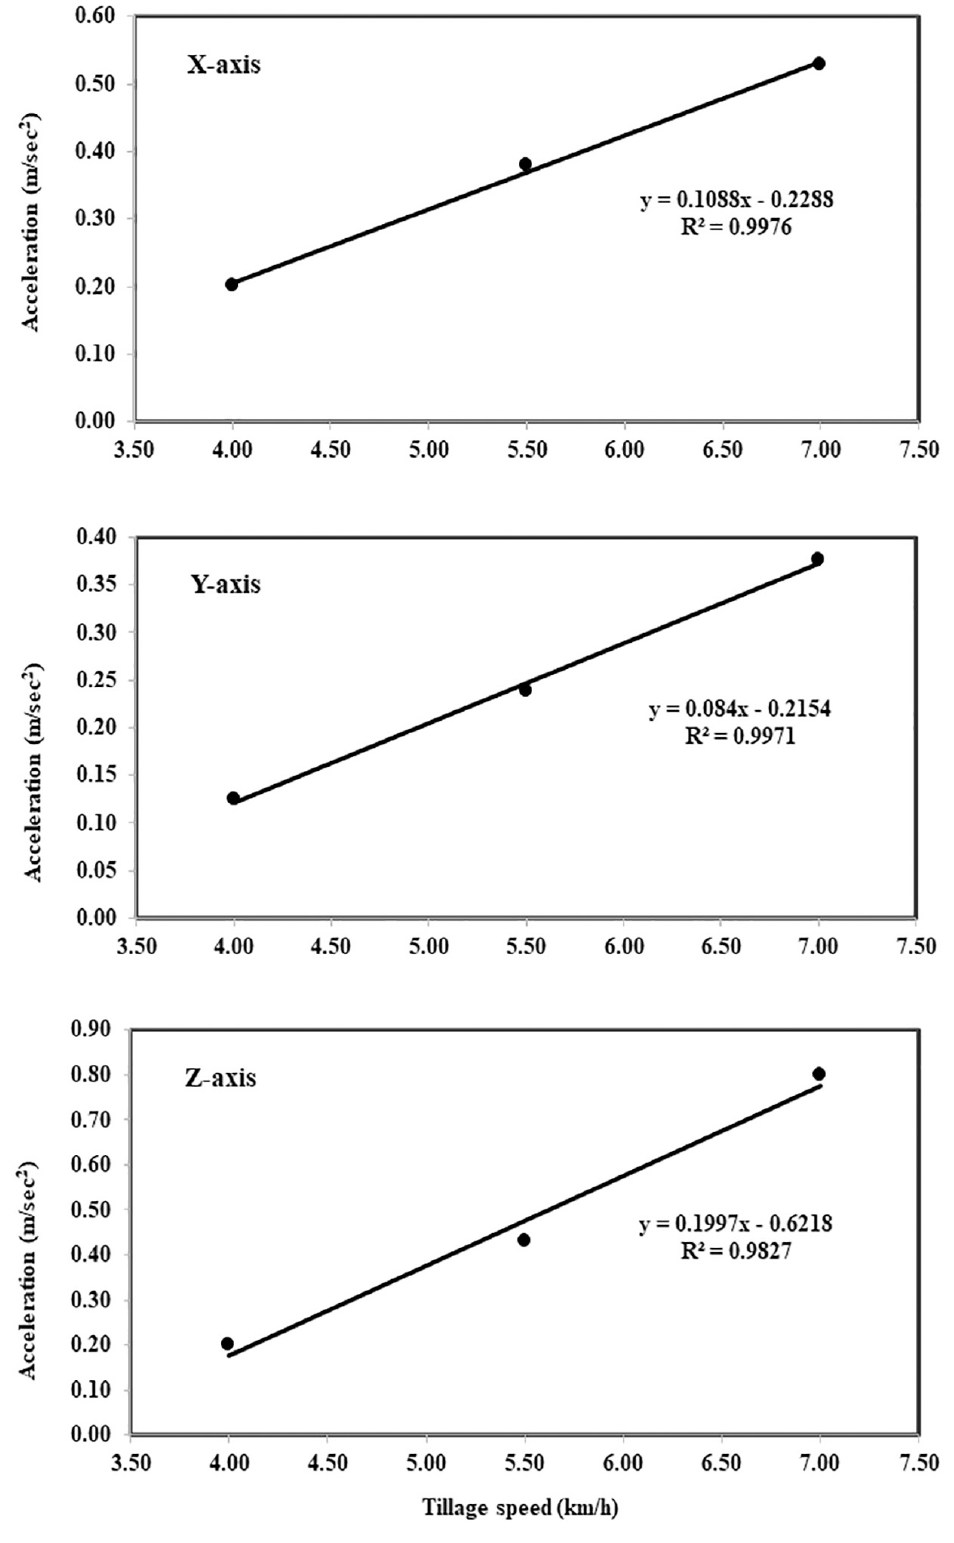
Figure 10 shows the acceleration time domain spectrum of the tests depending on the tillage speed. The weighted acceleration (aw) results were observed at the maximum tillage speed of 7 km/h and were 0.53, 0.38, and 0.80 m/sec2 for X, Y, and Z axes, respectively. At the minimum tillage speed of 4.0 km/h for X, Y, and Z axes, the lowest values were 0.20, 0.12, and 0.20 m/sec2, as shown in Table 3 and Figure 11. Analysis of variance revealed that there was a highly significant difference in the vibration levels for the three translational axes X, Y, and Z due to the effect of tillage speed, with p-values of 0.0487, 0.0020, and 0.0015, respectively at the 95% confidence level.
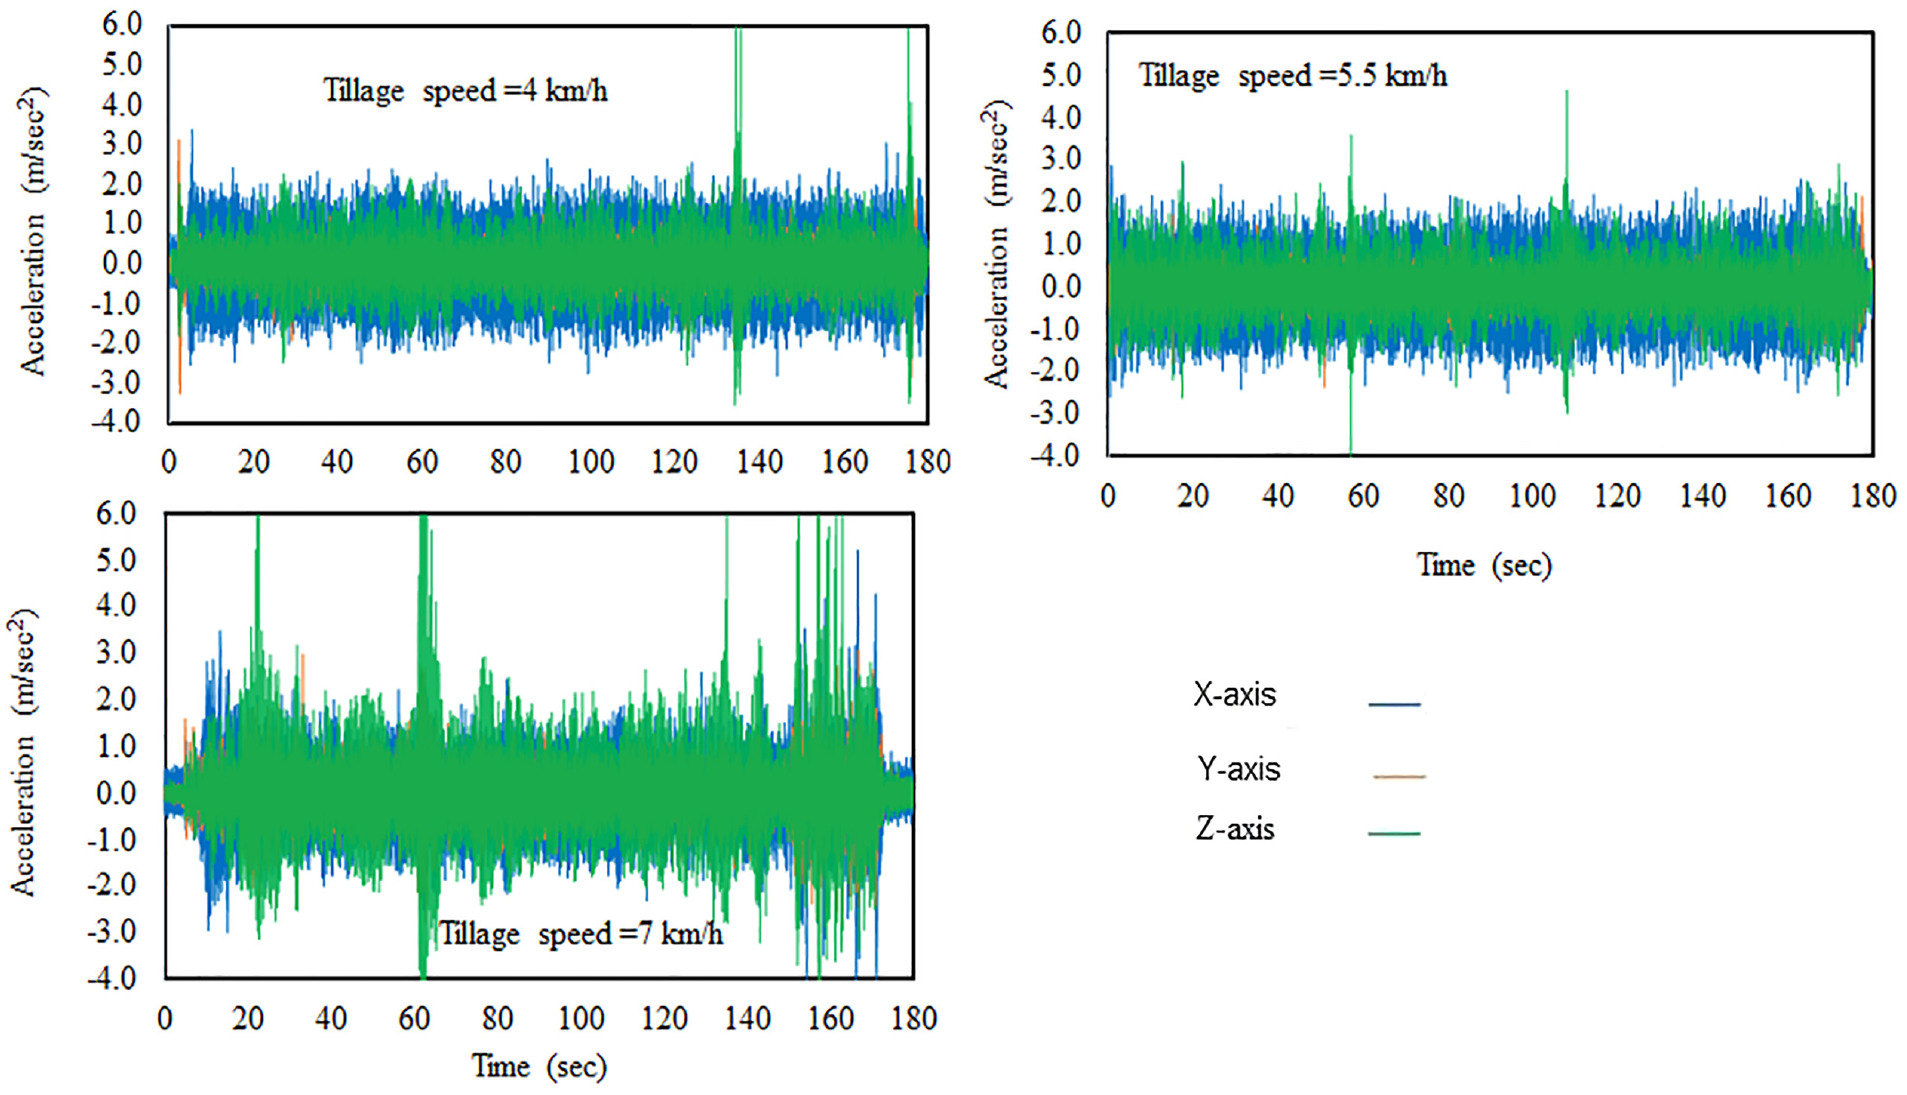
Acceleration time domain spectra at X, Y, and Z axes.
The weighted acceleration root mean square (aw) for the X, Y, and Z axes.
Effect of the tillage speed on vibration level at X, Y, and Z axes.
The overall vibration levels in the three translational axes (X, Y, Z) increased with increasing tillage speed. This result is consistent with the results of Behera et al., 38 Abdullah and AL-Mafraji, 17 and Mayton et al., 39 who reported that the vibration intensity vibration magnitude on the driver seat of an agricultural tractor increases with increasing tillage speed. This may be due to the higher ground disturbances with faster tillage speeds, which increases the vibration transmitted to the driver’s seat. Furthermore, Singh et al. 40 determined the dominant frequency of WBV using fast Fourier transform analysis (FFT) during rotary tillage. According to ISO 2631-1, 18 the total daily vibration exposure ranged from quite unpleasant to unpleasant (i.e. 0.64 and 0.84 m/sec2). Furthermore, this study showed that the tillage speed had a strong and statistically significant effect on vibration transmission to the tractor seat in all three perpendicular axes. These acceleration levels can affect the tractor drivers, especially on vertical axis, causing discomfort, back pain, injuries, fatigue, reduced effort, and reduced control over field operations. 17 Therefore, to mitigate such phenomena, appropriate tillage speeds should be considered to control the overall vibration, and the productivity gains in such cases can be negligible.
Fast Fourier transform (FFT) analysis
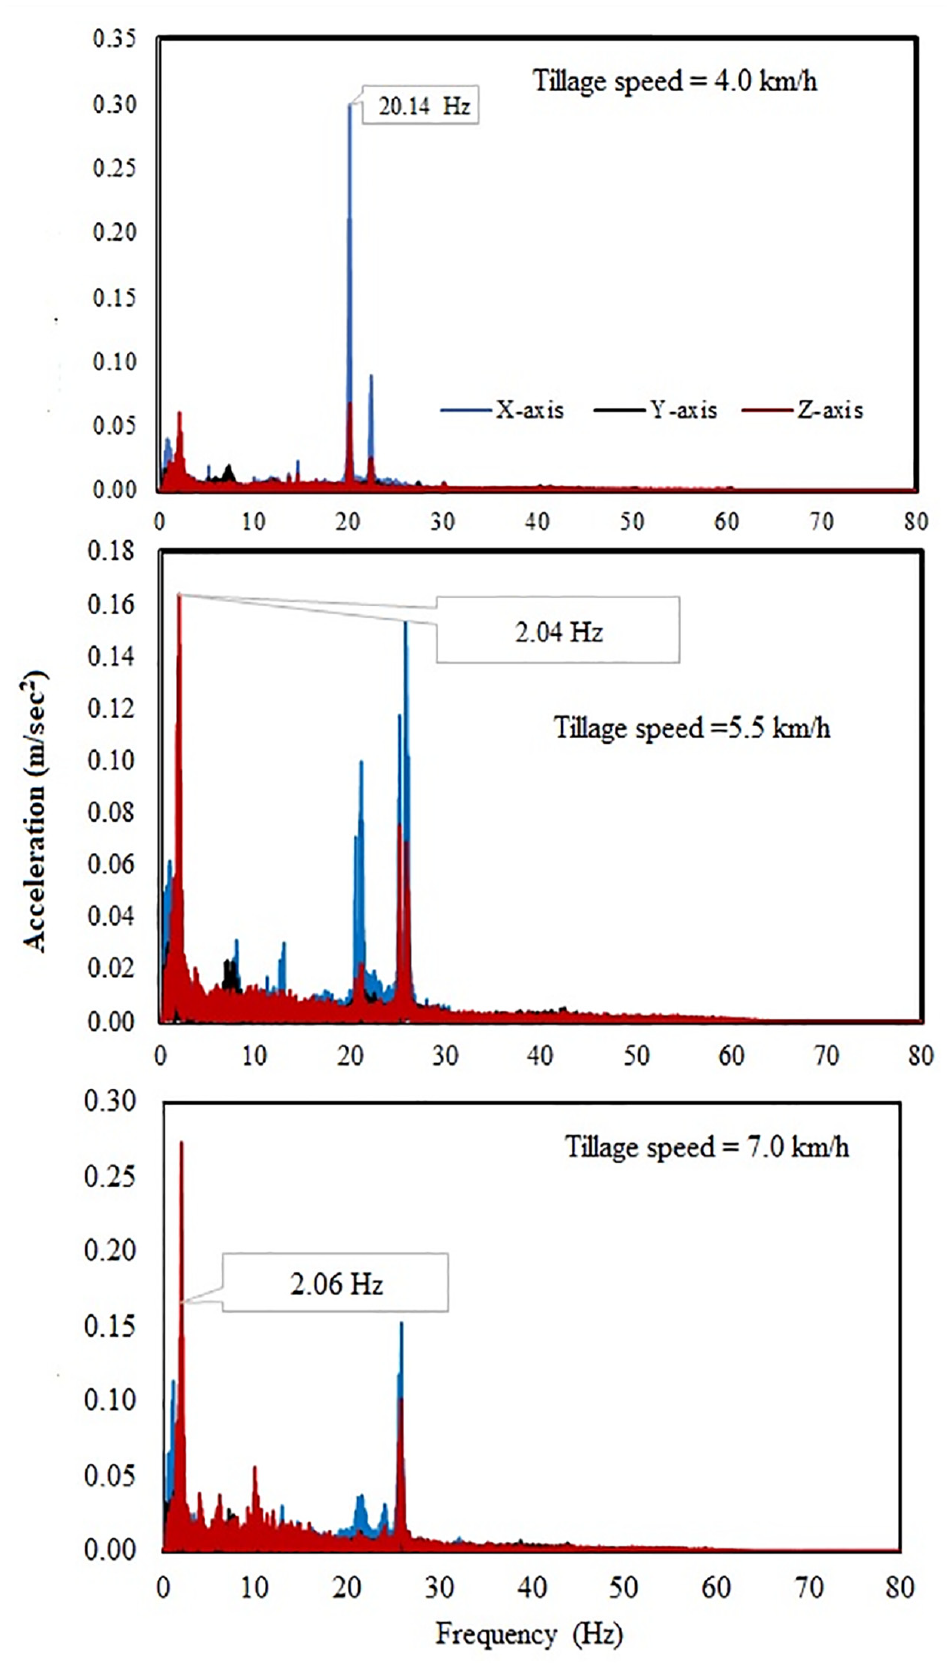
In this study, the acceleration data was analyzed with a fast Fourier transform function (FFT) using the MATLAB vibration signal analysis package to obtain the effective vibration frequency. The results showed that the disk harrow plow generated vibrations in the frequency range of 2.04 Hz–20.14 Hz during the field experiments, as shown in Figure 12.
Frequency response along the translational axes (X, Y, and Z axes).
Peak frequencies of 20.14 Hz, 2.04 Hz, and 2.06 Hz were measured at tillage speeds of 4.0, 5.5, and 7.0 km/h, respectively. Furthermore, dominant vibration values were found in the vertical direction (Z) compared to the other two directions, longitudinal axis (X) and lateral axis (Y). It can therefore be observed that the peak frequency response changed with the change in experimental conditions, with each experiment exhibiting distinct frequency peaks. The natural frequencies of certain parts of the human body may overlap with these dominant frequencies and may affect ride comfort. 41 This result is consistent with Singh et al., 42 who reported that the average acceleration response is dominant along the vertical axis. However, during real field cultivation with a disc harrow under different tractor operating conditions, raw acceleration data were analyzed using a fast Fourier transform (FFT) to determine the dominant frequencies. 31 They found that harrowing operation for soil tillage distressing behavior generates low-frequency vibrations close to the natural frequency of the human body and therefore can affect driving comfort. Furthermore, the FFT results of their study showed that tillage operation causes low frequency vibration exposure between 0.8 and 3.7 Hz. Moreover, Ricardo et al. 43 reported that over an 8-h working day, the studied tractors with different powers showed vibration levels in the 5–10 Hz frequency range, which is higher than the parameters set by ISO 2631-1. 18 Moreover, studies have shown that the frequency in the range of 4–20 Hz is the most uncomfortable for tractor drivers. 35
Daily exposure values A (8)
The discussion of A(8) values obtained from vibration measurements is important to evaluate the potential health risks for tractor drivers. As shown in Figure 13, the daily exposure values A (8) were between 0.01 m/sec2 and 0.06 m/sec2 between the vibration axes X, Y, and Z. The maximum daily exposure value A (8) was 0.06 m/sec2 at the Z axis, lower than the exposure action value (EAV) of about 0.5 m/sec2 specified in the health guideline. 18 Previous studies investigating A (8) levels in similar agricultural environments may provide valuable background knowledge to interpret the results of this study.
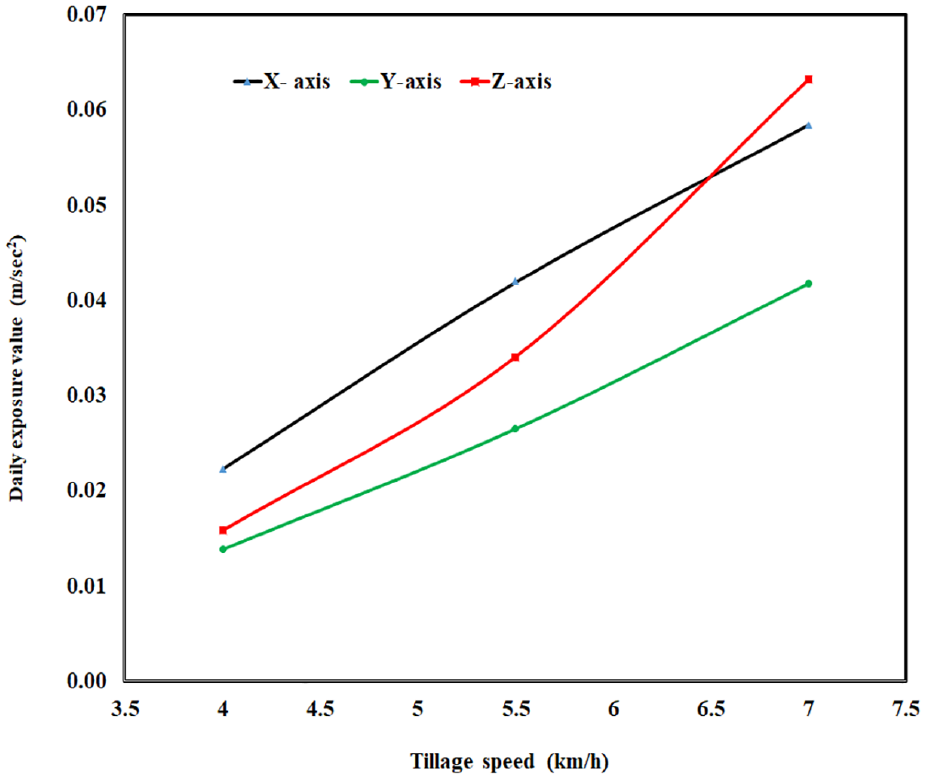
Daily exposure values of A (8).
The risk of exposure to whole-body vibration for the driver of a track-laying tractor in orchards was evaluated by Vallone et al. 44 However, to perform the experiments, six different track-laying tractors were connected to the same rotary tiller. The results showed that vibration levels of the track-laying tractors with tillers were always above the daily operating level of 0.5 m/sec2 during an 8-h working day set by ISO 2631-1 18 According to Ricardo et al. 43 agricultural tractors with a power output of 75-215 hp exhibited vibration levels higher than those permitted by ISO 2631-1 18 in the frequency range of 5-10 Hz during an 8-h working day.
According to Tsujimura et al., 45 there was a significant increase in WBV magnitude in farm fields during high-velocity tasks and heavy mechanical load on the machine. The percentage of days where A (8) values exceeded the thresholds was 24% for the EU exposure action value and 90% for the Japan occupational exposure limit. The farm tasks were plowing, transplanting, seeding, harvesting, breaking subsoil, distribution, and others. All Asum (8) and Amax (8) values for the farm tasks performed were classified into two categories: less than or equal to 0.35 m/sec2 or higher for Asum (8) and less than or equal to 0.5 m/sec2 or higher for Amax (8). By comparing our findings with established thresholds or guidelines for safe exposure to whole-body vibration, we can assess whether the vibration levels experienced by tractor operators during soil tillage using disk harrow plow fall within acceptable limits. Therefore, there was no health risk on the driver during this study. The good quality of the shock absorption system on the driver’s seat, and the softness of the soil that was previously cultivated more than once time are suggested explanations of these findings. This finding was inconsistent with the result reached by Singh et al. 31 where they obtained daily exposure values A (8) ranging from 0.43 to 0.87 m/sec2 while the soil tillage process was achieved using a disk harrow implement, and they attributed this high result to the poor insulation capacity of the tractor seat, in addition to the hardness of the soil. This discussion will contribute to a comprehensive understanding of the implications of the vibration measurements conducted in this study and highlight any potential areas of concern regarding operator health and safety. A previous study also reported high WBV exposure levels in tractors driven on different terrain and speeds. 45 The high levels of vibration could increase discomfort as well as the risk of health issue especially low back pain.2,17–19 In general, vibrations from an agricultural machine are transferred to the tractor operator’s seat, where they are subject to national and international regulatory restrictions. Typically, an agricultural machine consists of a tractor that can be connected to various other machinery needed to complete a variety of agricultural chores. 5
Conclusion
A unique feature of this study was the ability to design and build a vibration measurement unit based on the Arduino platform to assess the health effects of whole-body vibration from an agricultural tractor during soil cultivation with disk harrow plow. Analysis of vibration levels on the tractor seat was the basis for this assessment. The effect of the tillage speed on the vibration levels of the translational axes (X, Y, Z) during tillage showed significantly different results according to the statistical treatment of the data from the experimental study. The higher the tillage speed, the higher the vibration level of each axis. The highest vibration (0.80 m/sec2) was observed in the vertical direction (Z axis) at a tillage speed of 7.0 km/h. The main vibration levels were in the vertical direction (Z). The main frequencies of vibration transmitted to the tractor seat were between 2.04 and 20.14 Hz, and the maximum daily exposure value A (8) was 0.06 m/sec2 at the Z axis, lower than the exposure action value (EAV) that could affect health. The risks were not clearly documented as mentioned in ISO 2631-1. Although this study focused on tillage with disk harrow implement, future studies could be extended to other agricultural operations to increase the generalizability of the results, and the developed vibration unit is valid for the tested tractors and other agricultural implements. However, the practical value of this study was in the adoption of a unit designed to perform inexpensive studies in the vibration field without the need to purchase expensive instrumentation sensors. Further design modifications are required to enable the unit to perform real-time vibration analysis and display results for early warning using artificial intelligence (AI) for whole-body vibration measurements.
Footnotes
Acknowledgements
The authors would like to extend their sincere appreciation to the Researchers Supporting Project (RSPD2024R752) King Saud University, Riyadh, Saudi Arabia.
Declaration of conflicting interests
The author(s) declared no potential conflicts of interest with respect to the research, authorship, and/or publication of this article.
Funding
The author(s) disclosed receipt of the following financial support for the research, authorship, and/or publication of this article: This research was funded by Researchers Supporting Project number (RSPD2024R752), King Saud University, Riyadh, Saudi Arabia.
Data Availability Statement
Data are contained within the article.