
Abstract
For the instability problem of the wind turbine flexible tower caused by mechanical fatigue and vibration, Back Propagation (BP) neural network is used to establish the tower vibration prediction model to solve the wind turbine tower vibration prediction analysis. To find correlation association factors impacting the flexible tower vibration, the multi-source heterogeneous data from various operating situations of wind turbines are optimized using correlation analysis. A BP neural network-based tower vibration prediction model is created. The findings of a simulation investigation using data from a wind farm’s 2 MW wind turbine with a 120 m flexible tower reveal that the BP neural network has the greatest predictive power for operating situations below the rated wind speed. The root mean square error RMSE decreased by 10.6608; the mean absolute error MAE decreased by 9.1915 compared to the above rated wind speed. It is proved that the BP neural network prediction model has high accuracy in predicting the vibration of the flexible tower for working conditions below the rated wind speed, which can provide accurate data support for the vibration control of the flexible towers.
Introduction
The tower is a major support component of the wind turbine nacelle and blades and is expensive to build. 1 As the height of wind turbine towers increases, damage to the tower occurs as a result of fatigue, instability, and lack of bearing capacity. 2 The use of wind turbine status real-time monitoring data to find the abnormal state of the tower and to achieve predictive maintenance of the tower has become a new problem to be solved. An important assurance for power grid dispatching is accurate wind power forecast. 3 Qiu et al. 4 studied an improved neural network damage prediction method for offshore wind power tower structures based on stepwise identification, which effectively improved the prediction accuracy of the neural network model using a stepwise prediction method. Su et al. 5 suggested an XGBoost-based tower vibration monitoring technique that significantly increased the accuracy of tower vibration monitoring. Huo and Tong 6 created a thorough finite element model including blades, nacelles, towers, and foundations, and examined how wind-induced response might cause dangerous designs when cross-wind aerodynamic stress is neglected on big wind turbine structures. Du et al. 7 used finite element calculation and engineering methods to study the tower’s inherent frequency and transverse vibrations to discover the resonant areas of the tower. However, only the intrinsic and wind vibration frequencies were considered and no other factors were taken into account. Guo and Wang 8 established a vibration model of the tower based on the Gaussian process regression method and found the asymmetrical fault of the impeller pitch angle according to the model residues. Wei et al. 9 numerically simulated the variation in the vibration displacement of the tower under various wind speeds and wavelengths and verified the accuracy of the results by pool tests.However, the study is for offshore wind turbines and not for onshore wind turbines. The complexity of the wind turbine situation using co-simulation can more accurately analyze the relationship between data. The co-simulation method has an intrinsic advantage: it allows well-established and specialized simulation tools to be reused and combined with minor adaptations, in contrast to the monolithic approach. 10 Reza evaluated a 3RRR parallel robot with flexible links using a co-simulation scheme. Numerical experiments reveal the co-simulation capabilities of solving rigid and flexible links separately Co-simulation is a new simulation technique that can be applied to vibration analysis. 11 Reza proposed to apply the Bessel integral formulation for the integration of dynamics in multi-body systems (MBS) to a co-simulation system, and the results show that the stability of the results of the co-simulation has been improved and the energy error during the simulation has been reduced. 12 A BP neural network-based tower vibration modeling method is proposed for the instability of flexible wind turbine towers caused by mechanical fatigue and vibration, which can detect the early abnormal state of towers in time and realize the predictive maintenance of towers.
Wind turbine flexible tower vibration correlation analyses
The structure of the prediction model is complex to ensure the accuracy of the prediction results, the data must first be processed and analyzed. Vibratory signals provide an important reference for on-line monitoring of wind turbines. Due to the complex vibration excitation sources of wind turbine components and the coupling of aerodynamic loads and vibrations of different components, the vibration analysis of a single component is difficult to reflect the complex coupling relationship between components. 13 The effect of axial and transverse harmonic stimuli on the dynamic response of the system is also considered. 14 Based on a large number of references, the author finds that The traditional research only considers the vibration of the tower structure caused by the wind turbine’s setup position, arrangement form, and structural problems, but it does not precisely analyze the degree of influence of each state parameter of the wind turbine on the tower vibration. Therefore, this paper quantifies the degree of influence of each operating parameter of wind farms on flexible tower vibration based on correlation analysis, finds the correlation variables affecting tower vibration, and then selects the optimal set of input variables to build a tower vibration model based on the results of the model evaluation index. This can eliminate the interference of irrelevant data of tower vibration, significantly reduce the complexity of the tower vibration model, effectively improve the model operation speed, and avoid the energy loss caused by irrelevant data transmission and operating. To guarantee that the tower vibration prediction model’s input variables are accurate, the research object includes a large amount of real-time monitoring data of the wind farm, such as unit status, generator, drive chain, gearbox, tower, nacelle, grid voltage, meteorology, and other monitoring data, as shown in Figure 1.
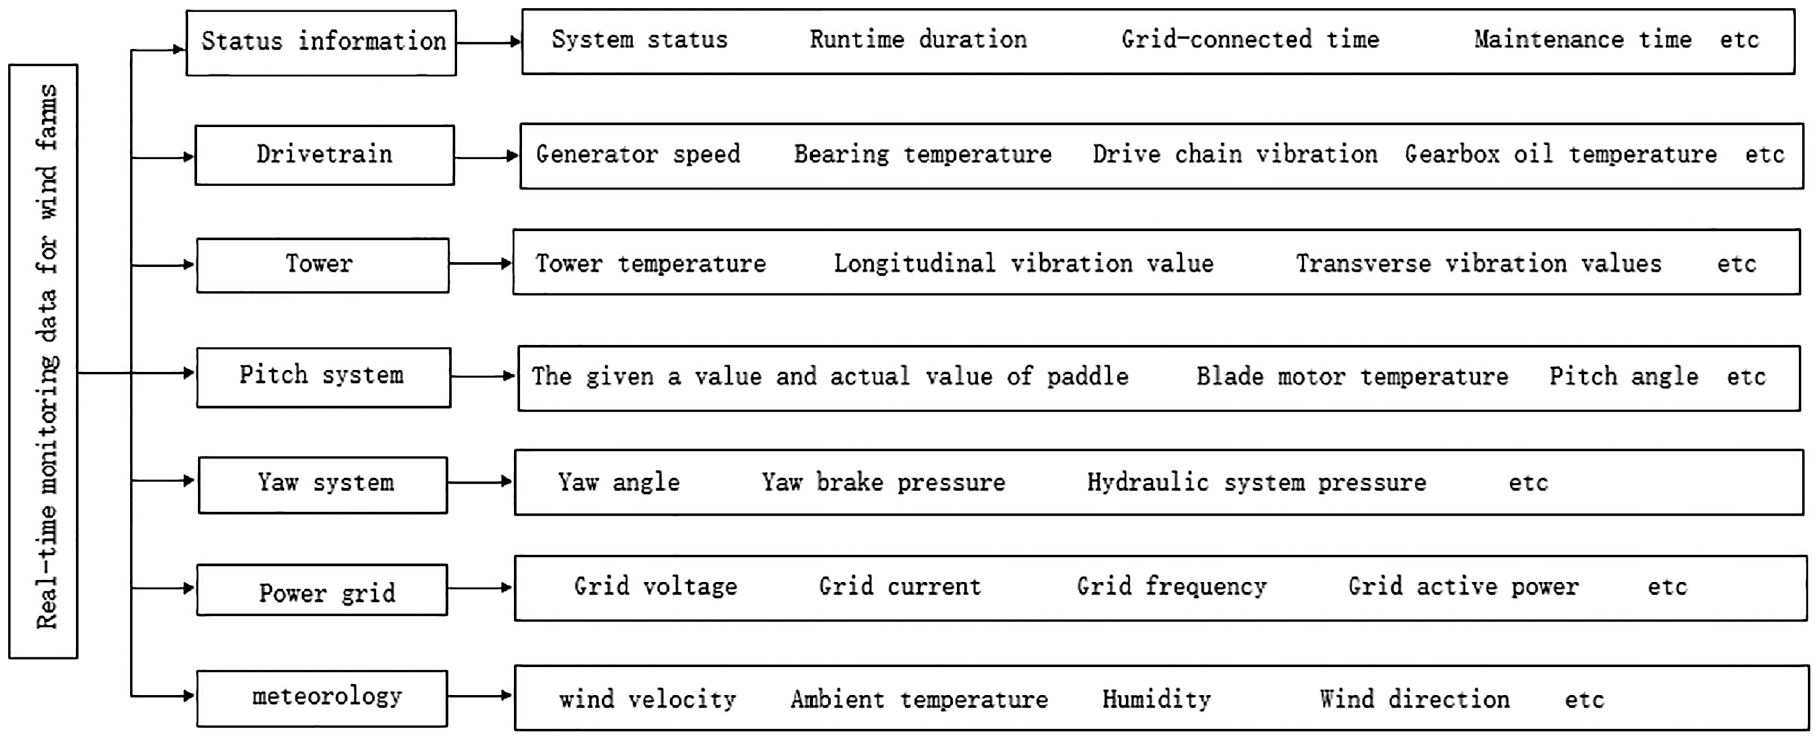
Real-time monitoring data of wind farm.
Data pre-processing
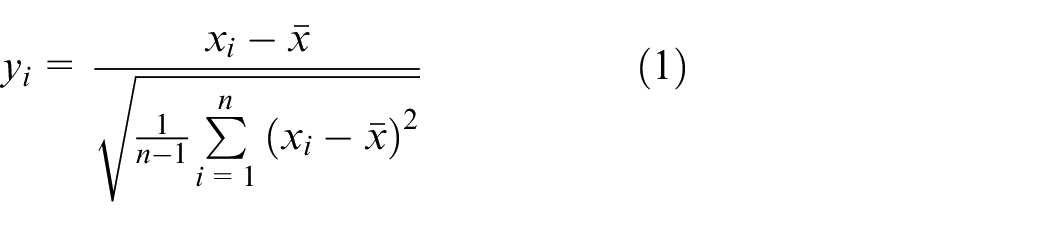
The units, magnitudes, and properties of heterogeneous data from multiple sources for real-time monitoring of wind farms tend to differ. To measure the correlation between the state parameters, it is therefore necessary to standardize the raw data to eliminate the effects of their quantities and units. In this article, the z-score normalization method is chosen for data processing. Let the original dataset be x1, x2, x3,…, x n , and transform depending on equation (1). Standard values for transformed parameters fluctuate around 0. It is above average if the number is larger than 0, and below average if the value is less than 0.
y
i
elements of the new sequence after transformation;
Comprehensive correlation index of state parameters
Due to the instability of wind speed in wind farms, the uncontrollability of grid load, and the randomness of external climate temperature, the operation control of wind turbines is also a dynamic process, and the various wind turbine operation data collected from wind farms are not independent variables, and the relationship between each data is very complex. Furthermore, under different conditions of operation of the wind turbine, the relationship between the data will also change considerably Pearson correlation coefficient was used to measure the degree of linear correlation between the two variables. The Pearson correlation coefficient is computed as given in equation (2) and is referred to as ρ. The factor takes values between −1 and 1, and it is above average if the number is larger than 0, and below average if the value is less than 0. When ρ = 0, this means that they are not correlated.
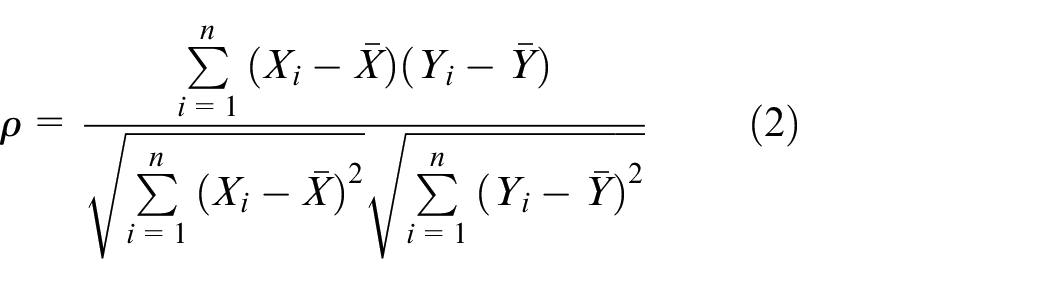
ρ is the Pearson correlation coefficient;
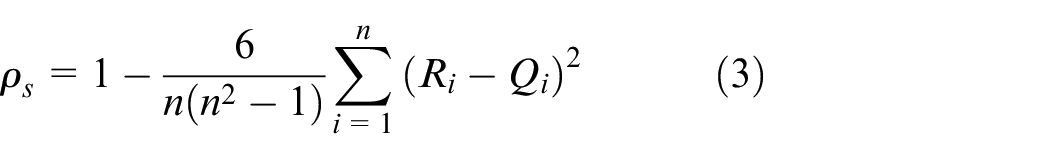
The Spearman correlation coefficient is appropriate when there are impulse disturbances or severe monotonic nonlinear distortions in the collected data. 15 Let (x1, y1 ), (x2, y2), …, (x n , y n ) be the data pairs that contain X and Y. The Spearman correlation coefficient is calculated as shown in equation (3) and is reported as ρs. Its coefficient is in the range [−1,1], ρs > 0 is a positive correlation, ρs < 0 is a negative correlation, and ρs = 0 is not a correlation at all.
ρ
s– Spearman correlation coefficient; R
j
denotes the rank of xi in (x1, x2, …,x
n
); Q
i
denotes the rank of y
i
in (y1, y2,…,y
n
);
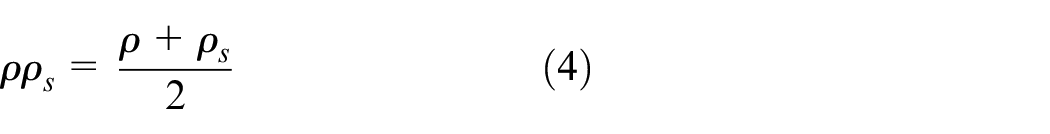
Considering the complexity of the wind turbine operating environment and the dynamics of the operating process, the comprehensive correlation index ρρ s of the wind farm state parameters is established by combining two correlation coefficients to accurately measure their correlation, and the calculation formula is shown in equation (4).
The concept and manner of operation of wind turbines vary significantly depending on the operating circumstances. Wind turbines must accomplish maximum power dynamic tracking below the specified wind speed and constant power control above the rated wind speed, when the wind turbine torque and power stay constant, to assure stability and efficiency of operation. Therefore, the variables associated with the tower’s flexible vibration differ according to working conditions. Therefore, the wind turbine tower vibration correlation analysis should be studied separately under each operating condition.
Correlation analysis of tower vibration below rated wind speed
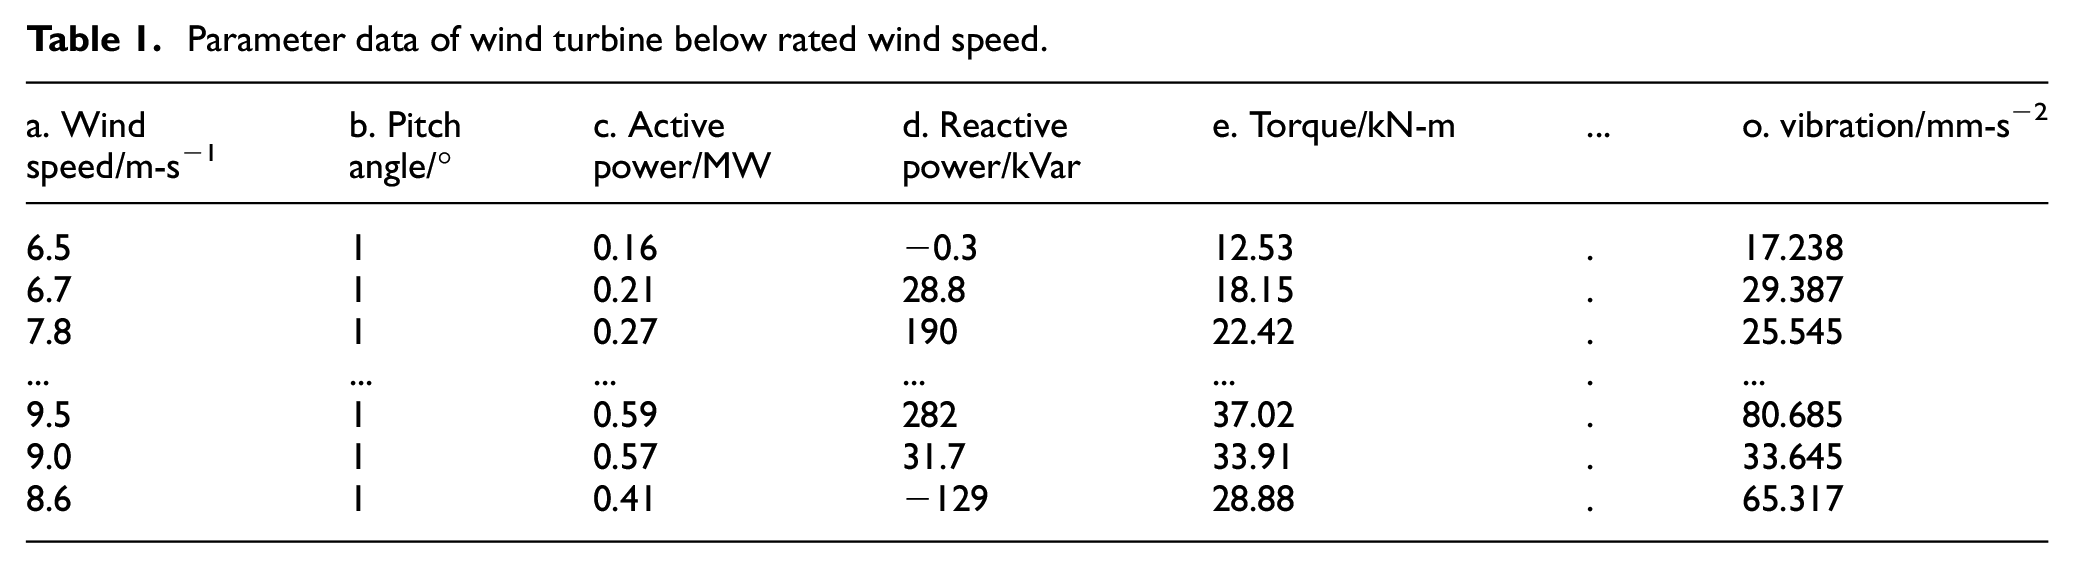
The wind turbine speed is adjusted proportionally to the wind speed between the cut-in wind speed and the rated wind speed to keep the impeller tip speed ratio close to its ideal value. At this point, the wind turbine can capture the most wind energy and the highest wind energy utilization coefficient. 16 During this wind speed range, the pitch angle is always maintained at 0°. A 2 MW wind turbine with a 120 m flexible tower serves as the study subject. The data collected includes operational information about the wind turbines, including their active and reactive power as well as nacelle position, network voltage, wind speed, pitch angle, air temperature, gearbox bearing temperature, generator speed, and transmission chain and tower vibration acceleration. Data collected in May 2020, totaling over 20,000 recordings, were selected to perform tower vibration correlation analysis and modeling analysis. Table 1 shows the data for each wind parameter collected below the rated wind speed.
Parameter data of wind turbine below rated wind speed.
The correlation analysis between wind turbine parameters below the rated wind speed is illustrated in Figure 2. Below the rated wind speed, the Pearson correlation coefficient between wind turbine parameters is shown in Figure 2(a) below the rated wind speed; Figure 2(b) shows the Spearman correlation coefficient between wind turbine parameters. The analysis’s findings indicate that the wind serves as the wind turbine’s energy source because the correlations between wind speed and other parameters are relatively large when the wind turbine operates below the rated wind speed. As a result, wind speed is the primary influencing factor causing changes in the active and reactive power, torque, and temperature of each wind turbine component.
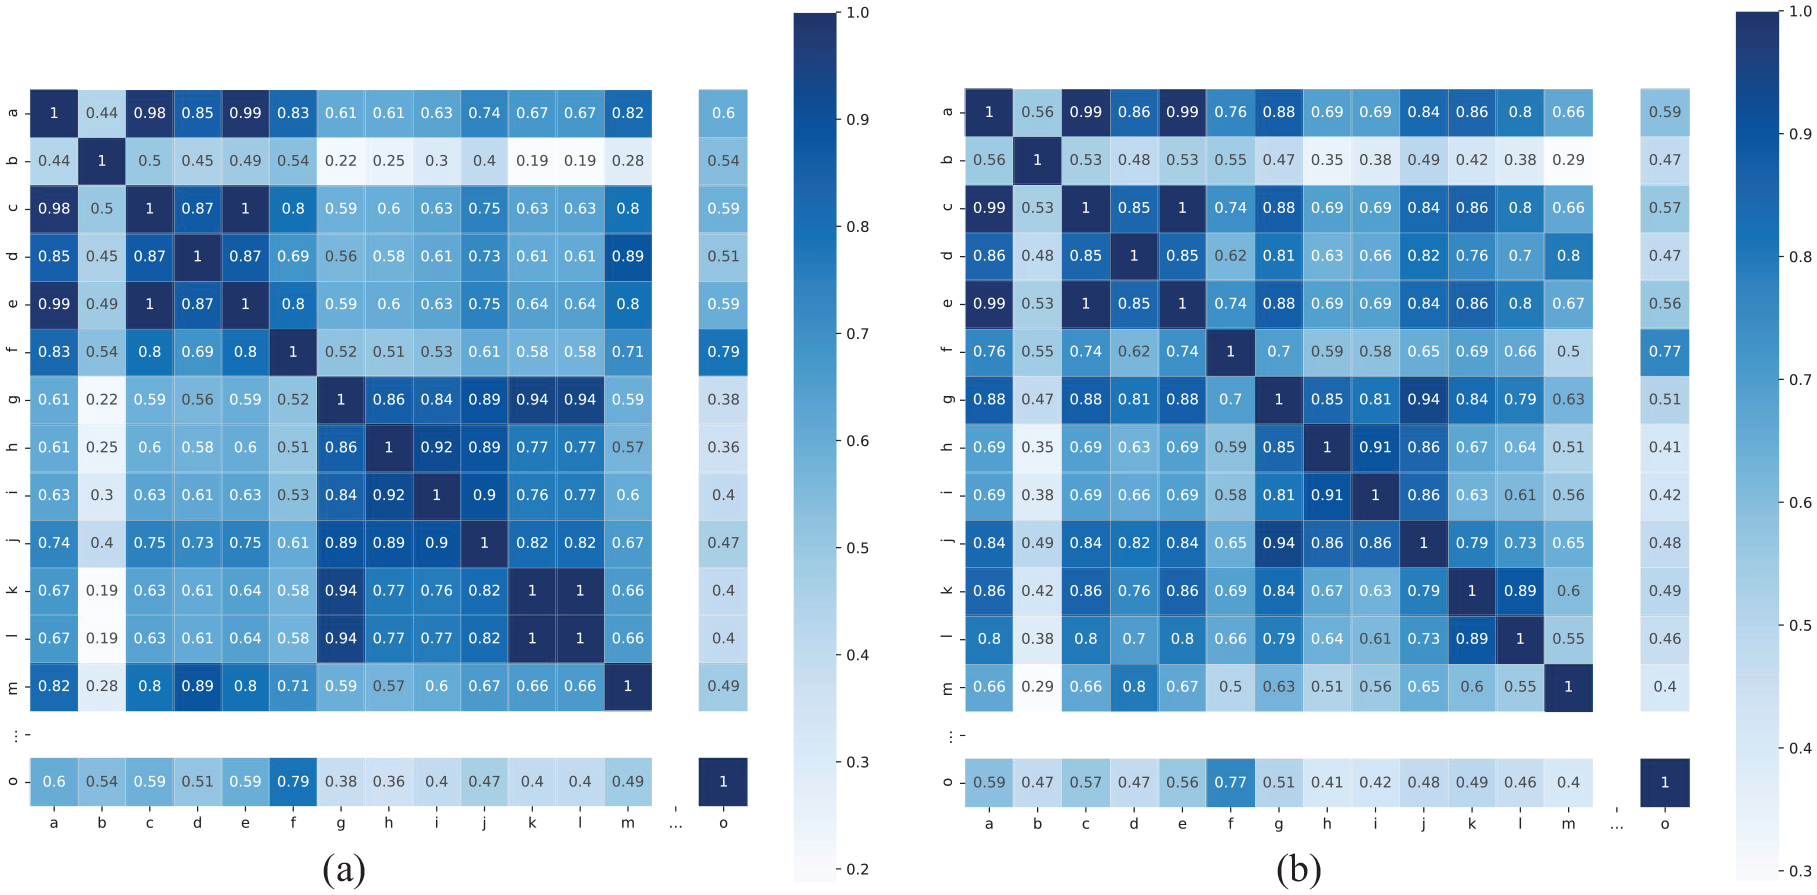
Correlation analysis of wind turbine parameters below rated wind speed: (a) Pearson correlation coefficient and (b) Spearman correlation coefficient.
Figure 3 shows the complete correlation analysis between tower vibrations below rated wind speed and each parameter. The results show that the correlation between tower vibrations below rated wind speed and drive chain vibrations, wind speed, torque, unit active power, and pitch angle is greater. The integrated correlation index ρρ s between tower vibration and drive chain vibration is larger than the value of ρρ s between tower vibration and wind speed. So the correlation between tower vibration and drive chain vibration is larger than the correlation between tower vibration and wind speed below rated wind speed. This is consistent with the actual situation so that the full value of the correlation index ρρ s can accurately reflect the correlation between the vibrations of the flexible tower and the parameters of the wind turbine.
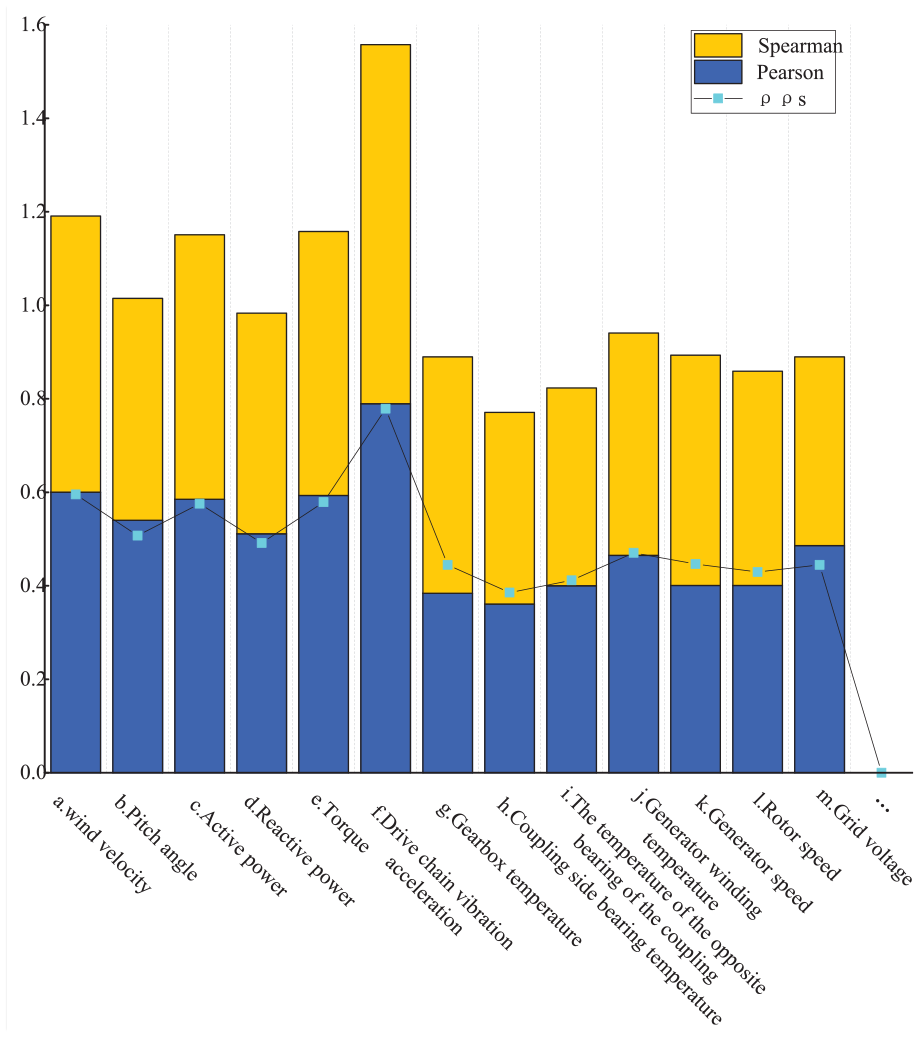
Comprehensive correlation analysis between tower vibration and wind turbine parameters below rated wind speed.
Correlation analysis of tower vibration above rated wind speed
When the wind turbine achieves the rated torque, the load torque stops growing, which causes the speed to rise. Constant power control is then done by altering the blade pitch angle above the rated wind speed. Then, variable pitch control is applied to adjust the speed and keep the load torque unchanged. 17 In this wind speed range, there is a low correlation between tower vibration and active power torque. Table 2 shows the data for each wind turbine parameter gathered above the rated wind speed.
Parameter data of wind turbines above rated wind speed.
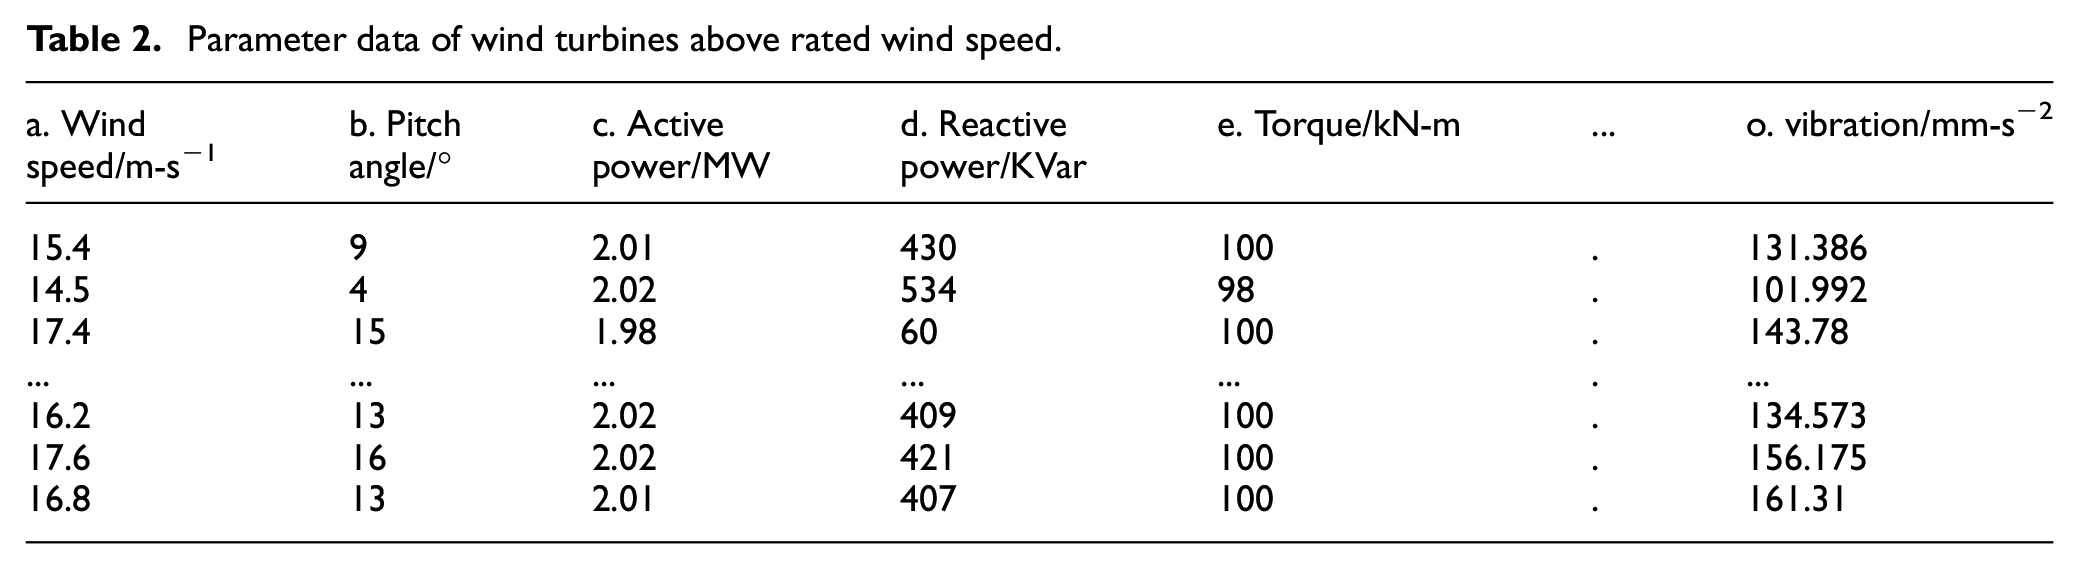
Figure 4 displays the correlation study between the wind turbine parameters at and above the rated wind speed. The figure displays the Pearson correlation coefficient for the wind turbine parameters above the rated wind speed, whereas the b plot displays the Spearman correlation coefficient. When the wind turbine is operated above the rated wind speed, the analysis’ findings show a relatively large correlation between the gearbox bearing temperature and the coupling side and opposite side bearing temperatures, generator winding temperature, generator speed, and rotor speed, indicating that changes in the corresponding parameters are what cause changes in the gearbox bearing temperature.
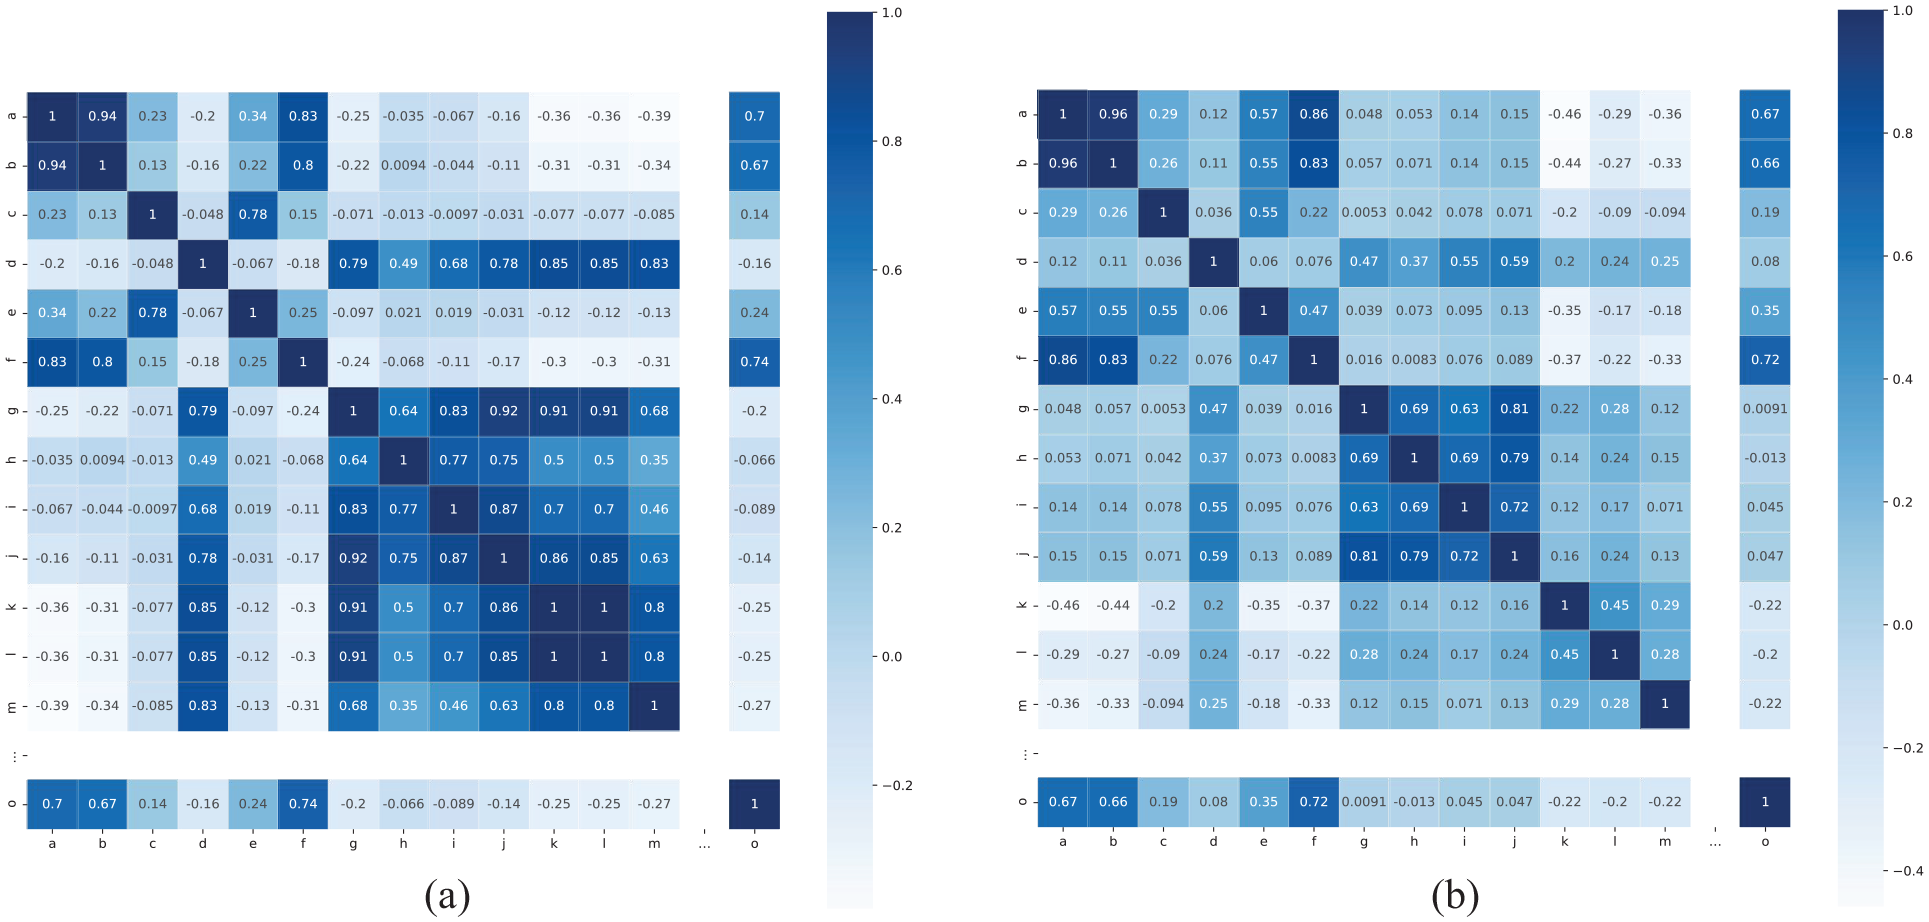
Correlation analysis of wind turbine parameters above rated wind speed: (a) Pearson correlation coefficient and (b) Spearman correlation coefficient.
Figure 5 shows the complete correlation analysis between tower vibration and wind turbine parameters greater than the rated wind speed. The results show that the relationship between tower vibration and drive chain vibration, wind speed, pitch angle other parameters is more important. The integrated correlation index ρρs between tower vibration and drive chain vibration is larger than the value of ρρs between tower vibration and wind speed, which indicates that tower vibration is more influenced by drive chain vibration than wind speed above rated wind speed.
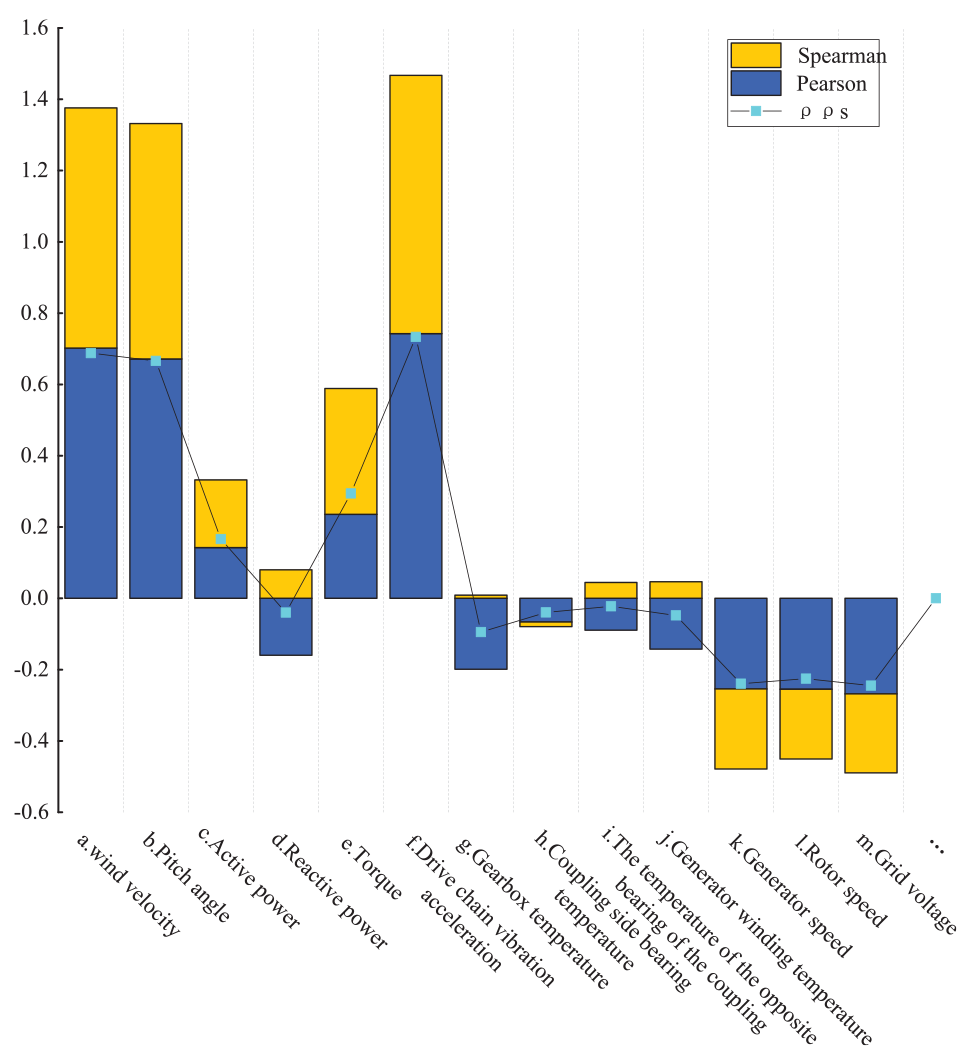
Comprehensive correlation analysis between tower vibration and wind turbine parameters above rated wind speed.
Theoretical models for vibration prediction of flexible tower
BP neural network
The BP neural network is a shallow feed forward neural network based on an error-spreading algorithm. 18 The core of BP neural networks is signal forward propagation and error back propagation. The simplest structural and functional elements of a neural network are called neurons, and a neural network can be thought of as a mathematical model made up of any number of neurons coupled with various connections. 18
BP neural network is used for guiding training and learning. When the learning mode is applied to the BP neural network, point-to-point computations are performed with each hidden layer node when the activation values of the neurons reach each node of the input layer and output layer from the input layer. 19
The neuron will receive n signals transmitted to the output layer as a result of the activation function. This is shown in equation (5).
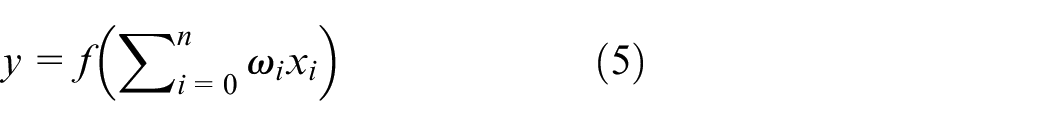
y represents the output result; f represents the activation function; ω represents the weight; and x represents the input value.
The output layer, the hidden layer, and the input layer are all included in the second error feedback. The predicted output layer data is compared to the actual value to obtain the error through the cost function. This is shown in equation (6).
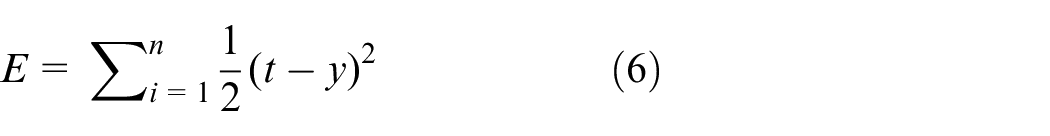
E denotes the cost function value; t denotes the true value.
The weights of the network are typically updated using the gradient descent method. The formula is shown in equation (7).

Δω denotes the increment of weights through learning.
The weights and thresholds of the BP neural network are modified during this phase’s neural network iteration. The iteration ends when the error falls within the acceptable range. This process is also called network training.
Establishment of flexible tower vibration prediction model
Data pre-processing
Irrelevant and unrealistic data are filtered out, and characteristic amounts of tower vibration are imported. Then the sample dataset is performed to standardize the data. The pre-processed dataset is divided into training and test datasets, and the mapminmax function is used for data standardization in this article, as shown in equation (8).
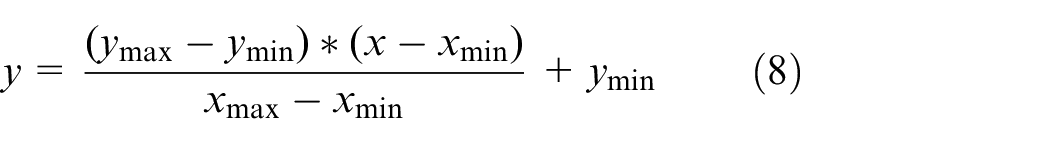
y Indicates the normalization result; y max indicates the expected maximum value for each row; ymin indicates the expected minimum value for each row; x indicates the preprocessed data value.
Create and train the neural network
The activation function, training strategy, number of hidden layers, weights, threshold, learning rate, and iterations of the BP neural network are all chosen using the newff function. The output result is compared to the predicted value, if the accuracy matches, the computation is complete, if not, the weights of each neuron are modified using the gradient descent approach and moved to the back propagation step until the accuracy matches the requirement. 20 Form the network iteratively until the error result is less than the set value for the end of the simulation, and results plotted. The BP neural network model diagram is shown in Figure 6.
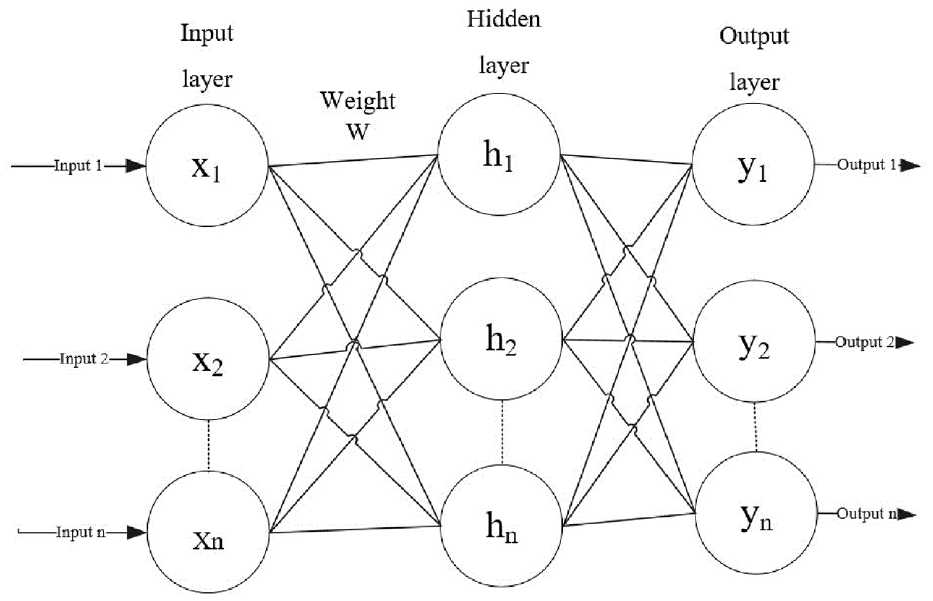
Network model diagram.
In this article, there are six hidden layer nodes and one hidden layer. Both the input layer and the hidden layer have three neurons each. The network is trained using the trainlm function, and the purelin function is employed as an activation function. For evaluation, we choose the number of iterations, the RMSE, and the MAE value. 21
Simulation results
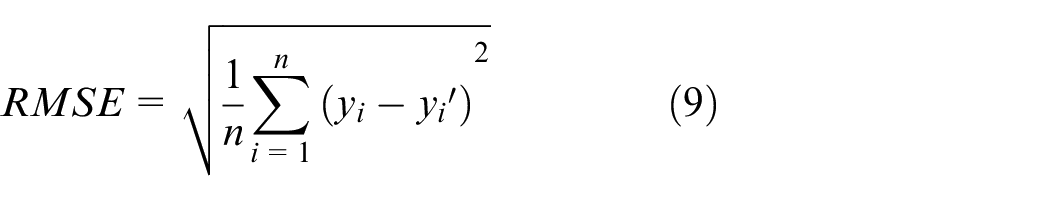
The data collected from a 2 MW wind turbine with a 120 m flexible tower in a wind farm are studied. Installation of four vibration sensors placed in the nacelle, the second section above the tower, the third section, and the lowest end. Collected real-time data on tower vibration. Variable tower vibration correlation data serves as the model input, and tower vibration acceleration serves as the model output. The sample data under each working condition are randomly sorted and divided into a training set and test set, and the samples with group numbers 1–400 are set as a training set to train the model. To test the model, 100 groups of samples with group numbers 401–500 were chosen as the test set. The MAE and RMSE were used to evaluate the prediction model. Suppose the actual observed value is y = {y1, y2, …, y
n
}, the model predicted value is y′ = {y1′, y2′, …, y
n
′}, and the average of the actual observed value is noted as
Tower vibration model and verification below rated wind speed
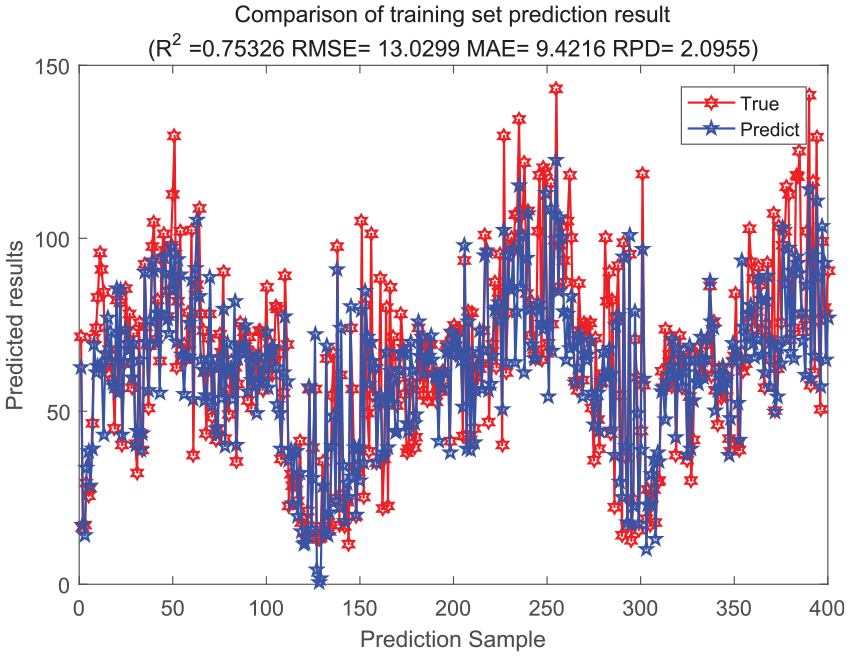
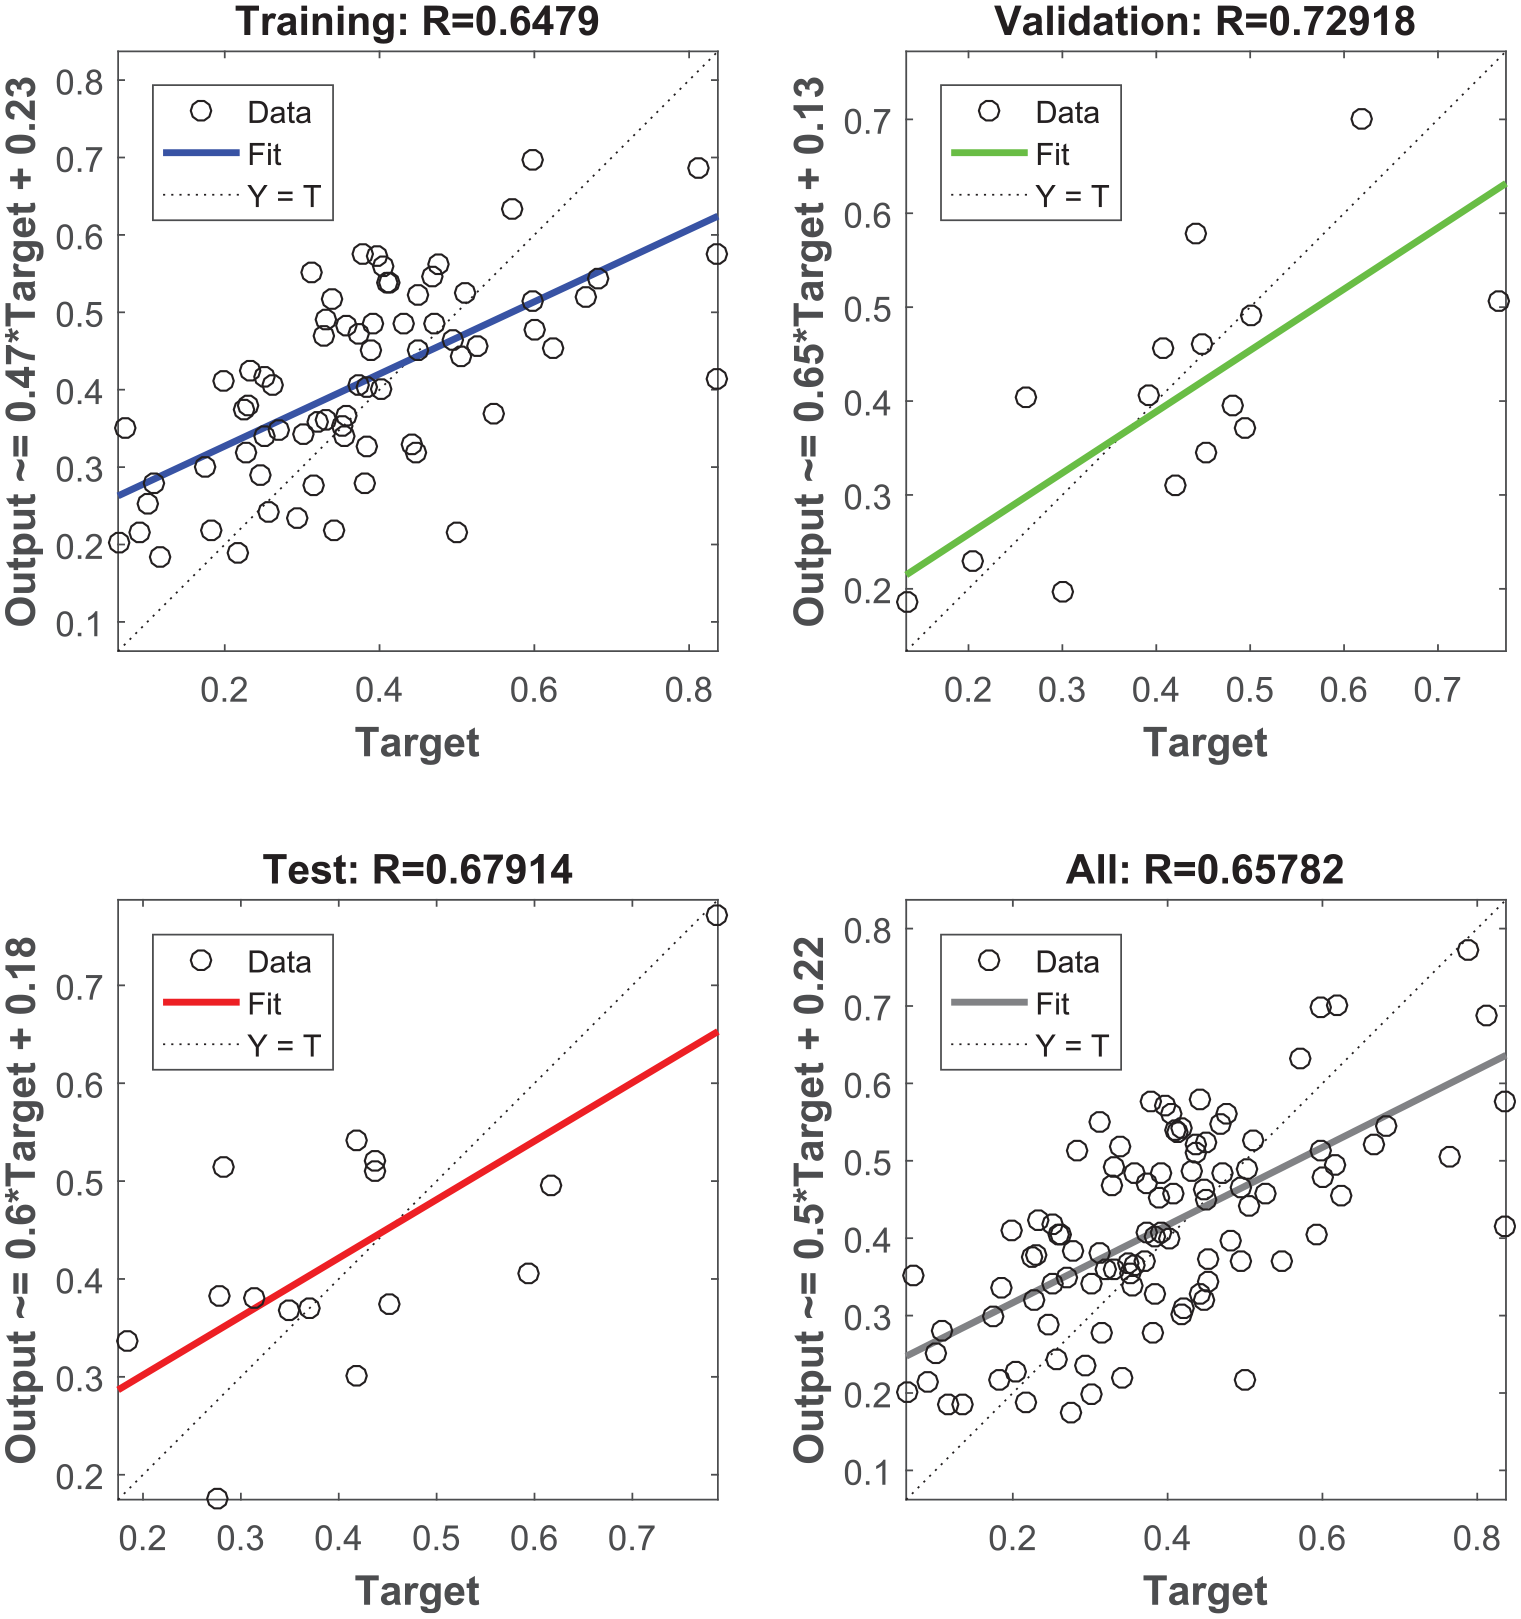
Based on the comprehensive correlation analysis of tower vibration, the main variables affecting tower vibration below rated wind speed are drive chain vibration acceleration, wind speed, torque, active power, pitch angle, reactive power, generator winding temperature, etc. The vibration acceleration of the transmission chain, wind speed, torque, and active power are selected as the input of the tower vibration model. The associated variable data of tower vibration are input into the BP neural network database in the order of large and small correlation coefficients. The simulation results of the training set are shown in Figure 7. The MAE of the training set of the BP neural network is about 9.4216 and the RMSE is about 13.0299. A linear regression plot is obtained as shown in Figure 8.
BP neural network training set simulation results..
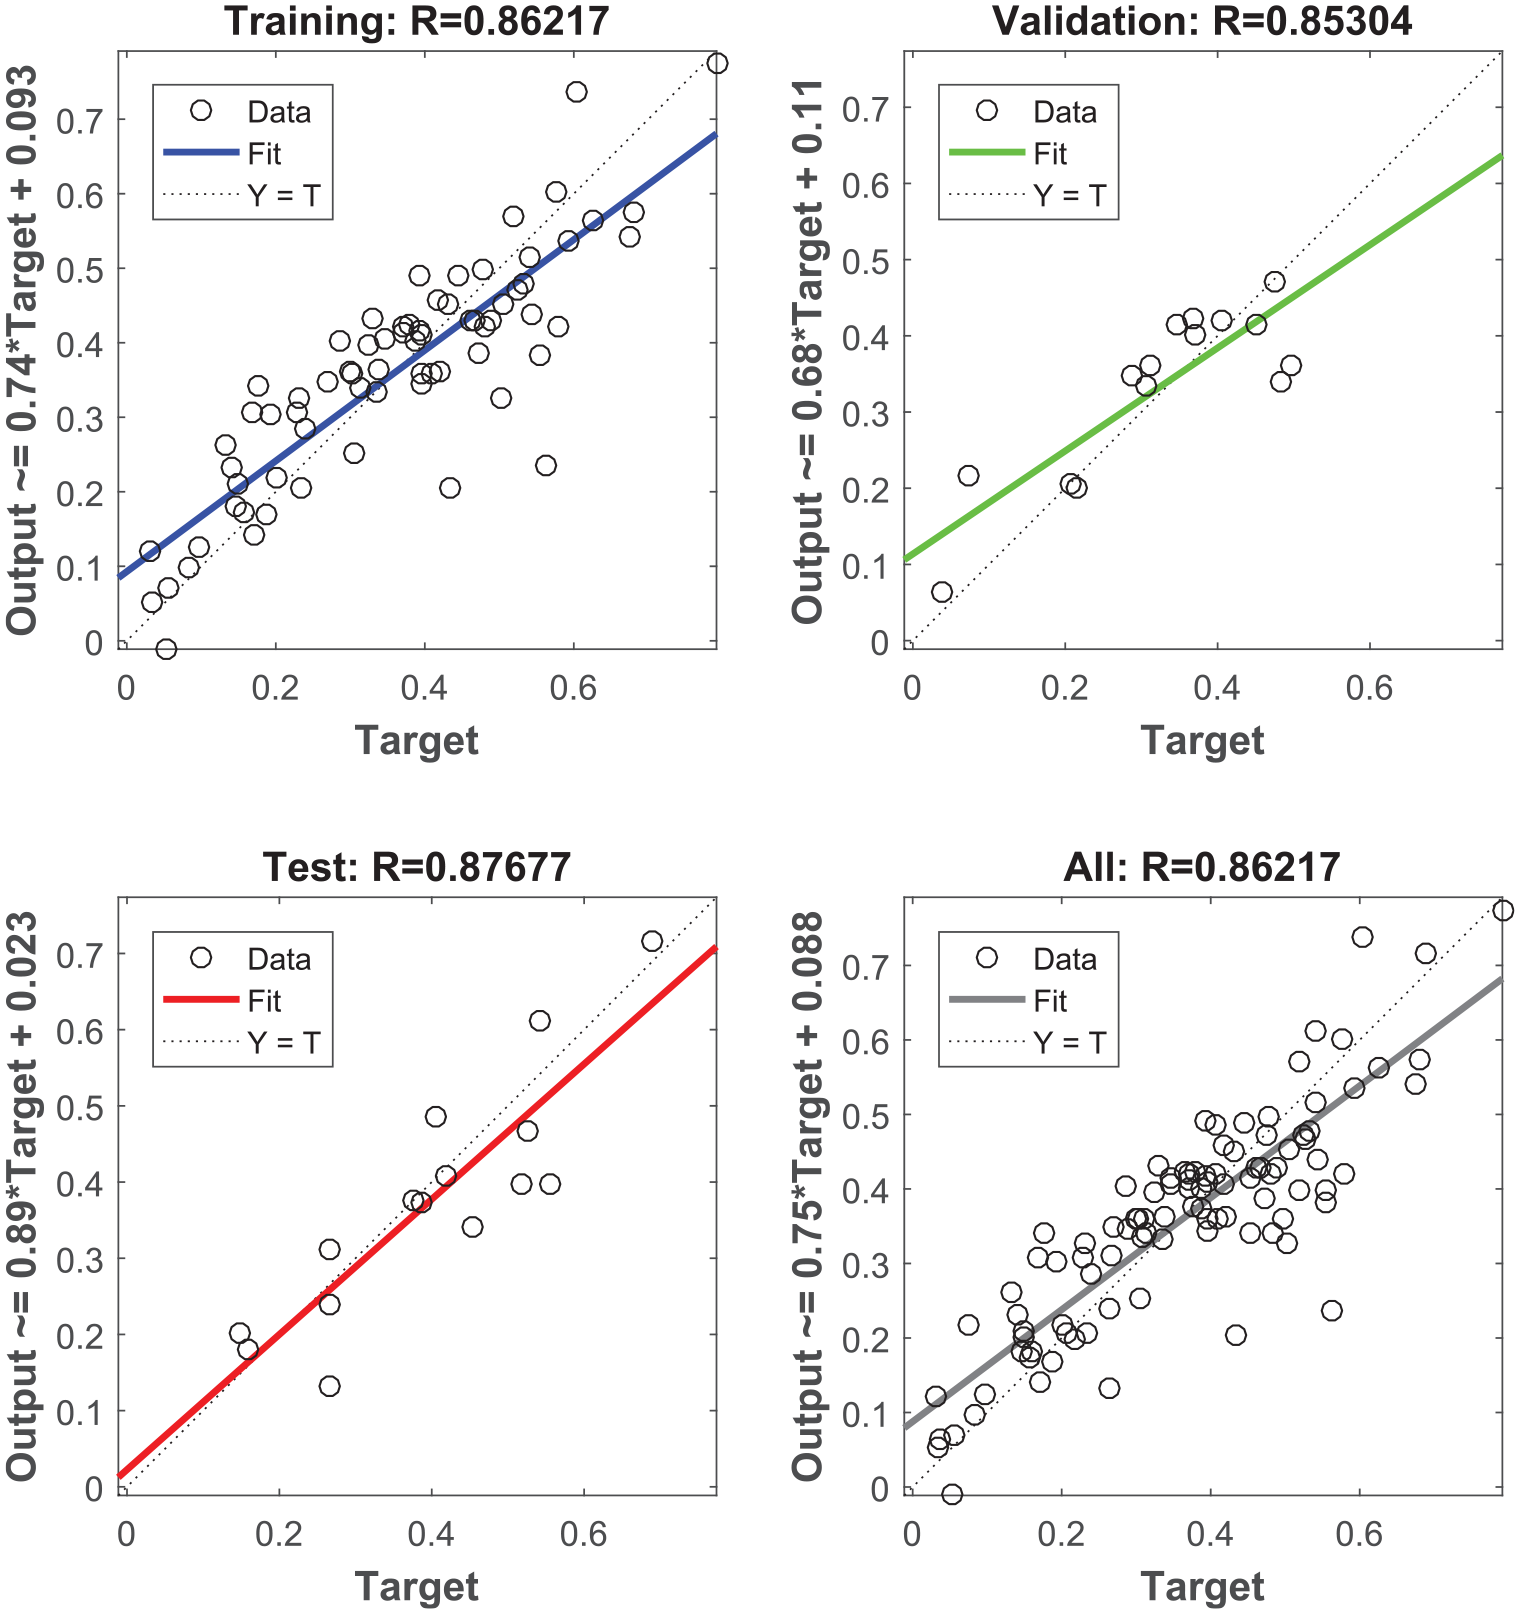
Linear regression curve..
Tower vibration model and verification above rated wind speed
Based on the detailed tower vibration correlation analysis, the major variables influencing tower vibration above the rated wind speed are driven chain vibration acceleration, wind speed, and pitch angle. Therefore, under working conditions higher than the rated wind speed, the acceleration of drive chain vibrations, wind speed, and pitch angle are selected as input to the tower vibration model. The tower vibration prediction results of the BP neural network training set above the rated wind speed are shown in Figure 9.
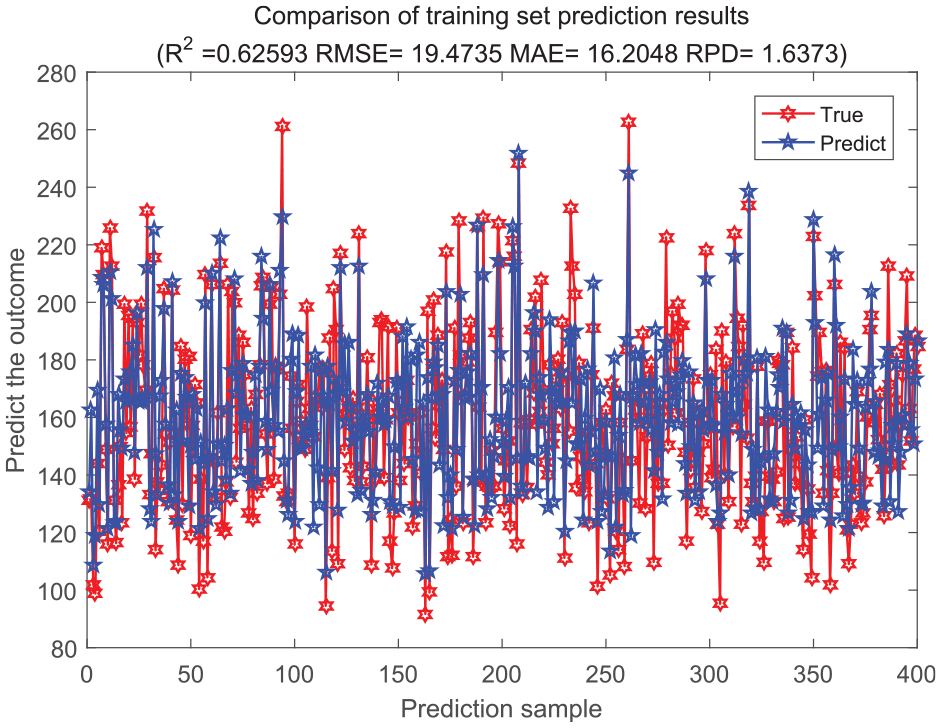
BP neural network training set simulation results.
Linear regression curve.
Experimental analysis
To verify the accuracy of the algorithm under actual operating conditions, experimental analysis is performed on the wind turbine simulation experimental platform. The data in this paper were used as the environmental conditions for the operating conditions below and above the rated wind speed. The accuracy of the algorithm was compared between the two conditions.
The vibration prediction results of the BP neural network test set below the rated wind speed are shown in Figure 11,
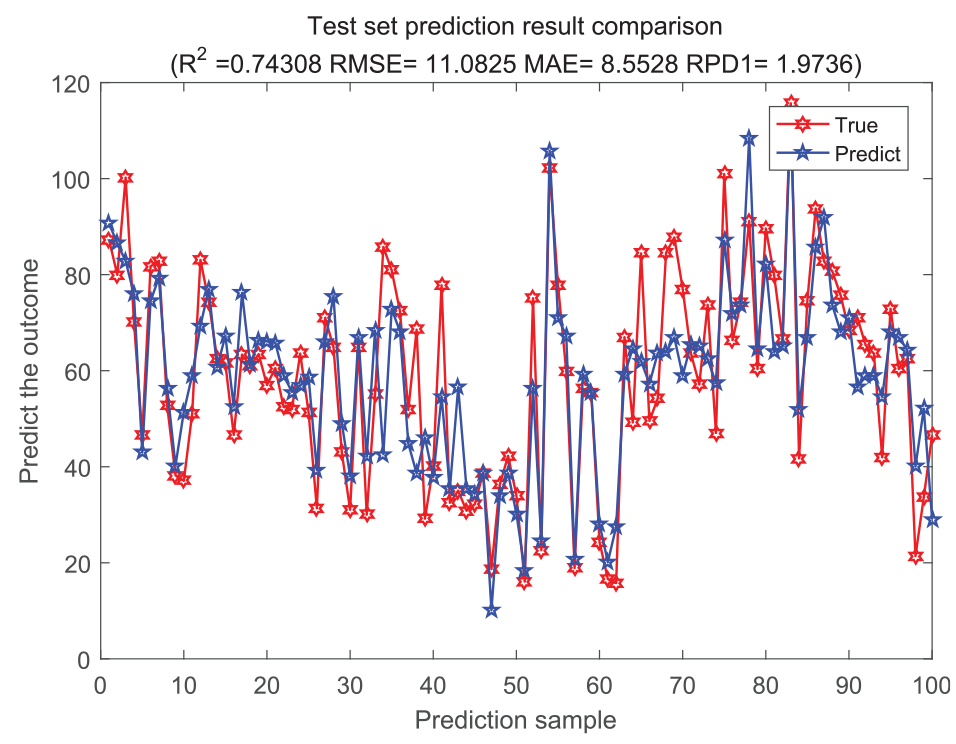
Simulation results of BP neural network test set under rated wind speed.
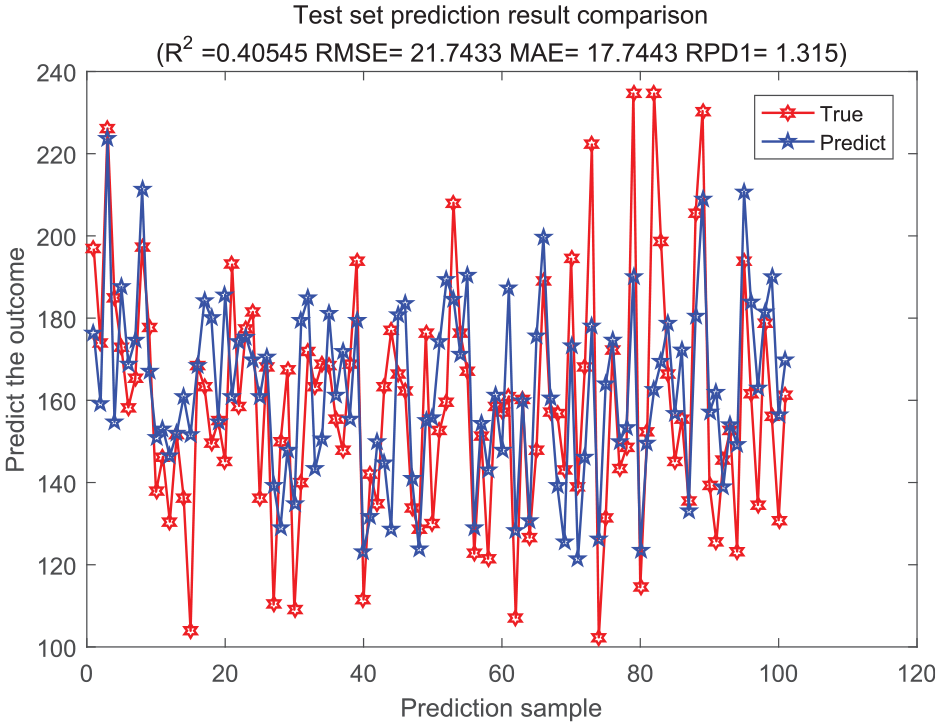
Simulation results of BP neural network test set above rated wind speed.
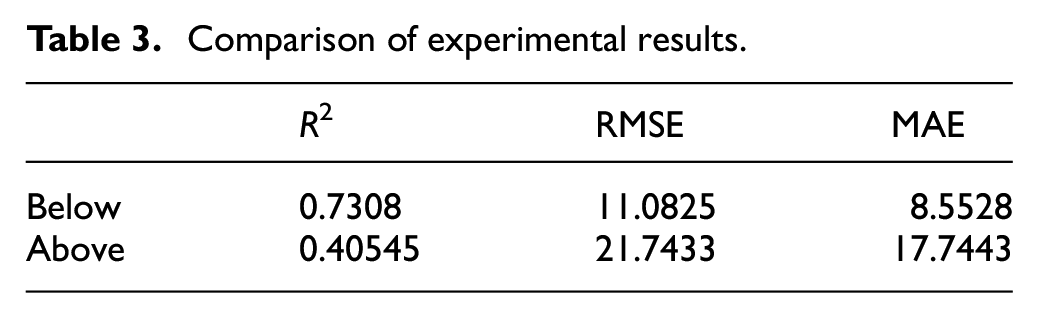
Comparison of experimental results.
Conclusion
As the research object, a wind farm with two 2 MW wind turbines with a 120 m flexible tower is used. Operating data are gathered under various working conditions, correlation analysis is used to determine the correlation variables affecting the flexible tower’s vibration, and a tower vibration prediction model based on the BP neural network is established to predict the vibration of the wind turbine tower. Both operating scenarios below and above the permitted wind speed are predicted by the model for tower vibration. It can effectively improve the accuracy of flexible tower vibration prediction. The BP neural network is more accurate in the prediction below the rated wind speed when comparing the outcomes of the two sets of predictions. Therefore, this study provides a new research idea for high-precision prediction of flexible tower vibration.
Footnotes
Declaration of conflicting interests
The author(s) declared no potential conflicts of interest with respect to the research, authorship, and/or publication of this article.
Funding
The author(s) disclosed receipt of the following financial support for the research, authorship, and/or publication of this article: Fund Project: 2021 Liaoning Provincial Education Department Key Project (LJKZ1088). Liaoning Innovation Capability Promotion Joint Fund Project (2022-NLTS-16-03). Liaoning Applied Basic Research Plan (2022JH2/101300251), Liaoning Education Department Scientific Research Project (LJKZ1101, JYTMS20230321, LJ222411632037).
Data availability statement
Data sharing not applicable to this article as no datasets were generated or analyzed during the current study.