
Abstract
A method for constructing a commercial map of social hotspots based on time-series neural networks is proposed. It explores map construction through three stages: atomic event graph building, fusion, and public opinion analysis. The neural network captures event dynamics and public opinion evolution. An unsupervised learning approach trains the model to explore deep event connections. A time map reflects event trends and opinion changes. A sentence-level event extraction model provides rich information. An empirical mode decomposition method analyzes IMF data to understand intrinsic patterns. Time-series neural networks classify and reconstruct event graphs, constructing a knowledge graph. Experiments show this method reduces storage costs, simplifies prediction, and exhibits robustness. It offers new insights for commercial mapping and contributes to public opinion monitoring.
Introduction
In today’s digital age, the widespread dissemination of social hot events on social media and news platforms has formed a vast ocean of data. 1 These data not only have a large quantity and rapid growth, but also contain rich information and value. How to extract valuable information from massive data, 2 especially public opinion monitoring of social hot events, has become a hot and difficult research topic. 3 Traditional methods often face problems of low efficiency and low accuracy when processing these data. Therefore, this study aims to propose a feature extraction method for social hot event public opinion monitoring data based on time series neural networks, in order to achieve reasonable planning of cloud storage space and improve the efficiency and accuracy of public opinion monitoring.
Sun et al. 5 proposes a method to improve model interpretability through knowledge mapping in natural language processing. They used knowledge maps to construct more interpretive models in the fields of healthcare and education, thereby enhancing the transparency and credibility of the models. However, this method may be limited by the specific domain knowledge representation and mapping methods, and may have certain limitations for cross domain applications. Azadeh and Farrokhi-Asl 6 expresses semantic relevance through knowledge graphs and integrates graph information into classification models using graph neural networks. This method has achieved good results in small sample image classification tasks, demonstrating the potential of knowledge graphs in improving model generalization ability. However, building a high-quality knowledge graph requires a large amount of domain knowledge and data resources, and updating and maintaining the graph is also a challenge. Xiao and Konak 7 extended the triplet information of entities in the document through a knowledge map and applied this information to the pre training language model. This method has achieved the best results in multiple vertical domains, indicating the effectiveness of knowledge maps in enhancing language model performance. However, for large-scale data processing, this method may face challenges in computational complexity and storage costs. In terms of feature extraction of public opinion monitoring data for social hot events, methods such as time-frequency analysis, time-scale coupling, instantaneous phase and frequency Hilbert transform are widely used for extracting high-order cumulative spectral features. These methods can reflect the internal modal characteristics of data and help reduce storage costs. However, dealing with redundant data and computational complexity remains a challenge for these methods. Shu et al. 8 proposes a spectrum detection method based on precise positioning and ranging of cloud storage system nodes. This method utilizes an adaptive equilibrium model to configure the spectrum of hot events into large-scale data mining and clustering, and combines time-frequency feature extraction algorithms for high-order spectrum analysis and spectrum design. Although this method improves the storage structure, the problems of high computational complexity and poor real-time performance limit its widespread use in practical applications. Chen et al. 9 proposes a spectral design method that optimizes storage performance through data block partitioning and spectral decomposition. However, when faced with uncertain external interference, this method may exhibit poor mapping performance, which limits its stability and reliability in actual public opinion monitoring scenarios.
This paper combines time series neural networks with empirical mode decomposition to propose a new feature extraction method for public opinion monitoring datasets. Firstly, this study utilizes time series neural networks to model public opinion monitoring data, which can more accurately capture the dynamic evolution of events and the development of public opinion; Secondly, through empirical mode decomposition, the data is subjected to multi-level analysis, effectively extracting high-order cumulative spectral features and reducing storage costs; Finally, this study combined cloud storage technology to achieve reasonable planning and efficient management of public opinion monitoring data.
Overview of atomic event graph and event extraction for social hotspot events
Constructing atomic event graphs for social hotspot events involves structured analysis, utilizing NLP techniques and domain knowledge to parse text and extract atomic events and their relationships. 10 The atomic event graph not only reveals event development but also supports subsequent analysis. Event extraction aims to detect and extract event instances, participants, and attributes from text. 11 This paper focuses on constrained-domain event extraction, predefining event types and structures, including triggers, arguments, and argument roles. This approach accurately extracts relevant information from events like traffic accidents, providing scientific support for decision-making.
Semantics is a branch of mathematical logic semiotics that primarily studies the relationship between symbols or linguistic symbols (such as words, sentences, and other expressions) and their referents. The research object of semantics is the meaning of natural language, which can be language units at different levels such as words, phrases, sentences, and texts. Focus on machine understanding of natural language through semantics. 12
A logical map is a visual tool that uses graphics and symbols to represent concepts, logical relationships, and reasoning processes. It has the characteristics of visualization, structuring, hierarchy, and interactivity. In complex decision-making processes, logical maps can help organize and analyze relevant information, assisting in making wiser decisions. 13
Analysis of pre-training language model and atlas structure characteristics
Pre-training language model
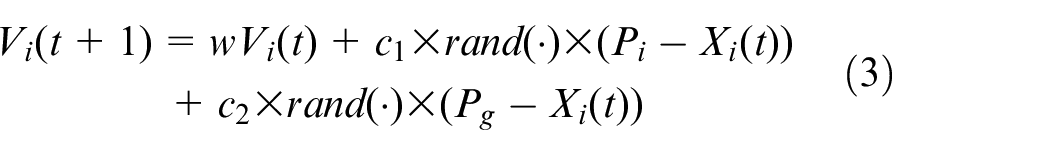
The reason for choosing unsupervised learning is mainly based on its ability to handle large amounts of unlabeled data, which is incomparable to supervised learning. In real-world scenarios where unlabeled data dominates, unsupervised learning becomes particularly important. In principle, unsupervised learning automatically learns the structure and patterns in data by minimizing a certain loss function. Common unsupervised learning methods such as autoencoders can reconstruct input data through encoding and decoding processes, thereby extracting key features from the data. This feature extraction process not only helps with dimensionality reduction, but also enables the model to better understand and represent the data. As for the impact on model performance, although unsupervised learning may lack direct performance evaluation criteria (such as accuracy, recall, etc.), it can discover hidden structures and patterns in data, providing strong support for subsequent model construction. In addition, unsupervised learning can also serve as a pre training step to improve the performance of supervised learning models.Language model is one of the most important models in natural language processing. Language model can be seen as the basis of most natural language processing tasks. Traditional language models generally include bag-of-word model, N-gram model, etc. The main idea of the bag-of-word model is to regard each word as an independent feature, without considering the relationship between words. The N-gram model considers the relationship between words. The N in the model name represents the distance considered. For example, if N is taken as 2, the relationship between the central word and the two words before and after is considered.
14
Generally, Markov hypothesis can be introduced and written in the form of conditional probability multiplication. Firstly, it should analyze the cloud storage structure model of resource and data structure model of public opinion monitoring data of social hot events, carry out information fusion and feature extraction of cloud storage resources of public opinion monitoring data of social hot events, and achieve accurate estimation of observation data and target resource information atlas. A data fusion model for the cloud storage system of public opinion monitoring data of multiple social hot events is established. In the cloud storage system of public opinion monitoring data of multiple social hot events, the cloud storage systems of public opinion monitoring data of various social hot events usually have different measurement characteristics.
15
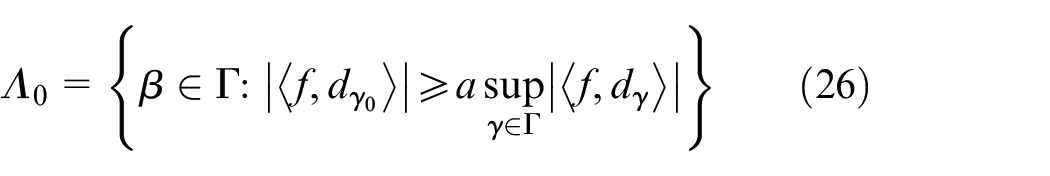
Each atomic event graph describes a public opinion event. It contains at least one atomic event. In this work, we define an atomic event graph as follows:


The storage node of the hot event rational atlas in the data aggregation tree
Where
Analysis of data storage structure characteristics
The atomic event diagram building task is the process of automatically building atomic event diagrams from documents describing a public opinion event. This paper proposes a two-phase framework for the building task of atomic event diagram. The first step is atomic event extraction. Atomic event extraction mainly extracts the trigger words, arguments and roles of atomic events that appear in the text, respectively corresponding to V, V, and E of the atomic event graph. 16 The second step is to identify the event relationship, which mainly identifies the relationship between atomic events, corresponding to the E in the atomic event graph.
Reasonable data storage and scheduling can be realized based on client/server. Assuming that the cloud storage systems of public opinion monitoring data of social hot events are independent of each other, the measurement model of the cloud storage system of public opinion monitoring data of multiple social hot events can be expressed as follows:

Where,

On the basis of cloud resource information feature extraction based on the cloud storage system of public opinion monitoring data of social hot events, it can analyze the storage structure of public opinion monitoring data of social hot events, and obtain the following data fusion:


Where
Cloud storage structure.
As shown in Figure 1, data fusion is the integration of multiple data sources or features to obtain more comprehensive and accurate information. Adaptive feature extraction is the flexible selection and extraction of problem related features based on the characteristics and requirements of the data.
In this process, the use of the high-order Cumulant back focus design atlas can help us better understand the modal features inside the data, so as to extract features more effectively. This method can improve the reasonable planning ability of storage space, enabling us to more effectively utilize storage resources, reduce storage costs, and improve the performance and efficiency of the storage system.
In conclusion, through data fusion, adaptive feature extraction and the use of high-order Cumulant rear focus design atlas, the reasonable planning ability of storage space can be improved, so as to achieve more effective storage management.
Analysis of the structure of the business map and construction of the information flow model
By analyzing the data structure, the corresponding information flow model is established to more accurately understand the data transmission and processing process in Cloud storage nodes. Such analysis and model construction will help us optimize the spectral feature extraction of Cloud storage system, thus improving the efficiency and accuracy of data processing.
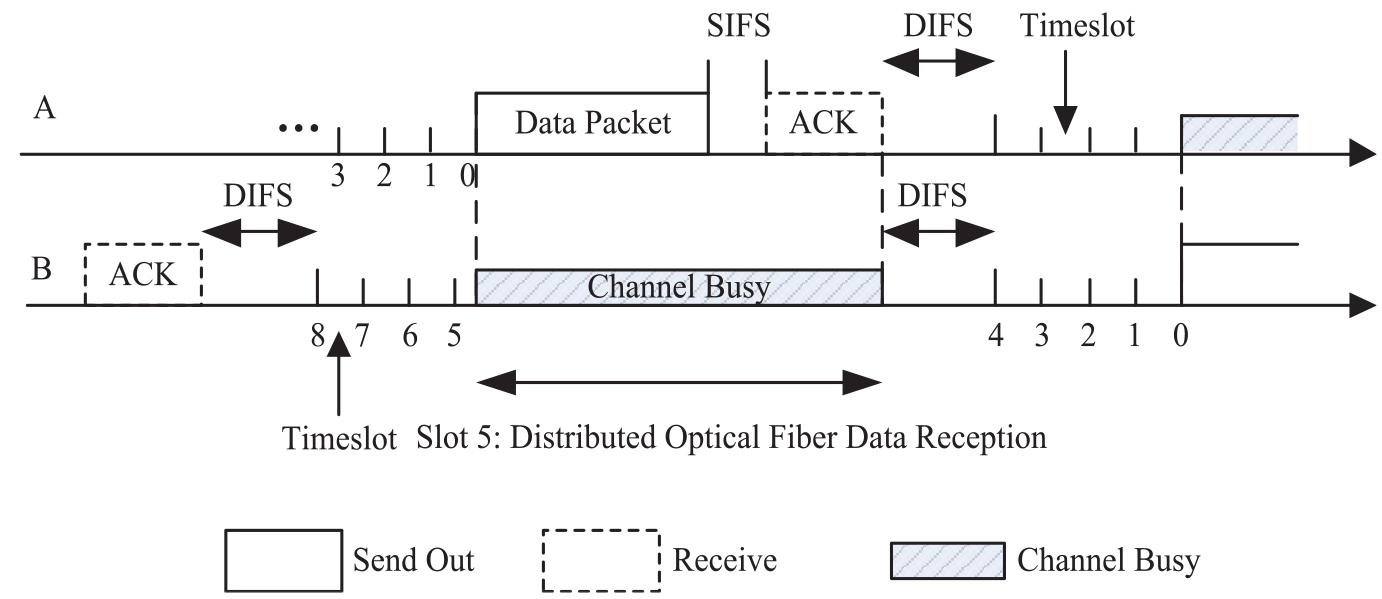
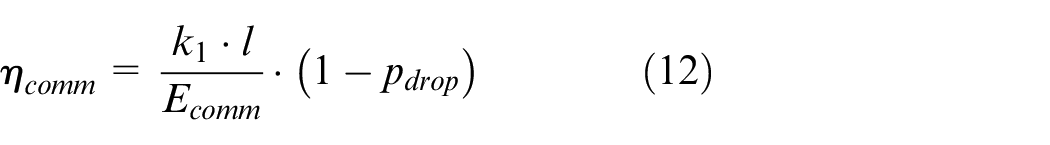
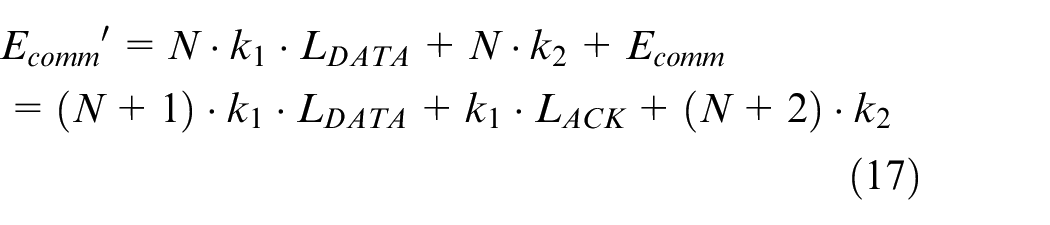
In general, in the distributed optical fiber wireless sensor network, we considered the energy consumption model of information flow of Cloud storage nodes, and provided an accurate data basis for spectral feature extraction of cloud resources through data structure analysis and data information flow model construction. These works help optimize the performance of Cloud storage system and improve the efficiency of data processing. 17 In the distributed optical fiber wireless sensor network, it is assumed that the energy consumption model representation form of cloud storage node information flow in the data packet is:
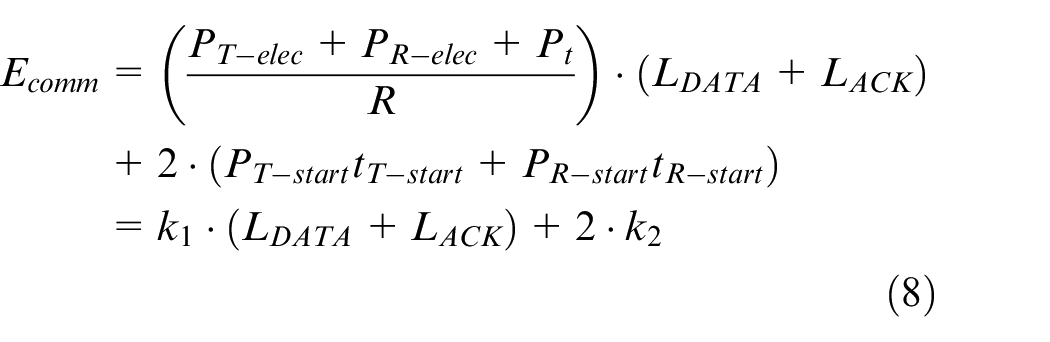
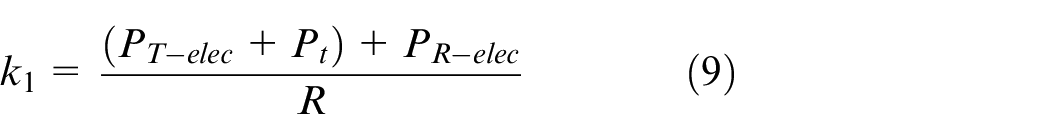

Wherein, k1 is a codeword used to describe the characteristics of Cloud storage system, which represents the specific characteristics required to transmit 1-bit information. k2 represents the initial energy consumption required to store cloud resource information on a specific grouping node. These characteristics and energy consumption values are very important for understanding and optimizing the performance and efficiency of Cloud storage systems. The energy consumption characteristic model based on the cloud storage system of public opinion monitoring data of social hot events is established. The process coordinates
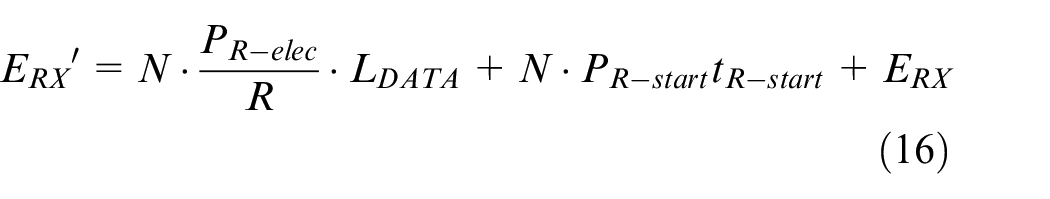
In order to solve the interference problem of public opinion monitoring data in social hot events, we have adopted strong tracking and filtering technology. After the data packet is sent, there is a certain relationship between the original measured value of cloud resource information and the percentage of Quantization error. Simply put, by using strong tracking filtering technology, we can reduce or offset the interference impact in public opinion monitoring data. This technology can help us more accurately obtain the original measured value of cloud resource information and process Quantization error. By controlling the percentage of the original measured value and Quantization error, we can improve the accuracy and reliability of the data. Specifically:
Where,
In the above formula,

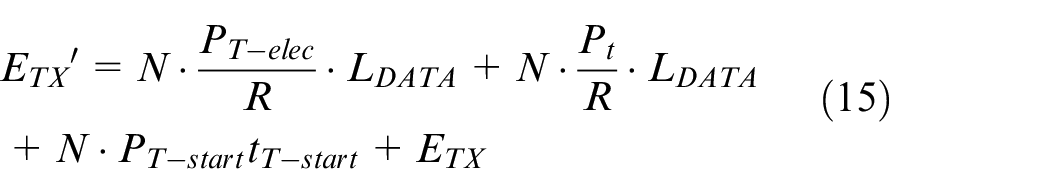
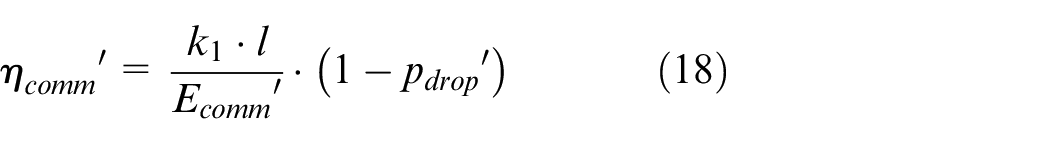
Wherein, N is the number of requests for tags including time, place, participants, force objects and force objects, and pdrop’ represents the packet loss rate of data storage under the public opinion monitoring data storage behavior of specific network social hot events. The above data structure design for cloud resources can effectively reduce packet loss rate and improve storage performance through atlas design.
Optimization of social hot events
Feature extraction and design of rational atlas
By extracting the spectral characteristics of high-order Cumulant, we can effectively reflect the internal modal characteristics of public opinion monitoring data of social hot events. These features can reveal the patterns and trends of data changes, helping us better understand the development and evolution of public opinion.
In order to reduce storage costs and reduce Data redundancy, we also optimized the spectrum design. By optimizing spectrum design, we can reduce the storage of redundant data while maintaining critical information, thereby improving the utilization efficiency of storage resources. 18
However, traditional methods have certain performance shortcomings when dealing with public opinion monitoring data of social hot events. To overcome these issues, we propose a new feature extraction method based on empirical mode decomposition in time series neural networks. This method combines time series analysis and neural network technology, which can more accurately extract modal features of data and has good performance.
EMD is a time-frequency feature extraction method suitable for non-stationary and nonlinear signals. This means it is very suitable for handling complex and ever-changing signals such as public opinion data. Public opinion data is often influenced by various factors, including social environment, economic conditions, policy changes, etc. These factors make public opinion data exhibit non-stationary and nonlinear characteristics. EMD can effectively extract these features by decomposing the original temporal signal into a combination of multiple fundamental mode components.To sum up, we can more accurately reveal the modal characteristics of public opinion monitoring data on social hot events, while reducing storage costs and Data redundancy by extracting the spectral characteristics of higher-order Cumulant, optimizing the spectral design, and adopting the feature extraction method based on empirical mode decomposition under time series neural networks. These methods provide effective tools and technical support for us to deeply understand the development of public opinion.
The feature extraction process of public opinion monitoring data of social hot events under time series neural network is described as follows:
The empirical mode decomposition and decomposition of the time series neural network oriented business atlas collected under the interference of complex external information can achieve data fusion and feature extraction of public opinion monitoring data of social hot events, and obtain the instantaneous frequency IMF component of multiple narrowband cloud resource information, which is expressed as:


In the above formula, interval
Where,
In event extraction, we built a sentence-level model integrating lexical, syntactic, and entity features. To analyze these features precisely, we employed Empirical Mode Decomposition (EMD). EMD decomposes complex signals into intrinsic mode functions (IMFs), ordered by frequency. Applying EMD to public opinion data, we extract key information from IMF components, eliminating noise and focusing on relevant parts for event extraction. EMD decomposes data into multiple IMFs, each representing a vibration mode of different time scales.However, IMFs may contain pseudo-components due to noise. To address this, we apply Hilbert transform, converting time-domain signals to frequency-domain, extracting instantaneous interference. Filtering IMFs removes pseudo-components, preserving true signals. This approach ensures accurate data analysis, removing interference for reliable results. After processing IMFs, frequency modulated Hilbert spectrum shift indicates frequency variation, providing a solid foundation for subsequent analysis of social hot event public opinion data. This change leads to the shift of the Hilbert spectrum, which results in phase differences at different frequency components, as follows:

Where,
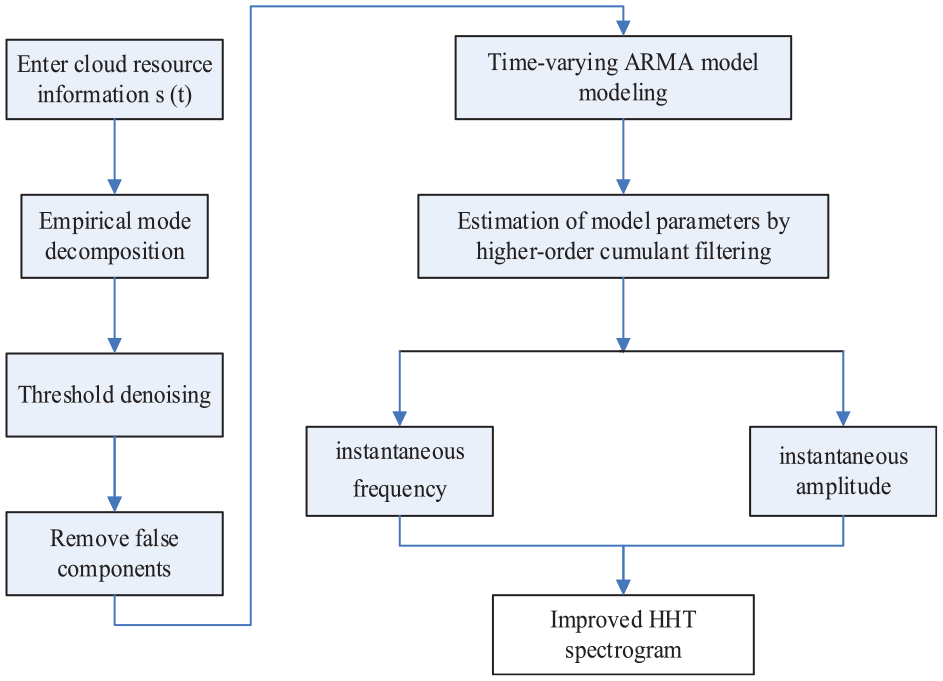
Map feature extraction process of rational atlas.
It can be seen from Figure 2, in the process of feature extraction for time series data, we first use Empirical Mode Decomposition (EMD) technology to decompose the original time series data into a series of Intrinsic Mode Functions (IMFs), which represent the fluctuation components of different frequency scales in the data. Subsequently, in order to remove possible noise and false components during the decomposition process, we adopted threshold denoising and false component recognition methods to screen and purify IMFs. Next, based on the purified IMFs, we construct a time-varying autoregressive moving average (TV-ARMA) model to capture the dynamic characteristics of time series. In the model parameter estimation stage, we use high-order cumulative filtering techniques to improve the accuracy and robustness of parameter estimation. Finally, by analyzing the signal, we calculate the instantaneous frequency and amplitude of each IMF, which can reveal the local dynamic characteristics of the time series. Based on these features, we construct an improved Hilbert Huang transform (HHT) spectrogram to provide valuable input for subsequent data analysis and machine learning applications. The entire implementation process integrates multiple steps such as signal decomposition, denoising, model construction, parameter estimation, and feature extraction, aiming to extract practical features from complex time series data.
Optimization and realization of the structure of the rational atlas
In event relationship recognition, the atomic events extracted in the event extraction phase are used to mine the relationship between events. The relationship between atomic events that this paper focuses on mainly includes (1) temporal relationship: there is a temporal relationship between the two atomic events, such as “After the incident, the city leaders rush to the scene to command rescue,” and there is a temporal relationship between the rush event and the command event in the sentence, and the rush event occurs before the command relationship. Sometimes the accompanying relationship can also be seen as a temporal relationship. 19 For example, in “the vehicle involved has been temporarily detained and the driver Zhang has been controlled by the police,” the two events of vehicle temporary detention and driver control occur simultaneously. (2) Causality: There is a causal relationship between the two atomic events. For example, “At 1:00 yesterday afternoon, an Iveco vehicle collided with a farm vehicle on the road near Zhuangtouyu Village, causing 6 deaths.” The collision and the death here constitute a causal relationship, and the vehicle collision caused deaths. In this work, we only consider the common sense cause and effect that everyone agrees on, and do not excessively pursue the essential cause and effect. As for the difference between causality and temporal relationship, this work adopts the general differentiation method of relevant research, and considers that the relationship without causality and with chronological order is temporal relationship. 20
In the event extraction stage, we established a sentence-level pipeline event extraction model that integrates lexical, syntactic, and entity features to comprehensively and deeply understand the essence of events. Lexical features capture semantic information of individual words, crucial for identifying event triggers and attributes. Syntactic features focus on structural relationships, revealing event participant interactions. Entity features identify named entities related to event participants. After feature extraction, empirical mode decomposition analyzes social hot event public opinion data to extract key information. Finally, time series neural networks classify and reconstruct event graph features to explore event relationships and patterns, supporting the construction of commercial maps. It is assumed that the space vector of cloud resource storage in a linear combination frequency band of a basis function satisfies
Assuming that the expansion density
Where
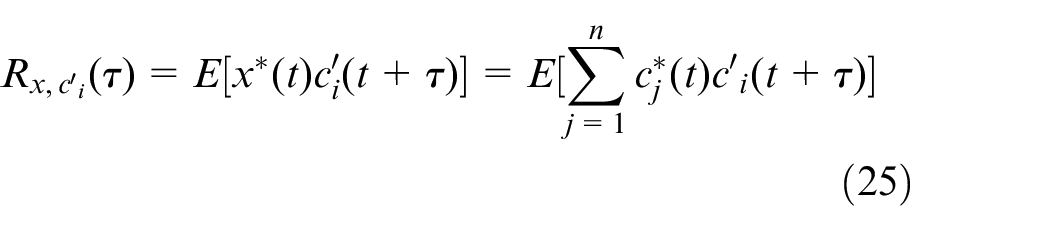
Thus, the special instantaneous frequency’s Hilbert energy spectrum of the event map oriented to the time series neural network is obtained:
The energy spectrum of the rational atlas in time series neural network at each frequency, representing all the cumulative amplitude in the statistical sense. It constructs a pipeline event extraction model in sentence level, and extracts the lexical features, syntactic features, and entity features of the event sentence text. Information fusion and feature extraction are carried out for the sampled data. 23 Empirical mode decomposition method is used to conduct multi-layer IMF component quantitative analysis for the public opinion monitoring data storage information of social hot events. Time series neural network is used to achieve the classification and feature reconstruction of the event map.24,25 Combined with the parameter analysis of the semantic map model, the event map is constructed.
The overall implementation process of this method is shown in Figure 3 below:
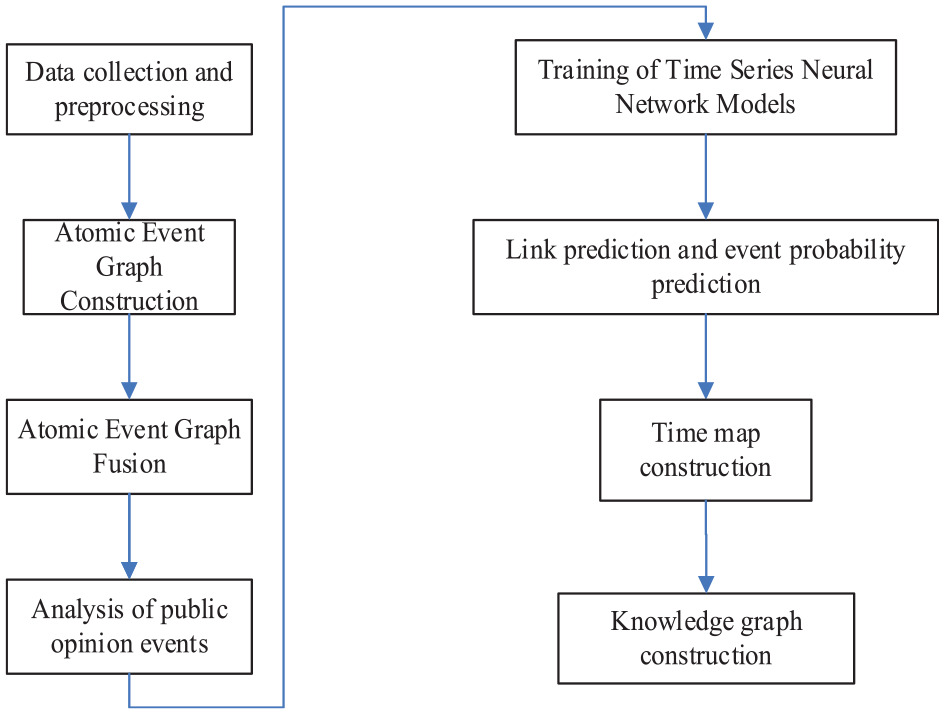
Flow chart.
Simulation experiment and result analysis
Experimental setup
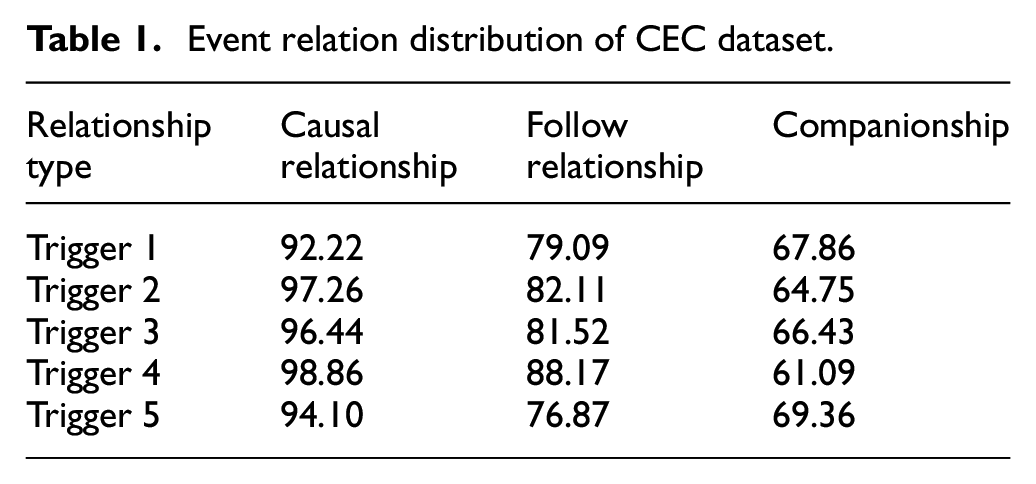
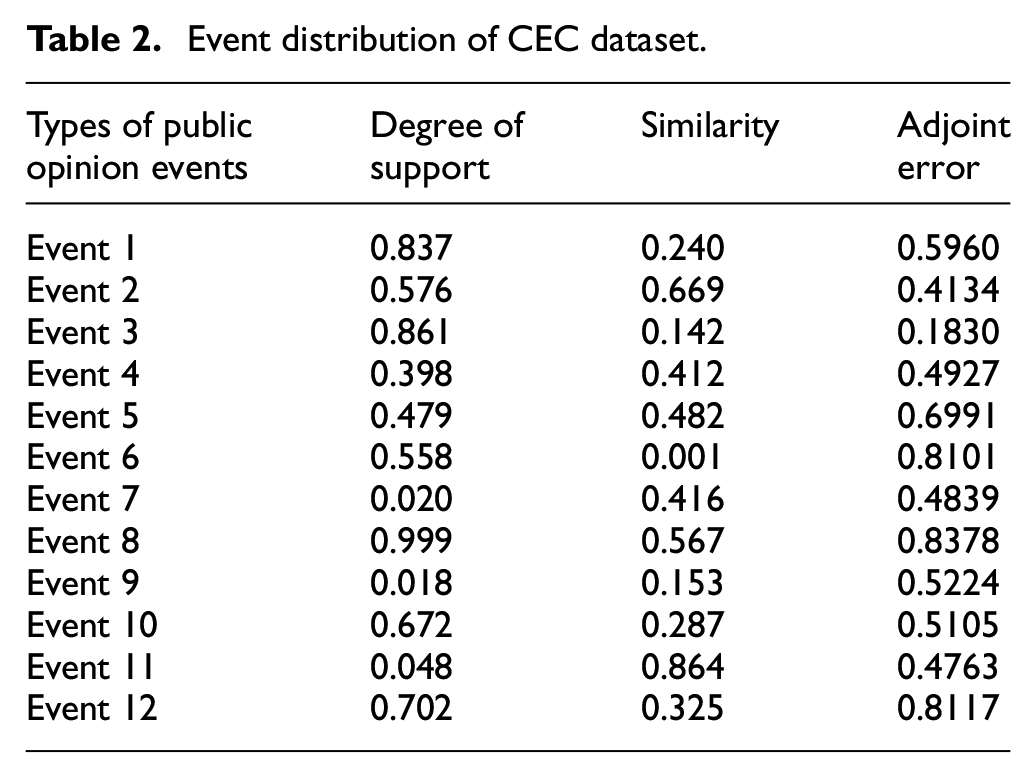
In the experiment, with the help of LabWindows/CVI and C/C++ development tools, it can realize the structure parameters design of the rational atlas of time series neural network and data collection. Conduct simulation experiments using Matlab 7 simulation software. The cloud resource storage platform based on Hadoop platform is designed. Relevant details of the experiment are introduced as follows: (1) Introduction to the data set. In this work, we use the CEC data set, which includes five types of emergencies: earthquake, fire, traffic accident, terrorist attack and food poisoning, with 332 news reports in total. CEC uses XML as the annotation format. The main data structures in the data include Event, Time, Location, Denoter, Participant, and Object, which respectively correspond to the event subject, event time, event trigger word, event participant, and event participant object. The data set also indicates the relationship between events in the same document, mainly including causal relationship and temporal relationship, and temporal relationship also includes accompanying relationship and fore and aft relationship. Tables 1 and 2 show specific data. In terms of data set division, we divided the CEC data set into training set, verification set and test set at a ratio of 7:2:1 after it is scrambled.
Event relation distribution of CEC dataset.
Event distribution of CEC dataset.
Analysis of experimental results
According to the above simulation parameter settings, in atomic event extraction, we use the BIO annotation method to label event trigger words and event arguments. B represents the first word at the beginning of a word, I represents other words excluding the first word, and O represents other words in the sentence that are neither trigger words nor arguments. We use the role of BIO symbols and words to complete the marking. For example, “At one o’clock yesterday afternoon, an Iveco vehicle with more than 20 passengers on the road near Zhuangtouyu Village collided with a farm vehicle pulling ore.” The tag of the trigger word “Collision” is “B-TriggerI-Trigger,” and the tag of the participating object “Iveco vehicle” is “B-Object I-Object I-Object I-Object.” Assuming that the fundamental frequency spectrum of public opinion monitoring data of social hot events is 50 Hz, the modulation frequency is 10 Hz, and the threshold is
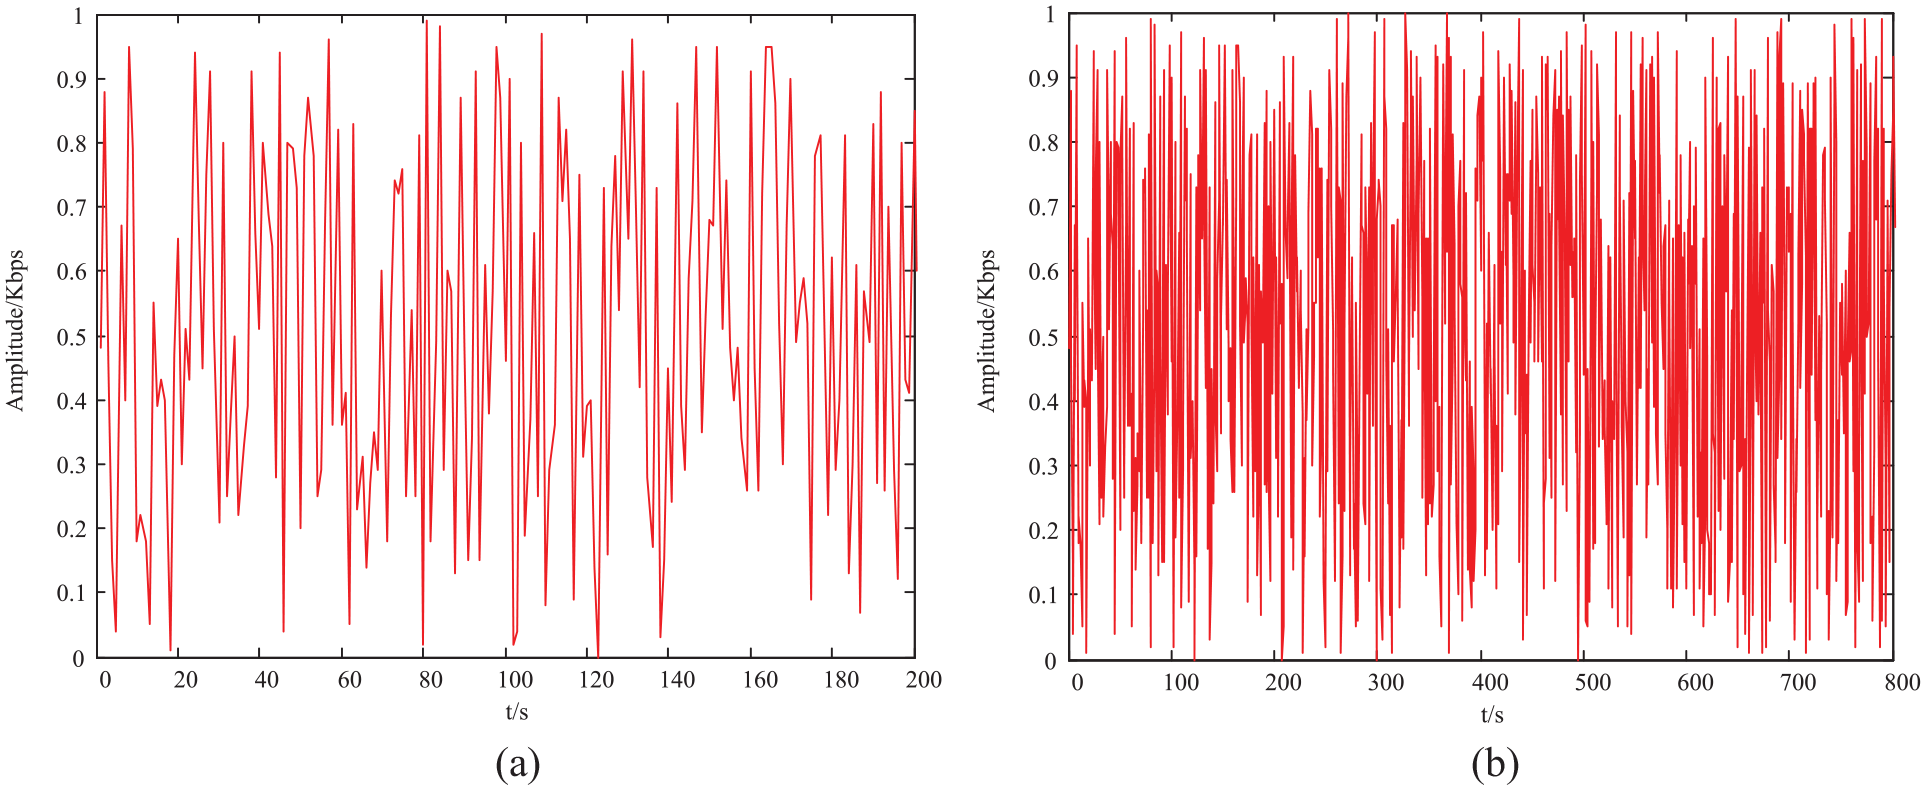
Time series of public opinion on social hot events: (a) test data and (b) training data.
According to the sampling results of the above test training set, we selected the basic version of BERT model in the experiment. The pre training model trained by HuggingFace1 is used to complete the task of event extraction and event relationship extraction as a downstream task. In terms of optimization methods, the improved Adam optimization method is selected. The distribution results of the event map of the data obtained by using the event map construction and three-tier empirical mode decomposition are shown in Figure 5.
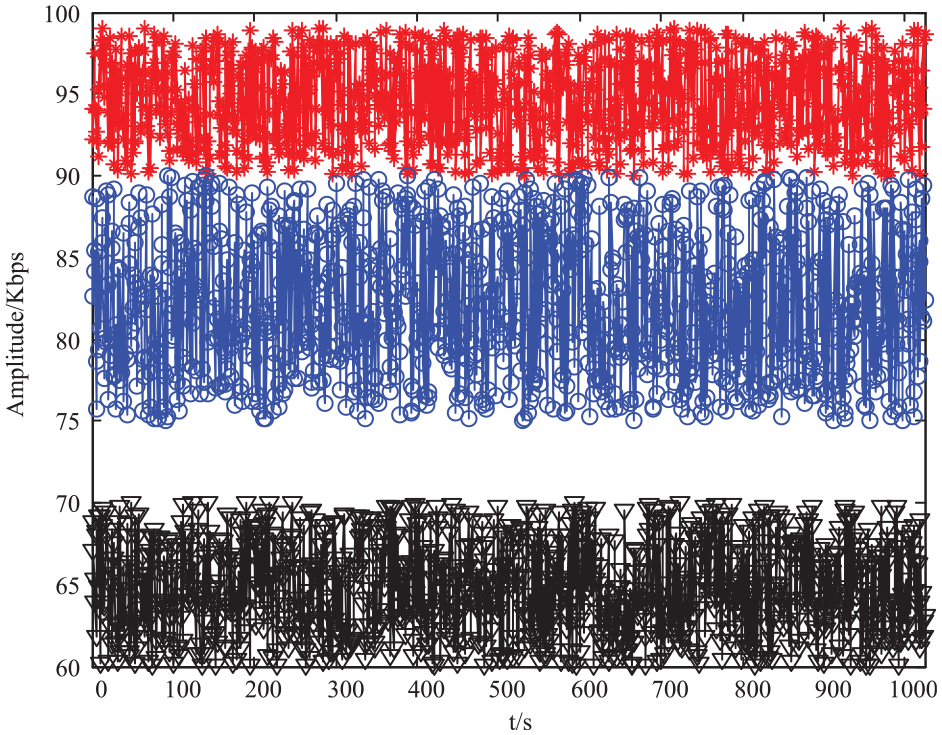
Distribution of public opinion monitoring rational atlas.
The experimental results show that the event recognition results based on pre training language model and conditional random field model have a certain recognition effect. Among them, the effect of trigger word recognition is the best, while the effect of argument recognition is slightly inferior to that of trigger word recognition. The main reason may be that trigger words are generally verbs or nouns and are more regular, while argument roles are generally adjective phrases and more irregular, and not every atomic event contains the arguments of all roles. During argument recognition, the model needs to automatically find the location of the trigger word and identify the corresponding argument of the atomic event corresponding to the trigger word under the same document input, which also increases the difficulty of argument recognition.
To further enhance performance, further testing was conducted using storage cost as an indicator, and the results are shown in the following figure. Analyzing Figure 6, it can be seen that the method designed in the paper can achieve cost reduction and help improve data throughput.
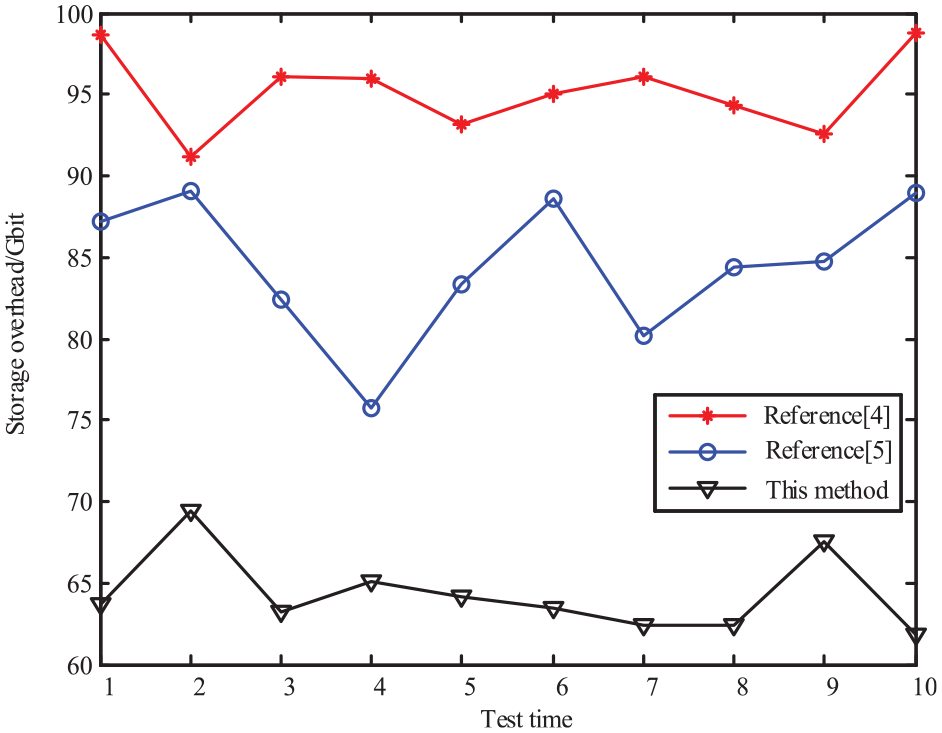
Quantitative analysis of storage performance comparison.
Analyzing Figure 6, it can be seen that the average storage cost of the method in Chen et al. 4 is 95Gbit, the average storage cost of the method in Sun et al. 5 is 82Gbit, and the average storage cost of the method designed in this paper is 65Gbit.
Further comparing the performance of various methods, using accuracy, precision, recall, and F1 score as indicators, the results obtained are shown in Table 3:
Performance comparison analysis.
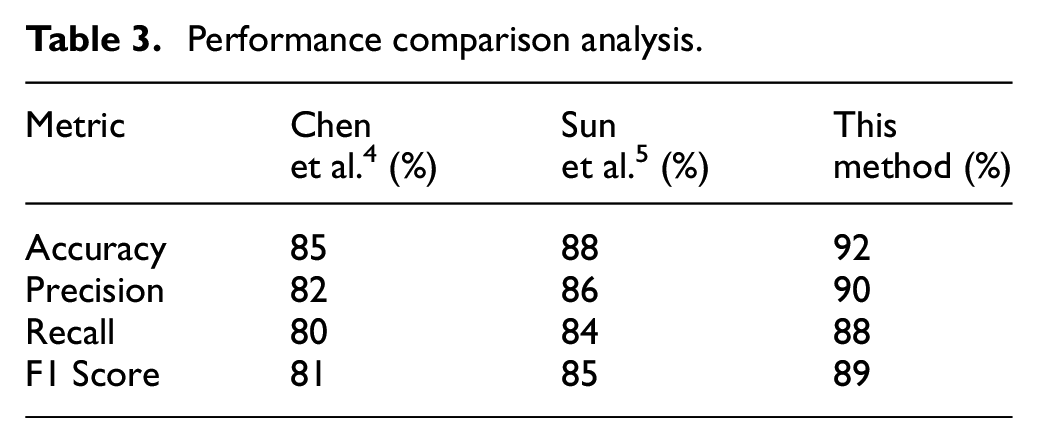
In this experimental result, it can be observed that the proposed method in this paper outperforms both Chen et al. 4 and Sun et al. 5 in terms of Accuracy, Precision, Recall, and F1 Score, as indicated by the boldface numbers. This demonstrates the superiority of the method proposed in this paper.
The method designed in this article exhibits significant advantages in storage performance and recognition accuracy. In terms of storage overhead, by optimizing the data storage mechanism, our method reduces the average storage overhead to 65 Gbit, which is 30% and 20% lower than Chen et al. 4 and Sun et al. 5 ,respectively, effectively saving storage space and improving data processing efficiency. In terms of recognition accuracy, our method achieved an accuracy of up to 92% through advanced feature extraction and fusion techniques, which is 7% and 4% higher than those in Chen et al. 4 and Sun et al. 5 ,respectively. In addition, this method also improves generalization ability and robustness through algorithm optimization, making it more advantageous in handling complex and ever-changing event relationships. These advantages make the method proposed in this article more competitive in handling large-scale complex event relationship recognition tasks, providing strong support for research and application in related fields.
Conclusion
The proposed two-layer event mapping model exhibits significant advantages in analyzing social hotspot events. Firstly, the precise extraction and relationship identification of atomic events, achieved through BERT and Conditional Random Fields, lay a solid foundation for constructing event maps. Secondly, the effective fusion of atomic event maps using graph neural networks and rules provides comprehensive and accurate data support for public opinion event analysis. Additionally, the extraction of public opinion monitoring data features through time series neural networks and empirical mode decomposition, expanding the CEC dataset, further validates the effectiveness of our approach. These advantages make our model uniquely valuable in the field of social hotspot event analysis.
Footnotes
Declaration of conflicting interests
The author(s) declared no potential conflicts of interest with respect to the research, authorship, and/or publication of this article.
Funding
The author(s) received no financial support for the research, authorship, and/or publication of this article.
Data availability statement
Data sharing not applicable to this article as no datasets were generated or analyzed during the current study.