
Abstract
5MW wind turbine gearbox high-speed bearing temperature rise failure is one of the important factors affecting the stable operation of the wind turbine, accurate prediction and timely diagnosis can effectively improve the efficiency of the wind turbine. In this paper, a combined modelling wind turbine gearbox high-speed bearing temperature rise prediction method based on Bayesian-LightGBM and improved PSO-SVM is proposed with a 5 MW wind turbine as the research object. Firstly, the initial dimensionality reduction of SCADA data is performed by sparse random projection matrix, which reduces the redundant data. Secondly, feature selection is performed on the remaining data using Bayesian-LightGBM to identify 13 key input feature parameters. Then, the hyperparameters of the PSO algorithm are optimised using Bayesian algorithm and further, the optimised PSO algorithm is applied to identify the SVM parameters. Finally, a simulation experiment platform is established based on MATLAB to verify the temperature rise of high-speed bearings in gearboxes of wind turbines by example calculation and comparative analysis. The results show that the model established in this paper is effective, the prediction results are accurate and the performance is stable, and then compared with the algorithms such as PSO-SVM, SVM, BP, etc, the coefficient of determination of the algorithm is greater than 0.994 in both the training set and the test set, and the average decision percentage error is around 1.88% in both.
Introduction
The 5 MW wind turbine generator (WTG) is a key piece of equipment more commonly used in wind power technology to capture wind energy and convert it into electricity. It generally consists of blades, drive shafts, gearboxes, generators, etc.1,2 The WTG gearbox is a key component of the wind turbine transmission chain, and its reliable stability is a guarantee for the safe operation of the WTG. 3 It is the key component of the wind turbine transmission chain. Literature 4 counted the component maintenance cost and downtime ratio of the whole system of wind turbine equipment for an offshore wind farm, as shown in Figures 1 and 2, respectively. As can be seen from the figures, the downtime caused by the gearbox accounts for more than 21% of the overall unscheduled downtime, and the maintenance cost accounts for more than 18% of the total maintenance cost. Therefore, the gearbox is a component that needs to be focused on in the troubleshooting of WTGs.
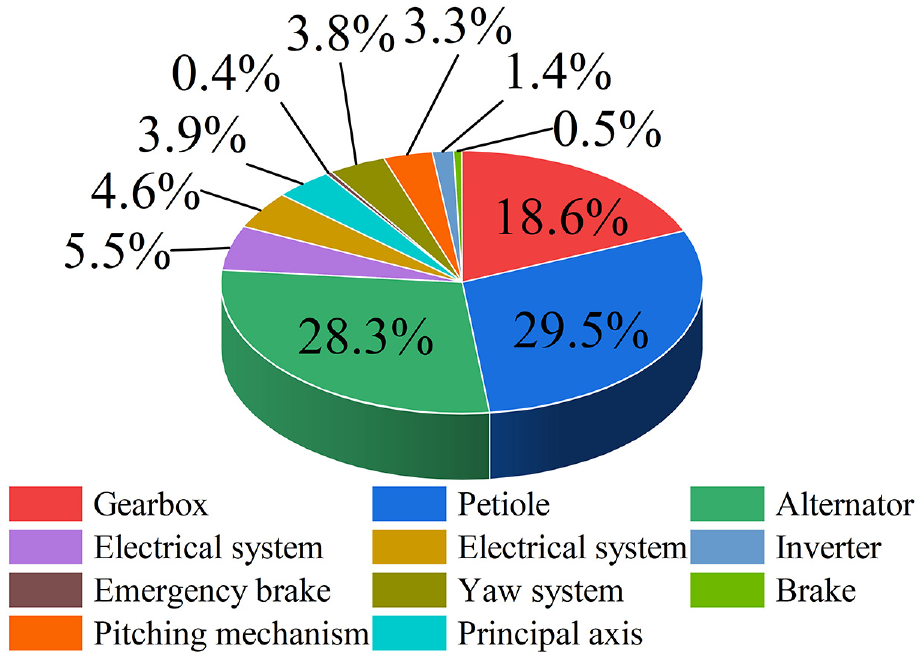
Ratio of maintenance costs of wind power equipment by component.
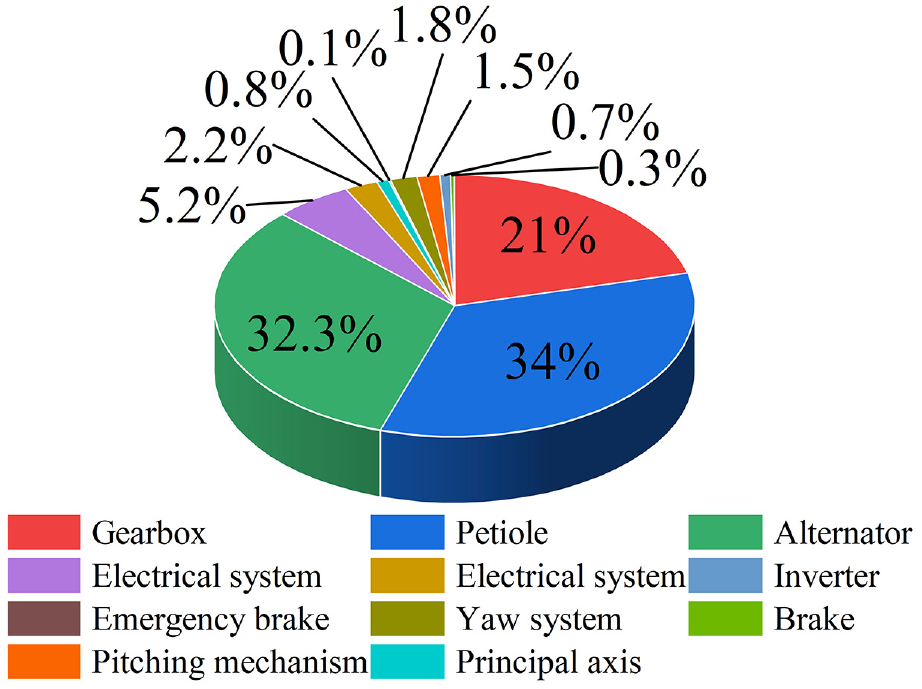
Ratio of downtime of wind turbine components.
A survey on the operation quality of wind power equipment nationwide by the Wind Energy Professional Committee of the China Renewable Energy Society points out that gearbox failure accounted for about 21%, which is because the gearbox of WTG has a harsh working condition, and is subjected to heavy load and time-varying impact for a long time, which leads to the continuous impact of the gearbox parts, and is relatively more prone to failure. 4 In the WTG, the high-speed bearing temperature rise failure is one of the very important failures, because the high-speed bearing bears the important task of supporting the high-speed rotating parts of the gearbox, once the high-speed bearing temperature rise failure will lead to unstable operation or even damage to the gearbox.
Most WTGs are generally installed in geographically complex areas, so if the gearbox high-speed bearings of the WTGs once a failure occurs, the repair costs required are expensive, overhaul and maintenance is also very difficult, and is prone to cause a lot of economic losses, coupled with the WTGs need to run for a long time of the special working mechanism, the load is large, so for the failure of WTGs to analyse the very necessary5–7! Literature 8 proposed the use of AGV algorithms in automated container terminals to achieve the use of intelligent algorithms to improve the efficiency of equipment operation. Similarly, the fault diagnosis of wind power generation can be automated and intelligently operated. The real-time monitoring and collection of operational data of WTGs failures are continuously improved, and these data directly or indirectly respond to the operational status of WTG components. Forecasting shifts the reactive maintenance of WTGs to proactive prevention, which reduces the maintenance costs of WTGs by a significant amount. The literature 9 has given us a lot of inspiration through the treatment of the effect of different factors on the variation of EEOI and the application of the key factors in determining the energy efficiency of ships as a whole. Literature 10 considering the rotation angle of the vessel and constructing a more complex feature extraction mechanism, the RYM model significantly improves the accuracy and efficiency of vessel detection in marine videos. Similarly, in this paper, we will consider the unit operating parameters in a holistic manner so as to improve the accuracy of temperature rise fault diagnosis of high-speed bearings in wind turbine gearboxes as much as possible. Supervisory Control and Data Acquisition (SCADA) system records key parameters such as electrical quantity, temperature, pressure and vibration during the operation of the unit with minute resolution, such as unit output power, rotor speed, wind speed, bearing temperature, winding temperature, gearbox oil temperature, etc., which contains a wealth of operational information.11–14 As a result, there will be difficulties in predicting certain single components, which will have an impact on the accuracy of the prediction. 15 Based on this, this paper adopts a combined model approach based on the operating data of WTG to work on the temperature rise fault diagnosis of the high-speed bearings of the gearbox of a 5 MW WTG.
The fault feature extraction method is based on signal analysis theory, which improves the accuracy of subsequent model training by extracting the effective feature information of the original signal. Therefore, processing the raw signal is one of the key links in fault diagnosis. 16 Scholars at home and abroad have carried out a lot of research on this problem and proposed many methods, which provide directions for the writing of this article. Literature 17 proposed a generalised regression neural network based integration of single interpolation algorithm, principal component analysis and wavelet based probability density function method applied to the condition monitoring of wind turbine blades, which is able to detect the blade faults of WTGs in advance. Literature 18 used Neighbourhood Component Analysis as a feature selection technique to select suitable input features to predict the oil temperature with gearbox oil temperature as the target attribute and achieved high accuracy. Literature 19 proposed a new method based on the sliding window compressible Gramian Angular Field (GAF) transform based on the distance features of the GAF image matrix is used to solve the problem of diagnosing and classifying the faults of rolling bearings and gears in gearboxes. The method converts one-dimensional fault signals into two-dimensional feature matrices, and constructs the discriminant matrix for each fault category by establishing the average value of the a priori sample feature matrix. Literature 20 firstly extracted the low-dimensional fault data by using the preprocessing method of principal component analysis; then, the parameters of the support vector machine model were optimised by using the Grid Search Algorithm (GSA), and the extracted low-dimensional fault features were used as inputs for the training of the model of the support vector machine, and then finally the feature Classification; Literature 21 used a grey correlation algorithm to extract the feature vectors of the monitoring data. The parameters of the support vector regression model were optimised using genetic algorithm and cross-validation method, and the faults were predicted with high accuracy. Literature 22 proposed to filter the feature vectors related to the target according to the ReliefF algorithm as the input dataset of the model; to take the fault-related features as the classification features in the classification algorithm, and to take the different states in the turbine operation (normal or specific fault types) as the classification labels, so as to establish the classification dataset, and to construct the multi-classification turbine fault diagnostic model based on XGBoost; and to compare the model with the SVM-based classification model and AdaBoost classification model for comparison, and the experimental results show that the algorithm has higher diagnosis accuracy. Literature 23 proposed to improve the artificial bee colony algorithm to optimise the Elman neural network method to solve the problem of scarce fault data in the wind farm is not enough to establish a model for training, the establishment of the gearbox temperature model, through the comparison with the actual value of the curve, to get the residuals for analysis, and the establishment of the fault diagnosis model for the gearbox. Literature 24 determined the ship engine type by performing data cleaning, interpolation and multi-data fusion on the data provided by the AIS
For regression prediction algorithms can be done mainly through decision trees, support vector machines, neural networks, etc. to predict and analyse the output features. Decision trees are divided into classification trees and regression trees, where classification trees represent discrete variables and regression trees correspond to continuous variables. Random forest is a smarter integrated learning algorithm based on decision trees. Literature 25 proposed an improved Random Forest algorithm to solve the problem of small differences among the decision trees in Random Forest, which utilises the classification of decision trees with different weights, and the model is used to diagnose the motor bearings, however, it needs to be validated for the features introduced under variable operating conditions. Literature 26 proposed a fault diagnosis model based on the deep forest algorithm, which achieves good diagnostic results under different working conditions. However, the training time is significantly increased compared to algorithms such as random forest. The decision tree algorithm can handle both data classification and regression prediction tasks. Literature 27 proposed a Bayesian optimised long and short term memory neural network for windward and fault warning method, which optimised the hyperparameters of the neural network through Bayesian optimisation, resulting in an improvement of fault warning by 4 h, but further elaboration is needed on how to achieve the fusion of vibration information and multivariate information. Literature 28 proposed a fault diagnosis algorithm based on improved radial basis neural network, which has high accuracy under fluctuating operating conditions. Literature 29 proposed a clustering analysis based on small batch superior k-mean algorithm to achieve the analysis of massive users’ electricity consumption behaviour mining. Literature 30 introduced the weight vector into the weight calculation on top of the traditional Gaussian mixture model, and the algorithm can identify clusters in different subspaces in the high-dimensional space, which further enhances the performance of the Gaussian mixture model clustering algorithm, but the improvement of the Gaussian mixture clustering model needs to be further explored for the application scenarios in data mining in industrial fields. Literature 31 proposed a density peak clustering algorithm, which firstly applies the density peak algorithm to cluster the measured data of wind turbines to achieve data grouping; secondly, according to the clustering results, the wind speed is predicted by using the LSTM neural network model; and finally, the accuracy and effectiveness of the proposed algorithm is verified by the experimental results. However, the truncation distance in the peak density algorithm is easily affected by human subjective selection factors, and the complexity of local density calculation is high. Literature 32 proposed a line loss rate estimation method based on mean drift clustering and improved BP neural network to classify the sample data, and then the line loss rate is calculated and validated by example using an improved BP neural network model for each class of data.
Based on this, this paper attempts to combine the Bayesian-LightGBM model with the improved PSO-SVM regression prediction model. The Bayesian-LightGBM model takes full advantage of the auto-tuning of the Bayesian algorithm and the LightGBM in terms of training speed. The improved PSO-SVM model exploits the superiority of SVM in handling high-dimensional data and the strong generalisation ability and robustness of the improved PSO-SVM model. The combination of the above algorithms thus overcomes the redundancy of the feature dataset and the problems of high-dimensional data and nonlinear relationships, focuses on the key points of hyper-parameter tuning, feature engineering, and integrated learning, and tries to propose a solution to address the temperature rise fault diagnosis of high-speed bearings in the gearbox of a 5 MW wind turbine. In summary, this paper proposes a prediction method for the combined model of the high-speed bearing temperature rise of the gearbox of the wind turbine by taking the operation data of the 5 MW wind turbine as an experimental object. The algorithmic model improves the correlation between data feature parameters, reduces the redundancy of the original feature dataset, and improves the accuracy of temperature rise prediction for high-speed bearings. The combined modelling approach is designed as a model for predicting the temperature rise of high-speed bearings in gearboxes based on the operational data of 5 MW wind turbines. The issues of how to effectively select relevant data for fault warning data mining and improve the accuracy of fault warning are practical problems faced in the modelling process of high-speed bearing temperature rise prediction for wind turbine gearboxes. Therefore, this paper proposes a combined modelling approach based on Bayesian-LightGBM and improved PSO-SVM for predicting the temperature rise of high-speed bearings in gearboxes of wind turbines, which are: sparse random projection matrix feature dimensionality reduction, Bayesian-based optimised LightGBM feature visual analysis, and prediction of temperature rise based on the Bayesian-PSO-SVM algorithm that correspond to solving the problems that need to be studied in the modelling of wind turbine failure warning.
The innovation is reflected in the following aspects: (1). on the one hand, it lies in the fact that by firstly using sparse matrix projection to reduce the dimensionality of features for feature engineering, and then combining with Bayesian-Lightgbm to select the appropriate feature parameters, it makes full use of the advantages of feature engineering and hyper-parameter optimisation, which improves the model’s performance and generalisation ability. (2). On the other hand, this paper integrates different machine learning algorithms, in this paper, Bayesian-PSO-SVM is used as the final prediction model, which combines different algorithms such as Bayesian Optimisation, Particle Swarm Optimisation, and Support Vector Machines, and this prediction algorithm improves the robustness and prediction accuracy of the model.
The structure of this paper is shown as follows: Section 2 introduces sparse random matrix projection, Bayesian algorithm, LightGBM model, PSO algorithm and SVM algorithm. Section 3 describes the Bayesian algorithm optimisation of LightGBM model and PSO algorithm, PSO optimisation of SVM. Section 4 describes the preprocessing operation on raw data of 5 MW WTG, example simulation analysis, prediction of temperature rise of high-speed bearing of WTG gearbox by feature parameters under Bayesian-PSO-SVM algorithm, analysis and comparison of predicted data. Section 5 draws the conclusion of this paper. Figure 3 below shows the structure sketch of the experimental process of this paper.
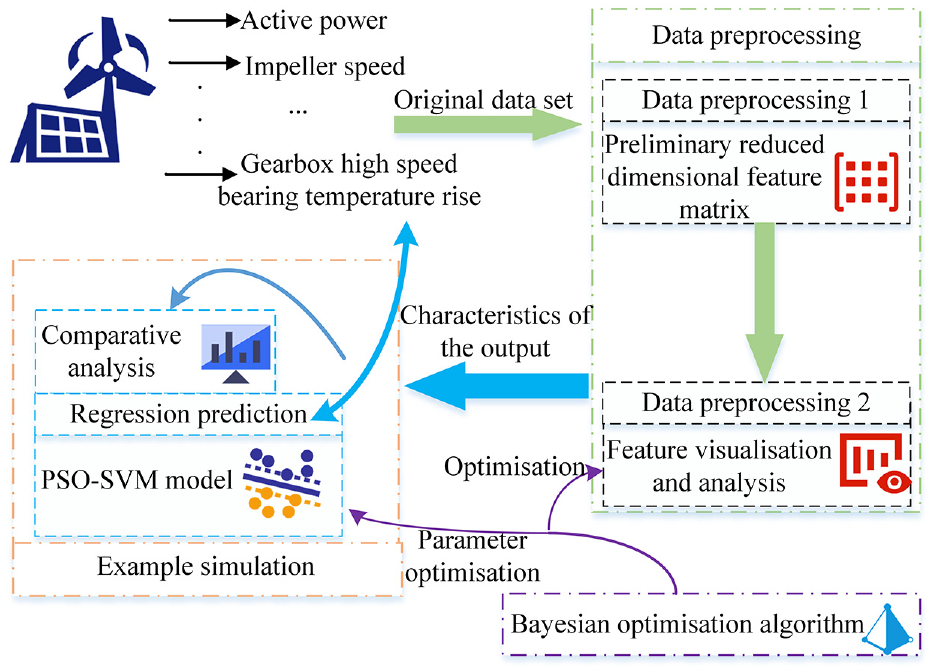
Layout sketch of the structure of this paper.
Fundamentals
Sparse random matrix projection
SCADA data from WTGs usually contains a large amount of time series data, which records the variations of various parameters such as wind speed, rotational speed, power output, and so on. This kind of data is usually high dimensional and sparse, so it is suitable for applying sparse random matrix projection for feature dimensionality reduction, and the distance relationship between the data is preserved as much as possible.
The specific computational steps for the sparse random matrix projection are as follows:
Initialising a sparse matrix: first, a sparse matrix A,
Then, the sparse matrix
This matrix multiplication is shown by equation (1):

where,
After several dimensionality reduction calculations, thus obtaining the subsequent required low-dimensional data points
Sparse random matrix projection is unsupervised algorithm, as an unsupervised algorithm, it has the advantage that it does not need the labelled target information, which is suitable for data processing in the case where the labelled information cannot be obtained or the labelled information is incomplete.
LightGBM decision tree
In the wind turbine operation data, there are a large number of input feature parameter sets, which need to be selected to improve the model effect. Light Gradient Boosting Machine (LightGBM) model has a strong feature selection ability, which is able to automatically select the important features and deal with the unimportant features. There is a close correlation between the feature preprocessing of wind turbine operation data and the LightGBM model, and modelling with LightGBM can better deal with some common problems in feature engineering, and improve the effect and prediction ability of the model.
LightGBM is a decision tree based Gradient Boosting Decision Tree (GBDT) model based on an integrated algorithm of decision trees.32,33 It is a novel integrated decision tree algorithm proposed by Ke et al.34,35 LightGBM is based on gradient-based unilateral sampling and independent feature merging for optimal processing of data. Gradient-based unilateral sampling is the information gain obtained by calculating the data instances of small gradient, which accelerates the calculation speed, and at the same time, it can reduce the information loss produced by the small gradient data. Independent feature merging is to merge the sparse features, thus reducing the data dimension and further improving the computational speed. Therefore, GBDT can be expressed as in equation (2):
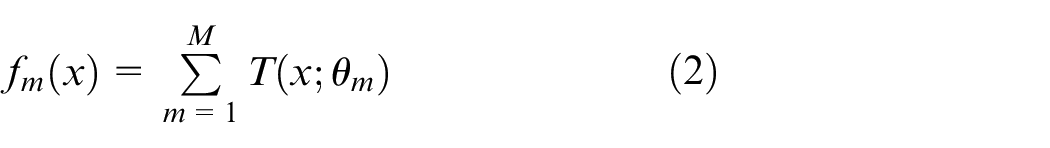
As shown in the formula,
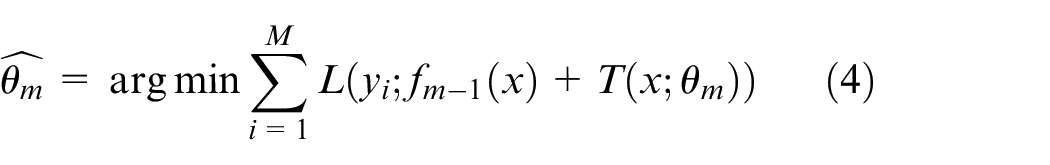
Based on the forward distribution algorithm, the GBDT model at step m can be expressed as:

It may be useful to let the loss function be
Multiple iterations are performed to update the regression tree and obtain the final model.
Bayesian optimisation theory
The application of Bayesian optimisation algorithms to the model can help to optimise the choice of hyperparameters for the model, thus improving the performance and generalisation of the model. 36 In the prediction of WTG data, Bayesian optimisation algorithms can help find the optimal combination of hyperparameters without trying a large number of different combinations to maximise the prediction accuracy and efficiency of the model. In the prediction of WTG data, accurate model predictions can help improve the efficiency and reliability of WTGs and reduce costs and maintenance fees. In addition, Bayesian optimisation algorithms can help to improve the robustness of the model, especially in the presence of noise or uncertainty in the WTG data. By optimising the model, it can be better adapted to the characteristics of the data and improve the accuracy and stability of the prediction. Therefore, the Bayesian optimisation algorithm has an important help and role in WTG data prediction.
Bayesian Optimised Theory is a probability-based global optimisation algorithm that obtains information through a black-box objective function
Bayesian optimisation is named after the Bayesian theory used in the process as in equation (5):
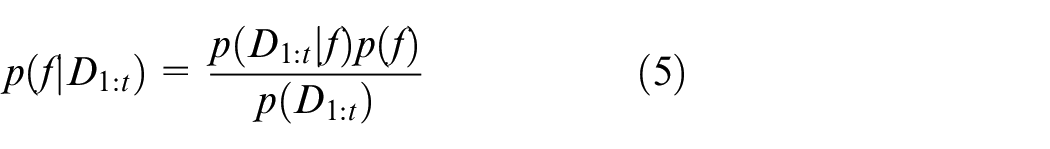
where
Support vector machine algorithm
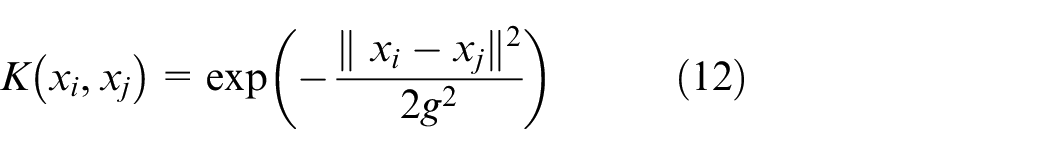
Support vector machine (SVM) regression algorithms can deal with nonlinear relationships, 38 however, wind turbine is a large and complex system containing multiple nonlinear links, such as wind speed, wind direction, blade angle, rotational speed and other factors interacting with each other, and there are many unknown and complex relationships. In this complex environment, traditional linear models may not be able to accurately capture the complex dynamic characteristics and nonlinear relationships of the system. The SVM regression algorithm can map the data into a high-dimensional space through the kernel trick to build a more flexible and accurate prediction model in the nonlinear case. Therefore, for the complex wind turbine prediction problem, the SVM regression algorithm has certain applicability, which can better deal with the system complexity and nonlinear relationship, and improve the prediction accuracy and generalisation ability. The SVM model using the kernel function can map the nonlinear problem into the high-dimensional space for processing. Secondly, the SVM regression algorithm is robust to noise and outliers in the data and can provide better prediction results. In the prediction of WTGs, there may be some abnormal data, and the SVM algorithm can effectively deal with these cases. SVM is a machine learning algorithm proposed by Vapnik. 39 The goal of the SVM algorithm is to obtain an optimal classification hyperplane such that the sum of the distances from so positively classified points to the hyperplane and from so negatively classified points to the hyperplane is maximised.40–42
The optimal classification hyperplane searched by SVM is shown in Figure 4 as an example for a binary classification problem.
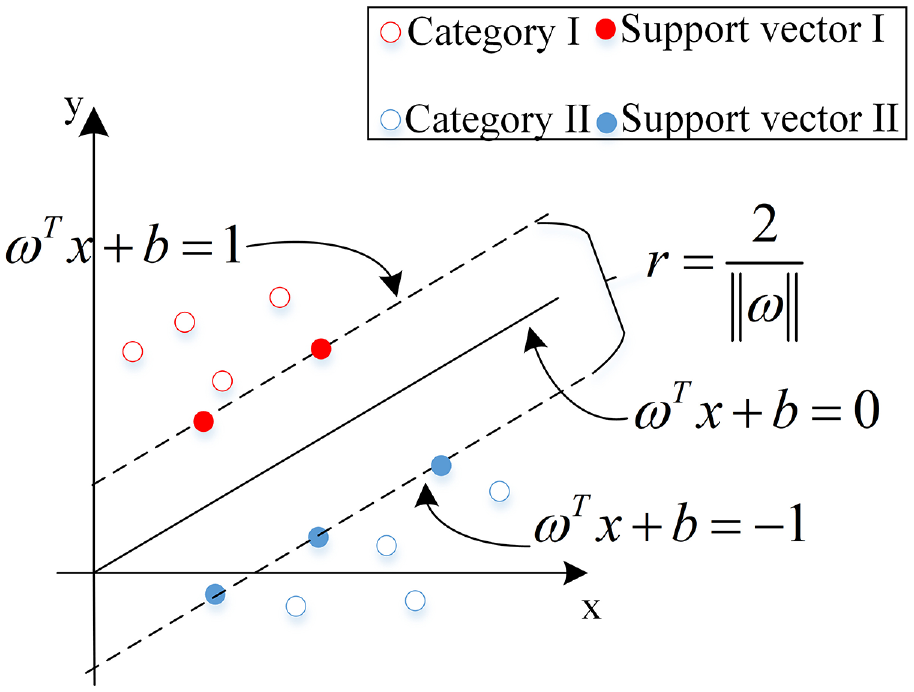
Schematic diagram of support vector machine binary classification.
And when the sample data is linearly indivisible, the essence of SVM is to construct a hyperplane that maps to a higher dimensional plane making it possible to find that hyperplane in the higher dimensional plane. The finding of hyperplane is shown below.
The vast majority of the data is linearly indistinguishable, so we need to map in brand new coefficients, at which point the constraints turn out to be:

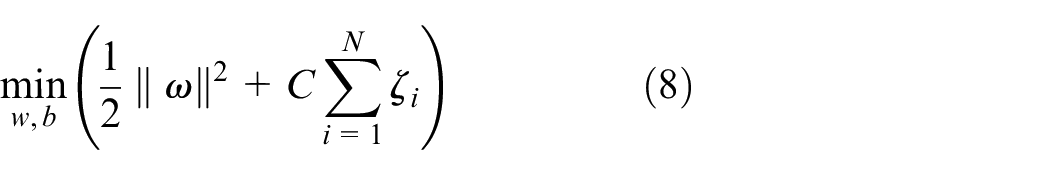
The objective function is:
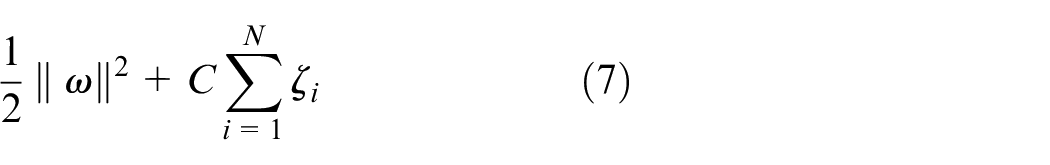
The SVM optimisation problem at this point is:

where
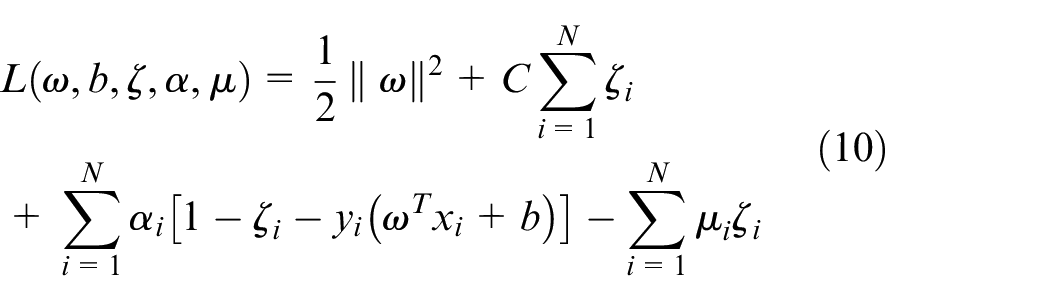
Thus the dual of the optimisation problem can be obtained as:
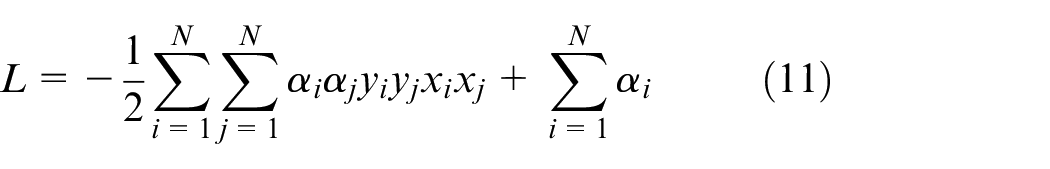
Among them,
PSO optimisation algorithm
The PSO algorithm can help optimise the parameter selection of the SVM algorithm when predicting the temperature rise value of high-speed bearings of wind turbine gearboxes, in order to improve the prediction accuracy and generalisation ability. The PSO algorithm can improve the prediction performance by improving the parameters of the SVM algorithm so that the model is better adapted to the characteristics of the wind power data. In addition, the PSO algorithm can help the SVM algorithm to overcome the problem of local optimal solution, so as to improve the stability and robustness of prediction. Therefore, the PSO algorithm can play a role in optimising and improving the model in wind power data prediction, and improve the prediction accuracy of the temperature rise value of high-speed bearings of wind turbine gearboxes.
The PSO Algorithm is based on the observation of the activity behaviour of animal clusters, using the sharing of information by individuals in the group to make the movement of the whole group in the problem solving space to produce disordered to ordered evolution, to obtain the optimal solution. It may be assumed that in the D-dimensional search space, a group of particle swarms consisting of
where
In the search space, the velocity of the particle is iteratively represented as:
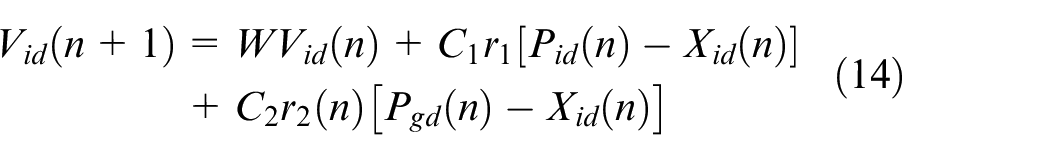
The position of the particle is iteratively represented as:

In equations (14) and (15),
Bayesian-LightGBM and improved PSO-SVM model
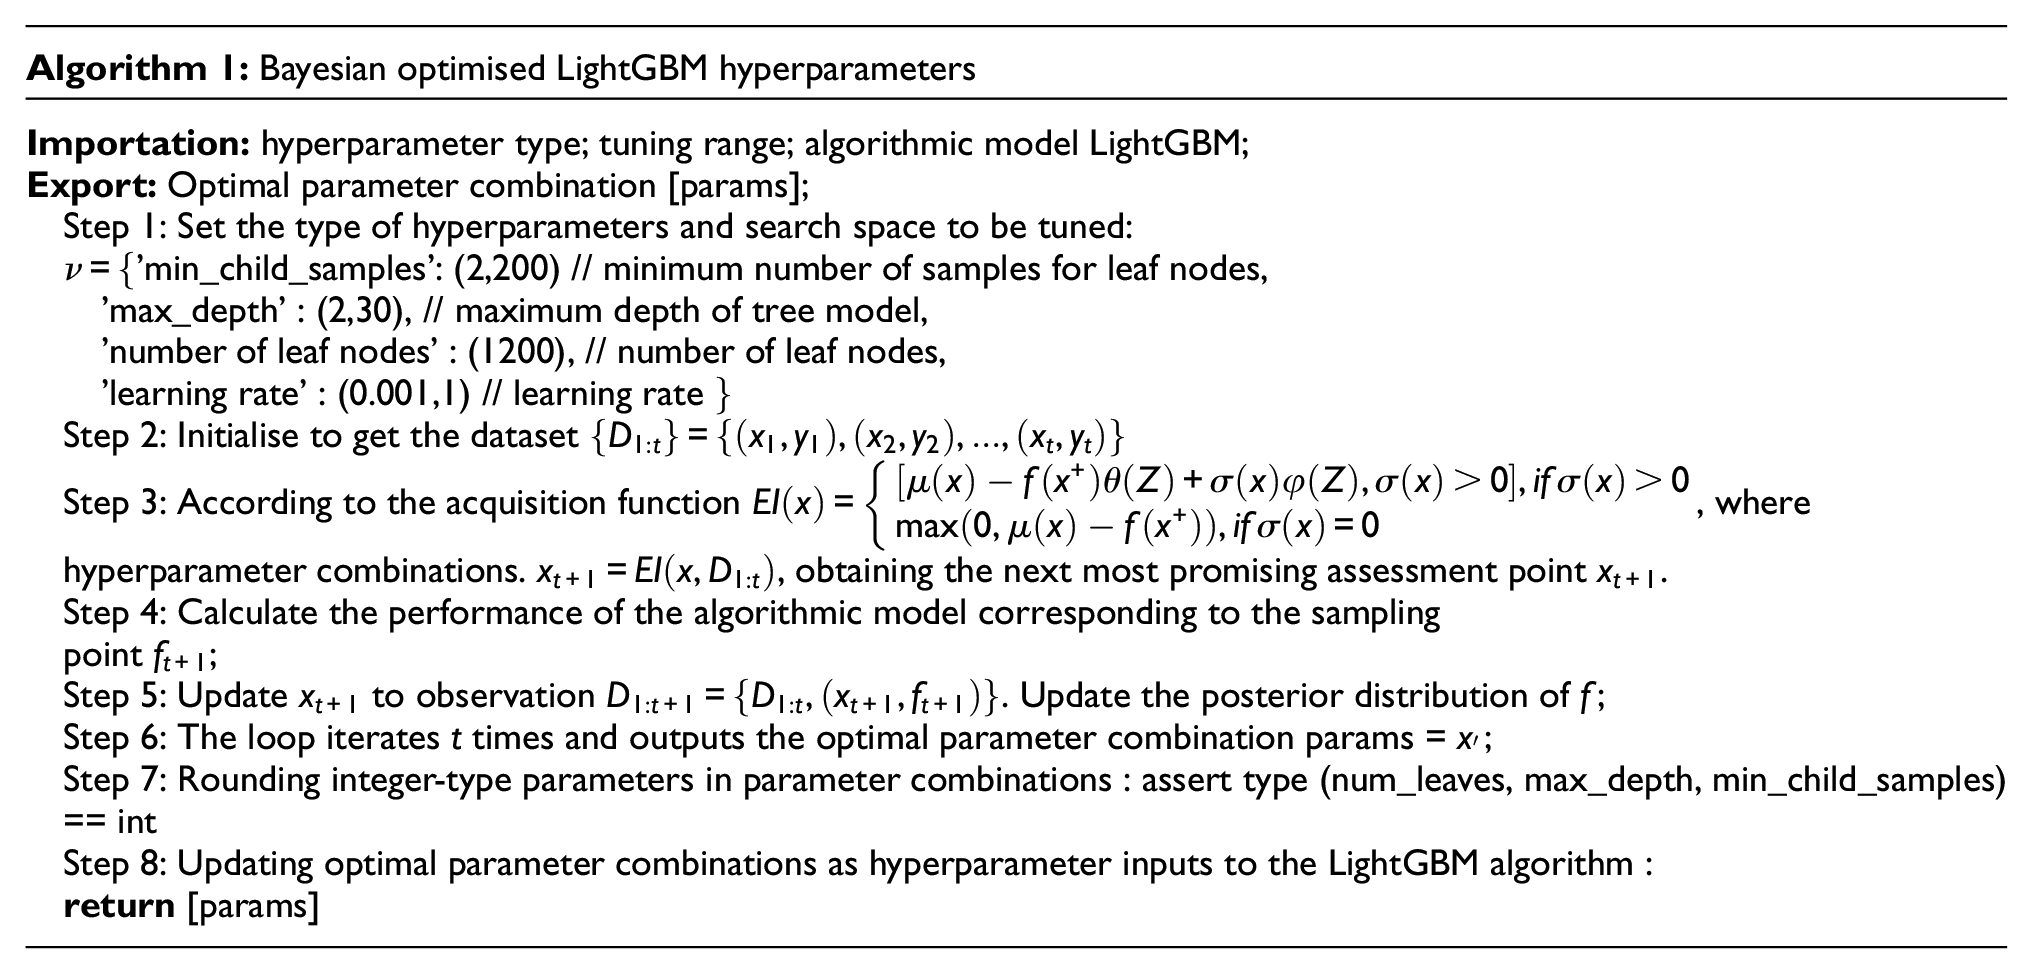
As mentioned earlier, Bayesian algorithm has the ability of hyperparameter optimisation, adaptive tuning and robustness, while PSO algorithm has the ability of global fuzzy search. While the SVM algorithm is difficult to process in high dimensional data and is easily affected by dimensional catastrophe, the PSO algorithm can search the hyperparameter space more efficiently and improve the processing ability of the model. Bayesian algorithm can also help PSO algorithm to reduce the difficulty of manually setting parameters and improve the ability of global search. Bayesian algorithm can also be useful for the LightGBM model to speed up the the process of model training and adjusting the parameters. Figure 5 shows the technology roadmap of the fault diagnosis algorithm model in this paper. The Bayesian optimisation LightGBM hyperparameter pseudocode is shown in Algorithm 1.
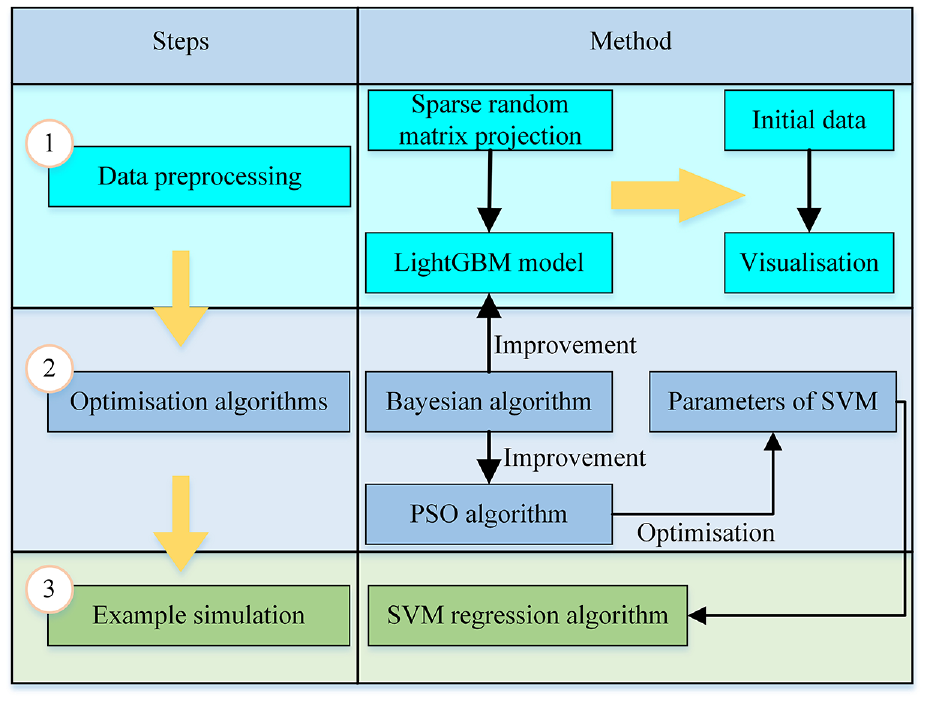
Technology roadmap.
Bayesian improvement for LightGBM
Substituting the training set data into the LightGBM model training, a set of hyperparameters will be randomly generated, while the Bayesian optimisation algorithm will continuously train and adjust the hyperparameters to get the optimal hyperparameter combination, and the optimal hyperparameters will be imported into the model to get the Bayesian-LightGBM model.
The specific steps are as follows:
Step 1. Randomly generate a set of hyper-parametric models thereby calculating the loss function, which will be used as the observation point.
Step 2. Obtain different confidence intervals by observation points and Gaussian process.
Step 3. Calculate the probability density estimate from the acquisition function, set the maximum confidence to the new hyperparameters, and return to model training.
Step 4. Importing optimal hyperparameters into LightGBM, thus obtaining the improved Bayesian-LightGBM model.
The flowchart is shown in Figure 6.
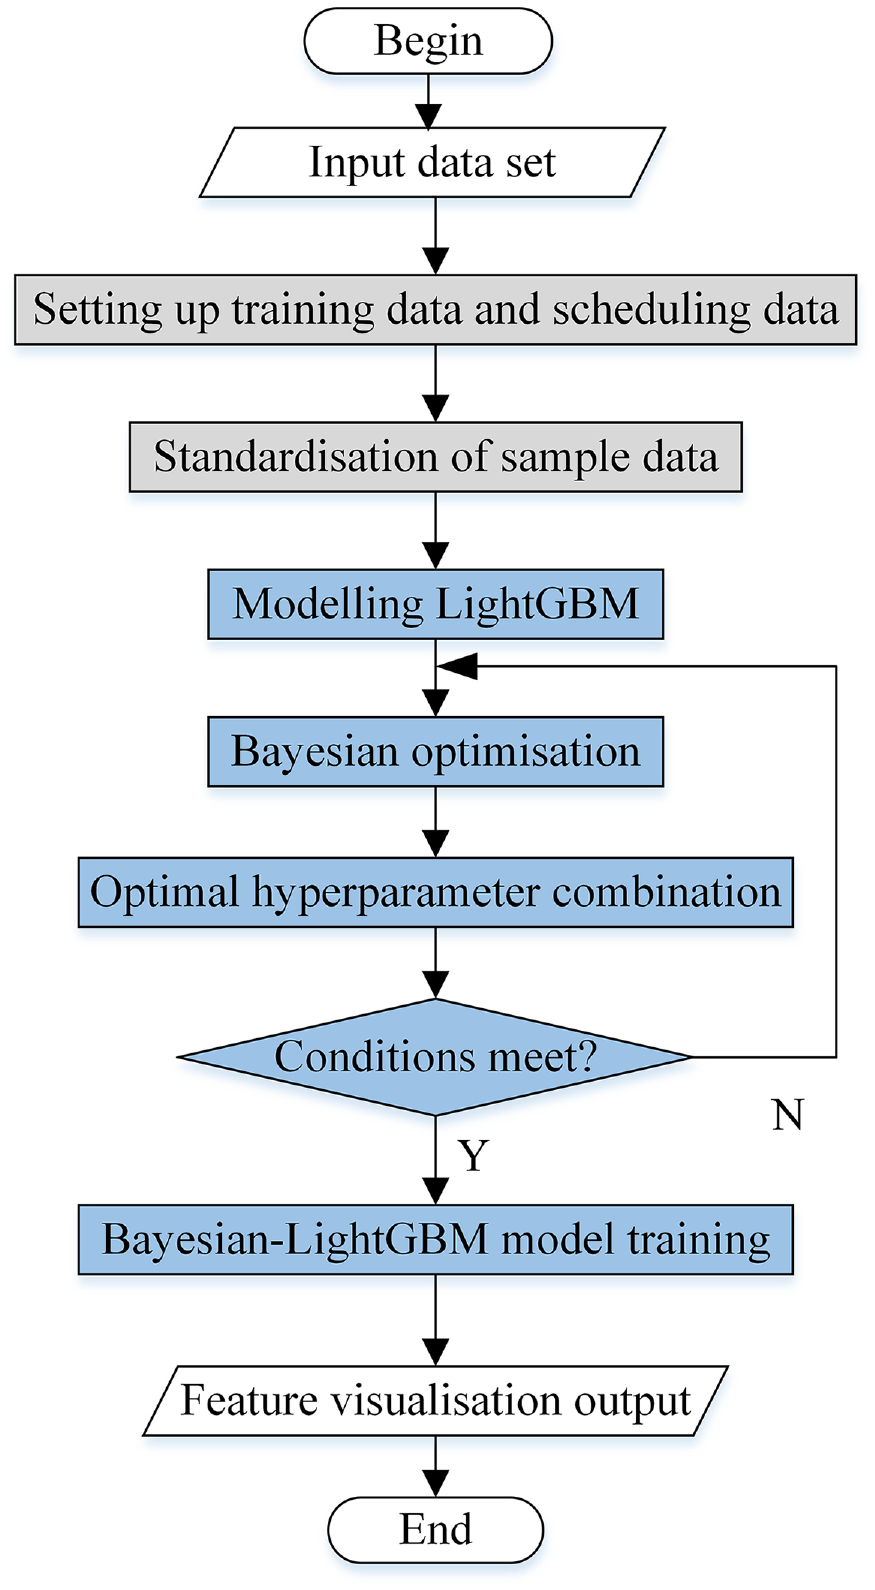
Flowchart of Bayesian-LightGBM model.
Bayesian improvement of PSO hyperparameters
When using traditional PSO algorithms to solve some problems, the initial particles of PSO algorithms are randomly generated, thus leading to uneven distribution of the initial particles in the space, which makes it difficult to discover the optimal location.
(1) Learning factors
The learning factors
(2) Inertia weights
The inertia weight
(3) Maximum number of iterations
The maximum number of iterations maxgen represents the total number of updates performed by the PSO algorithm, which affects the convergence speed of the PSO algorithm and the final optimisation results. If it is too large, it will make the PSO algorithm run too long and produce an overfitting effect, which is too poor in the test set; on the contrary, it may make the PSO algorithm stop iterating before finding the optimal solution, and fail to find the optimal solution, which will result in a decrease in accuracy.
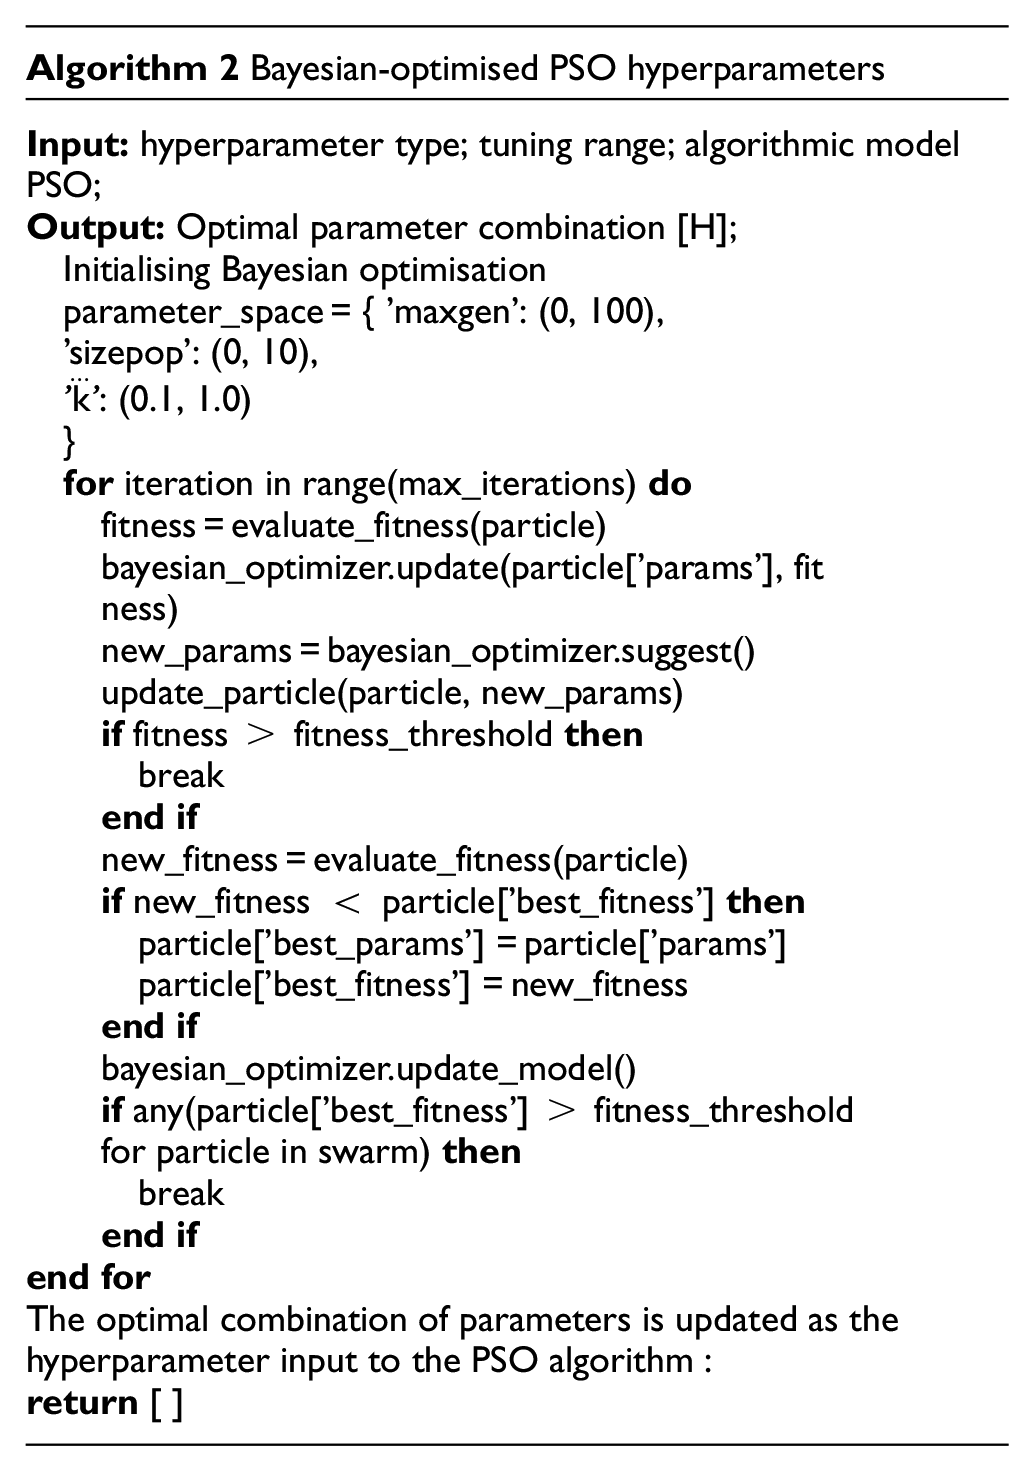
Therefore the choice was made to optimise the hyperparameters of the PSO (which included learning factors etc.) using a Bayesian algorithm. The Bayesian optimisation PSO hyperparameter pseudo-code is shown in Algorithm 2.
The steps of Bayesian algorithm to optimise the hyperparameters of PSO algorithm are as follows:
Step 1. Randomly initialise the position and velocity of the particles.
Step 2. Calculate the fitness value of the particle based on the current position.
Step 3. Update the individual best position and group best position for each particle.
Step 4. Adjust the parameters such as inertia weights, acceleration coefficients, etc. according to the Bayesian algorithm.
Step 5. Update the velocity and position of the particle according to the new parameter values.
Step 6. Determine whether the number of iterations is satisfied, if yes, then end the algorithm, otherwise, continue to iterate.
Step 7. Return the found optimal solution.
Figure 7 shows the flowchart of Bayesian optimisation of PSO parameters.
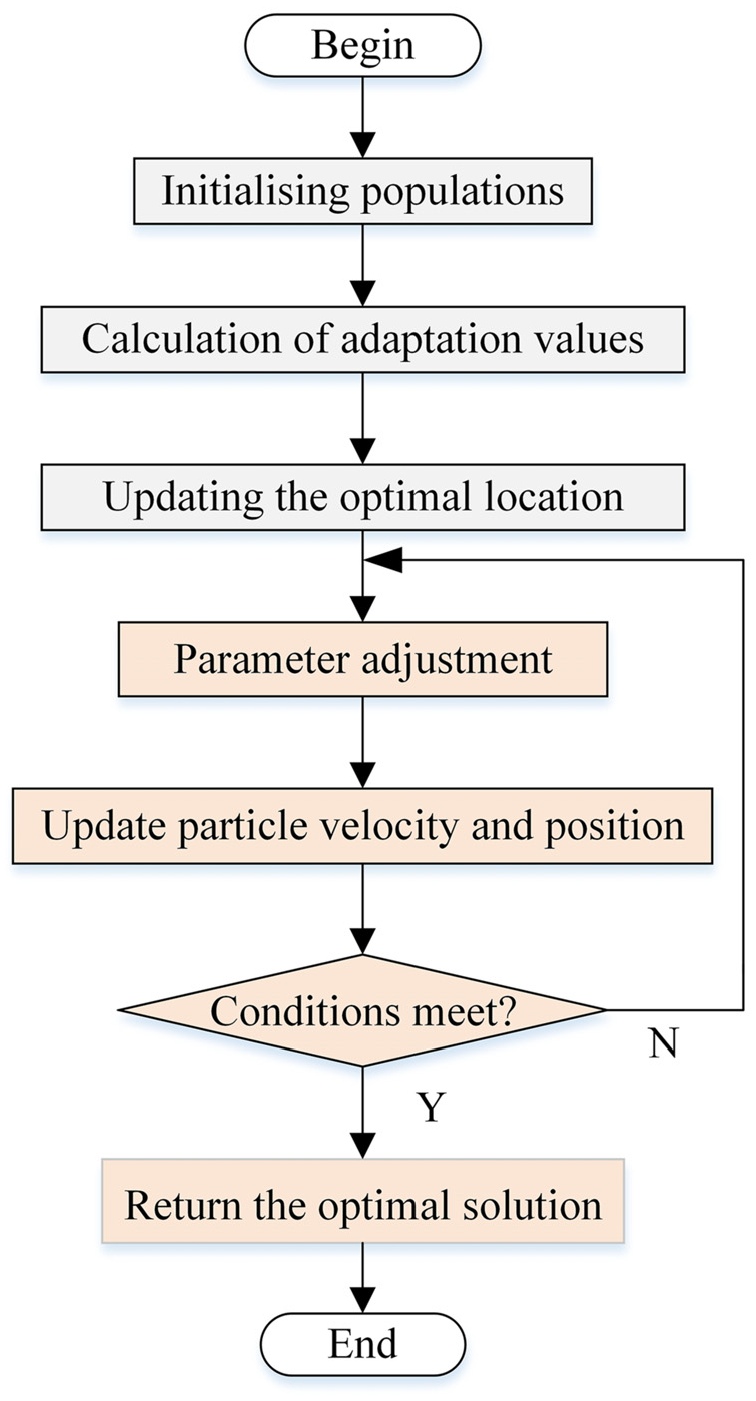
Flowchart of Bayesian improvement of PSO parameters.
PSO improvement of SVM hyperparameters
PSO-SVM is a method to optimise SVM based on PSO algorithm. When using support vector machine algorithm to solve related classification or regression problems, there will be optimisation problems of two model parameters, the kernel function parameter
PSO improves the SVM parameters in the following steps:
Step 1. Randomly initialise the position and velocity of the particles.
Step 2. Convert particle positions to SVM model parameters.
Step 3. Calculate the fitness value (SVM model performance metric).
Step 4. Update the best position and global best position.
Step 5. Update the velocity and position of the particle according to the PSO algorithm.
Step 6. Convert the new particle positions to SVM model parameters.
Step 7. Obtain the optimal SVM model parameters.
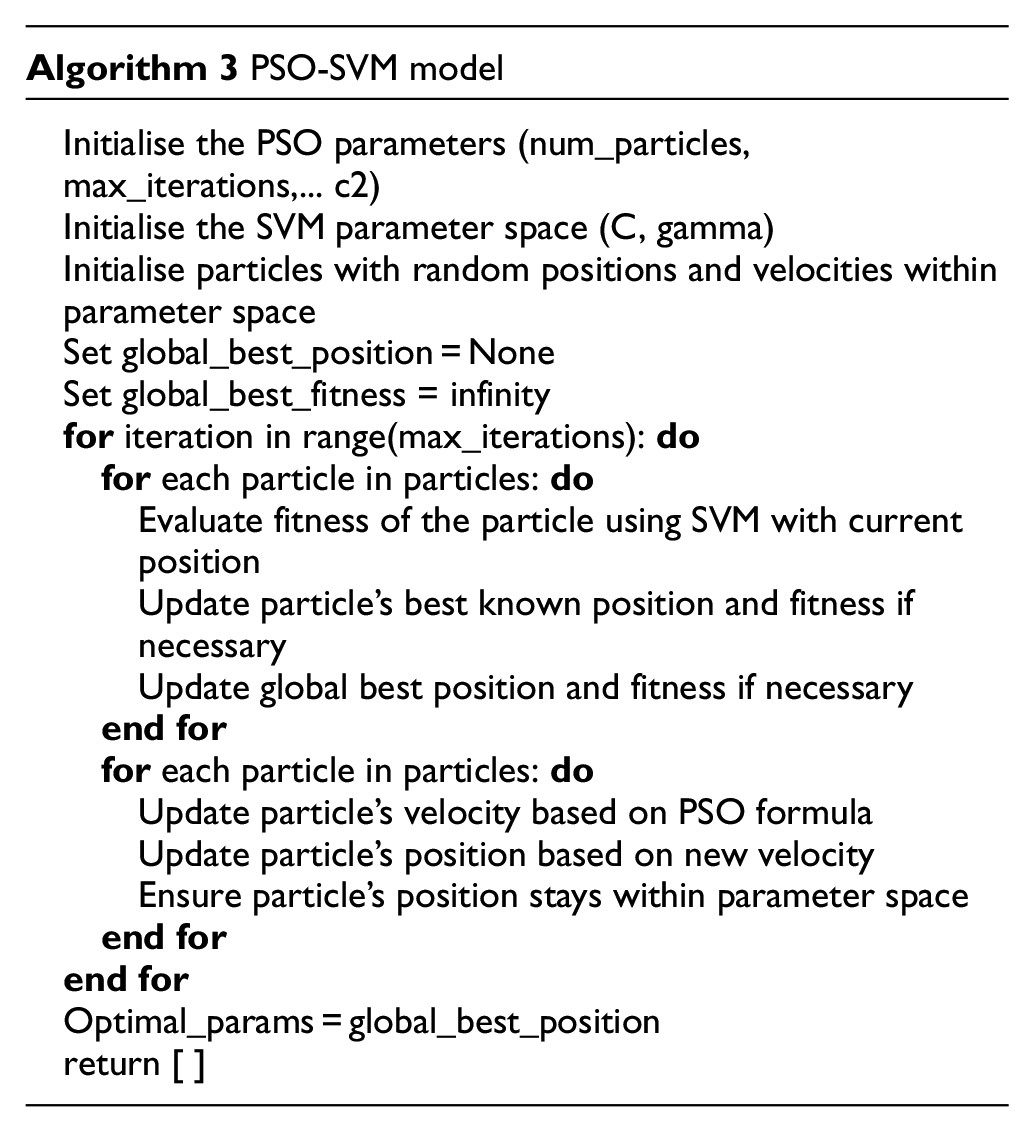
The PSO-SVM algorithm flowchart is shown in Figure 8.
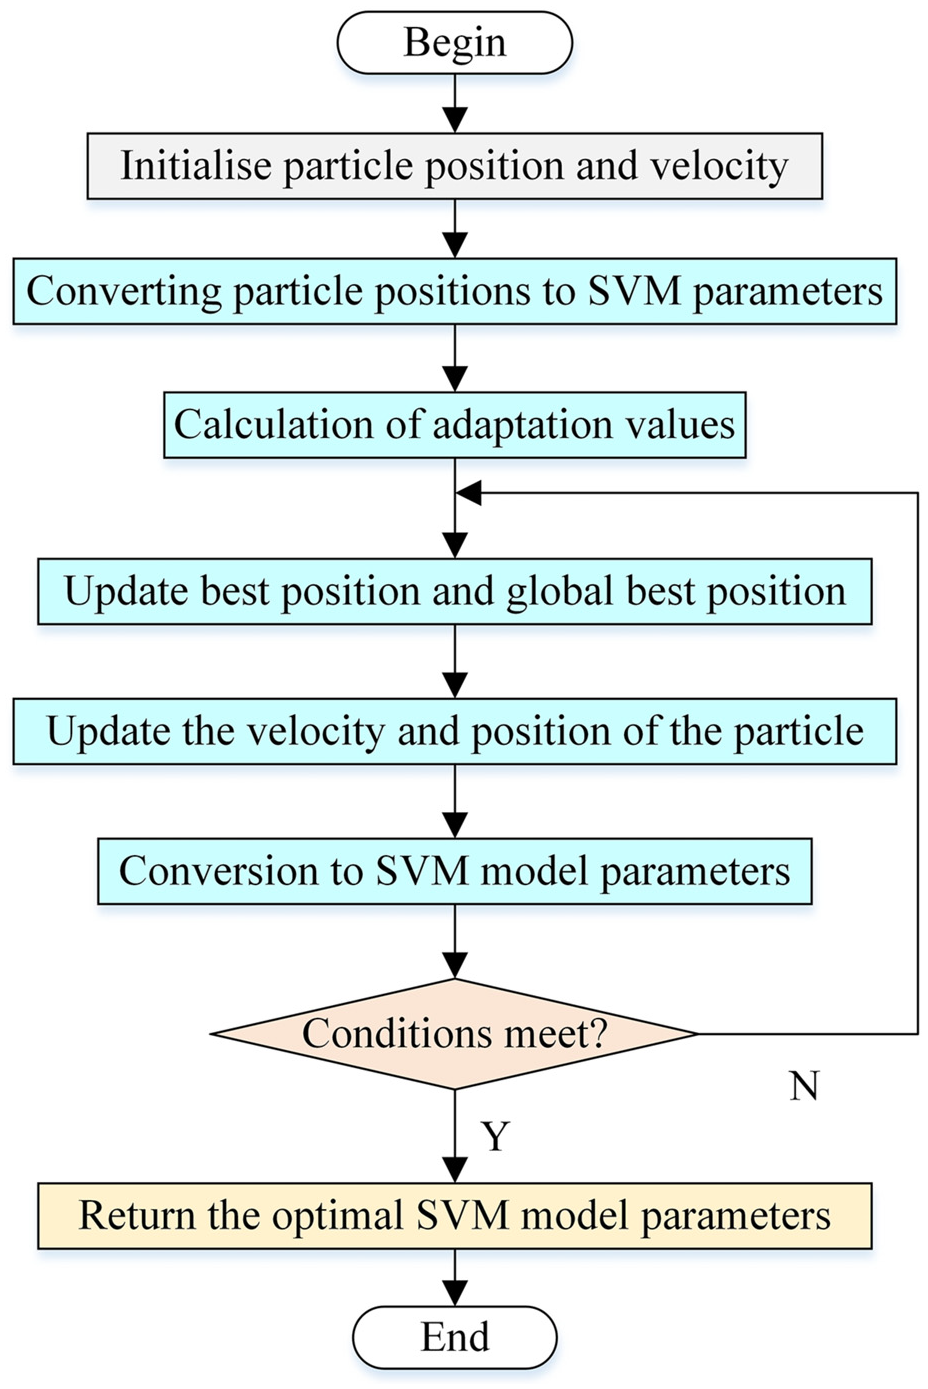
PSO-SVM flowchart.
Combined modelling based on Bayesian-LightGBM and improved PSO-SVM
A prediction method based on the combination modelling of Bayesian-LightGBM and improved PSO-SVM is proposed in the above discussion in Chapters 2 and 3, where the SCADA data of 5 MW WTGs is used as the original input dataset, and the new dataset is found by feature dimensionality reduction using sparse stochastic projection matrices and Bayesian-LightGBM model, and then the new dataset is predicted by the improved PSO-SVM regression model algorithm for prediction, the flowchart is shown in Figure 9, and the specific implementation process is described below.
Step 1. Perform the SCADA dataset of the input WTGs.
Step 2. Put the dataset into the sparse random projection matrix model for initial dimensionality reduction to get the initial optimised dataset of 30 dimensions.
Step 3. The downscaled dataset obtained from Step 2 is imported into the Bayesian-LightGBM model for feature visualisation and analysis to obtain the final input feature parameters.
Step 4. Optimisation determination of hyperparameters of PSO optimisation algorithm using Bayesian algorithm.
Step 5. Import the PSO hyperparameters determined in Step 4 and the feature dataset obtained in Step 3 into the PSO-SVM regression model to obtain the prediction dataset.
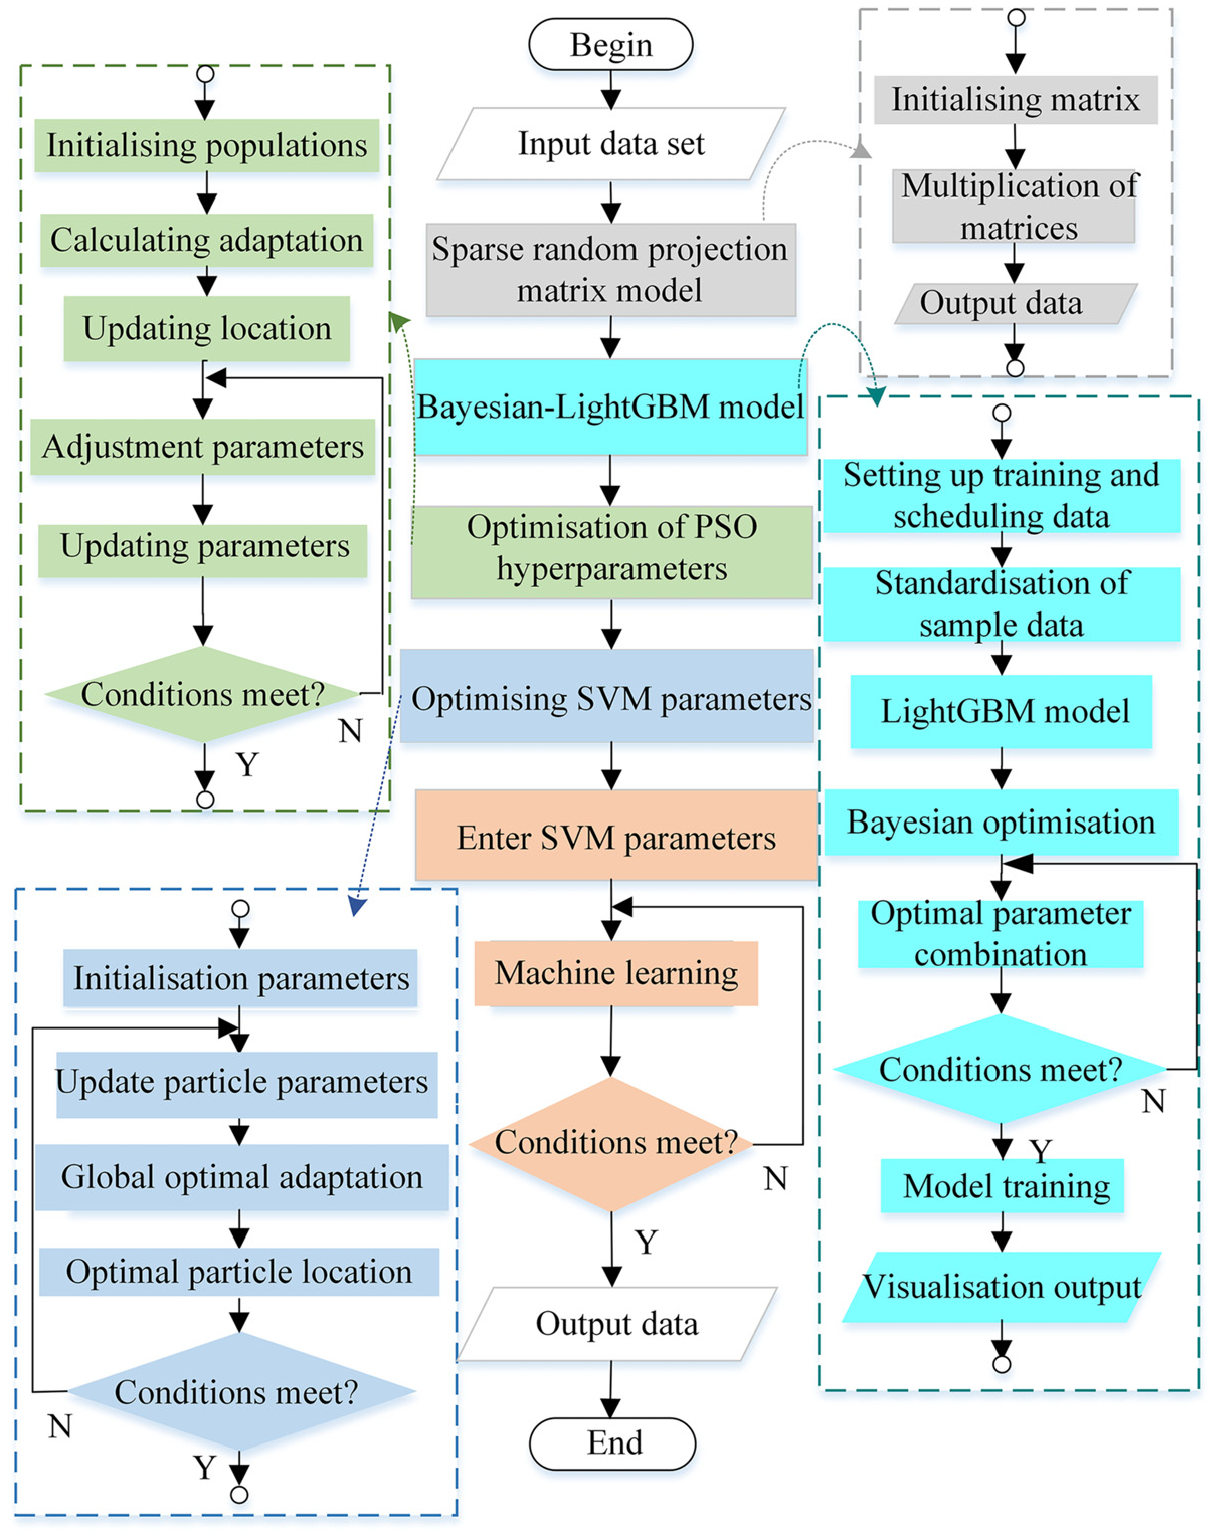
Flowchart of Bayesian-LightGBM and improved PSO-SVM prediction algorithm.
Example simulation
Original feature dataset
The SCADA operation data parameters of the WTGs include: active power, impeller speed, generator speed, ambient wind speed, ambient temperature, nacelle temperature, gearbox oil temperature, hydraulic system oil temperature, hydraulic system oil pressure, net-side phase A current, net-side phase B current, net-side phase C current, net-side phase A voltage, net-side phase B voltage, net-side phase C voltage, net-side ab line voltage, net-side bc line voltage, grid-side ca line voltage, etc. 78 input characteristic parameters. Table 1 shows the actual operation data of 5 MW wind turbine in a wind farm with a sampling period of 10 min.
Actual operating data of a 5 MW wind turbine.
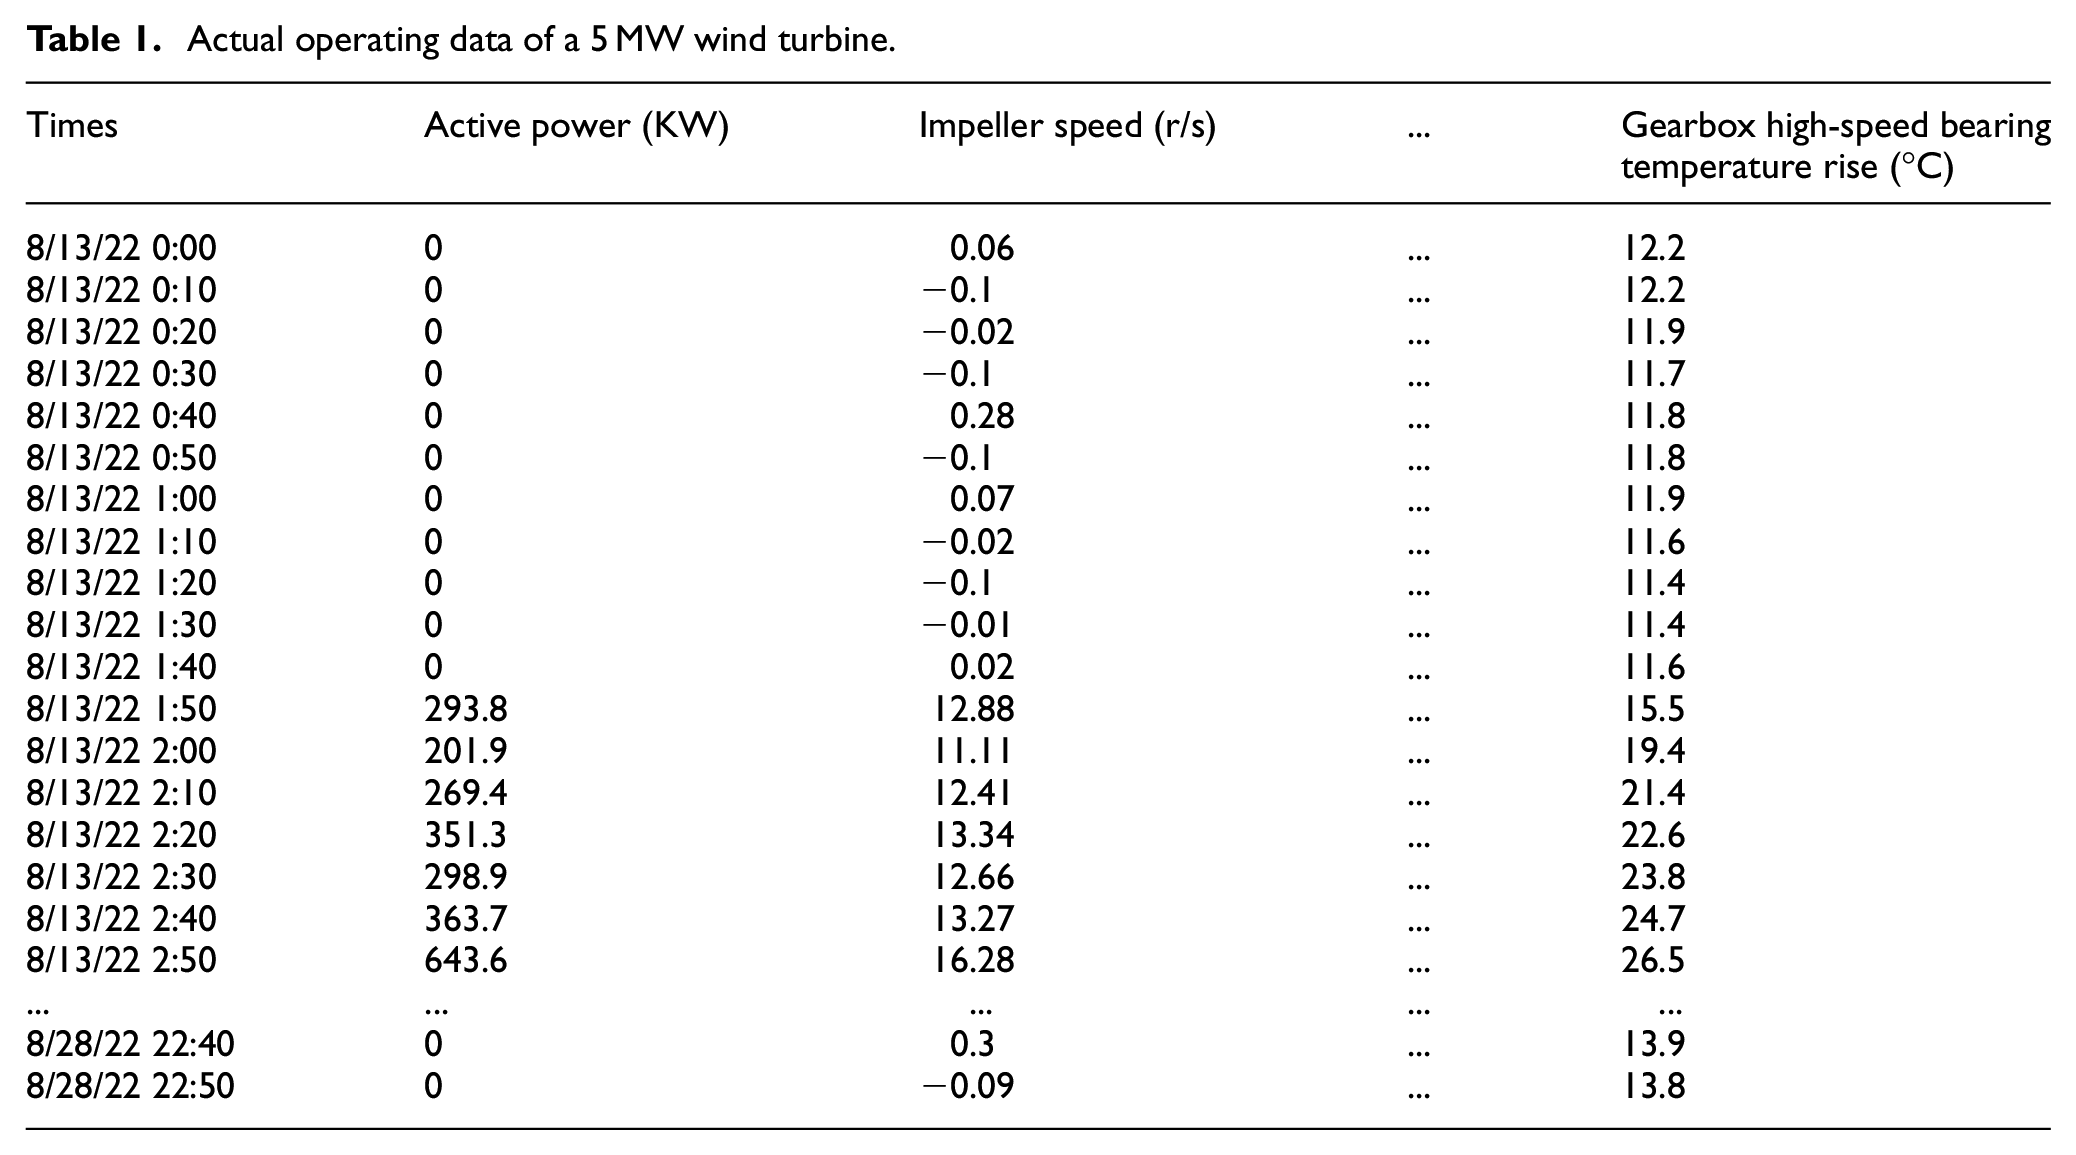
There is a correlation between the operational characteristic parameters in the SCADA data of WTGs, including Active power, Impeller speed, Generator speed, Ambient wind speed, Ambient temperature, etc., but these data are not necessarily correlated with the high-speed bearing temperature rise data of WTG gearboxes. Therefore, in order to reduce the redundancy of data parameter types, improve the accuracy of predicting the temperature rise of high-speed bearings in WTG gearboxes, reduce the model training time, and improve the efficiency of model training, it is necessary to select a subset of feature parameters that are correlated with the data of high-speed bearing temperature rise in gearboxes.
In this paper, in feature engineering, feature dimensionality reduction is firstly carried out to initially reduce the dimensionality of the original data to retain the correlation between its basic data, and then again, through feature selection, the feature parameters that are not helpful for the prediction results are deleted, which further reduces the number of feature parameters. Therefore, pre-processing the data is necessary, and this paper firstly adopts the sparse random projection matrix for feature dimensionality reduction, which is used to reduce the dimensionality of the original data by using the sparse random matrix. In this paper from the original 78-dimensional feature data reduced to 30-dimensional data. Then the improved Bayesian-LightGBM algorithm is used for feature importance scoring and feature visualisation of the optimised dataset.
Feature dimensionality reduction
Feature engineering is the selection of more practical features from the original data features, so as to improve the predictive regression ability of the model, is an integral part of machine learning, is divided into feature extraction, construction and feature selection. Feature selection is an important factor that affects the accuracy of recognition results. 43 Useless information will not only increase the subsequent computational cost, but also have a great impact on classification recognition. 44
The sparse random projection matrix is that it can be computationally very efficient in the first place. Compared to other dimensionality reduction methods such as Principal Component Analysis (PCA) or Linear Discriminant Analysis (LDA), 45 it does not need to compute the covariance matrix or scatter matrix of the data, thus saving a lot of computational time and memory consumption. Secondly, it maintains maintains the relative distance relationship between the data. This is because the sparse random projection matrix is downscaled by randomly selecting projection vectors rather than by specific linear transformations. Therefore, it maintains the characteristics of the original data better and ensures the correlation between the data. Finally sparse random projection matrix reduces the dimensionality of the data. This helps to reduce the storage space and computational complexity of the data and can improve the efficiency of subsequent data processing and analysis. 46
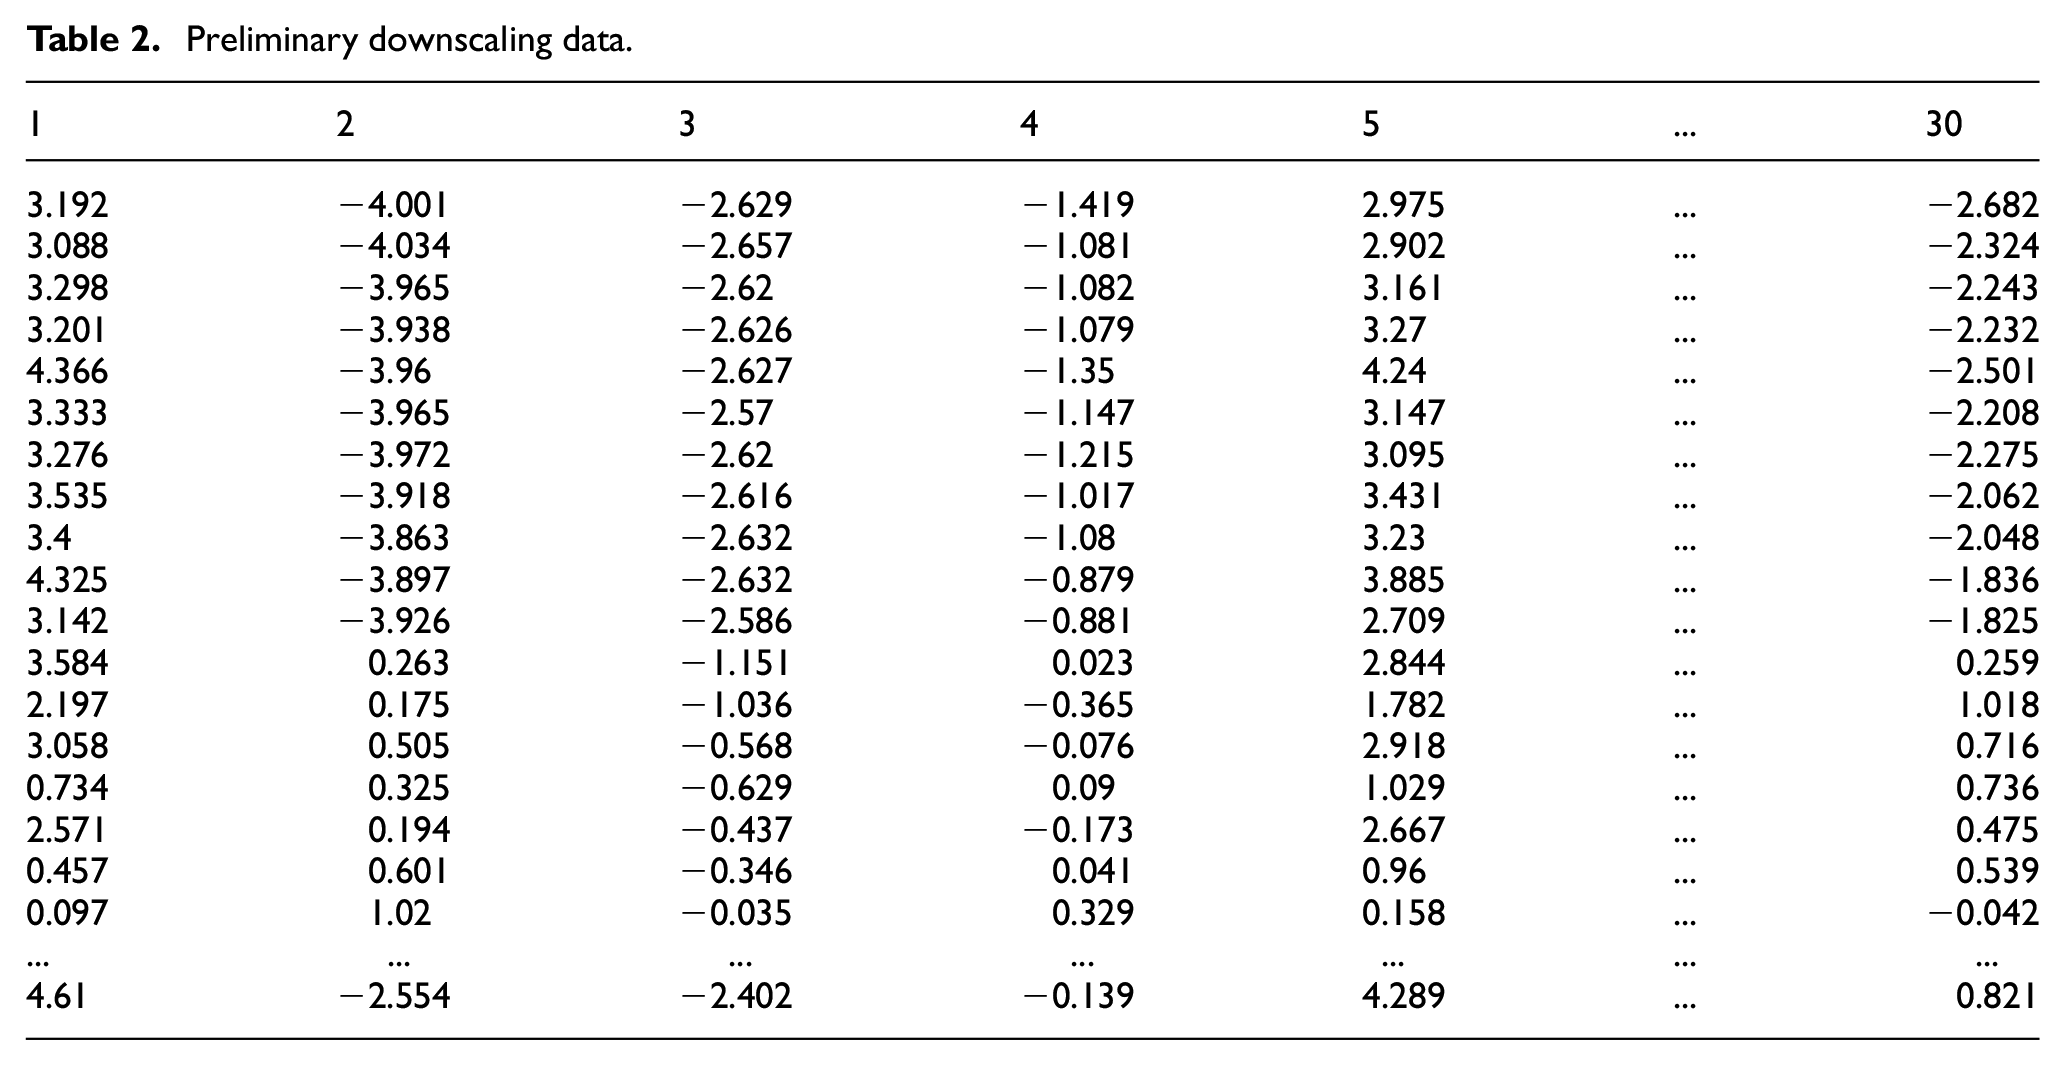
The original 78-dimensional data feature set is input into the model of sparse random matrix projection, and its dimensionality is downgraded to 30 dimensions to obtain the new data set. The obtained dimensionality reduced data is shown in Table 2.
Preliminary downscaling data.
Next, the optimised data are input into the Bayesian-LightGBM model as a new set of data feature parameters for feature visualisation, so as to delete the unimportant feature terms and complete the feature selection operation. The advantages of combining sparse random projection matrix feature downscaling and Bayesian-LightGBM model for feature engineering operations are, firstly, sparse random projection matrix feature downscaling can reduce the dimension of the feature space and improve the accuracy of feature selection; secondly, the improved Bayesian optimisation algorithm applied to the LightGBM model can search for the feature subset more efficiently and improve the efficiency of the model. The feature visualisation operation can be completed, and the score of each feature can be obtained to explain the importance of each model, which reduces the manual intervention.
In the LightGBM model, the learning rate, the maximum depth of the tree, the minimum number of leaf node samples and the number of leaf nodes are selected as hyperparameters to be optimised by the Bayesian algorithm. These hyperparameters are within the search space of Bayesian optimisation and can be used in a continuous numerical way to define and evaluate the performance of the model. Based on the previous evaluation results and the Gaussian process model, new combinations of hyperparameters are selected within the defined hyperparameter search space and the next round of training and evaluation is performed. This process will be iterated, each time selecting the most likely combination of parameters to improve performance under the current estimation. After 50 iterations the optimisation Bayesian optimisation algorithm will gradually converge to a combination of hyperparameters with the best performance. In this case, the learning rate, maximum depth of the tree, minimum number of samples at leaf nodes and number of leaf nodes are optimised to get the best values which are 0.0768, 18.1271, 7.4061 and 22.558 respectively. Thus we get the combination of hyperparameters for LightGBM model.
The scores of individual features for feature visualisation processed by Bayesian optimised LightGBM in Figure 10 below. In the figure it can be seen that the top 20% of features are selected as feature covariates as feature parameters for the subsequent inputs and the feature scores are 177.7, 158, 143, 118.9, 87.1 and 76. The data filtered from these are used as inputs to the subsequent model to obtain the fan dataset.
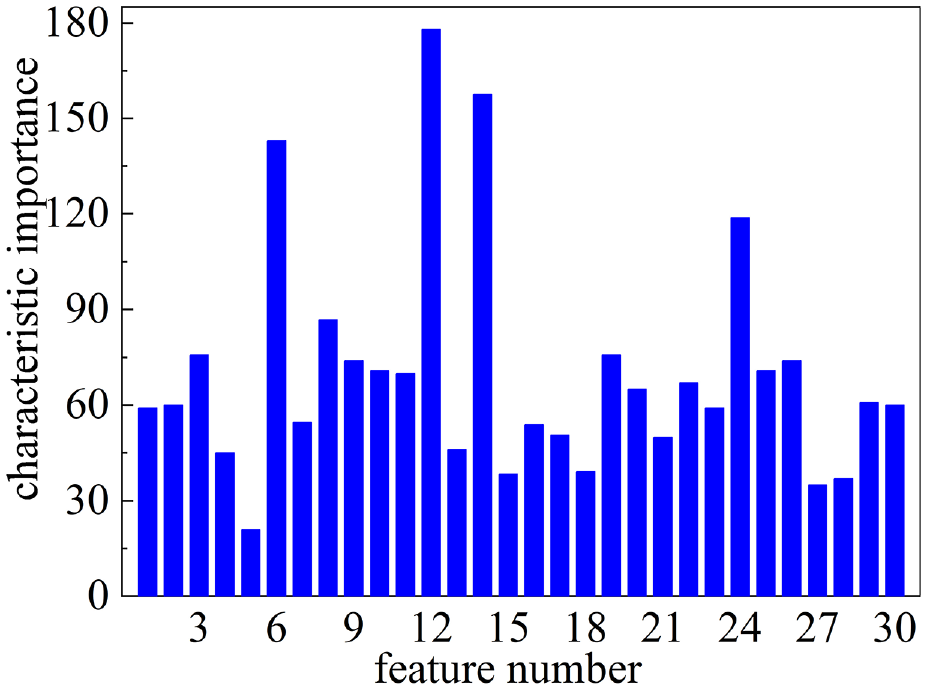
Bayesian optimisation of LightGBM feature visualisation operations.
Combining the above two modelling algorithms, the feature parameter data related to the temperature rise of high-speed bearings of wind turbine gearboxes are retained to the maximum extent, which makes the dimensionality of the subsequent input parameters reduced and improves the training accuracy and efficiency.
Forecast analysis
Seventy percent of the selected feature data is input as a training set in the Bayesian-PSO-SVM model for training and the remaining 30% of the data is used as a test set for model performance prediction testing. The predicted values are obtained in the data are input into the Bayesian-PSO-SVM model respectively. In this experiment, the hyperparameters of the Bayesian algorithm to optimise the PSO are parameterised as the following: the learning factors
Bayesian-PSO-SVM model optimal fitness.
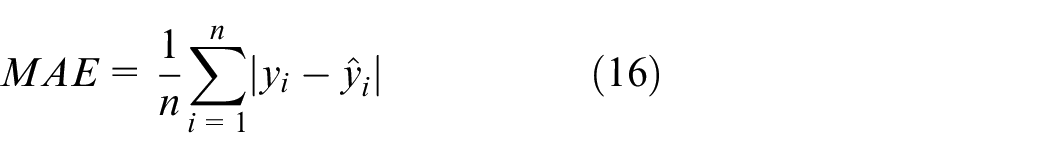
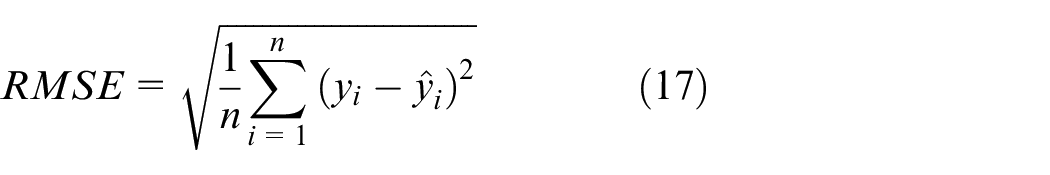
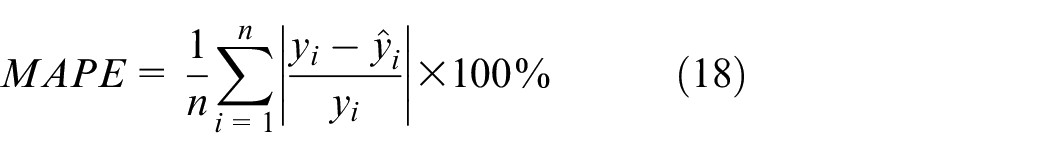
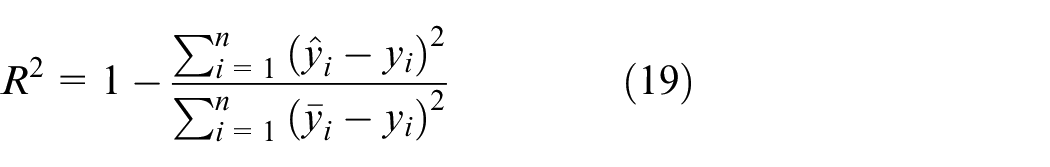
In this paper, mean absolute error (MAE), root mean squared error (RMSE), mean absolute percentage error (MAPE) and coefficient of determination (
Where MAE represents the mean of the absolute value of the error between the predicted value and the true value, which reflects the real situation of the prediction error; MAPE is the size of the mean of the absolute value of the relative error between the predicted value and the true value, and MAPE responds to the relative size of the prediction error and the true value; RMSE is the square root of the ratio between the sum of squares of errors between predicted and true values and the number of samples, which is the ratio of the error The RMSE is the square root of the ratio between the sum of the squares of the errors between the predicted and true values and the number of samples, which is the degree of dispersion of the error distribution.
Then
The following equation shows the formula for MAE, RMSE, MAPE, and
where:
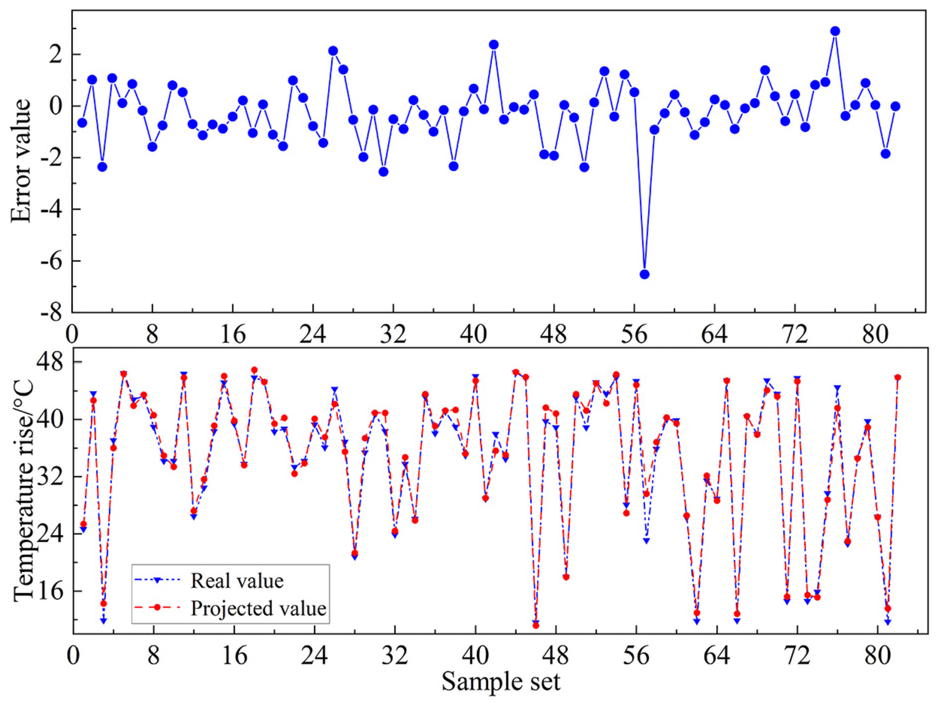
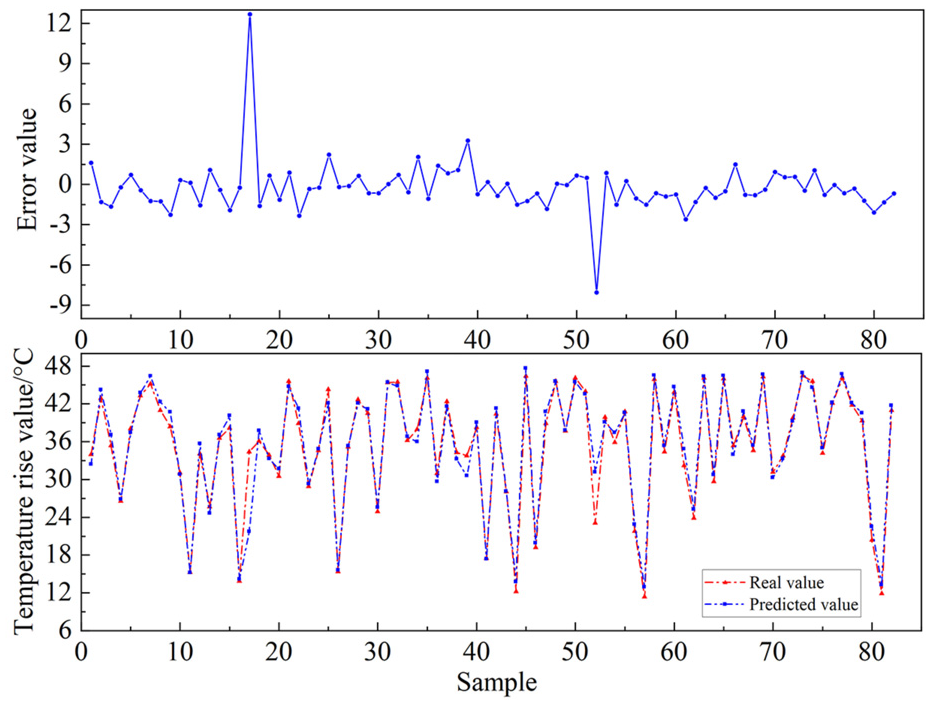
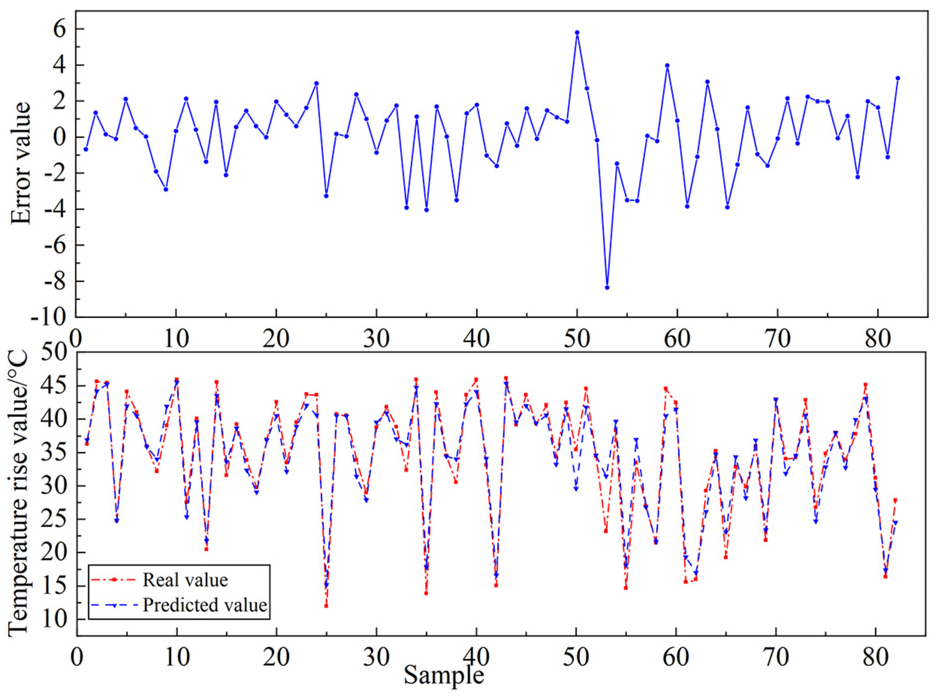
As can be seen in Figures 12 and 13, the comparison of the predicted and actual values of the training and prediction sets of the Bayesian-PSO-SVM model. The training prediction error index of the Bayesian-PSO-SVM model is stable at [−2,0.5], and the prediction set error is stable at [−0.8,0.8], and the prediction error is randomly distributed around the mean, which indicates that this model has better stability.
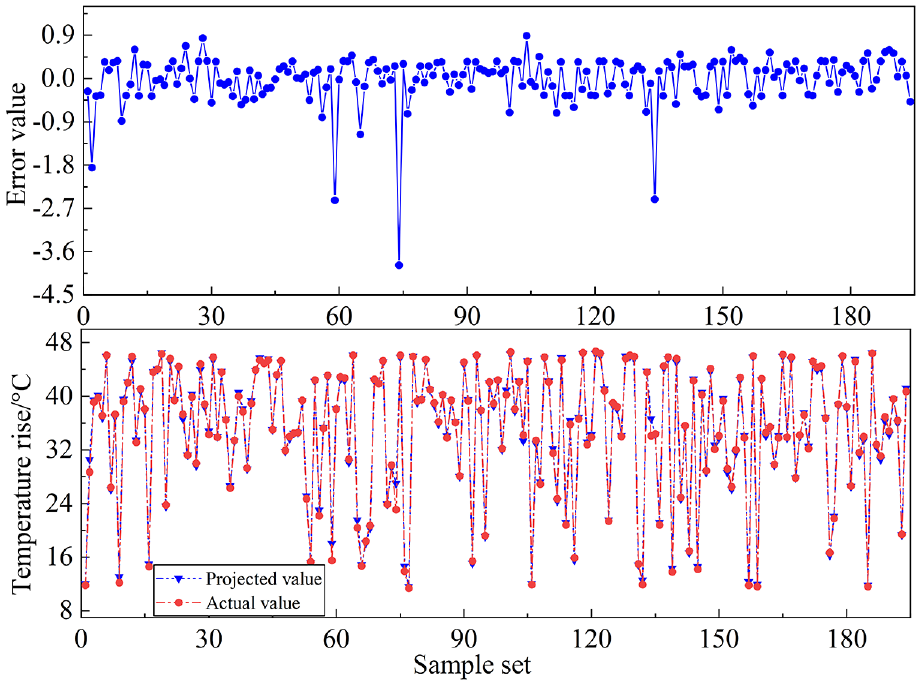
Comparison of predicted and actual values of training set of Bayesian-PSO-SVM model.
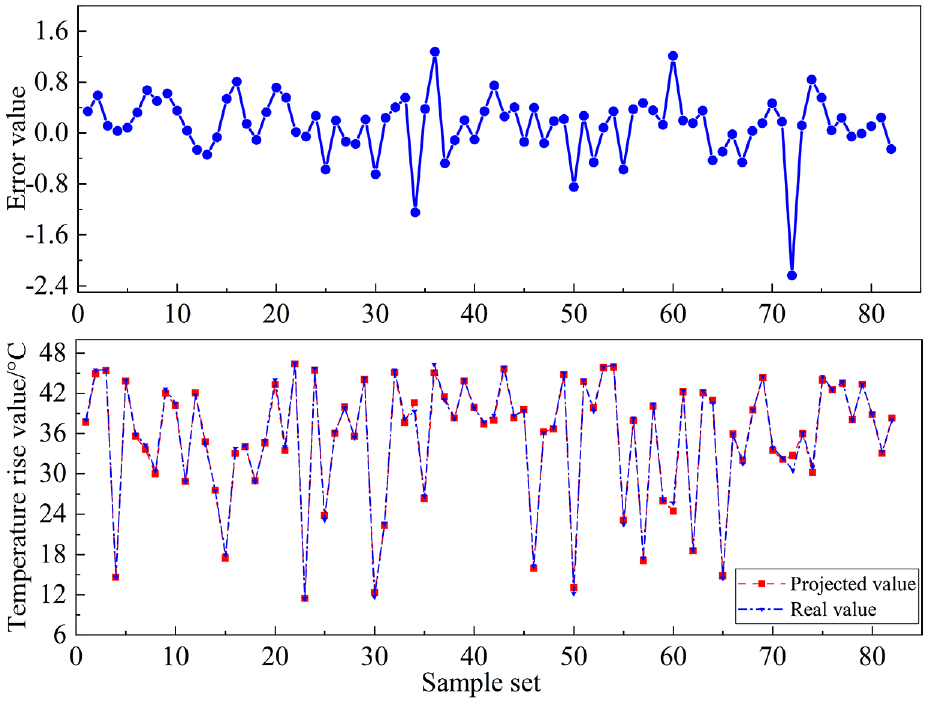
Comparison of predicted and actual values of testing set of Bayesian-PSO-SVM model.
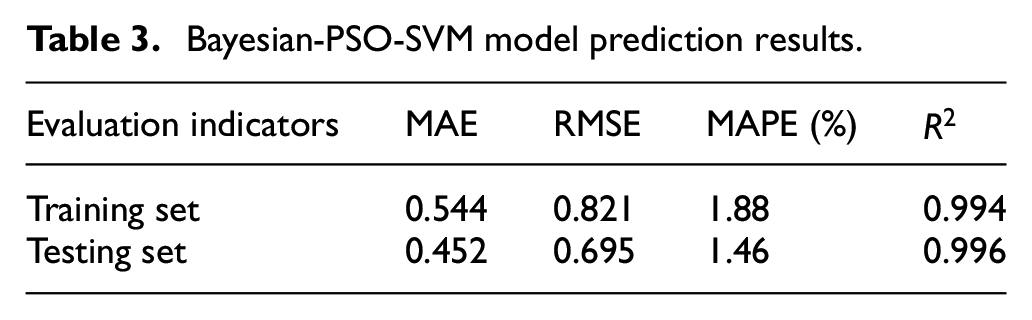
The Bayesian-PSO-SVM model prediction indexes are shown in Table 3, the average absolute error MAE of both the training set and the test set are small, around 0.5; the root mean square error RMSE increases, and the prediction results have a certain degree of dispersion, around 0.7; the average relative error MAPE value is around 1.6%, and the
Bayesian-PSO-SVM model prediction results.
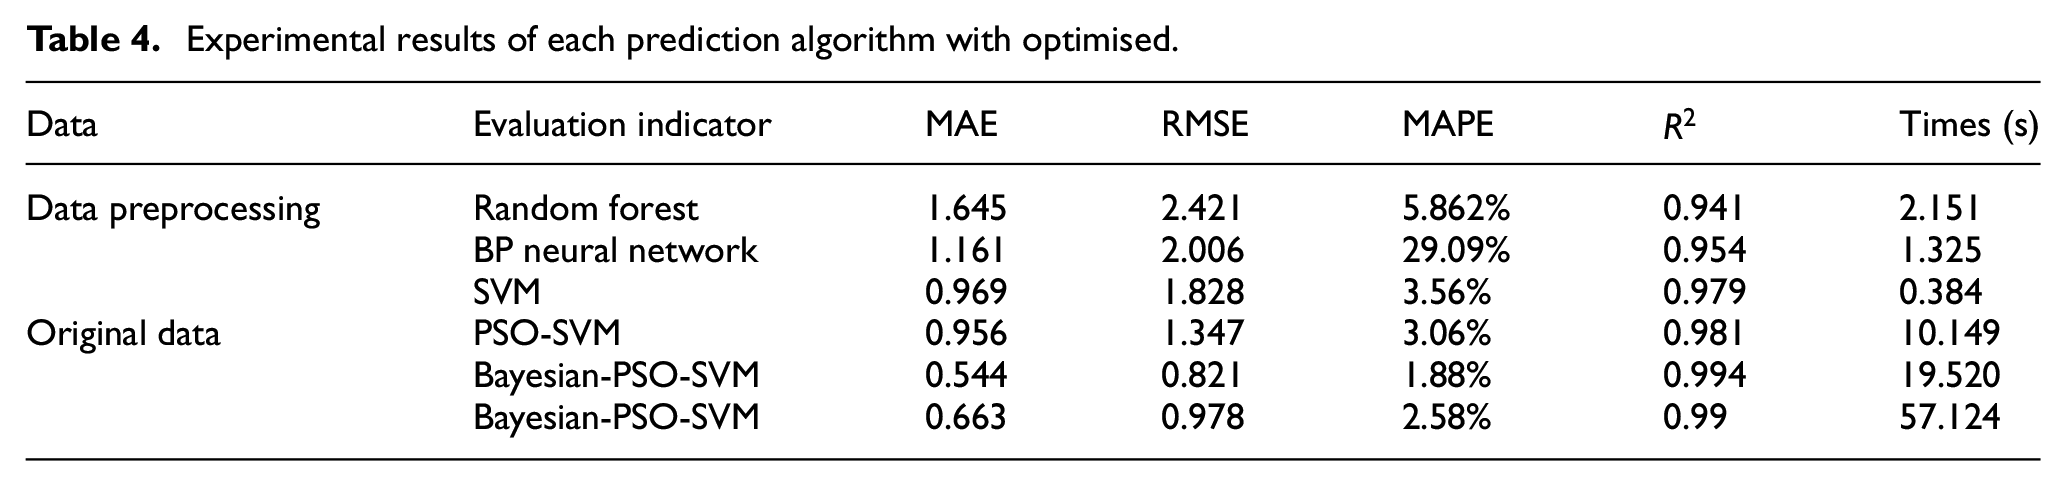
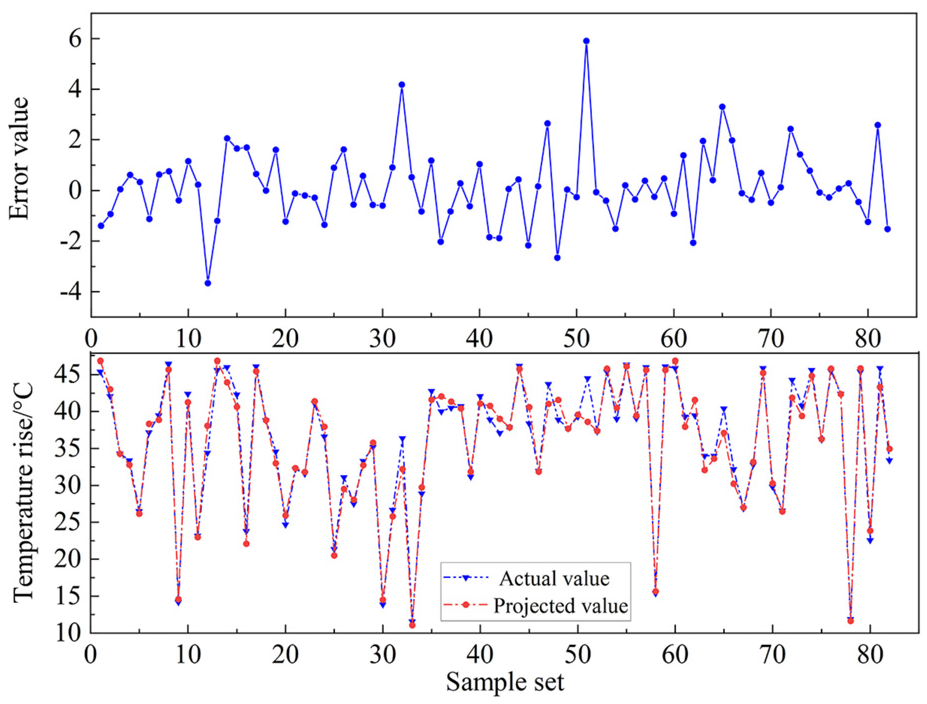
In order to verify the necessity of feature preprocessing for data prediction, the original data is taken as input data, which is fed into the Bayesian-PSO-SVM regression prediction model and compared with the method of the experimental data obtained after performing feature preprocessing analysis. The evaluation metrics are shown in Table 4 below. The test set prediction plot of Bayesian-PSO-SVM model for unprocessed data is shown in Figure 14.
Experimental results of each prediction algorithm with optimised.
Bayesian-PSO-SVM model testing set prediction plots for unprocessed data.
From Figures 13 and 14, it can be seen that the unprocessed data entered into the model as eigenvector parameters, the predicted values deviate from the actual values to a greater extent relative to the predicted values of the model with data preprocessing, reflecting the necessity of preprocessing the data from the WTGs, with a more dispersed and wider distribution of errors.
And in order to verify the effectiveness of Bayesian-PSO-SVM model in predicting the temperature rise of high-speed bearings of gearboxes in wind farms, the Random Forest model and BP neural network model as well as the SVM model were applied for prediction, respectively, and at the same time, the PSO-SVM model was added to compare with the Bayesian-PSO-SVM model for comparison.
By the fitting effect in the Figures 15–17 can be found, when the high-speed bearing temperature rise changes, in the BP neural network, random forest algorithm and SVM model three model comparison reaction compared to the BP neural network and random forest algorithm, SVM model in the temperature rise at the same time as large fluctuations occur, can be as soon as possible to react and timely prediction, and the remaining two algorithms and can not reflect the degree of change occurs in a timely manner, resulting in the the prediction results are not satisfactory enough. At the same time the error value in kept between [−4,6], keep more accurate. It can be seen that among BP Neural Network, Random Forest Algorithm and SVM model, SVM model has better prediction accuracy and robustness, so SVM is chosen as the prediction algorithm model.
Plot of SVM algorithm predicted values against actual values.
Comparison between predicted and actual values of BP neural network.
Plot of predicted versus actual values of the Random Forest model.
From Figures 15 and 18 comparison can be seen PSO-SVM model and ordinary SVM model comparison, PSO-SVM model can better reflect the trend of changes in the original data, in the ups and downs of the change in the tiny interval can be more timely follow up the degree of change in the original value, more close to the actual value of the indicator curve, while the SVM model will be in the small changes can not be timely follow up, produce error changes more.
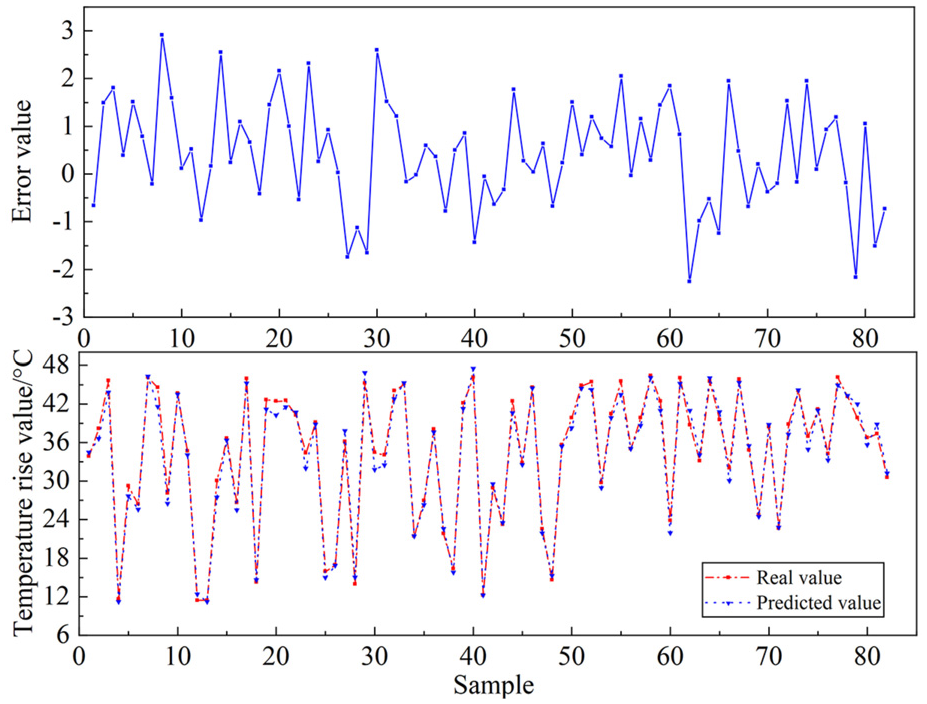
Plot of PSO-SVM model predicted values versus actual values.
Firstly, the Bayesian algorithm can provide a smarter parameter search pattern, which can adjust the parameter space range based on the previous search results and thus converge faster to search for the optimal solution. This helps to improve the performance of the model. Secondly, the PSO algorithm has the characteristic of global optimality, which is more favourable to find the optimal solution, and together with the Bayesian algorithm, it can avoid falling into the local optimal solution. Finally, Bayesian-PSO-SVM combines the advantages of Bayesian model and Particle Swarm Optimisation with stronger adaptive and iterative capabilities. It is able to adjust the search direction in real-time results, thus optimising the model more flexibly and improving the prediction accuracy. Therefore, after feature engineering, the Bayesian-PSO-SVM model outperforms other algorithms.
The results of each error index obtained from the above experiments are shown in Table 4. From the above experimental results, it can be seen that the Bayesian-PSO-SVM model obtained without the pre-processing operation of feature engineering is not very good in the application of actual wind farms. When no feature engineering is performed, the Bayesian-PSO-SVM model obtains a MAPE of 2.58%, a MAE of 0.665, an RMSE of 0.978, an
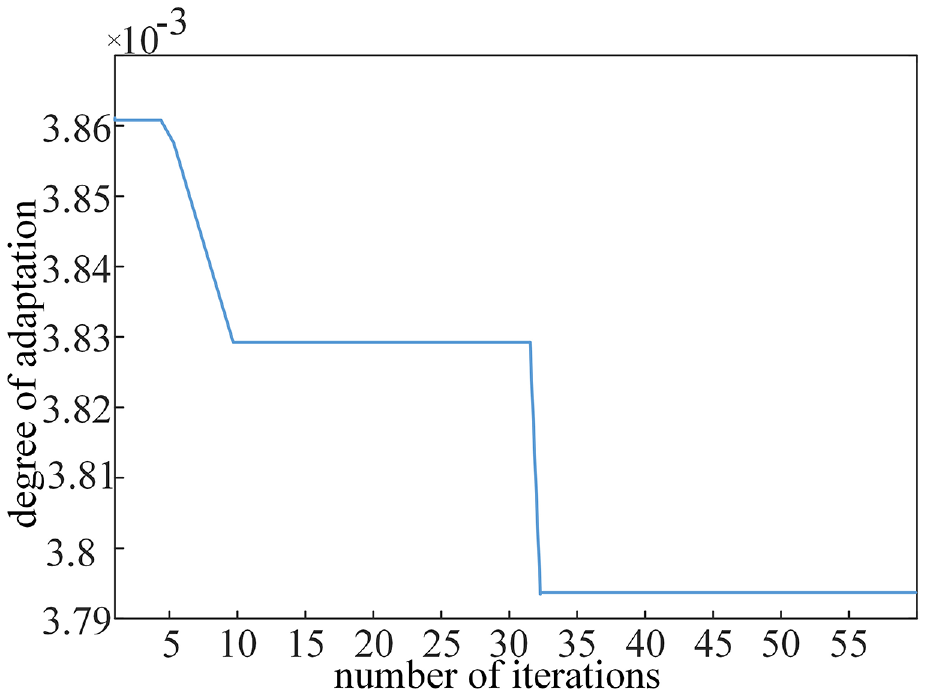
As can be seen from Figure 19, in the PSO-SVM model, its fitness value does not reach convergence although it decreases rapidly in the third generation, and gradually reaches the convergence condition in the 36th generation, and at the same time, the curve decreases after a long period of oscillation and a slow and gradual approximation of the convergence condition. Comparing with the model proposed in this paper, it can be seen that the Bayesian-PSO-SVM model utilises a shorter time to reach convergence and its computational efficiency is faster.
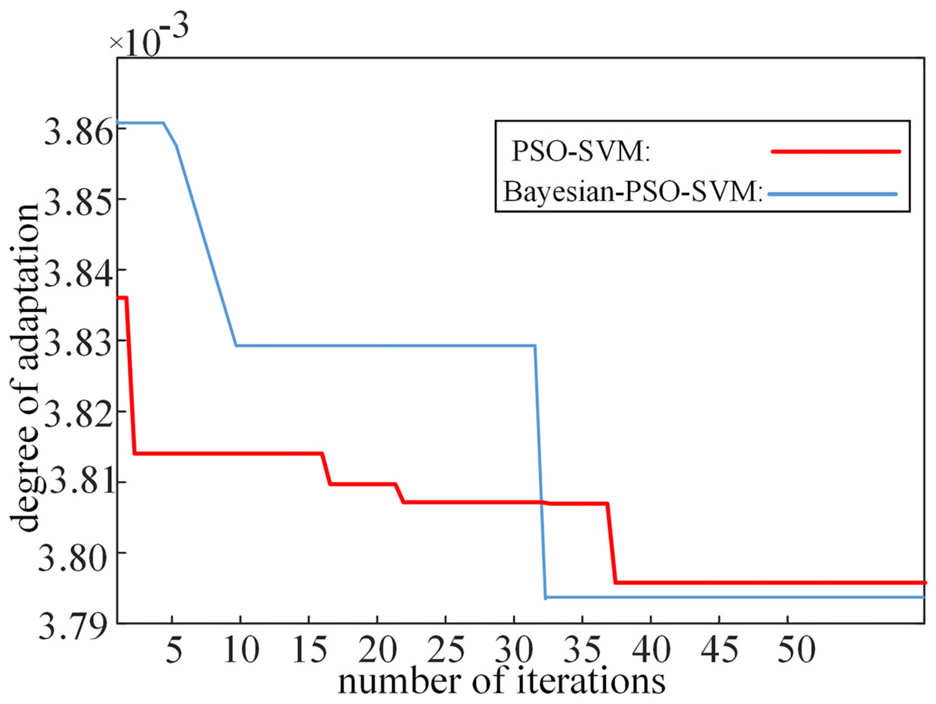
Bayesian-PSO-SVM model versus PSO-SVM model adaptation.
We have analysed the ANOVA of the predicted values of the six models mentioned.
Step 1: Establish the hypotheses (including the null hypothesis (all sample groups have equal means) and the opposing hypothesis (at least one group of sample means is different from the others)), where the null hypothesis is H0 and the opposing hypothesis is H1;
Step 2: Calculate the total sum of squares (the sum of the squares of the differences between all observations and the total mean), let it be SST;
Step 3: Calculate the intergroup sum of squares (the sum of the squares of the means of each group and the total mean difference), let it be SSB;
Step 4: Calculate the within-group sum of squares (the sum of the squares of the differences between the mean values of each observer in the group and the mean value of the group), let it be SSW;
Step 5: Calculate the mean squares (MS): hereby, Mean square error between groups(MSB):
where, k is the number of groups.
Within-group mean squared error(MSW):
where, N is the total number of observations.
Step 6: Calculate the F:
which is used to determine the level of significance, usually using the significance level
After ANOVA analysis, the p-value obtained was 0.770, for which a hypothesis test was carried out, in this case the p-value was greater than the level of significance (0.770 > 0.05) and therefore there was not enough evidence to reject the original hypothesis that there was no significant difference in the means between the groups. The model is statistically consistent between the groups, that is, there is no significant difference in the means between the groups.
The above results fully demonstrate the necessity of data screening using sparse stochastic projection feature dimensionality reduction data matrix downscaling and Bayesian-LightGBM model, the superiority of Bayesian-PSO-SVM in regression model prediction and the effectiveness of the prediction accuracy of high-speed bearing temperature rise of the gearboxes in real-world problems of WTGs.
Conclusions
In this paper, on the basis of previous research, in order to solve the problem that a single algorithm cannot accurately complete the prediction of high-speed bearing temperature rise of wind turbine gearboxes, a combined modelling method based on wind turbine operation data is proposed, which organically combines the sparse stochastic projection matrix model, Bayesian-LightGBM model and Bayesian-PSO-SVM model, to achieve the prediction of the temperature rise of high-speed bearings of wind turbine gearboxes. The prediction of the temperature rise of high-speed bearing of wind turbine gearbox is achieved. The following conclusions are mainly obtained.
(1) The preliminary dimensionality reduction dataset is obtained by feature dimensionality reduction of the original data through sparse random projection matrix, and then, the Bayesian-LightGBM model is used to select and screen the features of the preliminary dimensionality reduction dataset, and the irrelevant features to the prediction results are further deleted, which achieves the reduction of the model complexity, reduces the running time, and improves the accuracy of the prediction of the subsequent model.
(2) A Bayesian-PSO-SVM prediction model was established, and the coefficient of determination
(3) Several different algorithms are used to verify the prediction regression, and the Bayesian-PSO-SVM prediction model is better than the rest of the prediction models, with an RMSE of 0.821, which is significantly better than the traditional BP neural network algorithm and Random Forest algorithm, providing a new method for the prediction of temperature rise of high-speed bearings of gearboxes of wind turbines.
(4) By comparing the prediction results in the Bayesian-PSO-SVM model with the original data and the data after data preprocessing, the accuracy of the prediction model after data preprocessing is improved, the MAE, RMSE, and MAPE are decreased to different degrees, and the
The next step of the work plan is to increase the data screening and supplementation of feature engineering in the fault diagnosis of high-speed bearing temperature rise of 5 MW WTG based on Bayesian-LightGBM and improved PSO-SVM model, so as to improve the accuracy of fault diagnosis as much as possible. And although the model proposed in this paper has achieved a certain degree of accuracy, with the development of wind power technology and deep learning technology, the model still needs to be further improved by updating the algorithms and technology to further improve the model accuracy and prediction efficiency in order to meet the real needs. Therefore, the system needs to be optimised and improved in the future.
Supplemental Material
sj-png-1-mac-10.1177_00202940241280051 – Supplemental material for Temperature rise of high-speed bearing in gearbox of 5 MW wind turbine based on Bayesian-LightGBM and improved PSO-SVM troubleshooting
Supplemental material, sj-png-1-mac-10.1177_00202940241280051 for Temperature rise of high-speed bearing in gearbox of 5 MW wind turbine based on Bayesian-LightGBM and improved PSO-SVM troubleshooting by Minan Tang, Zhanglong Tao, Jiandong Qiu, Jinping Li, Mingyu Wang, Hongjie Wang and Chuntao Rao in Measurement and Control
Footnotes
Acknowledgements
The authors gratefully acknowledge the support they received from the National Natural Science Foundation of China (grant numbers 62363022, 61663021, 71763025 and 61861025); Natural Science Foundation of Gansu Province (grant number 23JRRA886); Gansu Provincial Department of Education: Industrial Support Plan Project (grant number 2023CYZC-35).
Author Contributions
Conceptualization, M.T.; data curation, Z.T.; formal analysis, Z.T., J.L. and M.W.; funding acquisition, M.T.; investigation, Z.T., J.Q., J.L., H.W. and C.R.; methodology, M.T., Z.T. and J.Q.; project administration, M.T.; resources, M.T., M.W. and C.R.; software, Z.T.; supervision, M.T. and J.Q.; validation, J.Q. and H.W.; visualization, Z.T. and J.Q.; writing and original draft preparation, M.T. and Z.T.; writingand review and editing, M.T. and J.Q. All authors have read and agreed to the published version of the manuscript.
Declaration of conflicting interests
The author(s) declared no potential conflicts of interest with respect to the research, authorship, and/or publication of this article.
Funding
The author(s) disclosed receipt of the following financial support for the research, authorship, and/or publication of this article: This research was funded by the National Natural Science Foundation of China (grant numbers 62363022, 61663021, 71763025 and 61861025); Natural Science Foundation of Gansu Province (grant number 23JRRA886); Gansu Provincial Department of Education: Industrial Support Plan Project (grant number 2023CYZC-35).
Data availability statement
Data sharing not applicable to this article as no datasets were generated or analysed during the current study.
References
Supplementary Material
Please find the following supplemental material available below.
For Open Access articles published under a Creative Commons License, all supplemental material carries the same license as the article it is associated with.
For non-Open Access articles published, all supplemental material carries a non-exclusive license, and permission requests for re-use of supplemental material or any part of supplemental material shall be sent directly to the copyright owner as specified in the copyright notice associated with the article.