
Abstract
The high value of aero-engines makes it necessary to extend their life in terms of econ-omy of use. Health management is an important basis for this work. Background: The vibration signal is an important representation of the working state of an aero-engine. The current usual method is based on wired communication with simple waveform presentation. The many incon-veniences of this method have seriously affected the further development of this work. Methods: This research team acquires engine vibration signals in real time through a designed wireless signal sensor, and then analyzes and visualizes the signals in depth. Results: Through this method, it can visually and effectively demonstrate signal characteristics for engineers, effectively identify fault signals, and monitor engine operating conditions in real time. Conclusions: The method enables the optimization of aero-engine work-state monitoring.
Keywords
Introduction
In the 1960s and 1970s, the development of digital circuits, computer-aided testing, and digital signal analysis and processing technology promoted the development of online testing and fault diagnosis of mechanical equipment. In the 1970s and 1980s, many developed countries began to study the condition monitoring and fault diagnosis technology of machinery and equipment. The United States is to carry out mechanical condition monitoring and fault diagnosis technology research in the earliest countries. The United States began in 1961 after the implementation of the Apollo program a series of equipment failures, in 1967 in the United States National Aeronautics and Space Administration (NASA) under the advocacy of the United States Office of Naval Research (ONR) hosted the establishment of the United States Mechanical Failure Prevention Group (Machinery Fault Prevention Group), and is actively engaged in the research and development of diagnostic fault technology. Britain in the 20th century in the late sixties and early seventies, Dr. R.A. Collacott as the head of the British Mechanical Health Monitoring Center (Mechanical Health Monitoring Center) began diagnostic technology research and development work in the friction and wear, automotive, combustion engine monitoring and diagnostics has a leading edge, and its publication of “VIBRATION MONITORING.”“VIBRATION MONITORING AND DIAGNOSIS,” which played an important milestone role in the research in this field.
Before the 1950s, the main method used in the analysis of vibration signals was the analog analysis method. After the 1950s, with the development of computer technology and digital signal processing, large-scale general-purpose digital computers began to be applied to the analysis of vibration signals. After the sixties, with the deepening of the field of human exploration, from space, navigation, undersea exploration, military, and other fields have put forward the signal analysis speedometer resolution ability higher requirements. In 1965, the United States of America’s J.W. Cooley and J.W. Tukey put forward the fast Fourier calculation method, greatly saving the amount of computation, along with the development of digital signal processing technology, and access to a very wide range of applications. very wide application.
In the field of aero-engine health management, the analysis of vibration signals is an effective method for monitoring working conditions.1,2 This method is highly valued by engineers and technicians. 3
In this paper, we present a method developed by our team and successfully applied in engine health management. The method is to transmit the engine vibration signals collected by sensors through wireless communication, send them to the processing end, and present them in an autoregressive class model analysis to assist engineers and technicians in troubleshooting.
The construction of this type of system is designed according to the “sensor-signal transmission-analysis and processing” model. 4 However, in practice, it has been found that transmitting the sensor acquisition signal by wired means is not conducive to work. The design has been criticized by engineers and technicians, and the disadvantages it brings greatly limit the effective use of the system. 5 The convenience that the wireless communication mode possesses makes it an effective way to solve the corresponding problems.
Fault diagnosis research based on vibration signal analysis has made certain achievements, and the overall development is relatively smooth, with more mature application programs. According to the functional division, it mainly includes the following three aspects: detection of fault information, signal processing and fault feature extraction method research, state pattern recognition, and classification.
Fault information detection is the first step in realizing fault diagnosis of power units, and is a necessary prerequisite for fault diagnosis research. Fault information detection is the technology of signal detection and quantification of various state information of the power unit itself, while the sensor is the device that obtains all kinds of information and converts them into electrical signals, which is the main means and key to obtaining fault information. Since the types of sensors reflect the state of different components to different degrees, we should try to select the type of sensors that can reflect the state characteristics of mechanical equipment during testing. High reliability and long-term stability of detection and sensing technology, fixed implanted and interventional detection and sensing technology, fault information telemetry technology, vibration measurement with fiber-optic sensing technology and acoustic emission detection technology, etc., are fault condition information detection technology to study the main content. Sensor technology will remain an important research content of power unit condition monitoring and fault diagnosis.
The research of the state feature extraction method is the key to mechanical equipment condition monitoring and fault diagnosis technology, and a good signal processing method can extract the feature information that can fully express the state. It directly affects the calculation of the whole diagnostic process and the performance of the whole diagnostic system. Therefore, although the vibration signal of the power unit reflects the operating condition of the equipment and can be used as a monitoring signal, the directly detected vibration signal is usually a random non-stationary signal, which contains a large amount of information unrelated to the fault, so it is not suitable to be directly used as a fault characteristic quantity, and it is necessary to use modern signal analysis and signal processing methods to convert the original detected signals into a characteristic quantity that can express the operating state. The purpose of the research on fault feature extraction is to use various signal processing methods as tools to find out the relationship between the working condition and the feature quantity and to separate the feature information reflecting the fault from the feature information not related to the fault, to realize the effective and reliable fault diagnosis. The purpose of signal analysis and processing is to determine the feature quantities that can characterize the operating state of mechanical equipment through feature extraction of state signals. Among them, the commonly used signal processing-based feature extraction method time domain model analysis, time series analysis, inverse spectral analysis, fast Fourier transform, short-time Fourier transform, time-frequency analysis, Winger distribution analysis, wavelet analysis, Hilbert-Huang transform analysis, higher-order spectral analysis, and other methods.
Condition pattern recognition and classification is the core of condition monitoring technology, and the development of modern artificial intelligence technology promotes the development of equipment condition recognition technology. Fuzzy classification technology, neural network technology, expert systems, support vector machines, and other intelligent information processing methods have been successfully introduced into the fault identification of equipment state. The progress of signal processing technology is related to the development of condition monitoring and fault diagnosis technology, and it is necessary to keep up with the development of signal processing technology and introduce advanced and effective signal processing methods into the condition monitoring and fault diagnosis of power units.
As the study of vibration signals progresses, simple vibration waveforms or two-dimensional intensity spectra are no longer sufficient to meet the practical needs of engineers and technicians in the signal analysis and processing stage. 6 Therefore, efficient and easy-to-use software has become an urgent need for front-line engineers. 7 The software can present the signal in a three-dimensional spectrum according to the power spectrum style, and the signal features are obvious, so the engineers do not need rich engineering knowledge to read and analyze the signal, and can grasp the signal features intuitively and easily to accurately determine the engine operating conditions and realize the health management of the aero-engine.8,9
Materials and methods
Overall system construction
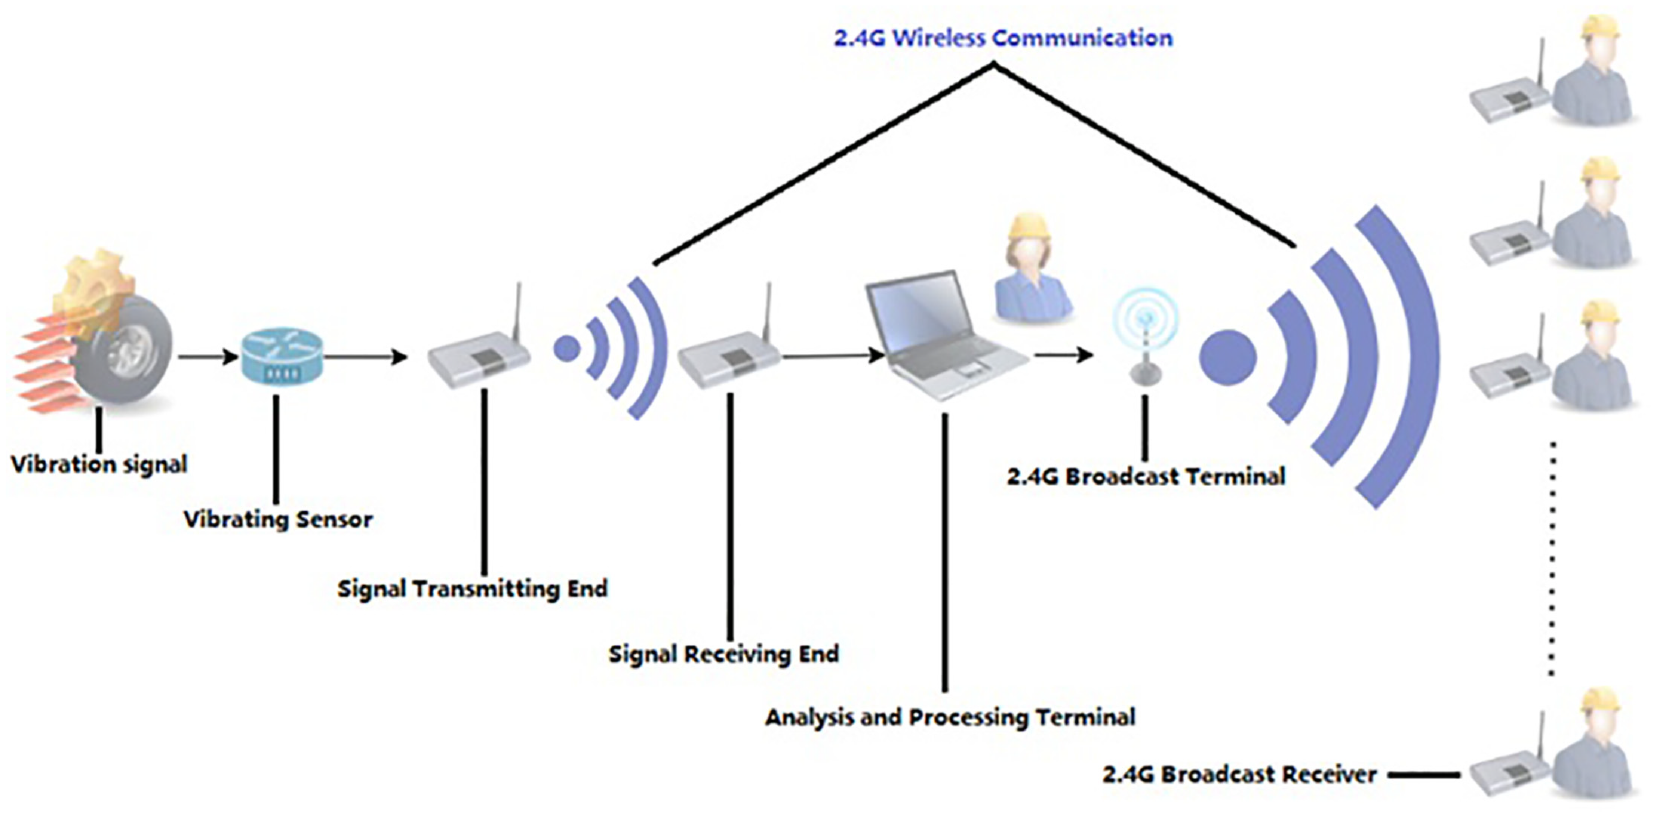
In general, the system is divided into three main parts: signal acquisition, signal wireless transmission, and signal analysis. The details can be seen in Figure 1.
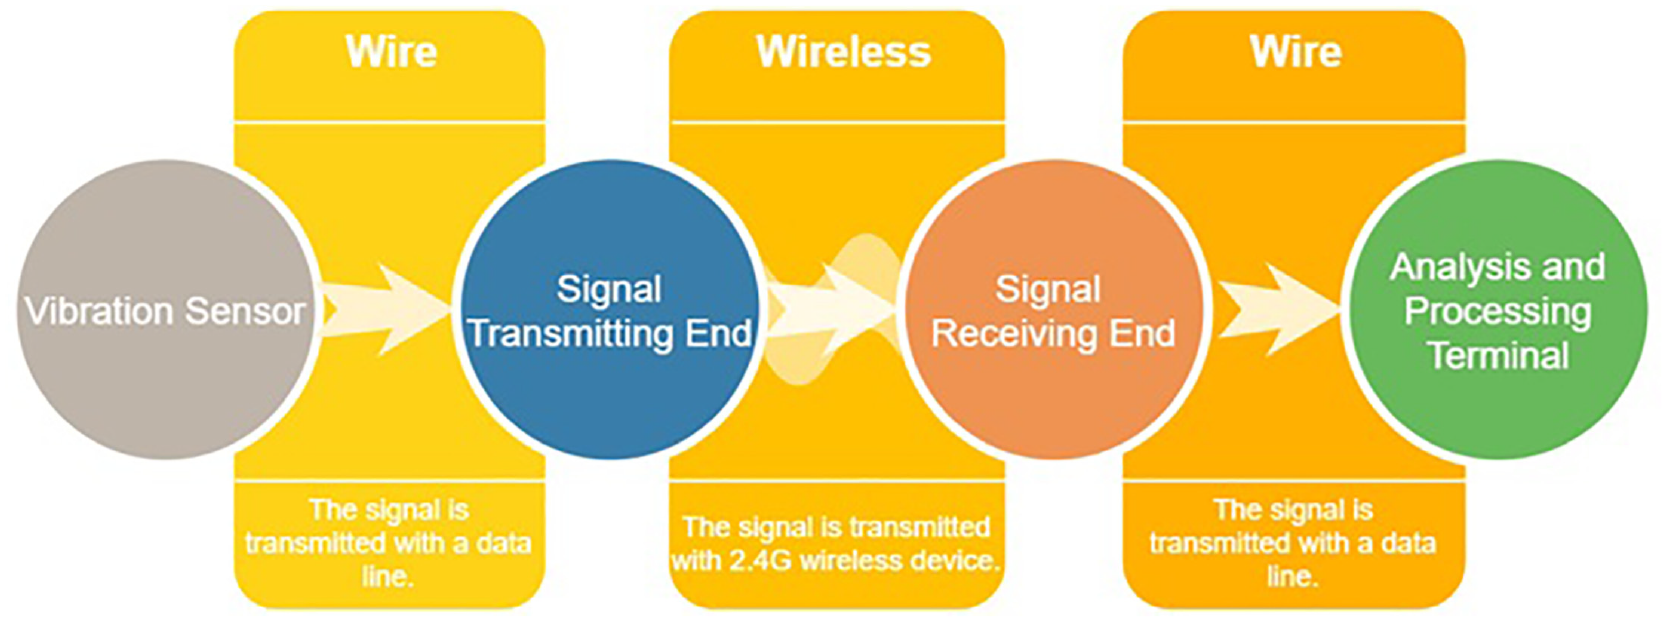
System workflow diagram.
The signal acquisition part consists of a vibration sensor and a wireless signal transmitter, which are connected by wired means. The vibration signal sensor transmits the collected aero-engine vibration signal to the wireless signal transmitter, which then sends it to the wireless signal receiver.
The signal wireless transmission part is designed based on 2.4G communication technology, which has the advantages of strong signal, good cross-barrier ability, and long communication distance, to achieve high-fidelity signal transmission.10,11
After acquiring the vibration signal at the wireless signal receiver, it is input to the computing terminal. The analysis of the signal is carried out with the corresponding program through the signal analysis section. Also, if there is a need for a pedagogical display of the signal, this can be achieved by the built broadcast function.
The design of hardware part
The 2.4G wireless data communication technology is a wireless communication technology that operates in the frequency band between 2.405 and 2.485 GHz and is used in three types of industries: science, medicine, and agriculture (ISM). 12 This band is a free frequency band internationally, which means this type of equipment has a wide range of applications and convenience. 13
The device developed by using a 2.4G module has the characteristics of low power consumption, low cost, fast frequency modulation, forward error correction, automatic verification, and high transmission speed. 14 In particular, compared to Bluetooth devices, the transmission speed of 2.4G devices can be as high as 2M/s; while the maximum transmission speed of Bluetooth devices is only 1M/s. 15 Therefore, the audio transmission device developed using 2.4G can transmit high-quality audio with the highest level of sound quality recognized in the industry – CD level (bit rate 1.4M/s) without loss. 16 This provides a theoretical guarantee for the effective implementation of the program.
Based on this superior feature, the device developed using the 2.4G module can be developed at low cost and mass production while meeting various experimental specifications. This provides strong support for industrialization.
Since the wireless transceiver of the acquisition device is designed based on the Si24R1 chip. To prevent the signal interference caused by the co-channel effect, the ARF-AWA8810 chip is chosen to develop the transceiver terminal of the wireless broadcasting teaching system.
The transmission device developed based on this chip has the following three functions at the same time: one-way transmission of high-fidelity signals; support for two-way communication; and support for two-way control. This means the transmission of vibration signals by the device is not digitally compressed and can realize the wireless high-fidelity transmission for the carried signal, the chip structure diagram is shown in Figure 2.
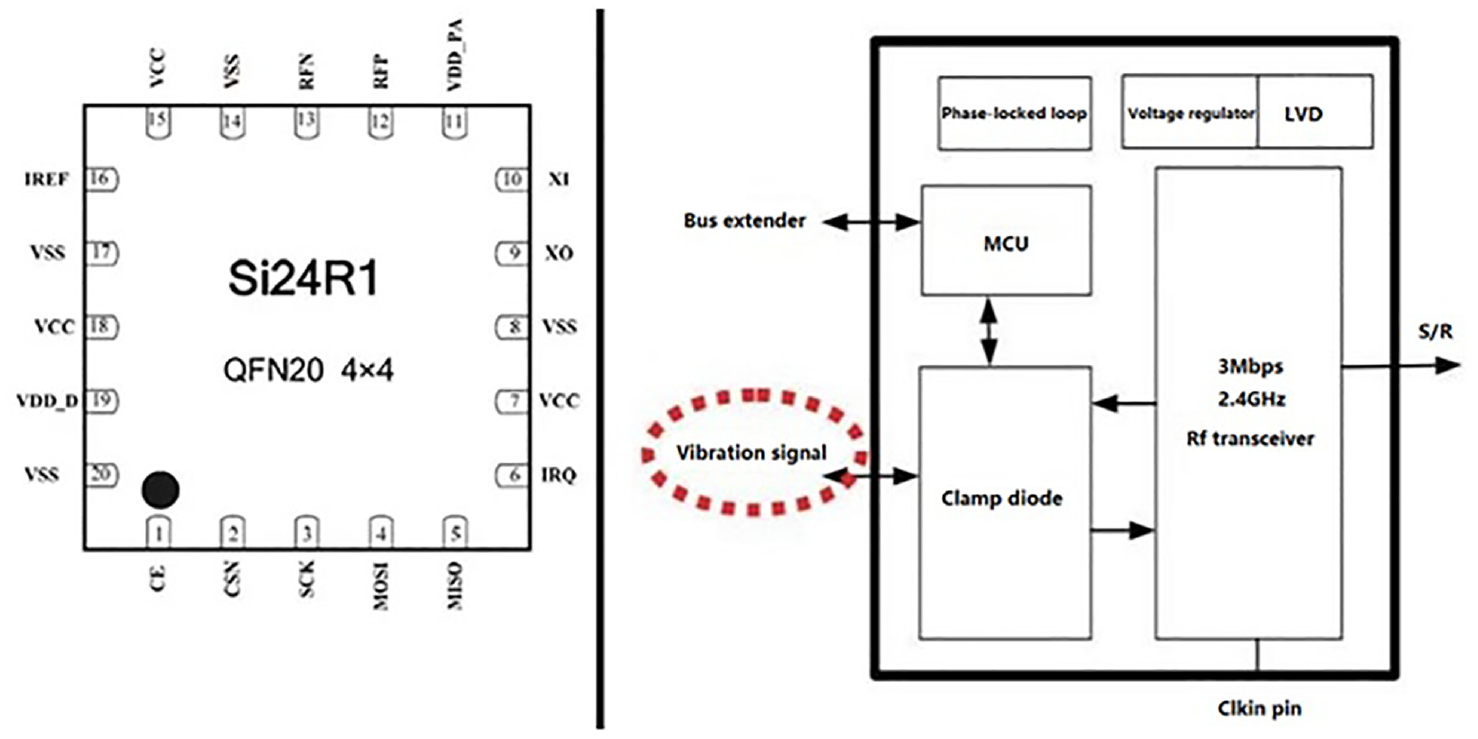
Si24R1 and ARF-AWA8810 wireless transmission chip diagram.
Vibration signal acquisition transmitter
The vibration sensor is HKY-06C produced in Hefei, China. This type of sensor has excellent performance: low power consumption, high sensitivity, high signal-to-noise ratio, strong anti-interference ability, response frequency 1–1500 Hz, covering the frequency band of aero-engine vibration signal. 16 This device is used to analyze signals with a bandwidth between 1 and 1500 Hz.
The Si24R1 chip is used to design a 2.4G wireless transceiver module. 17 The module has 125 operating channels to meet the requirements of multipoint communication, packetization, and frequency hopping. The module has a low operating voltage of 1.9–3.6 V, which makes it easy to drive. Its operating temperature is from −40°C to +85°C, and it is not restricted by the usage area. The physical signal transmission and reception system is shown in Figure 3.
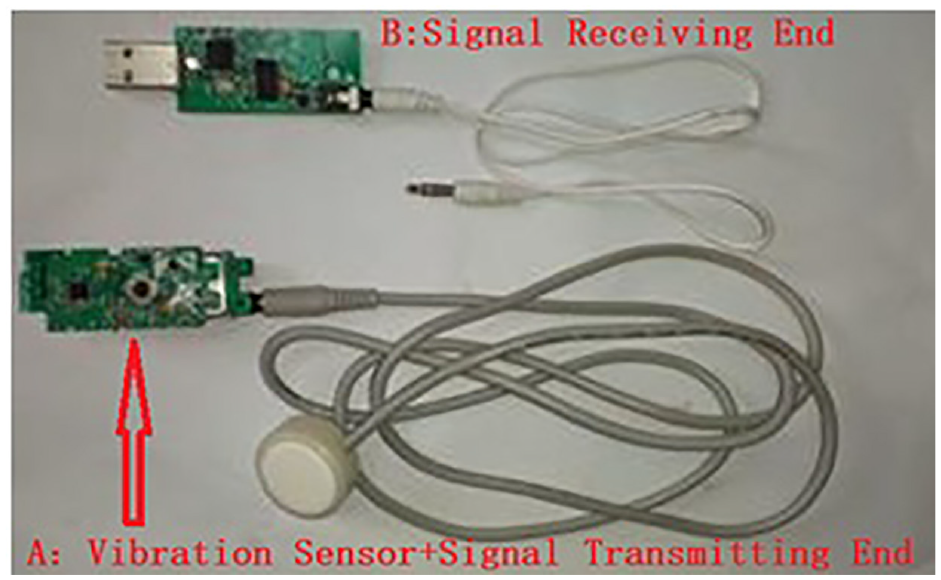
Wireless signal physical diagram of the transmitter and receiver.
Vibration signal receiving and analysis end
The Si24R1-based 2.4G transceiver module is designed to transmit the received vibration signals to the computer’s sound card via a digital audio output module, which is used to synthesize and analyze the sound signals received by the sound card. Due to the excellent performance of high-fidelity transmission and anti-interference of 2.4G technology, the vibration signal collected in this way is of good quality. The physical connection is shown in Figure 4.
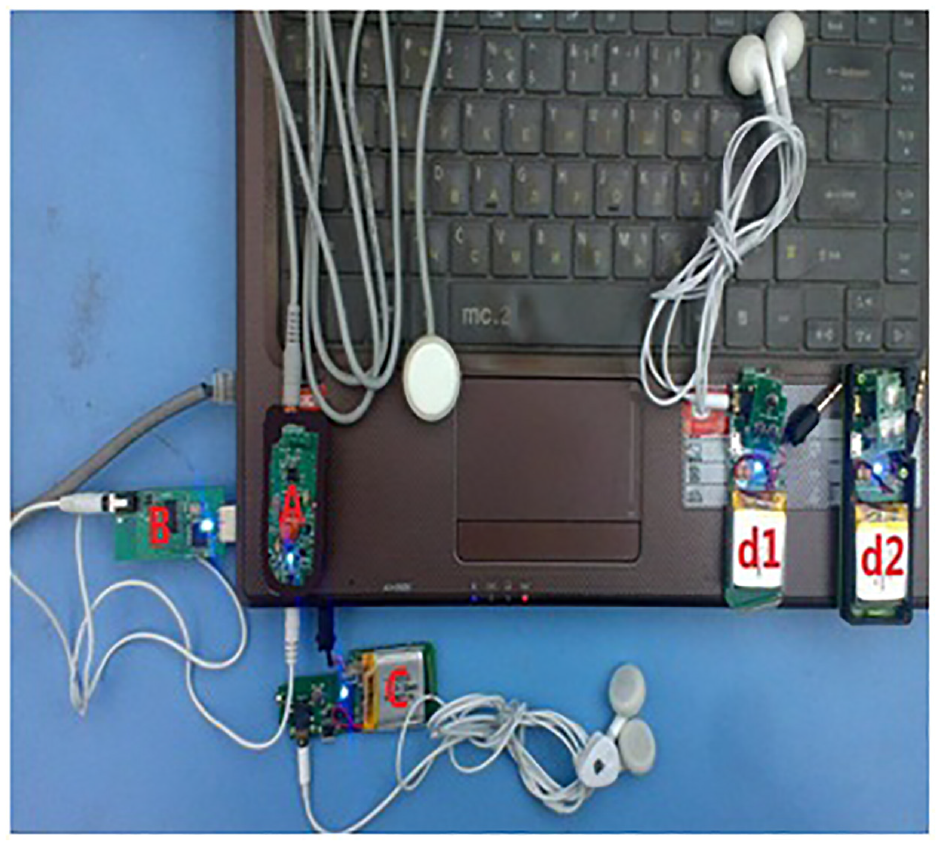
Physical diagram of the system.
As shown in Figure 4, “A” and “B” are wireless high-fidelity vibration signal acquisition/transmission devices designed based on the Si24R1 chip. “A” is a wireless signal transmitter connected to the vibration sensor, from which the collected vibration signal is sent to device “B”. Device “B” is powered by a computer USB and transmits the received vibration signal to the computer sound card via a 3.5 mm audio cable, after which the computer can be used for various processing and analysis operations.
Vibration signal broadcast end
Based on this, the development continues in depth. The vibration signal collected in the computer through the receiver is sent wirelessly to multiple listener receivers with high fidelity to realize the single-in, multiple-out broadcast function.
The main function of the module is to collect vibration signals using a single acquisition sensor, and then obtain acoustic data at multiple signal receivers so that multiple engineering trainees can listen to the signal situation in real-time at the same time. The images of the collected vibration signals are displayed on the computer terminal to assist in the analysis, and the signals can also be stored for recall and analysis. The design schematic of the system is shown in Figure 5.
System function schematic.
According to the product design parameters of this type of integrated device, a transmitter of the wireless signal transmission system developed based on this type of chip can take up to 200 receivers. Such a scale has met the needs of teaching and listening.
As shown in Figure 4, “C,”“d1,” and “d2” are wireless transceiver systems designed based on the ARF-AWA8810 chip. “C” is connected to the audio output port of the computer through a 3.5 mm audio cable, and its earphone can complete the listening to the collected vibration signal. The electret on the device of “C” can complete the function of explaining to the receiver such as “d1” and “d2” in the call mode to achieve the purpose of explaining the lecture. “C” can also send the vibration signal from the computer terminal to “d1” and “d2” in real-time. In this way, the instructor can lecture to the trainee on the vibration signals of “d1” and “d2” transmitted through ‘C’ to achieve the design goal of teaching.
The design of software part
Time series methods have been widely used in natural, social, and technical sciences. 18 With the help of existing or constructed mathematical models, it is possible to study both statistical characteristics of data and grasp the dynamic characteristics of the system, to achieve a connected processing of data, models, and systems. 19
Commonly used stochastic time series analysis methods are divided into two categories: smooth time series analysis (AR model, MA model, ARMA model) and non-smooth time series analysis (ARIMA model and seasonal model). 20 AR model, MA model, and AR-MA model are suitable for smooth time series modeling and forecasting. ARIMA model is suitable for non-smooth time series modeling and forecasting. The SARIMA model is suitable for time series analysis and modeling with seasonal cyclical characteristics.
Design analysis
In modern engineering practice, mathematical modeling of the object of study is a common tool. 21 The object under study can be represented as a mathematical expression; at the same time, sufficient parameters are available to allow the object to be accurately portrayed. 22
The main idea of the parametric model method is as follows.
23
First, an input sequence u(n) excites the linear system H(z) to output x(n), which is the process under study, as shown in Figure 6. Second, the parameters of H(z) are estimated from the known x(n) or autocorrelation function
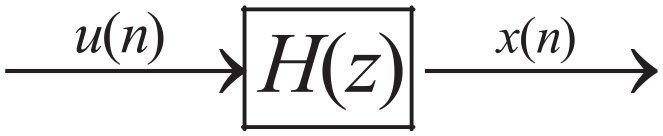
Schematic diagram of the parametric model.
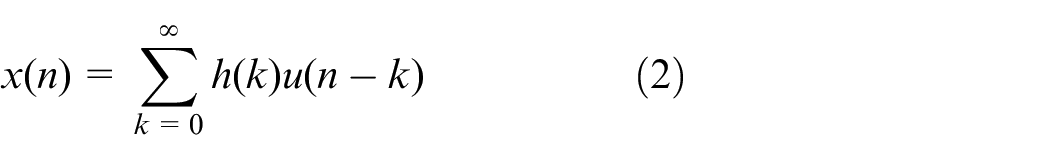
Figure 6 shows that H(z) is a linear shift-invariant discrete-time system with a unit sampling response u(n). The output sequence x(n) can be either a smooth random sequence or a deterministic time series. If x(n) is deterministic, then u(n) is an impulsive sequence; if x(n) is random, then u(n) is a white noise sequence.
The input and output relationship, as shown below, is not limited by whether the signal is deterministic or random.
A(z), B(z) zeros are within the unit circle, then it is to ensure that H(z) is a stable minimum phase system.
Set u(n) to be a white noise sequence with variance

If the excitation white noise variance
Time series methods can be divided into autoregressive (AR) models, sliding average (MA) models and autoregressive-sliding average (ARMA) models according to the form of the parameters, which are all parametric model-based analysis methods. 26 The estimation of parameters by AR models can be achieved by solving a set of linear equations. 27 The MA and ARMA models require the solution of higher-order nonlinear equations to estimate the power spectrum.
Autoregressive model
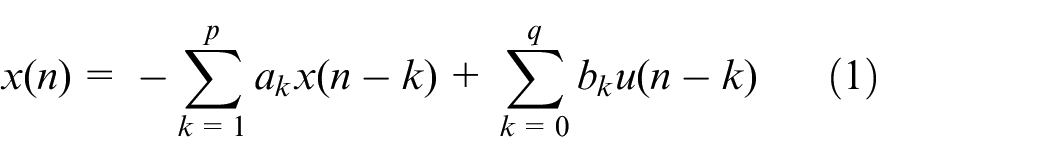
Autoregressive model, also known as Auto-Regressive (AR) model. 28 As seen in the following equation, it indicates that the present output is a weighted sum of the present input and the past p outputs.
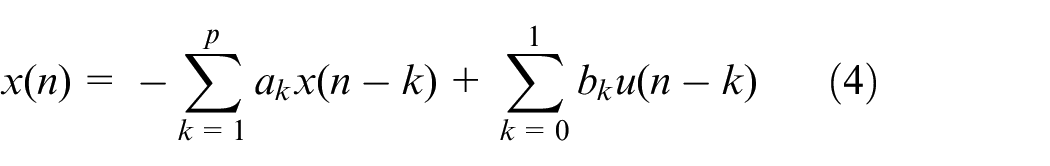
The model has both poles and zeros, as seen in equation (4).
The power spectrum encountered in engineering practice is broadly divided into three kinds29,30. One is the spectrum of white noise; the other is the power spectrum composed of one or more pure sinusoidal signals. The above are two extreme cases. There is also a spectrum with both peaks and valleys, between the above cases, called: the “ARMA” spectrum. Since the expression of the ARMA model has both poles and zeros, it is beneficial to reflect the peaks and valleys in the power spectrum. At the same time, the expression of the model shows that the AR model is easy to reflect the peak of the spectrum, while the MA model is easy to reflect the valley of the spectrum.
Modeling applications
The application scenario requires a reliable and efficient operation, so the Burg algorithm of the AR model is chosen to solve the problem.
The algorithm, proposed by J. P. Burg, is a recursive algorithm that computes power spectrum estimates directly from a known time signal sequence.
31
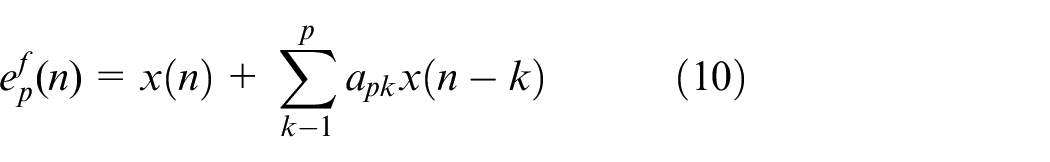
The implementation principle is: let x(n),n = 0, 1…, M−1 be the observed signal at the receiver, the length of the observed data is M, the forward prediction mismeasurement power is
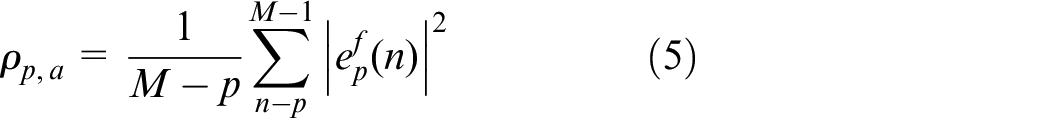
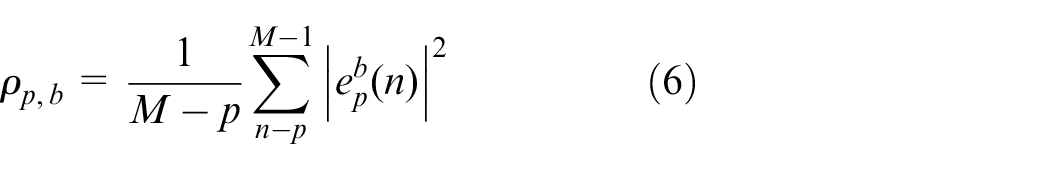
The corresponding errors are derived as follows.
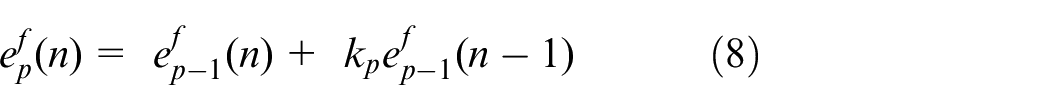
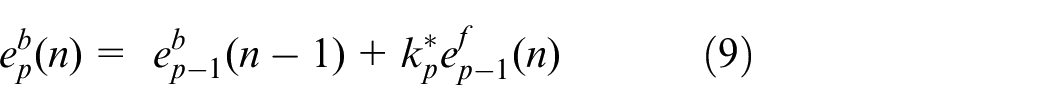
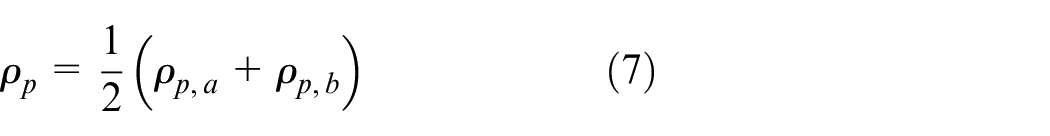
Then there is:
As shown in Figure 7, the flow is solved with the Burg algorithm of the AR model. Using this algorithm, only a finite length time signal sequence needs to be known without calculating its autocorrelation function value, and the resulting solution is stable. This works well for power spectrum estimation of shorter data sequences.
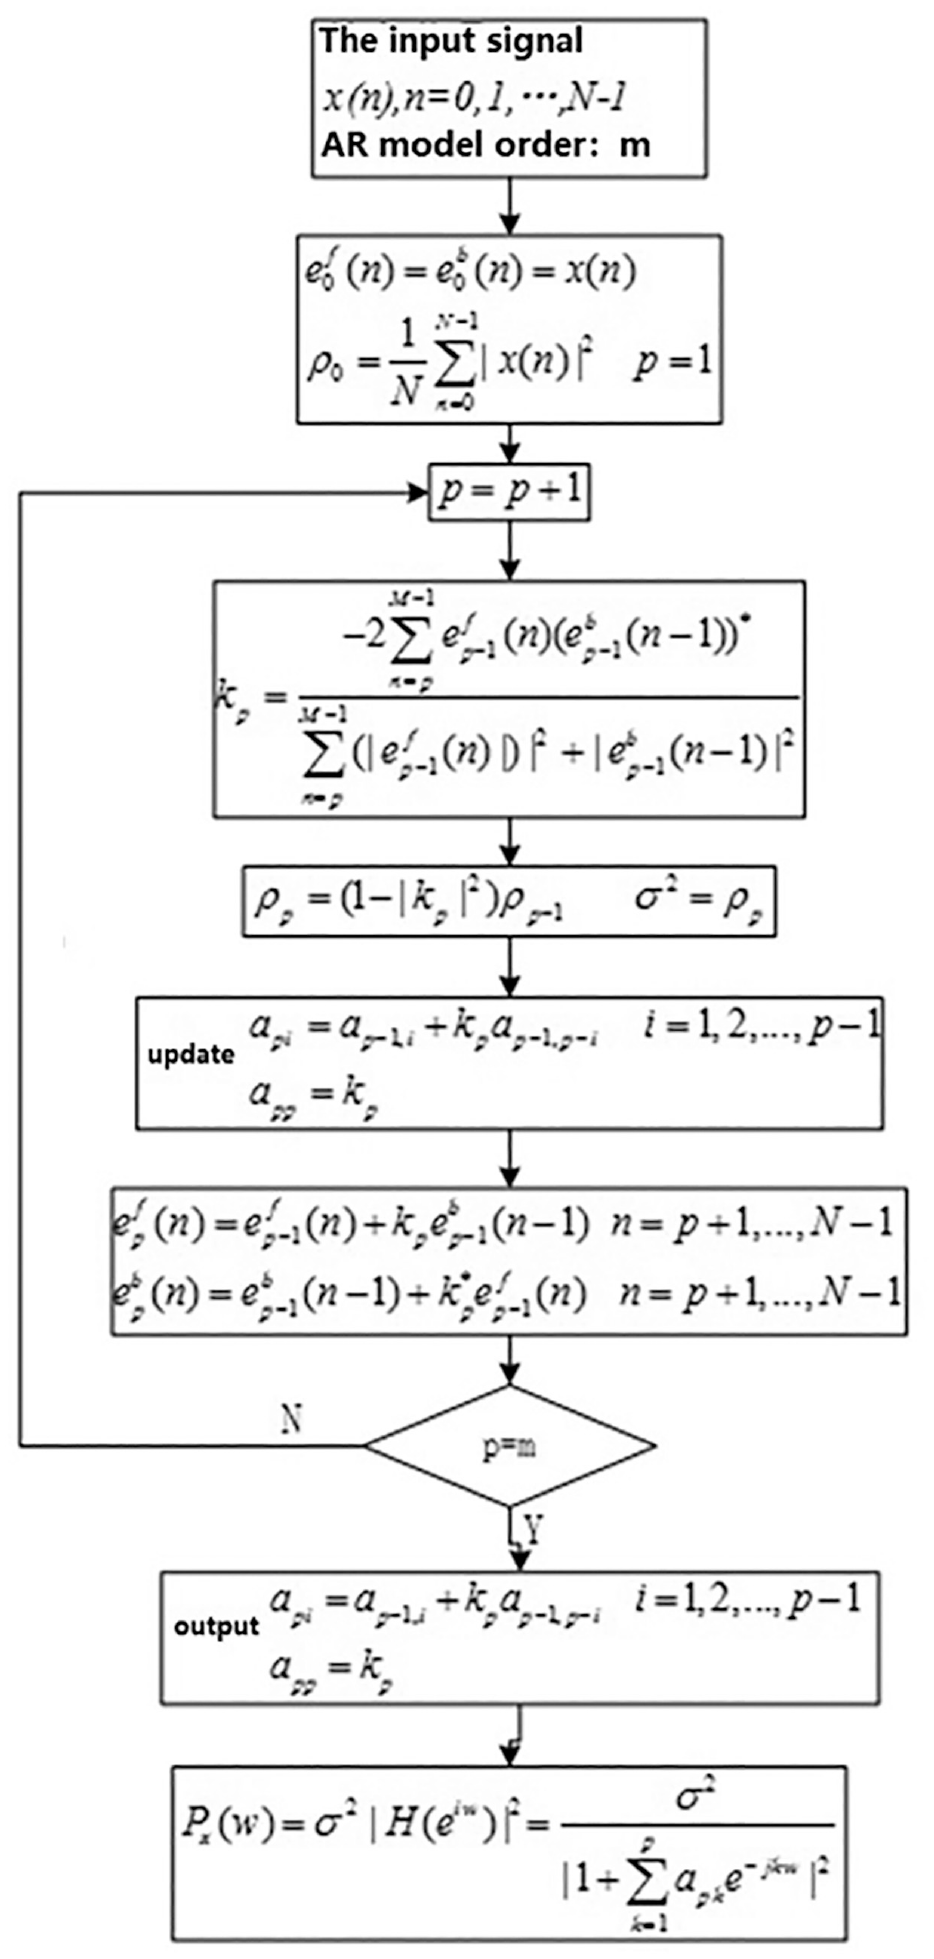
Flow of applying AR model Burg algorithm to solve.
In this regard, LabVIEW2022 is used to program the design according to the above-mentioned model construction. Because of the unique graphical programing function of LabVIEW2022 and the call interface with MATLAB and other tools, it has good programing compatibility and is relatively easy to call and operate programs written in different types of languages. The program panel of this design is shown in Figure 8.
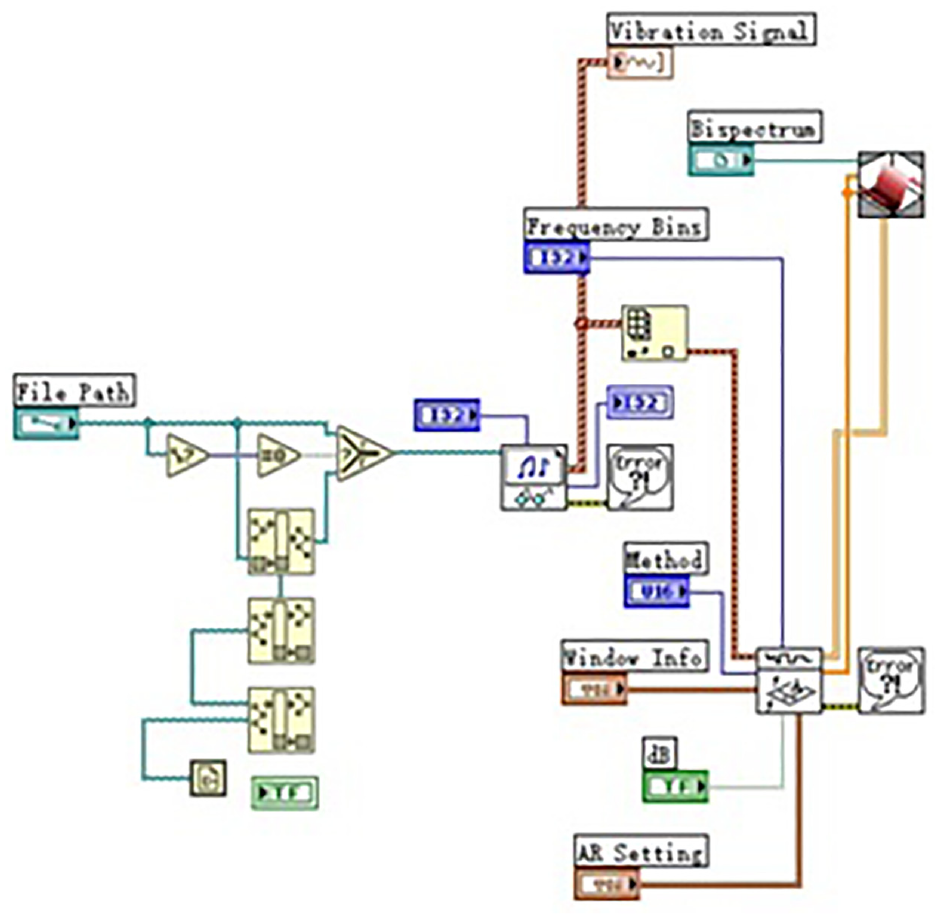
Program panel design diagram.
Results and discussion
The sampling rate of the system is set to 48 kHz. The corresponding signal is encoded and stored in WMA format. The SNR of the system is 95 dB when the signal being processed is between 20 and 1500 Hz.
An aero-engine is used as the test object, and the test environment is on the ground bench. Its vibration signals under different operation modes are collected by sensors for analysis and comparison. In Figures 9 and 10, the vibration waveform of the signal is represented as a blue line graph, while the following graph corresponds to the power mapping of this signal based on the AR model Burg algorithm. By applying the autoregressive model, this design successfully shifts the signal from a two-dimensional plane to a three-dimensional plot, which makes the features carried by the signal more easily presented and provides convenience for engineering researchers.
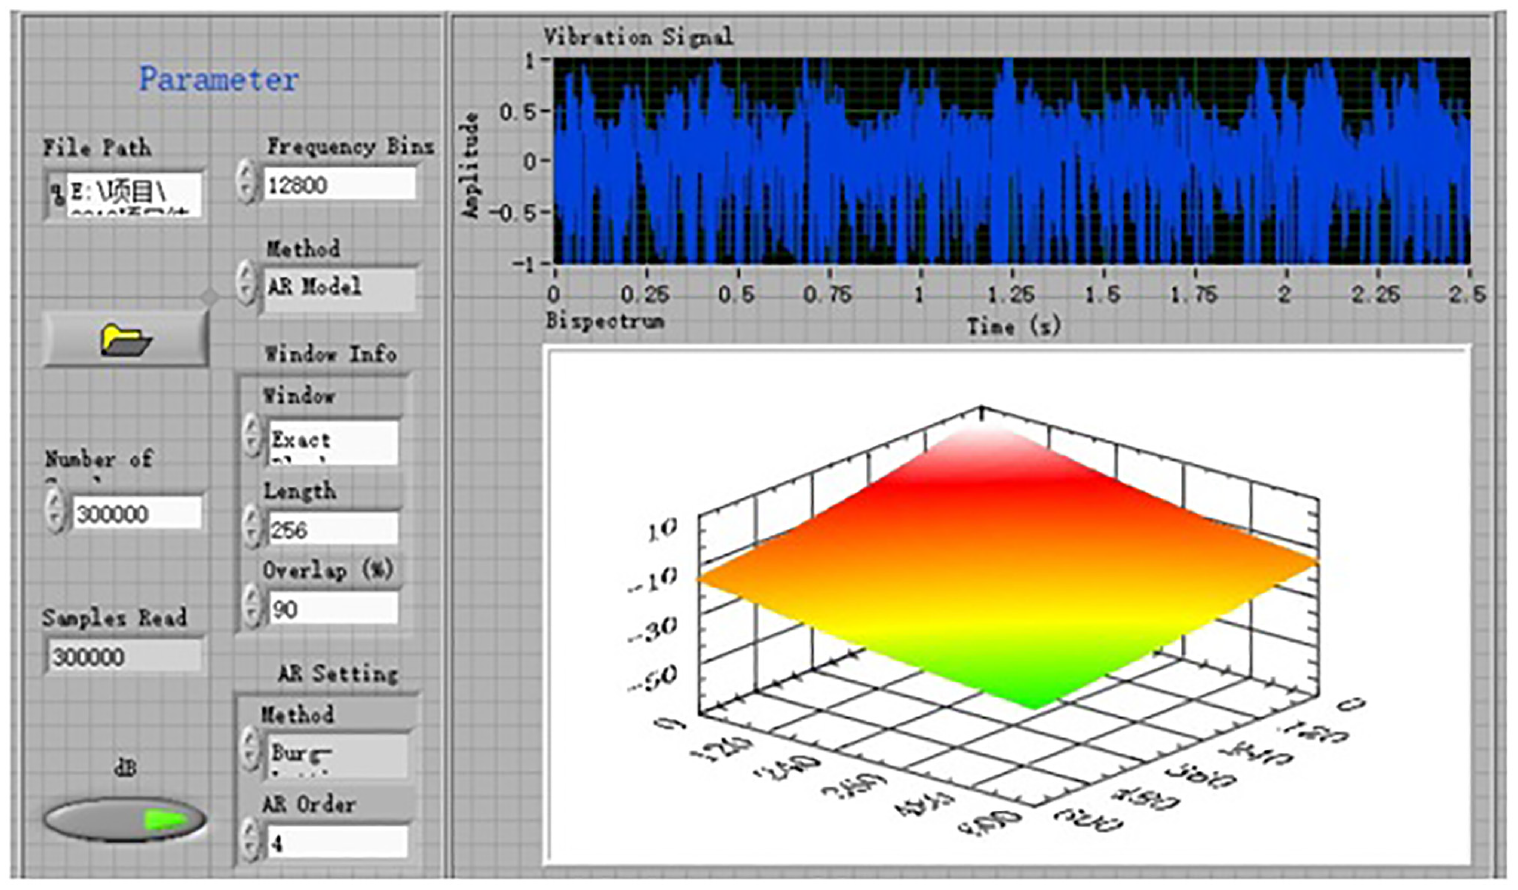
Results of the operation of signal “A.”
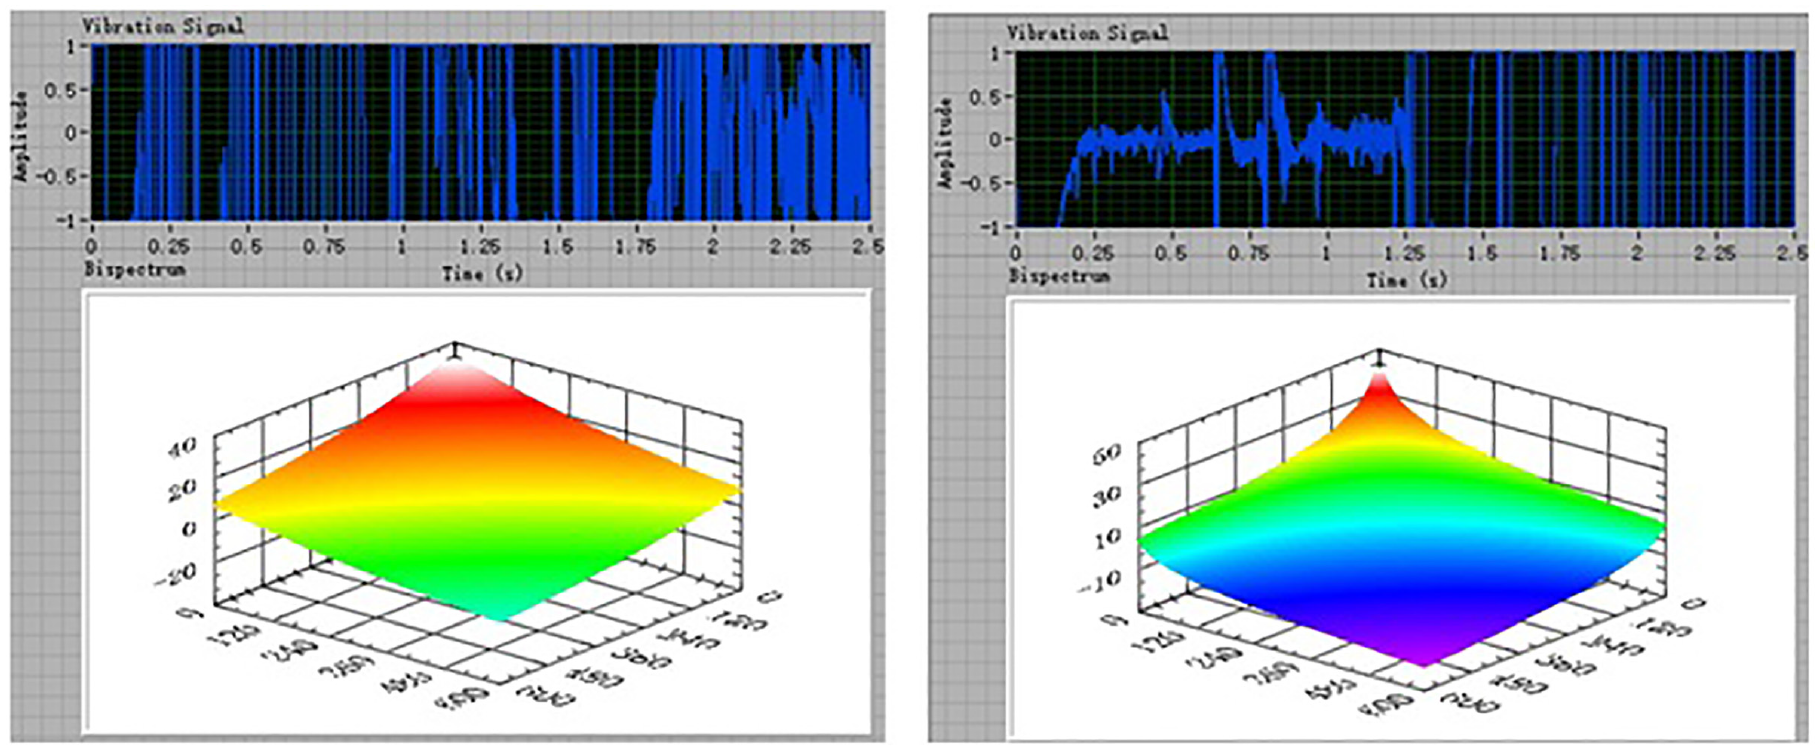
Results of the operation of signal “B” (left) and the operation of signal “C” (right).
Figures 8 and 9 show the following situations. Signal A is the engine vibration signal at standard cruise speed, which we use as the normal reference signal. Signal B is the vibration condition when the engine rotor is destabilized. Signal C is the vibration condition when the engine oil circuit is blocked, resulting in a poor oil supply.
All three spectrograms present different identification features. By comparing the spectral shapes presented by abnormal and normal signals under this method, the great difference between abnormal and normal signals can be found; meanwhile, the differences between different abnormal signals can also be presented in this way. In this way, the purpose of monitoring the unit status and assisting with fault diagnosis is achieved.
All the above plots are generated by signals with different characteristics under the same parameter settings. The respective state characteristics are evident from the style of the power plots and can be interpreted from the physical and mathematical points of view in the context of the actual situation. The value of the present method in the detection of such vibration signals is shown.
Conclusions
Through practice, it has been proved that the wireless acquisition and transmission method of vibration signals in the system has met the design requirements. It frees the measurer from the constraints of wired measurements and will make the acquisition and analysis of vibration signals of aero engines during ground test runs much easier.
This system successfully applies the Burg algorithm to the analysis of vibration signals through the constructed autoregressive model and the functions programed with LabVIEW2022. The operation interface is friendly and the characteristics of the experimental results are obvious so that even operators who do not know vibration science at the time can easily interpret the vibration patterns. This demonstrates the practicality and application prospect of this tool.
In the future engineering application practice, we will continue to deepen the research of this method. We aim to use machine intelligence comparison technology to replace manual judgment, to more efficiently determine the abnormal situation of power spectrum shape, and achieve the purpose of fault detection, diagnosis, and even prediction.
Footnotes
Acknowledgements
We would like to express our deep gratitude for the strong support provided by the School of Energy and Power, Nanjing University of Aeronautics and Astronautics!
Author contributions
Methodology, Mai Xin, Zhifeng Ye; software analysis, Mai Xin, Xiong Pan, Xing Liu; validation, Mai Xin, Zhifeng Ye; formal analysis, Mai Xin; investigation, Mai Xin; data curation, Mai Xin; writing—original draft preparation, Mai Xin; writing—review and editing, Mai Xin, Zhifeng Ye; supervision, Zhifeng Ye; project administration, Zhifeng Ye. All authors have read and agreed to the published version of the manuscript.
Declaration of conflicting interests
The author(s) declared no potential conflicts of interest with respect to the research, authorship, and/or publication of this article.
Funding
The author(s) disclosed receipt of the following financial support for the research, authorship, and/or publication of this article: This research is supported by “Innovation Fund for Doctoral Students of Nanjing University of Aeronautics and Astronautics.”