
Abstract
In this paper, two wind power farms are proposed to produce the active power using two variable profiles of the wind and to be closer to real conditions. Indeed, in order to ensure the proper functioning of the electrical power system, two FACTS devices are installed in series between buses 1 and 3, separately. The effects of disturbances, in the form of variable profiles of the wind, affecting the voltages and frequencies in the IEEE 14-bus system are studied. After simulation, good results are obtained in terms of the overall stability of the electrical energy system despite the use of two variable profiles of the wind. The found results prove, both, the voltage errors in each bus, and, the losses in each line by installing of the FACTS. In addition, the harmonics created by the wind disturbances are limited.
Keywords
Introduction
The grid structure has gotten increasingly complicated in recent years because of the widespread use of smart grids and distributed energy sources such as wind power and photovoltaics. At the same time, the integration of clean energy into the distribution network becomes important to the distribution network’s stability. Indeed, in the reality, each static converter or inverter itself create harmonics that can cause an intense perturbation in the whole system. Thus, the installation of filters is required. In our work, we are going to show different harmonics that have considerable effects on the power grid. 1 For this reason, the need of nonlinear power electronic equipment increases and, unfortunately, becomes great challenges to the grid structure and the safe operation of the distribution network. 2
Flexible AC Transmission Systems (FACTS) are high power electronic devices that are widely utilized across the world to provide numerous benefits to electric power networks. FACTS may control the dynamic voltage, improve steady-state and transient stability. Also, these components increase the damping of power oscillations, prevent the voltage instability, and stabilize some critical motors. In addition, by integrating FACTS, we can mitigate subsynchronous resonance and improve high voltage DC converter performance. Finally, FACTS may ameliorate the power factor of the electrical smart grid.1–14
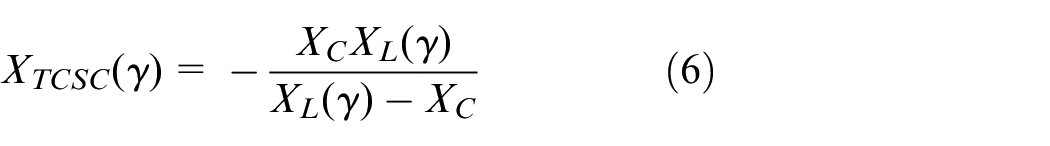
FACTS are classified into three categories: series compensators, parallel compensators, and hybrid compensators, (parallel series). In this paper, we are focusing on series compensators.
The series compensators are adopted to act on the flow of power through the lines. In the literature, it is placed in most applications in the middle of the line to be controlled. The idea is to essentially modify the matrix of nodal admittances of the network. 15
Several authors have presented this type of compensation. Indeed, in Preetha and Kumar 16 the author used TCSC (Thyristor Controlled Series Capacitor) and SSSC (Static Synchronous Series Compensator) controller for maintaining the voltage stability. In Dhoble and Bhandakkar 17 the series compensation for the management of power flow control used to improve the performance of the power system. This paper proposed the superior ability can only be achieved by appropriate control scheme and controller setting.
In Zhang and Zhang 18 the paper presents a novel power injection model of SSSC for power flow analysis. In this model, the complex impedance of the series coupling transformer and the line charging susceptance are all included.
In Qurratul et al. 19 in 2020, the paper addresses the modelling and operation of SSSC and TCSC controller in a multi-machine environment. The comparison shows that the Power System Stabilizers (PSS) assisted SSSC controllers mitigate the power system oscillations more rapidly than earlier and thereby enhancing the overall operation of the controller to stabilize the given system effectively.
In Suraj and Ashwin 20 in 2023, the paper discusses the operational concepts and applications of FACTS in power systems such as the Static Var Compensator (SVC) and the SSSC. When combined with the other devices, the effectiveness of each individual device is increased. This paper proposes the coordinated control of SVC and SSSC to improve system stability. The steady-state response of the system is faster when SVC and SSSC coordinated control is employed compared to a single device.
In Marouani et al. 21 in 2023, the paper provides a performance comparison of the various optimization techniques that have been used in published works in this field.
In References 22–25, the authors presented terms and definitions of FACTS. Steady-state modeling of SVC and TCSC for power flow analysis, control, and solutions with multiple and multi-type FACTS devices.
The problem addressed in this paper is to study the integration of wind energy sources into the grid. By presenting, the disturbances at network level following the integration of renewable energy especially if they are not controlled with devices ensuring the monitoring of fluctuations of injected power, or disturbances at the voltage amplitudes and frequency levels that are the origin of the electrical quantities, provided by the wind generators that are in fatal relations with the variation of the wind speed. As a solution, we propose, in this paper, the use of SSSC and TCSC compensation tools, which have shown their effectiveness in limiting all disturbances.
In this work, two wind power farms are proposed to produce the active power using two variable profiles of the wind and to be closer to real conditions. So, we have presented a comparative study between two series FACTS devices are SSSC and TCSC installed separately in IEEE 14 bus power grid that contains two wind farms under different wind profiles. The obtained results show the performance of each device to drop the perturbation due to the wind speed variation. We have illustrated the evolution voltage magnitudes as well as the different electrical powers. In addition, the frequency and the injected harmonic caused by the FACTS devices were shown too. Additionally, the reducing lost line powers were presented. Moreover, the stability condition was in order to indicate the most sensible bus that engenders the instability of the grid.
This study demonstrates the performance of the TCSC against the SSSC device in the re-obtaining of dynamic performance of the power grid and the law injected harmonics as well as in reducing of power lost. As a continuity of the field, the next paper will treat shunt device and their response in order to enhance the grid performance.
This article is structured as follows. The Section “Modeling of FACTS devices” presents the serial FACTS. In Section “Studied model,” a Test IEEE 14-bus system is studied. The effect of FACTS systems is detailed in Section “Simulation results and discussion” and the Section “Dynamic stability of the power grid” presents the dynamic stability of the used network. The conclusions are stated in Section “Conclusion.”
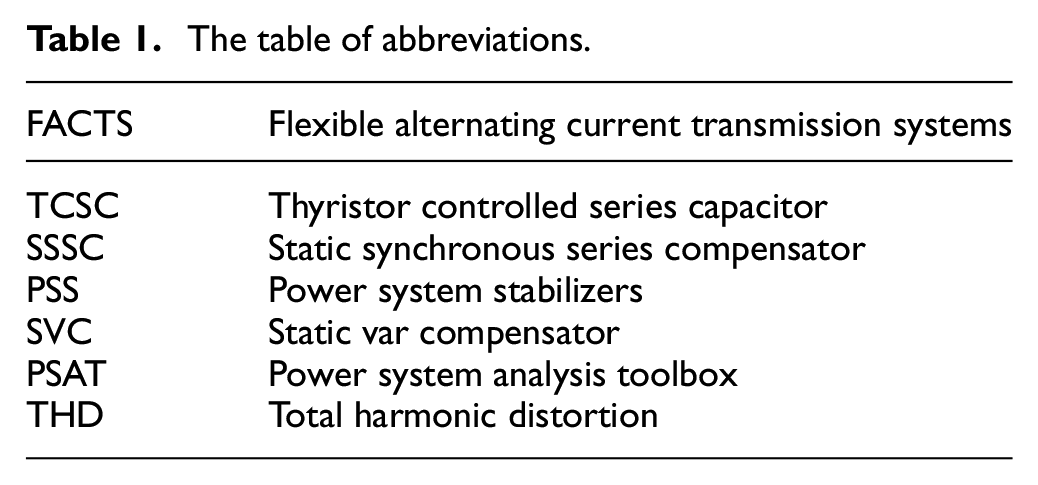
All abbreviations are explained in Table 1.
The table of abbreviations.
Modeling of FACTS devices
SSSC and TCSC are the series compensation devices that are used to enhance the loading capability and power flow of the line.
The static synchronous series compensator (SSSC)
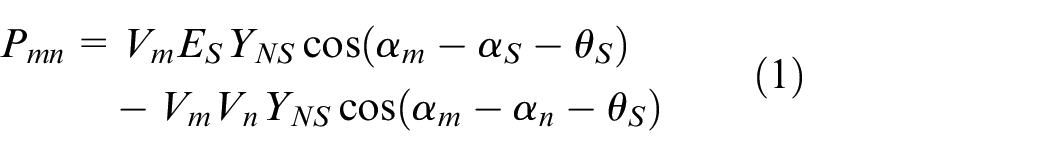
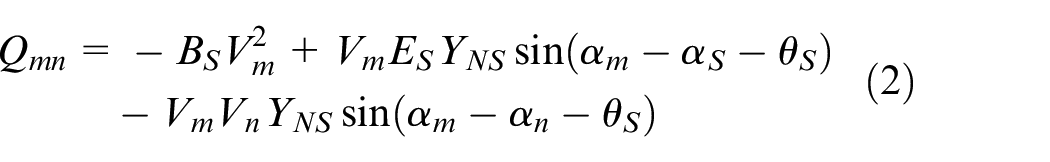
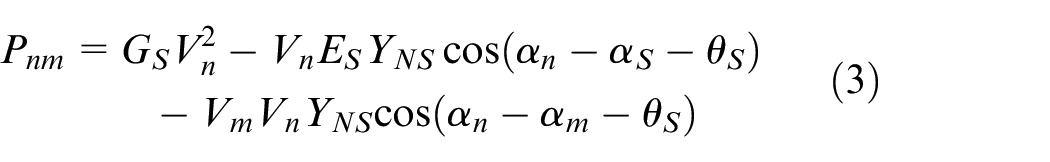
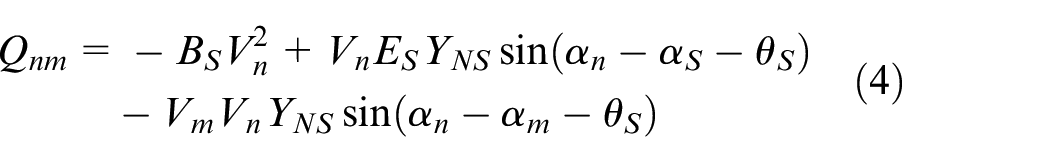
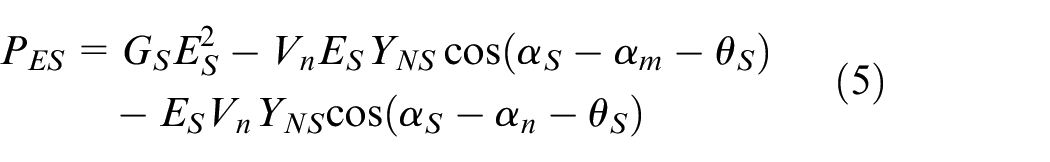
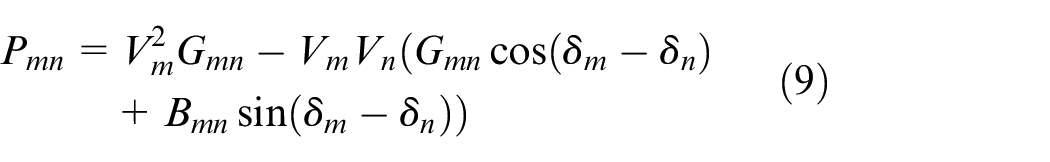
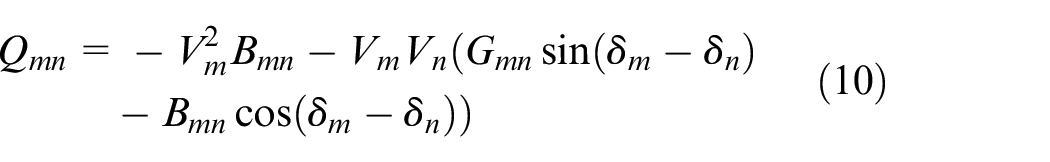
The static synchronous series compensator (SSSC), is a static synchronous generator operating without any external source of energy. It acts as a static compensator. Its voltage is controlled separately from the line current where it is installed. This system really has two objectives which are of a strongly related nature. The first is to reduce the voltage drop of the line comprised by the nodes between which the device is connected. The second objective is the adjustment of the transmitted power. The figure 1 shows the synoptic model of a SSSC between two nodes of a transport line.
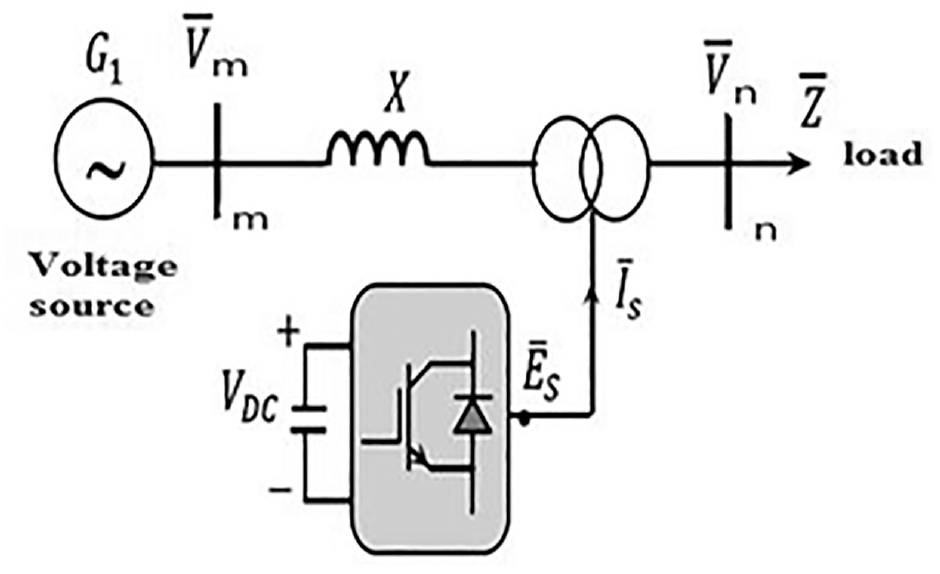
Synoptic model of SSSC.
A schematic model of a SSSC placed in a transport line phase is given in the following figure 2.
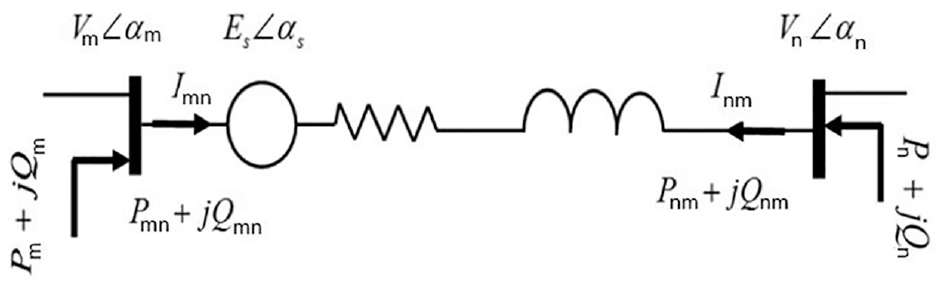
The model of SSSC.
According to Suraj and Ashwin, 20 the injected power expressions are given as follows:
The model of thyristor-controlled series compensator (TCSC)
The topology of a TCSC is presented in Figure 3.
23
The TCSC is composed of a fixed series of capacitors (
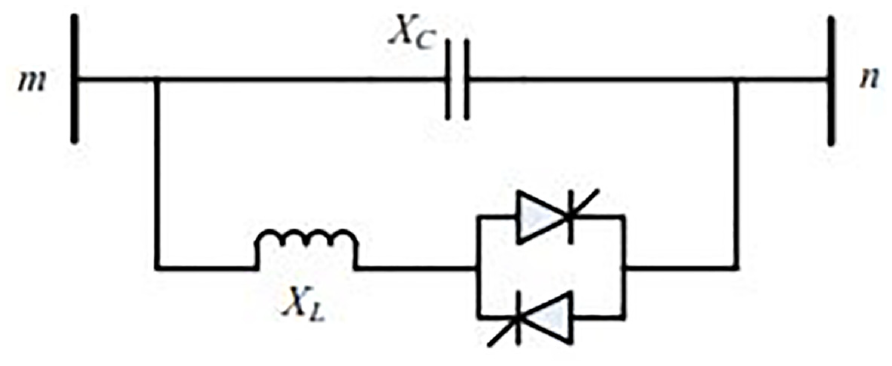
Topology of a TCSC placed in a phase of a transport line.
A schematic model of a TCSC placed in a transport line phase is given in the following figure 4.
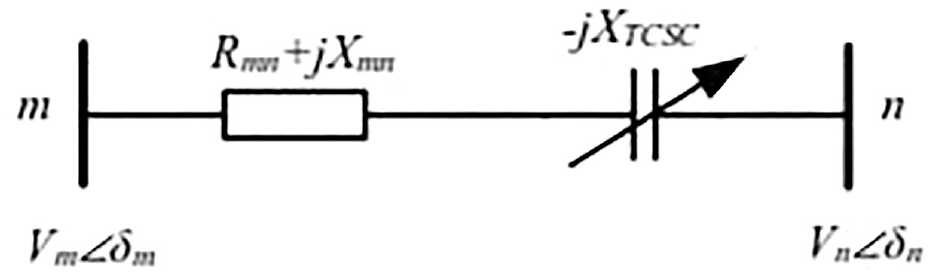
The model of TCSC
Where the voltage magnitude at
Making use of a changeable inductive reactance
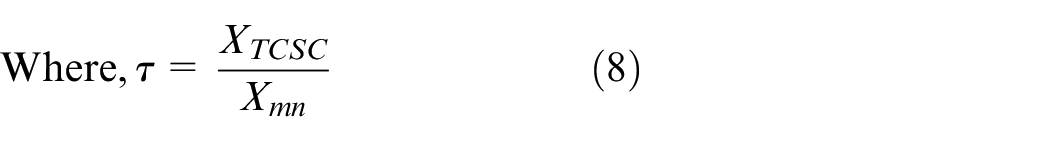
After incorporating TCSC, supposed installed between

According to Ashraf et al. 24 , the injected power expressions are given as follows:
Where the voltage magnitude at
With
Studied model
The suggested network must be designed in order to be regarded the base of work for researching and analyzing the dynamical operation of TCSC and SSSC FACTS devices, and the devices described above are linked to it independently. Figure 5 depicts the IEEE 14-bus standard system derived from Sameh and Claudio. 1 It is composed of five synchronous alternators, the polar wheels of which are driven by exciters. They are driven by mechanical systems providing an invariant rotation speed of the inductor.
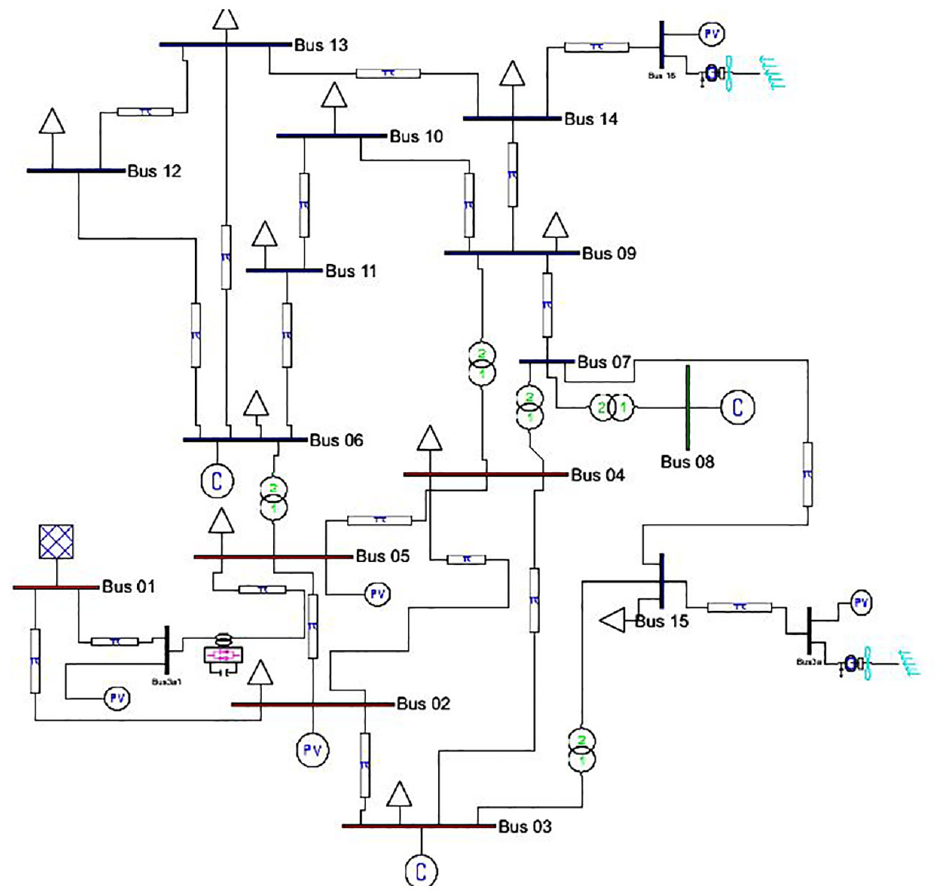
IEEE 14-bus system with the association of two wind turbines using FACTS.
The IEEE 14-bus system was investigated using the PSAT program to acquire the system P-V curves and to conduct time domain and eigenvalue studies to investigate the overall performance of the system.
FACTS devices, like TCSC and SSSC controllers, were installed between buses 1 and 3 because the system was stable in that configuration. These devices were added to the system, as shown in Figure 5, to investigate their influence in the system and their interactions. The next sections go through the model’s specifics. Each turbine assigns a rated output of 3 MW. A wind farm with 25 turbines is connected to bus 12, while a field with 20 turbines is connected to bus 14.
In this system, two wind farms based on asynchronous generators with a total power of 150 MW for each of them were installed on 12 and 14 looking for the most active power consumed was in these busses, Figure 5. Different wind profiles were applied using two different speeds based on the Weibull distribution, Figure 6.
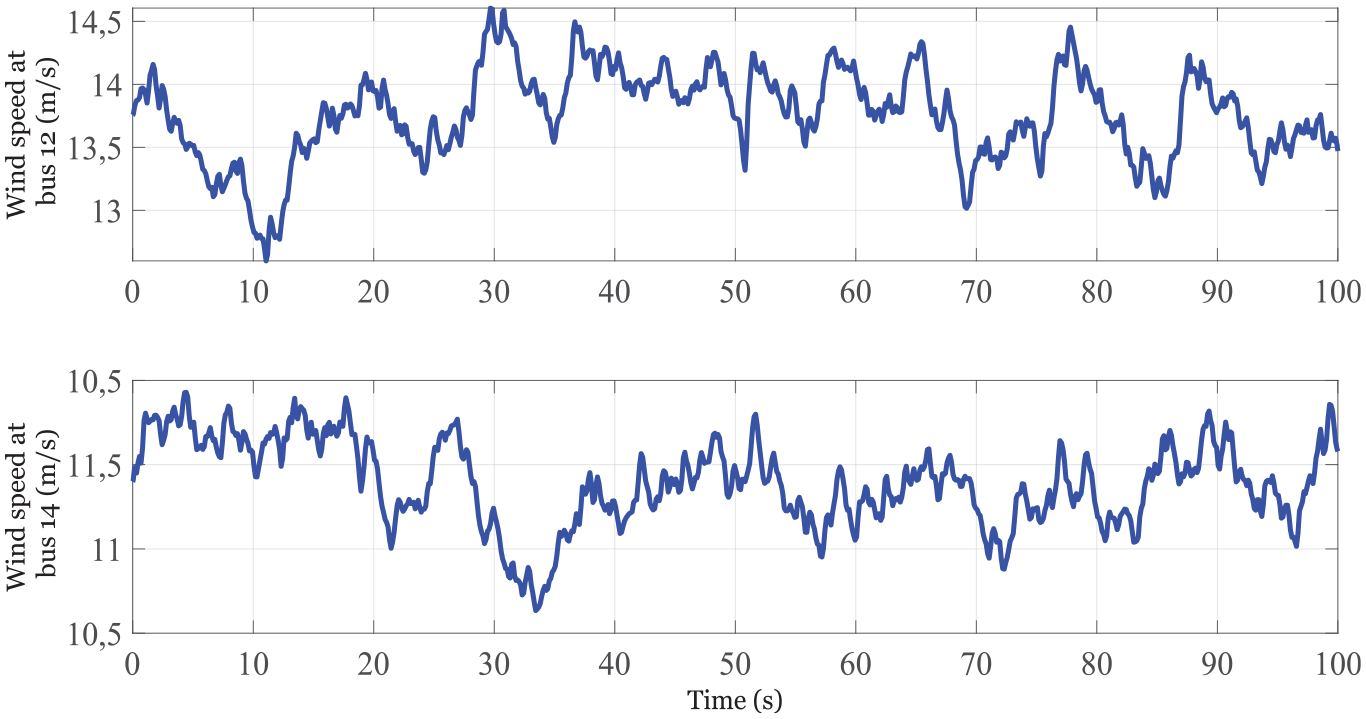
Wind profiles applied to wind turbines.
Table 2 shows vital indices for the essential elements forming the network.
Requirements for grid-installed alternators.
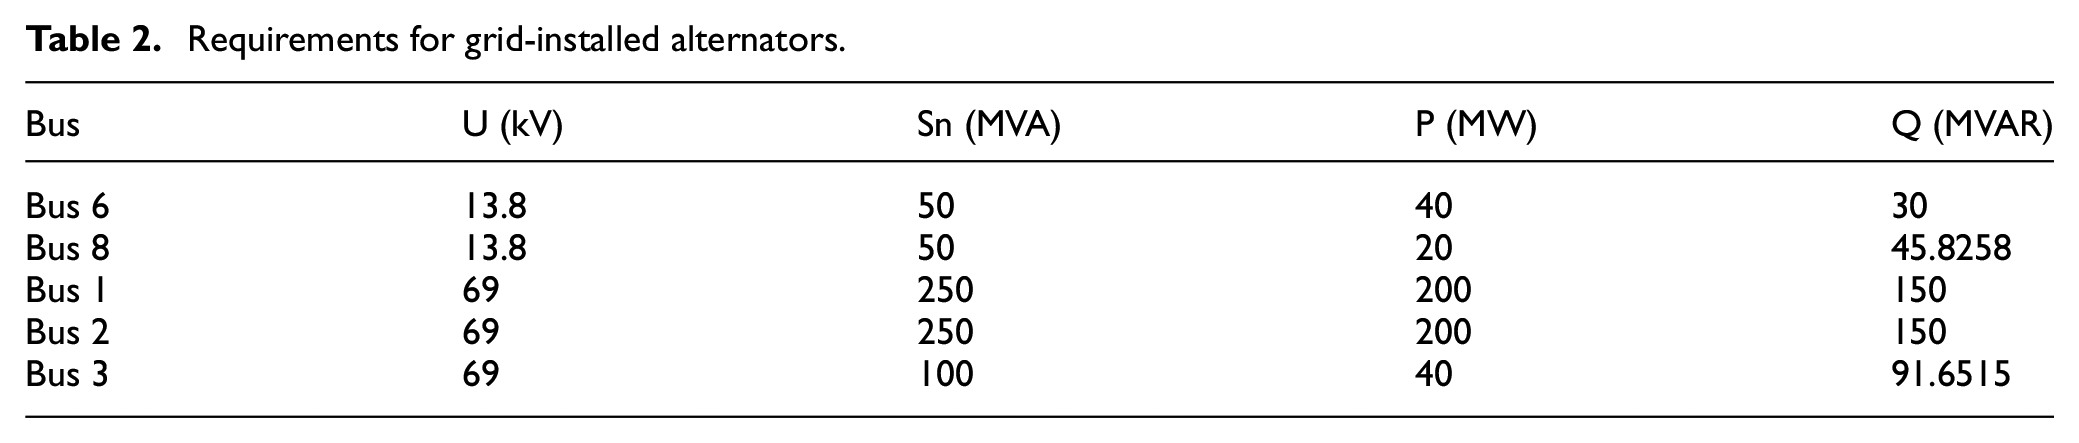
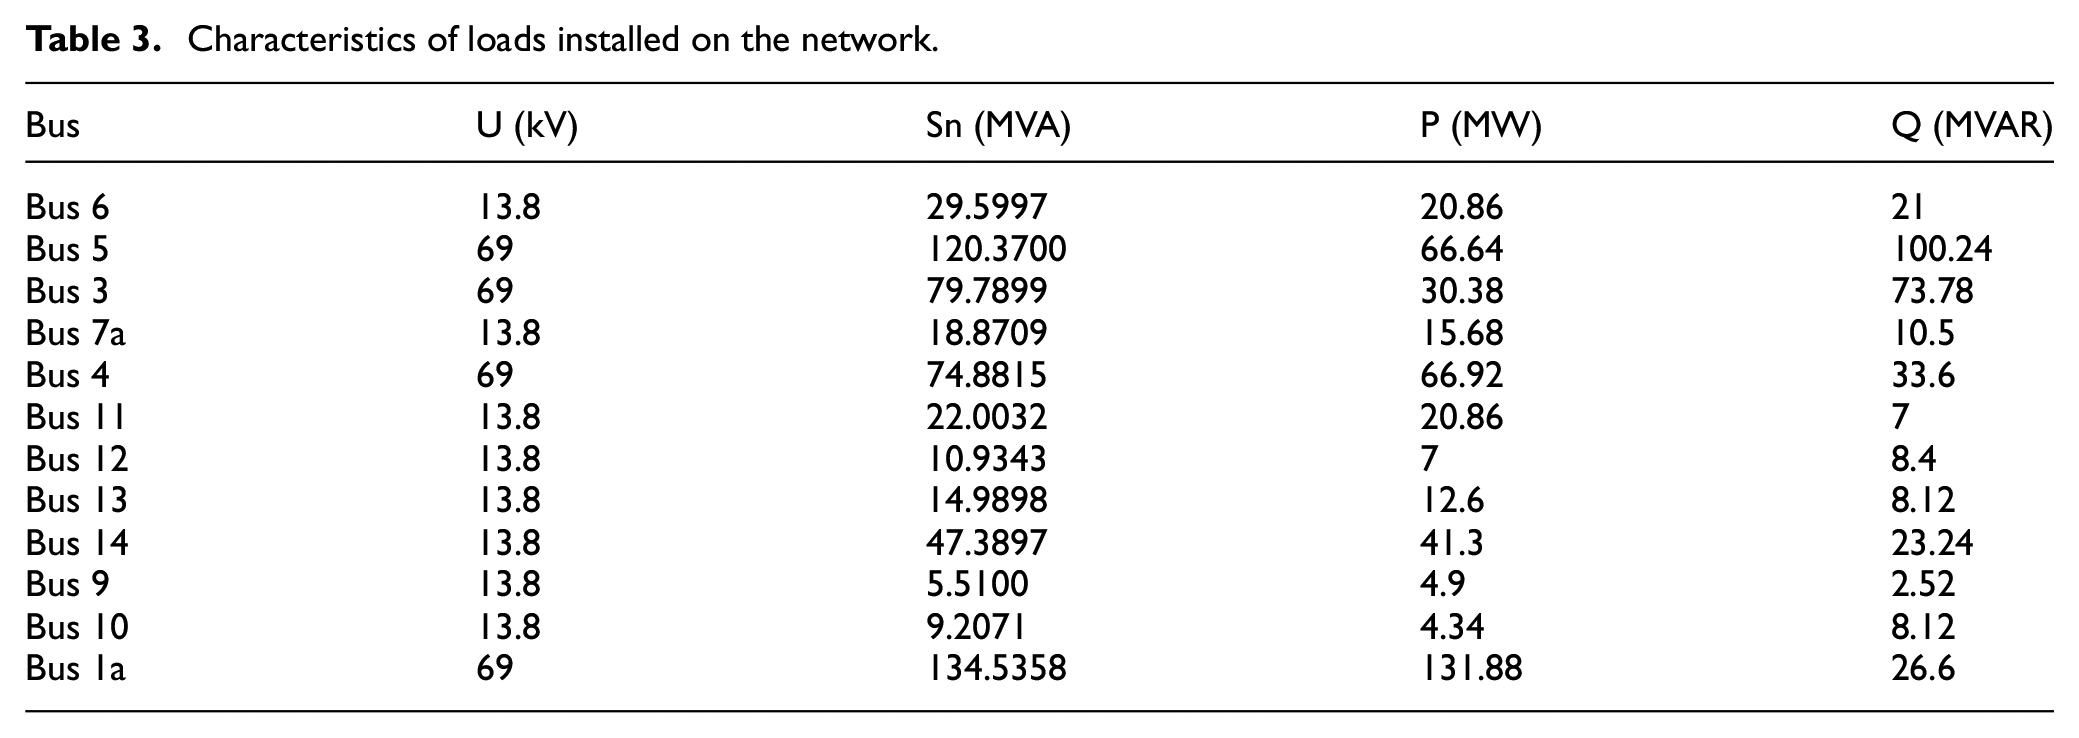
Table 3 shows the characteristics of load installed on the network.
Characteristics of loads installed on the network.
The objective of this part is to give selective criteria of the most suitable FACTS device to install it in this network. These criteria revolve around the improvement of the voltage quality, the stability of the grid with the presence of wind turbines as a disruptive factor, the rate of harmonic injected by the installed FACTS and certainly the evolution of power transits. All results are obtained using the MATLAB environment equipped by the Power System Analysis Toolbox library.
Simulation results and discussion
The goal of this research is to analyze and evaluate the dynamical performance of two FACTS devices, the TCSC and the SSSC. These FACTS devices are installed separately between buses 1 and 3. The installation of these devices between these two buses is justified by two primary criteria: voltage at bus 1 is often near constant and the amplitude of the voltage at bus 3 slightly exceeds 1 pu.
The value of the reference voltage is 1.05 pu. The method for adding these devices to the power grid and detecting changes in the system characteristics in terms of enhancing the damping of oscillations and thereby improving the system’s overall functioning. The network system is modelled in the time domain simulation environment under three distinct conditions: the base system with no FACTS devices, the remaining two conditions with FACTS devices linked to the network in a specified location.
To highlight these analyses, several comparative studies are carried out. Indeed, to see the influence of the integration of wind energy on the Smart Grid, a comparison of voltage amplitudes is presented. Then, a comparison of the power factor in different buses is illustrated. Next, a comparison of the harmonic component and THD in different frequencies is presented. Finally, the effect of FACTS devices on current amplitude, active power and reactive power losses is studied.
Comparison of voltage amplitudes
The evolution of voltage amplitudes in all buses is shown in Figure 7, using the SSSC compensator, and in Figure 8 using TCSC.
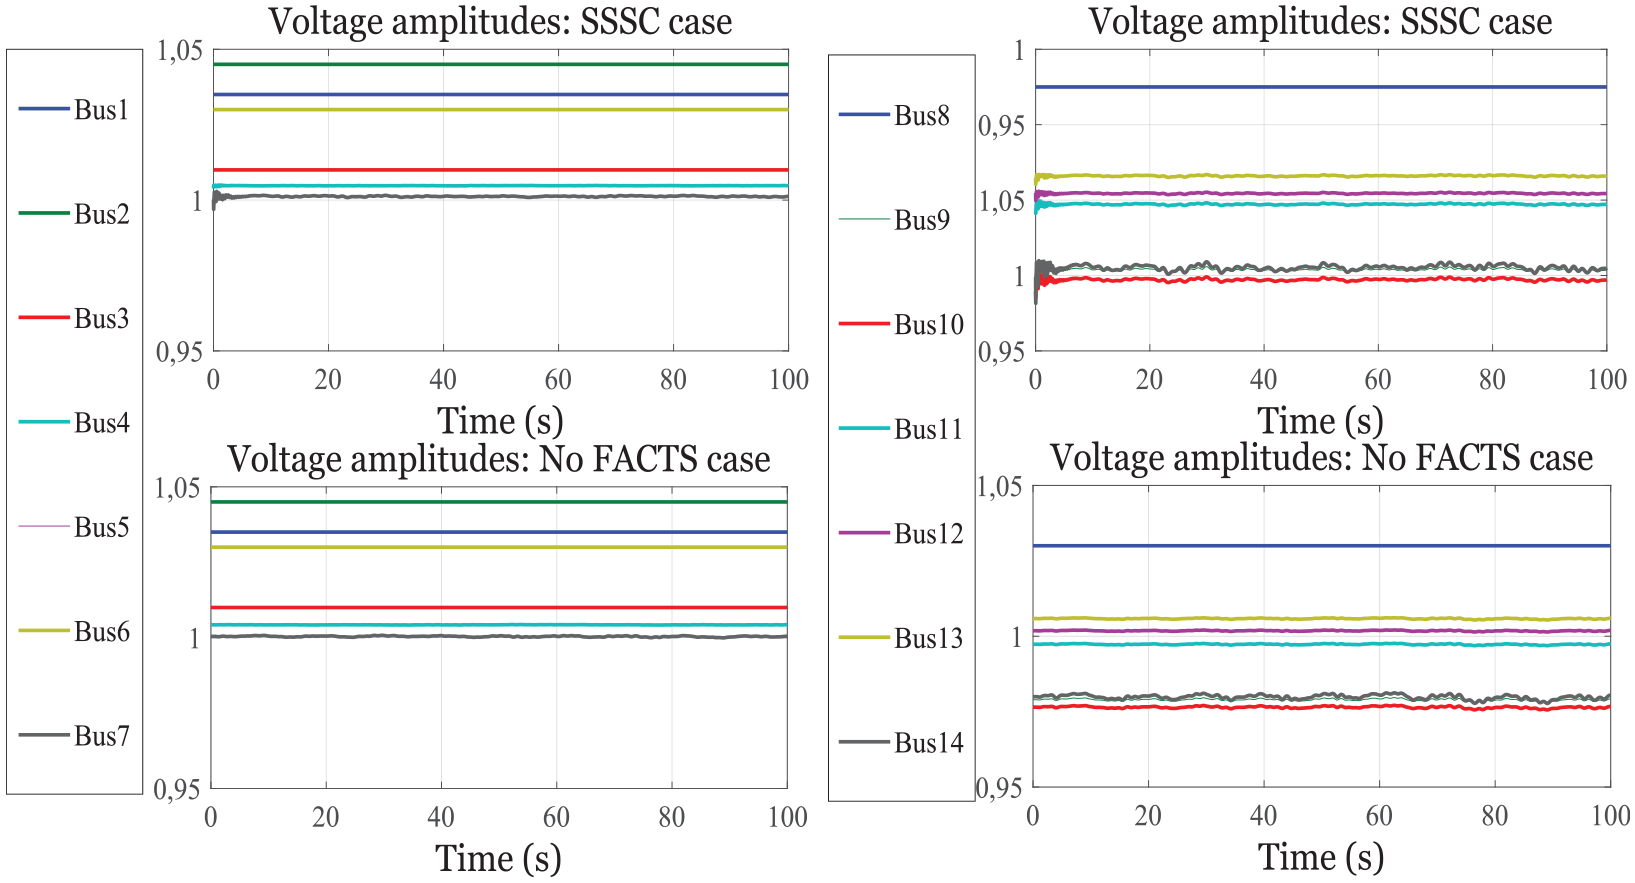
Amplitudes of voltages in the different buses with and without SSSC.
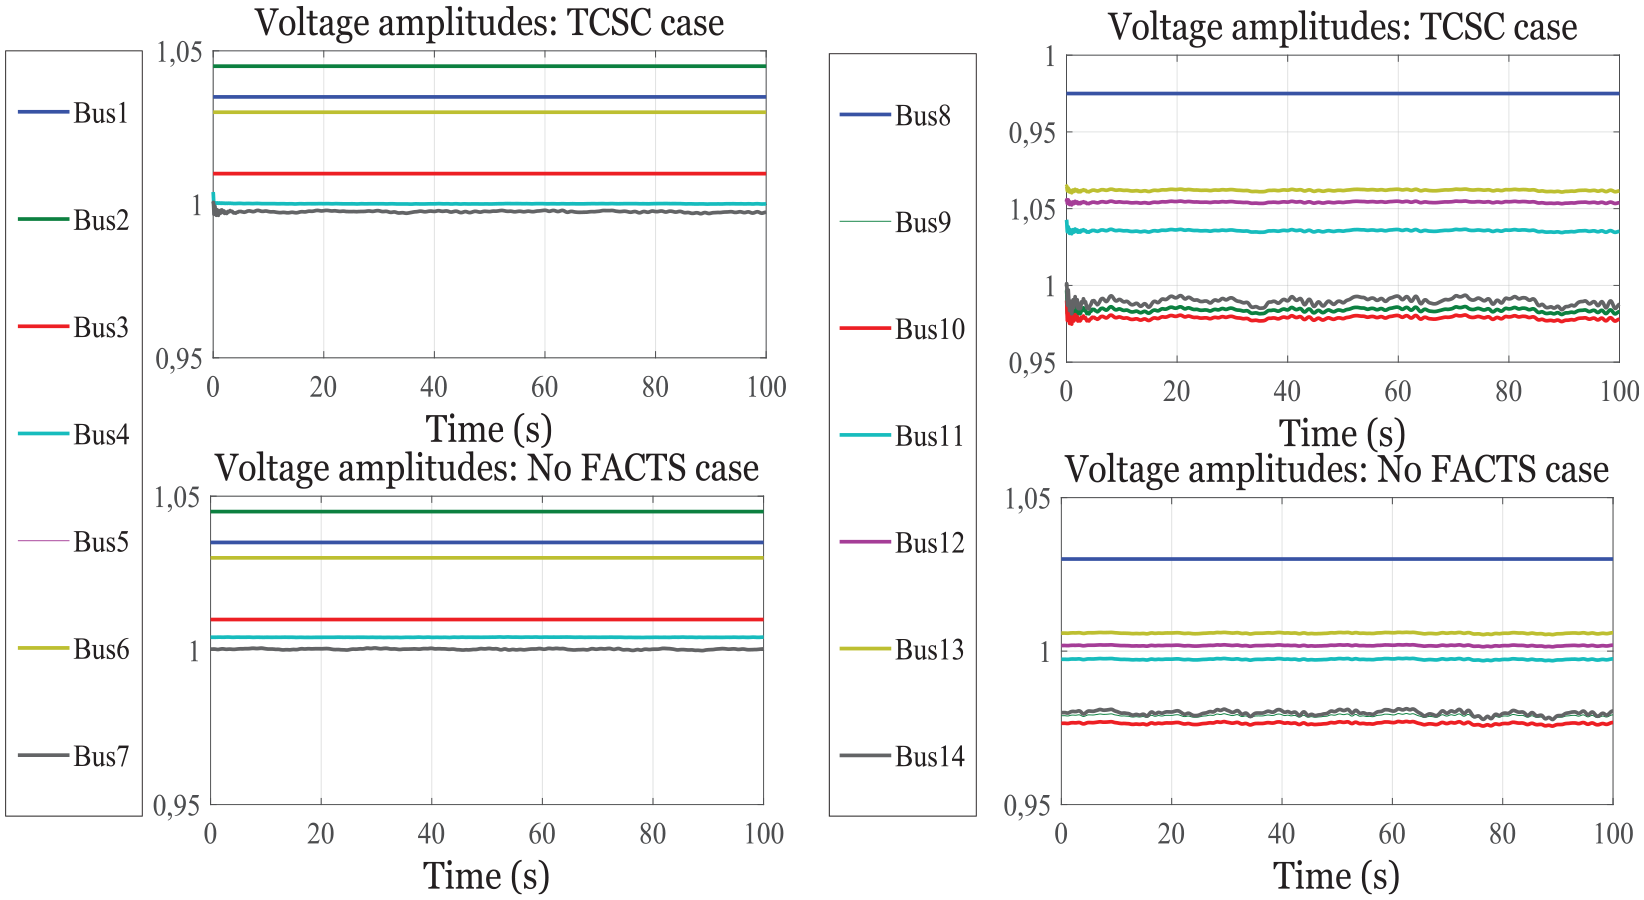
Amplitudes of voltages in the different buses with and without TCSC.
According to Figures 7 and 8, SSSC and TCSC are profitable at the power level. Indeed, it is noted that the ripples are considerably reduced by installing these devices. In addition, these devices lead to an extensive improvement of the power transit by the control of the power injected into the line. Compared to SSSC, the TCSC gives a fairly amelioration in voltage stability.
Comparison of power factor
After seeing the voltage behavior, the power factor in different buses is shown in Figure 9, using SSSC, and in Figure 10 using TCSC.
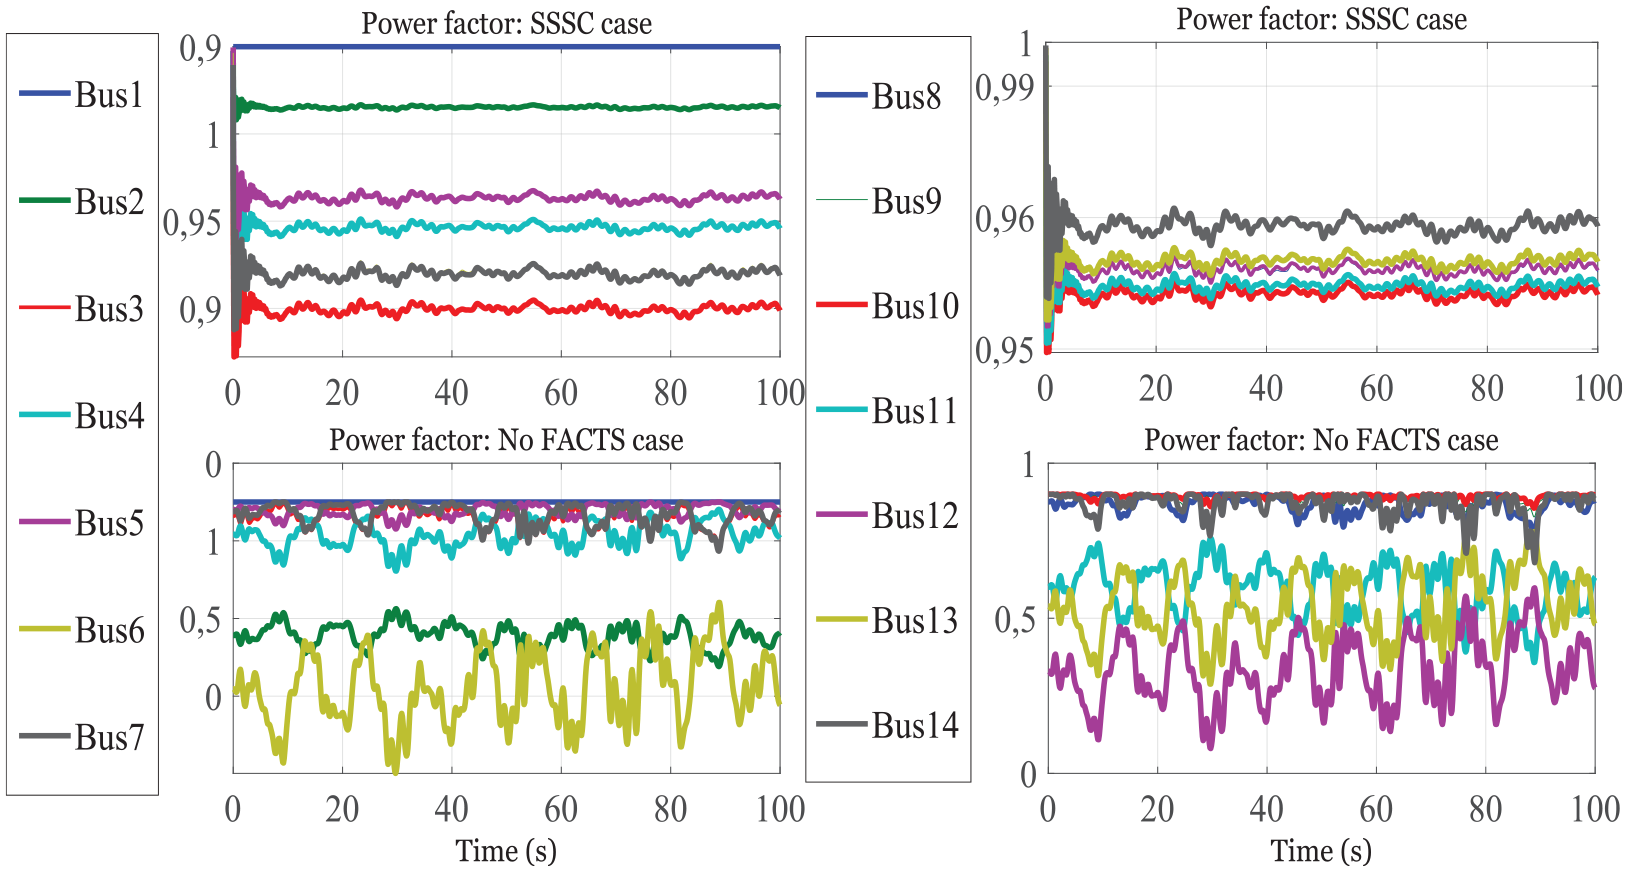
Power factor in both cases with and without SSSC in different buses.
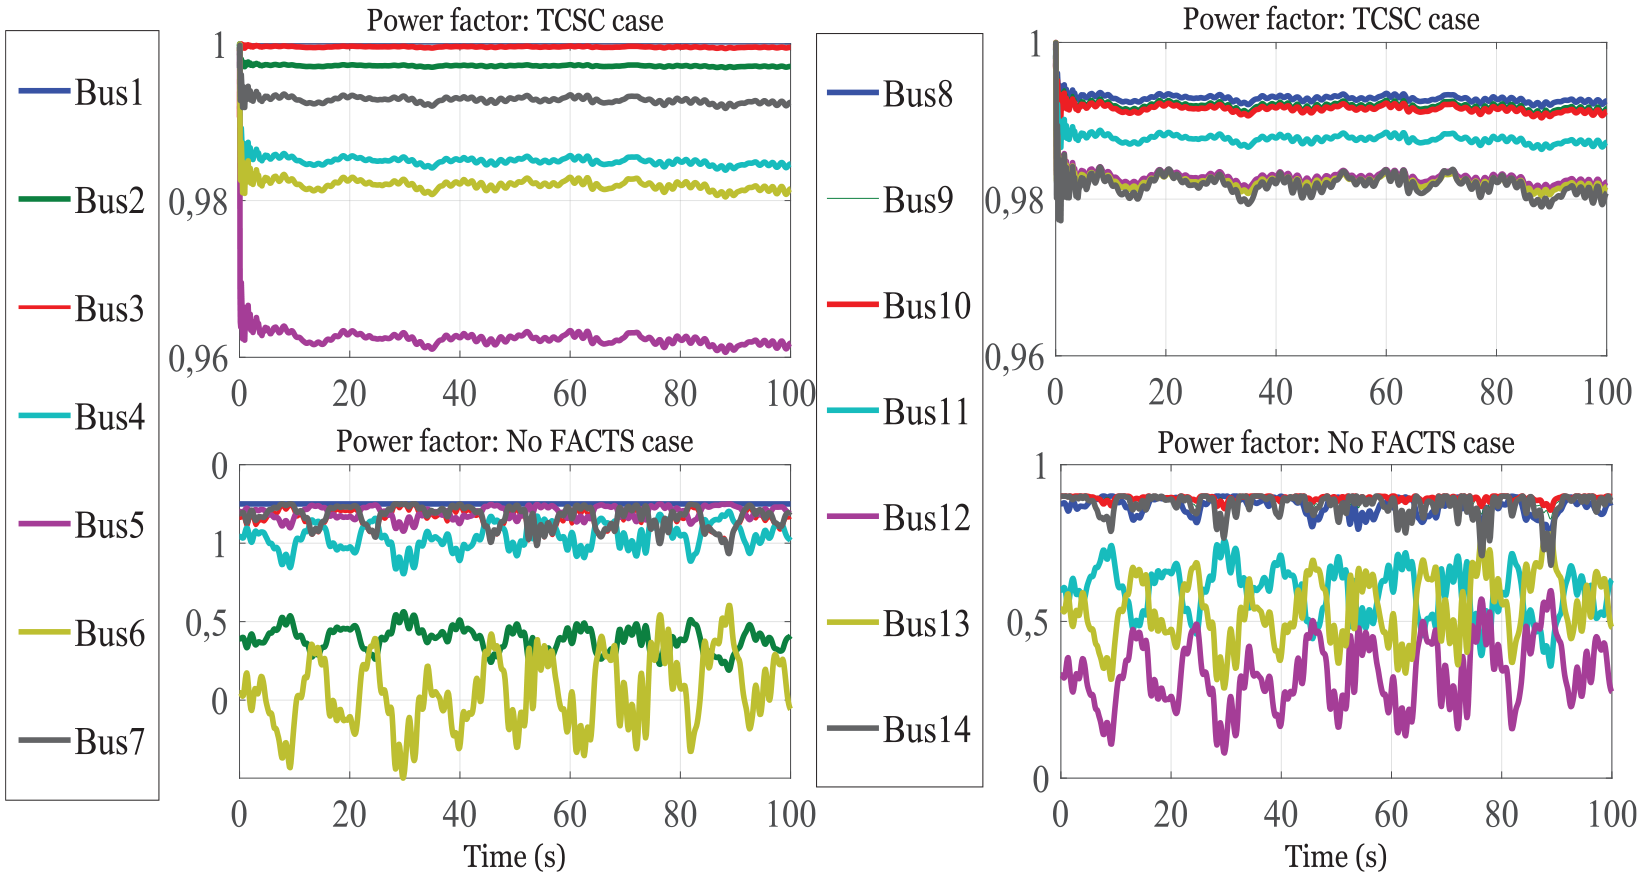
Power factors in both cases with and without TCSC in different buses.
The installation of these devices improves intensively the power factor (Figures 9 and 10), this is due to these interventions and the improvements of the injected powers. Compared to SSSC, the TCSC gives a fairly amelioration in power factor.
The evolution of the power factor in the electricity grid is much improved in the case of TCSC in comparison with the case of SSSC. Moreover, the minimum value of this factor is 0.96 whereas in the case of SSSC it reaches the value of 0.9. This improvement affects line losses that will be reduced in the case of TCSC.
Comparison of harmonic component and THD in different frequencies
The following figures present the parameters of the harmonic component as the magnitude of the fundamental, the THD and the angle of the signal in different frequencies. In the case of SSSC, the parameters of the signal and the THD are shown in the following figures.
In the case of SSSC, Tables 4–6 show the frequencies characteristics in buses 11–13.
The network frequencies characteristics in bus 11.
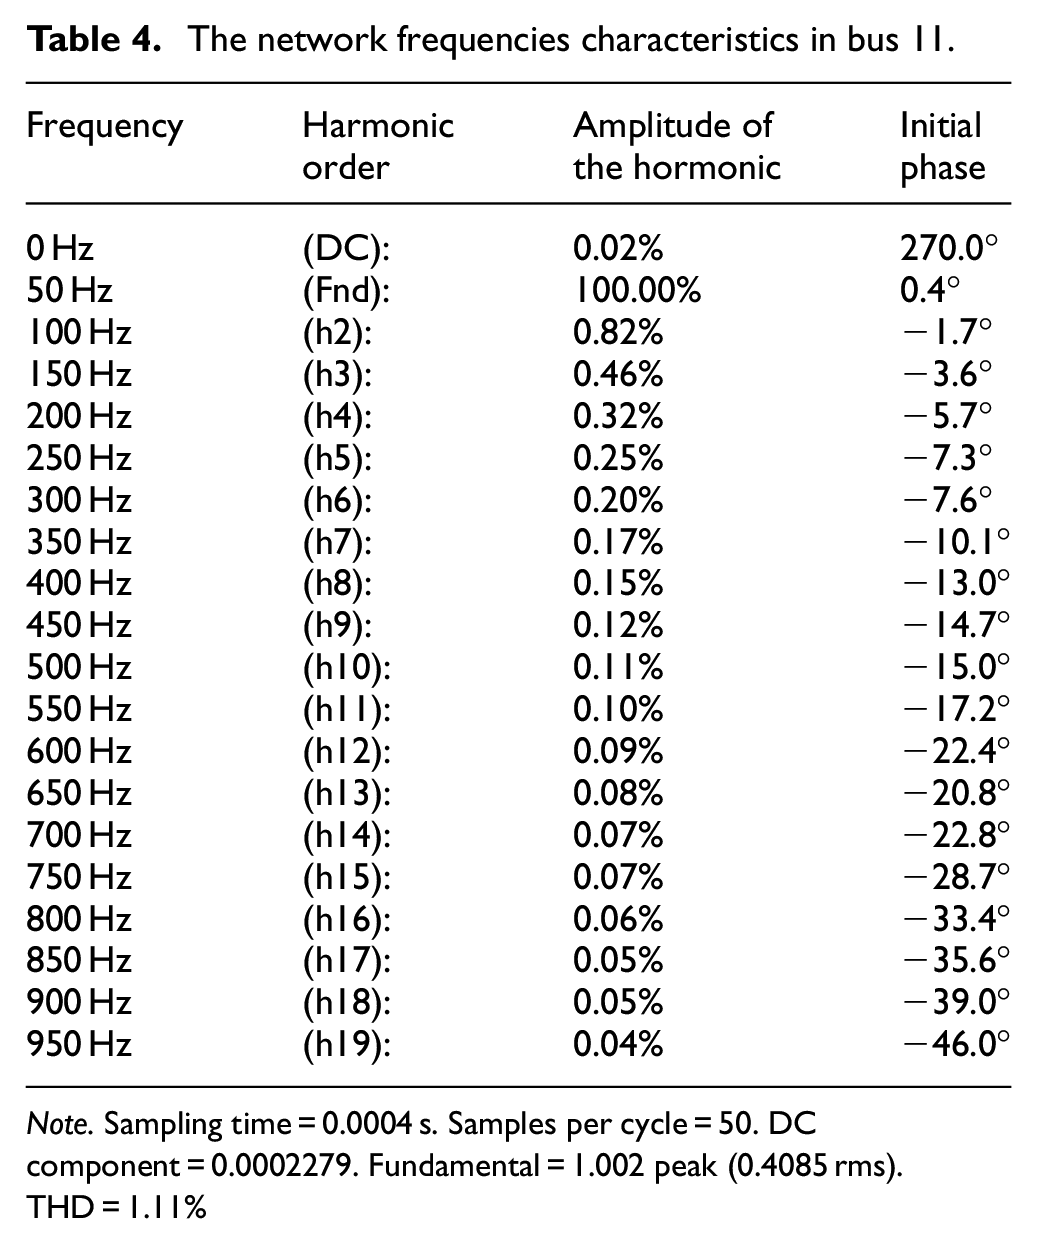
Note. Sampling time = 0.0004 s. Samples per cycle = 50. DC component = 0.0002279. Fundamental = 1.002 peak (0.4085 rms). THD = 1.11%
The network frequencies characteristics in bus 12.
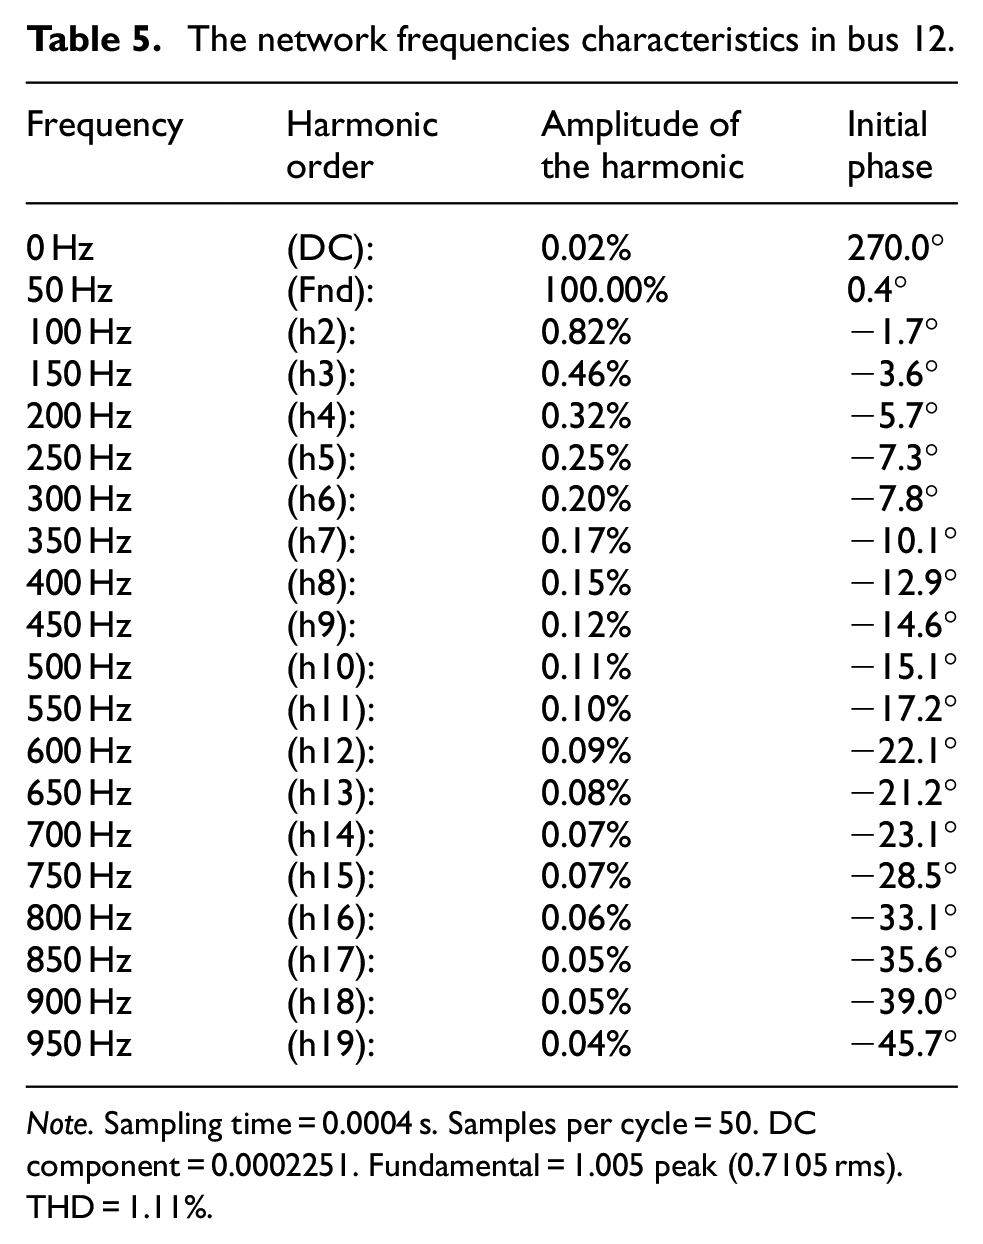
Note. Sampling time = 0.0004 s. Samples per cycle = 50. DC component = 0.0002251. Fundamental = 1.005 peak (0.7105 rms). THD = 1.11%.
The network frequencies characteristics in bus 13.
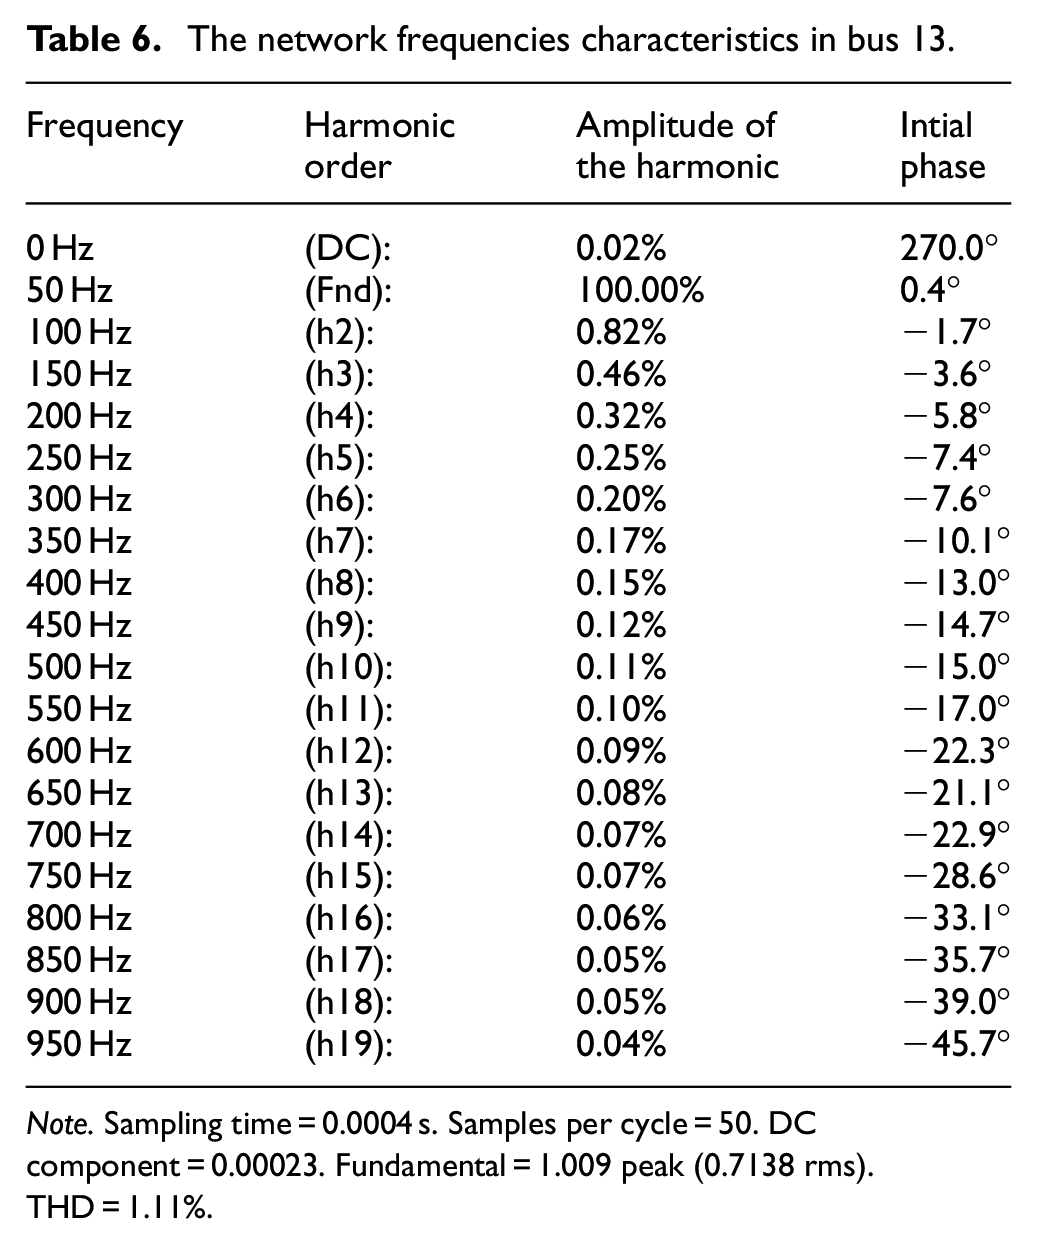
Note. Sampling time = 0.0004 s. Samples per cycle = 50. DC component = 0.00023. Fundamental = 1.009 peak (0.7138 rms). THD = 1.11%.
In the case of TCSC, the parameters of the signal and the THD are shown in the following figures.
The bus 11 is taken (buses 12 and 13 respectively) under study, because it is close to the two wind farms which prove that this node will be very affected by the harmonics produced by the renewable sources.
After studying the harmonic spectra in the bus under study, it is remarkable in Table 2–4, respectively, that the most generative harmonic is that of the order 3 whose value does not exceed 0.82% which gives 113 v.
It should be noted that the harmonic distortion rate is reduced in the case of TCSC to have a value of 1.1% but it is 1.11% in the case of SSSC.
According to Figures 11–16 and Tables 4–9, we can conclude that the TCSC device, installed between nodes 1 and 3, gives an excellent result.
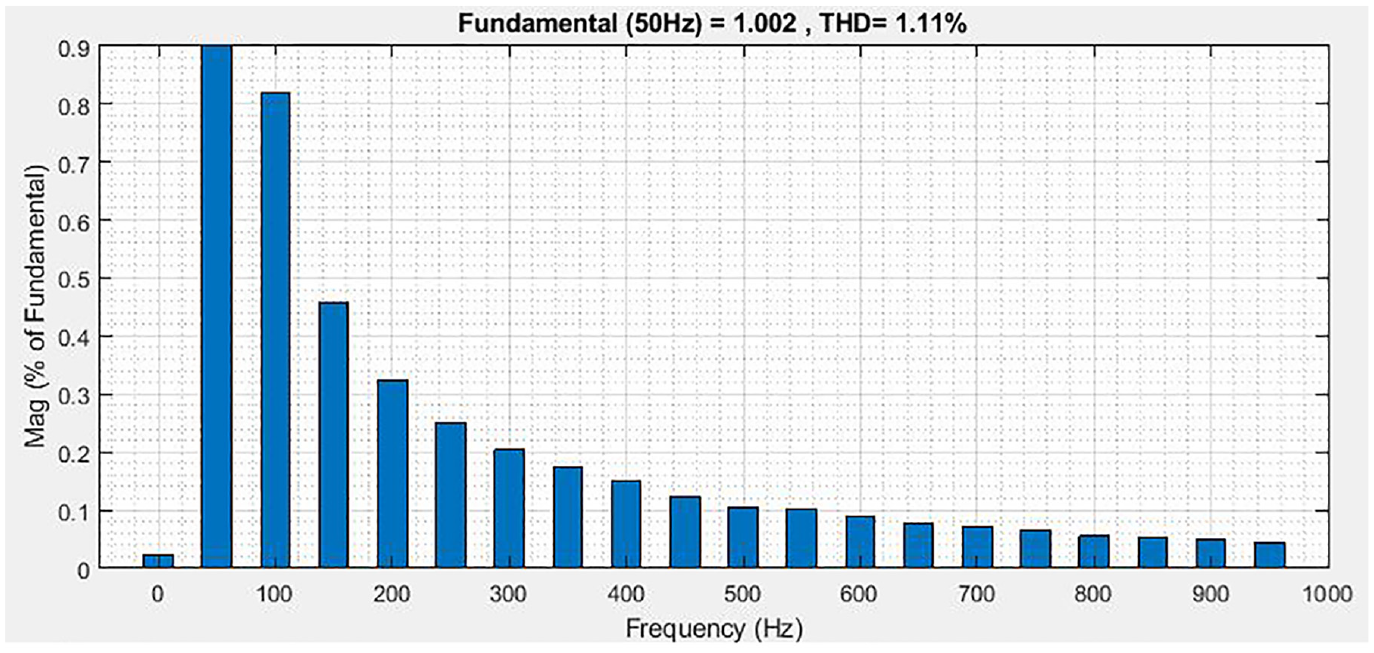
Harmonic component and THD in bus 11.
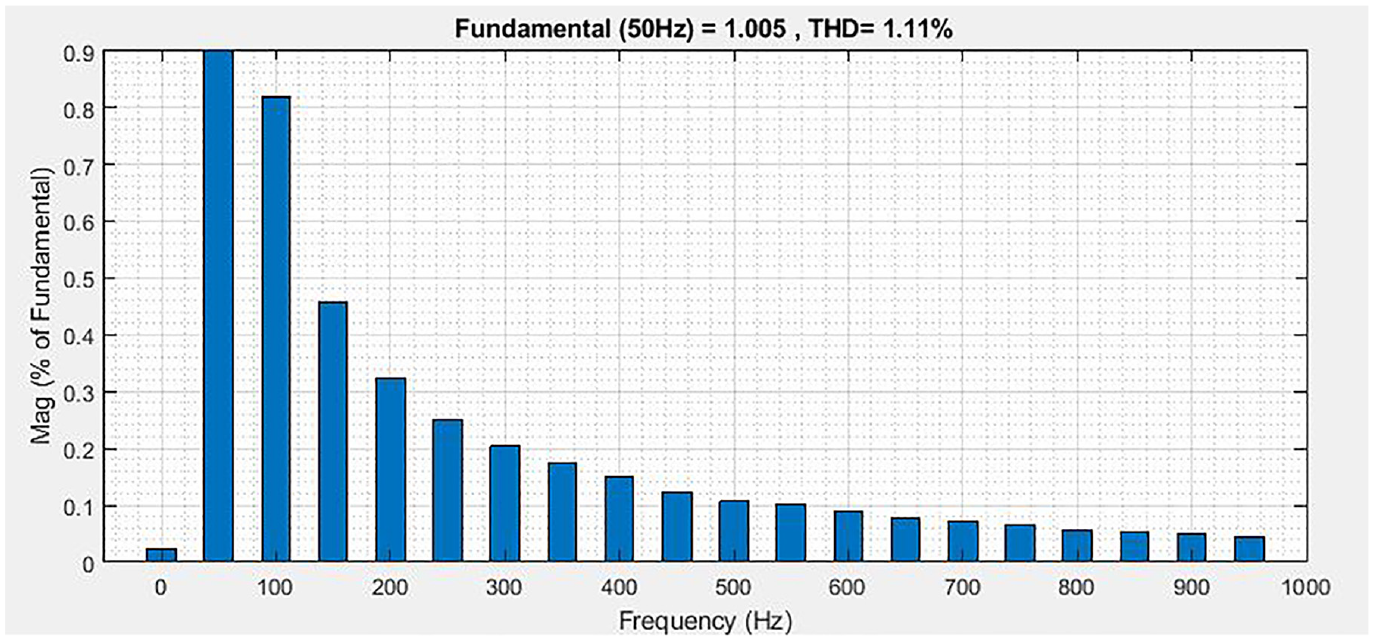
Harmonic component and THD in bus 12.
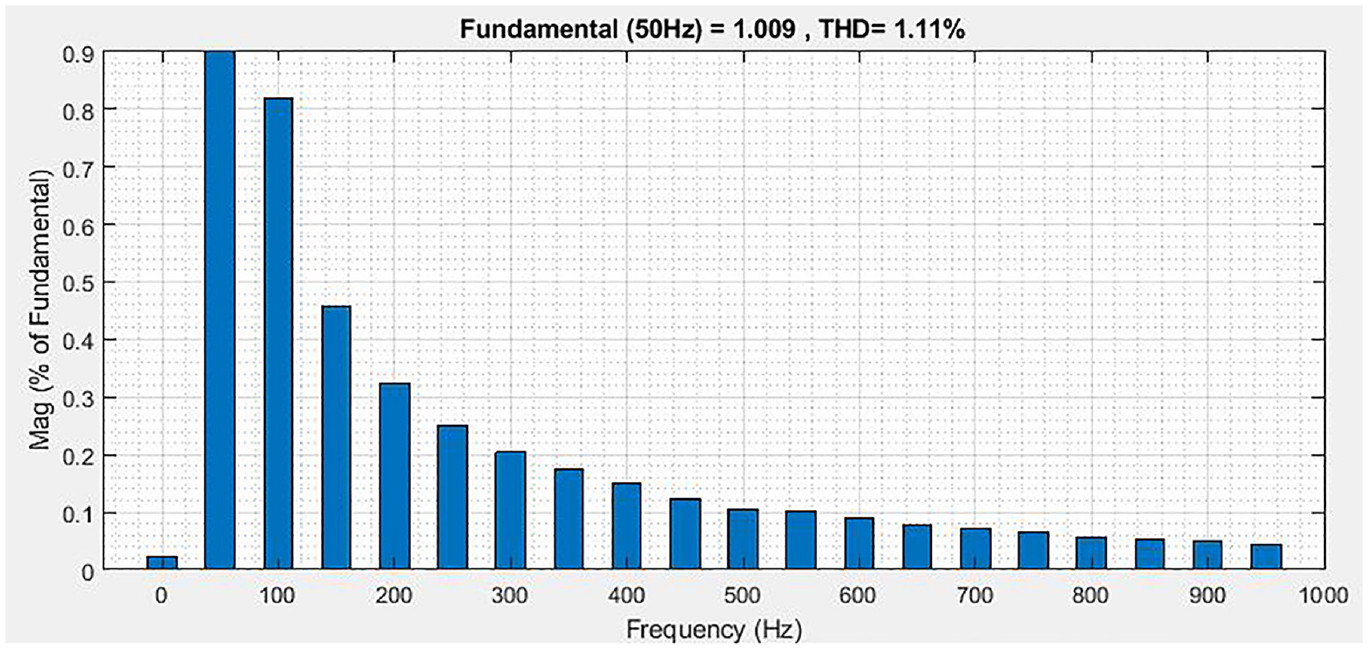
Harmonic component and THD in bus 13.
Harmonic component and THD in bus 11.
Harmonic component and THD in bus 12.
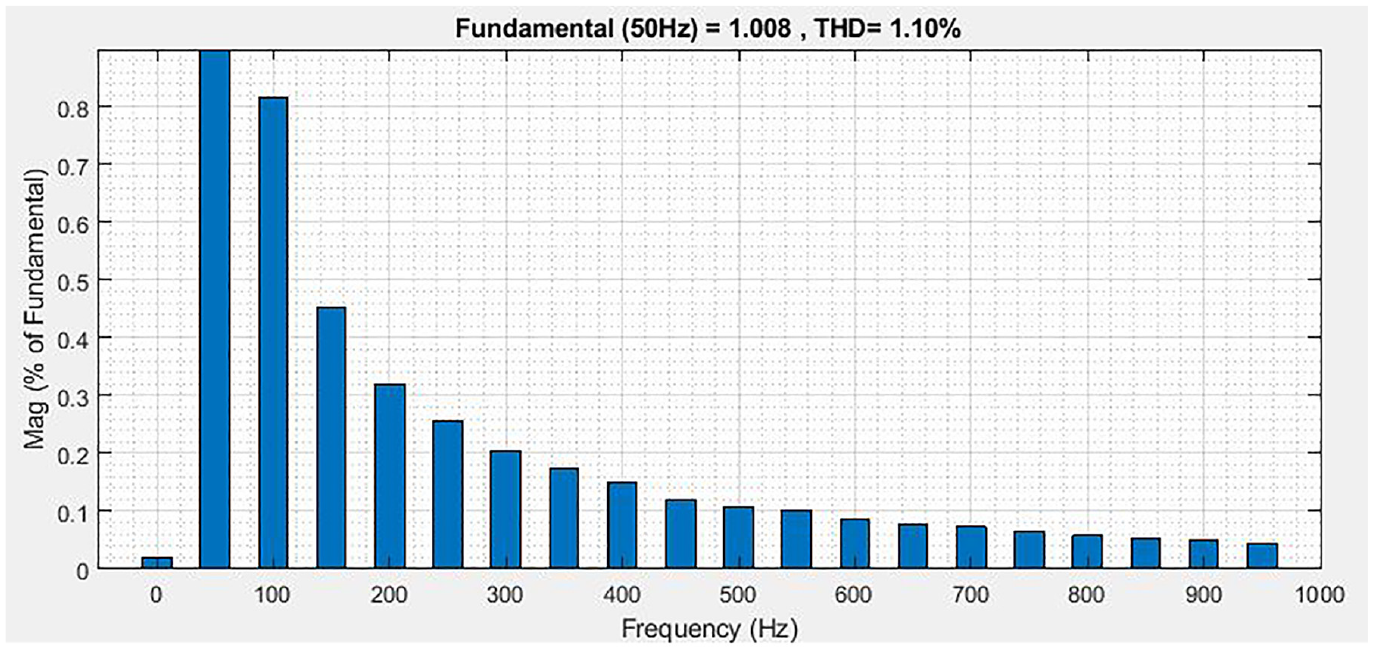
Harmonic component and THD in bus 13.
The network frequencies characteristics in bus 11.
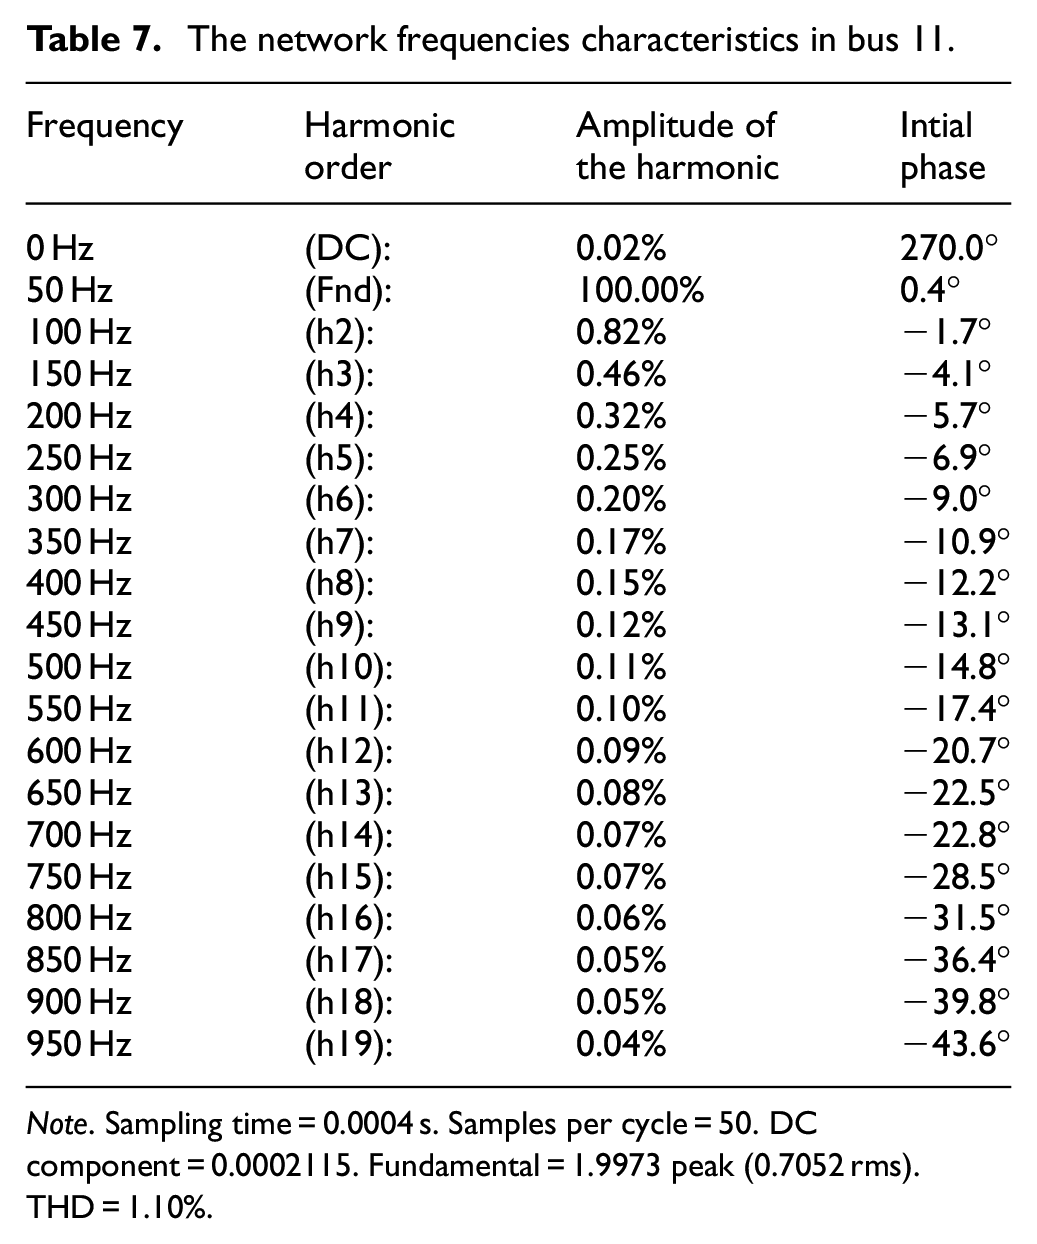
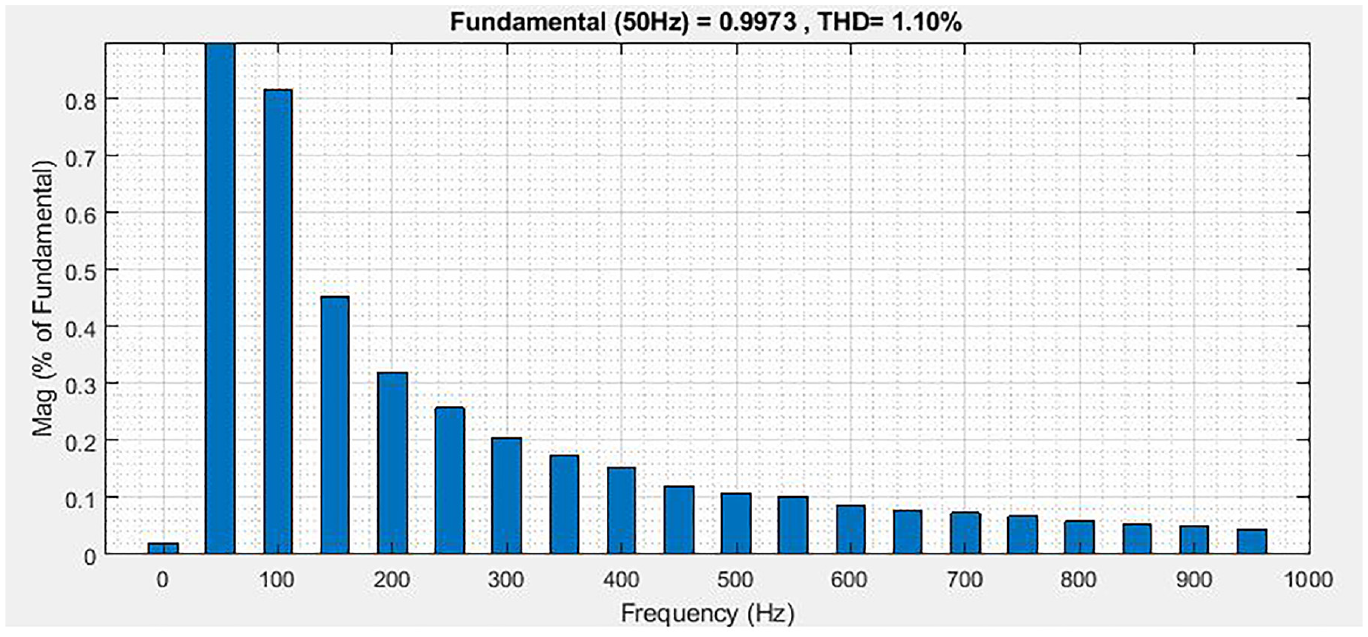
Note. Sampling time = 0.0004 s. Samples per cycle = 50. DC component = 0.0002115. Fundamental = 1.9973 peak (0.7052 rms). THD = 1.10%.
The network frequencies characteristics in bus 12.
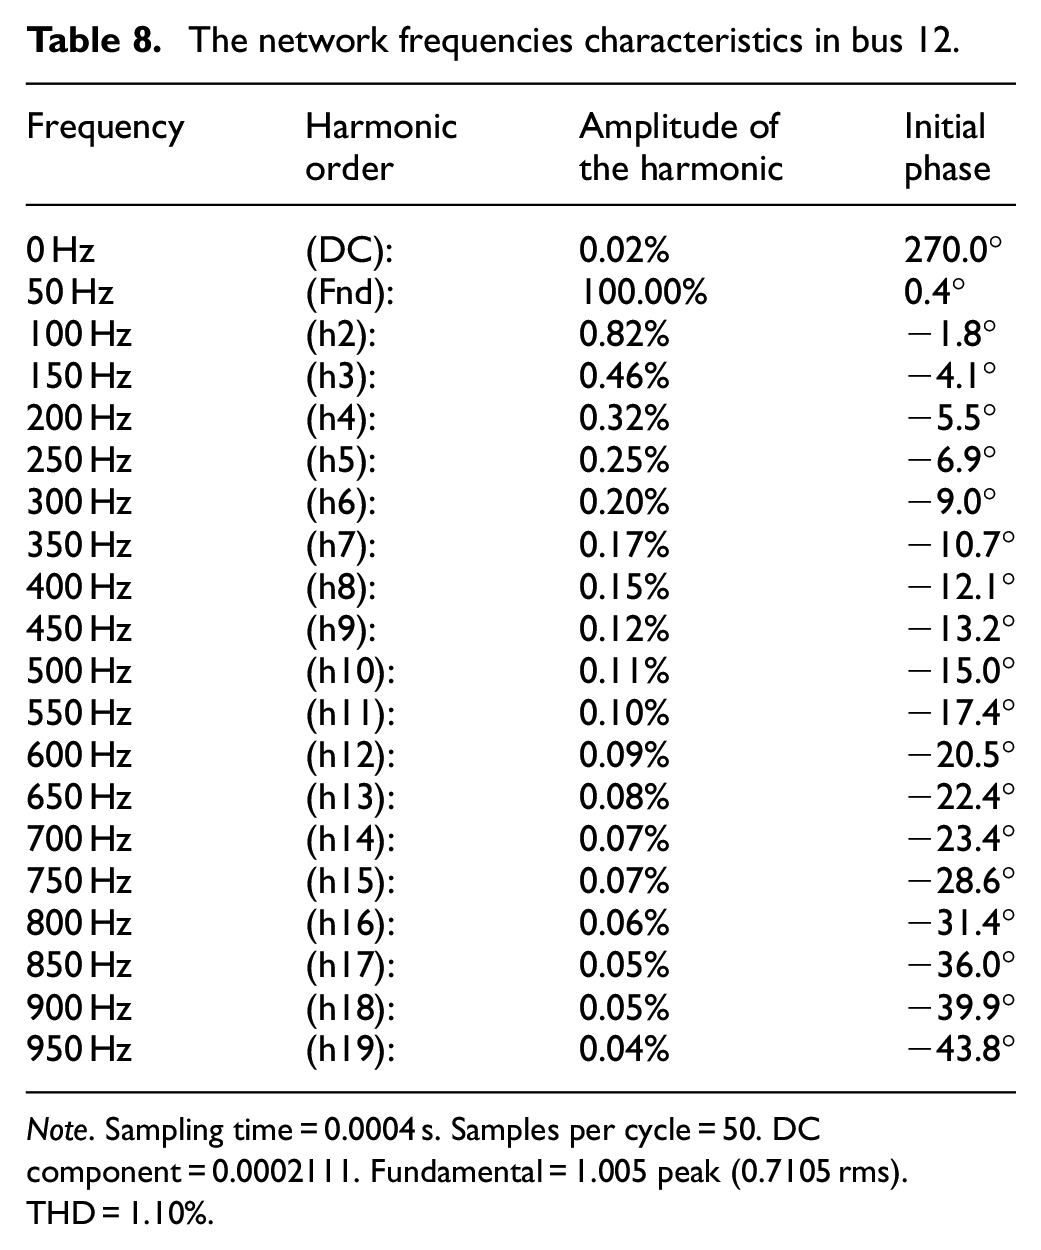
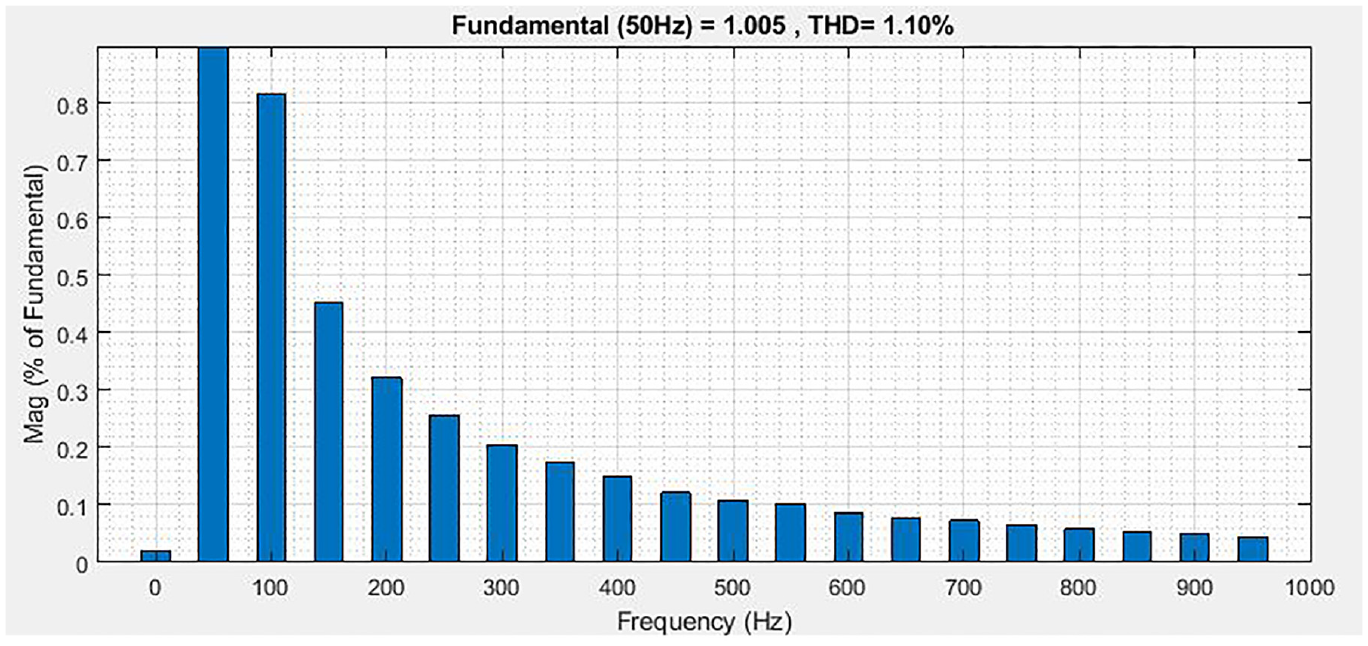
Note. Sampling time = 0.0004 s. Samples per cycle = 50. DC component = 0.0002111. Fundamental = 1.005 peak (0.7105 rms). THD = 1.10%.
The network frequencies characteristics in bus 13.
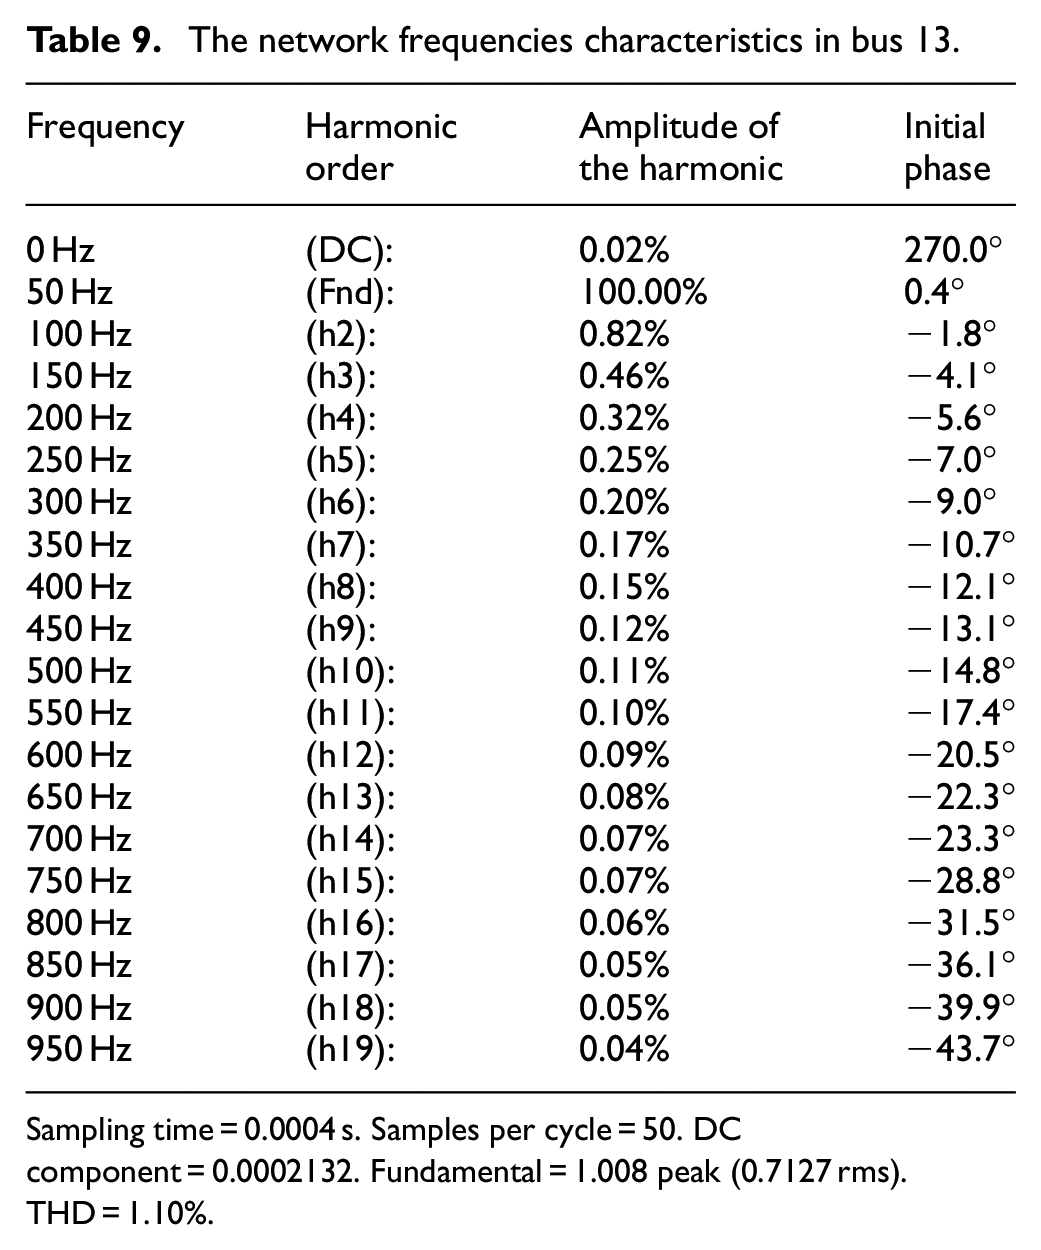
Sampling time = 0.0004 s. Samples per cycle = 50. DC component = 0.0002132. Fundamental = 1.008 peak (0.7127 rms). THD = 1.10%.
Based on the results above, it is clear that the maximum load factor with TCSC is greater than the basic case. It can also be seen that the voltage decrease in the case of TCSC is lower. The reactive power is inserted into the connecting line using a series compensation mechanism. The test system requires reactive power at the load bus rather than the line, TCSC correction yields superior results. The TCSC similarly exhibits a flat voltage profile until the collapse point, then quickly declines as it approaches the operating limitations. All the figures show that by adding FACTS devices with acceptable ratings, the total system performance may be enhanced.
Comparison of losses
Series FACTS devices are capable to improve available transfer capability, voltage profile, enhancement of power system stability, reducing reactive power losses in a system.
The effect of series compensation on current amplitude, active power and reactive power losses are demonstrated using firstly the model of TCSC as shown in Figure 17 and the model of SSSC as shown in Figure 18.
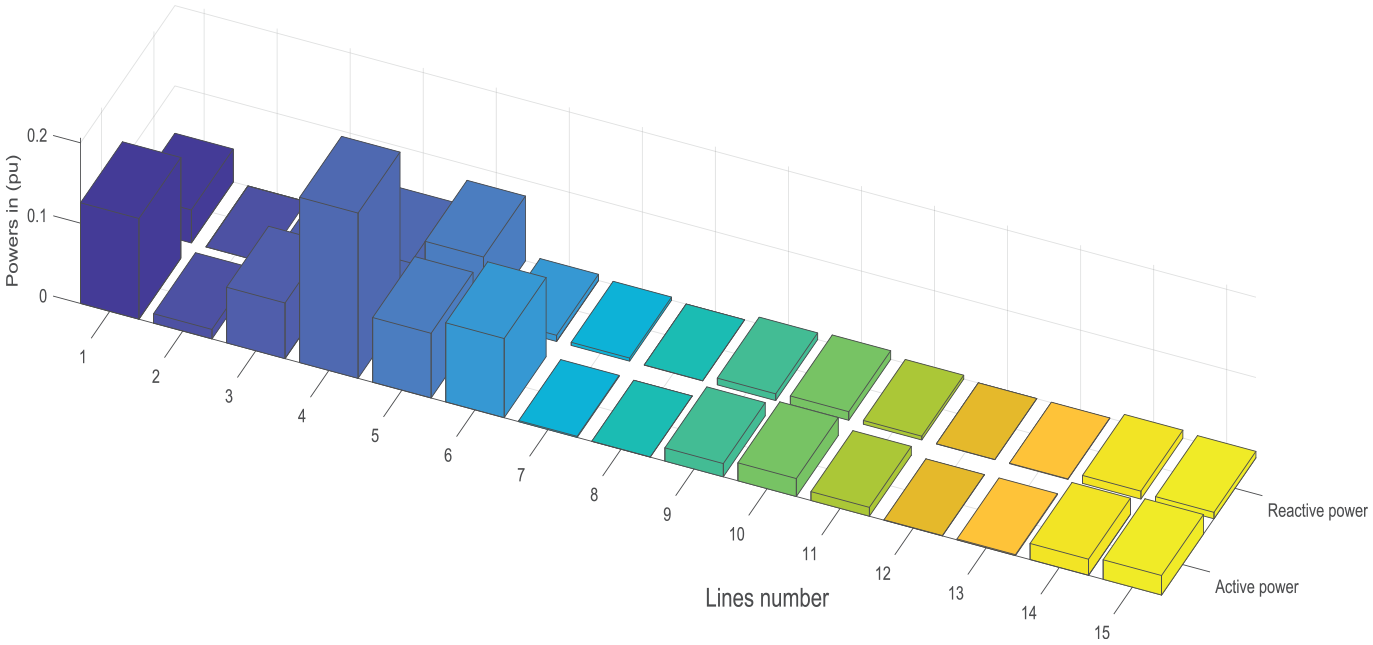
Losses affected by SSSC.
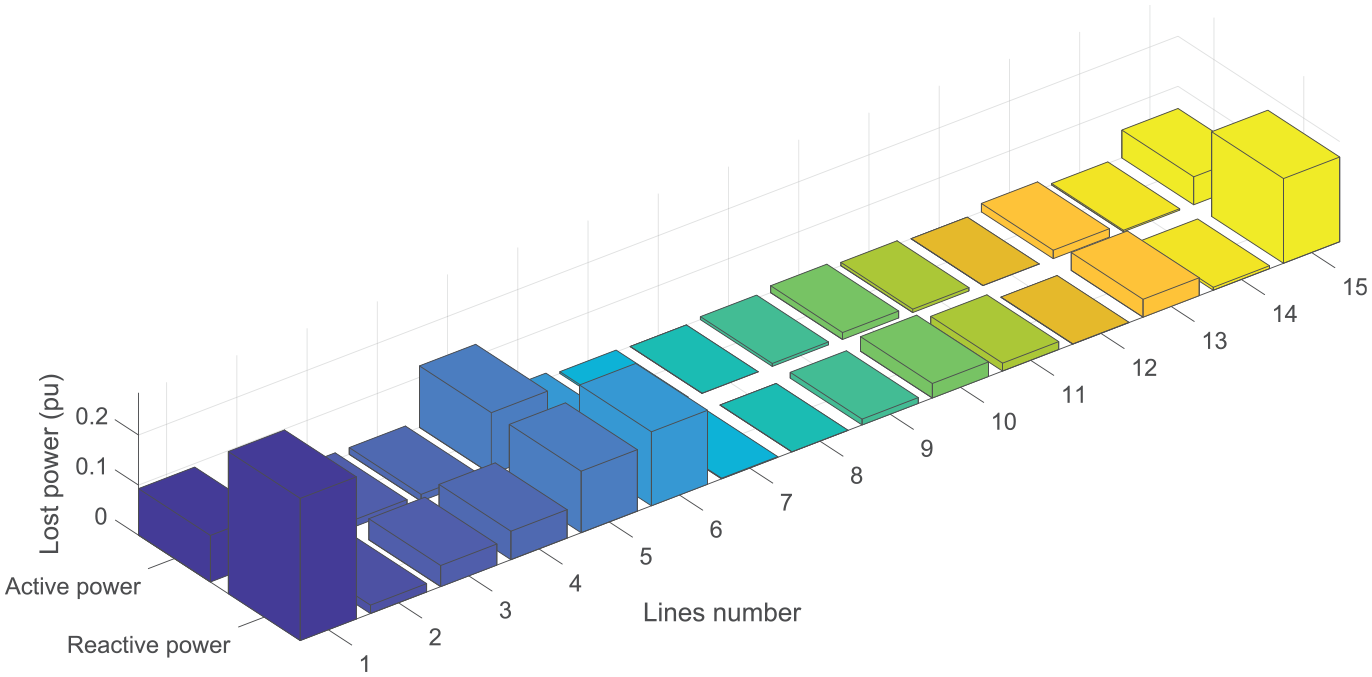
Losses affected TCSC.
It can be seen that losses in the lines are appreciably higher in the case of SSSC than in the case of TCSC and this for both active and reactive powers (lost in the lines).
Dynamic stability of the power grid
In this part, we are interested in studying the dynamic stability of the power grid. Indeed, two cases are detailed: without and with FACTS. The used method of stability is the root location. For this reason, the eigenvalues of the nodal admittance matrix of the network are summarized in Table 10.
Network nodal admittance matrix eigenvalues with and without FACTS.
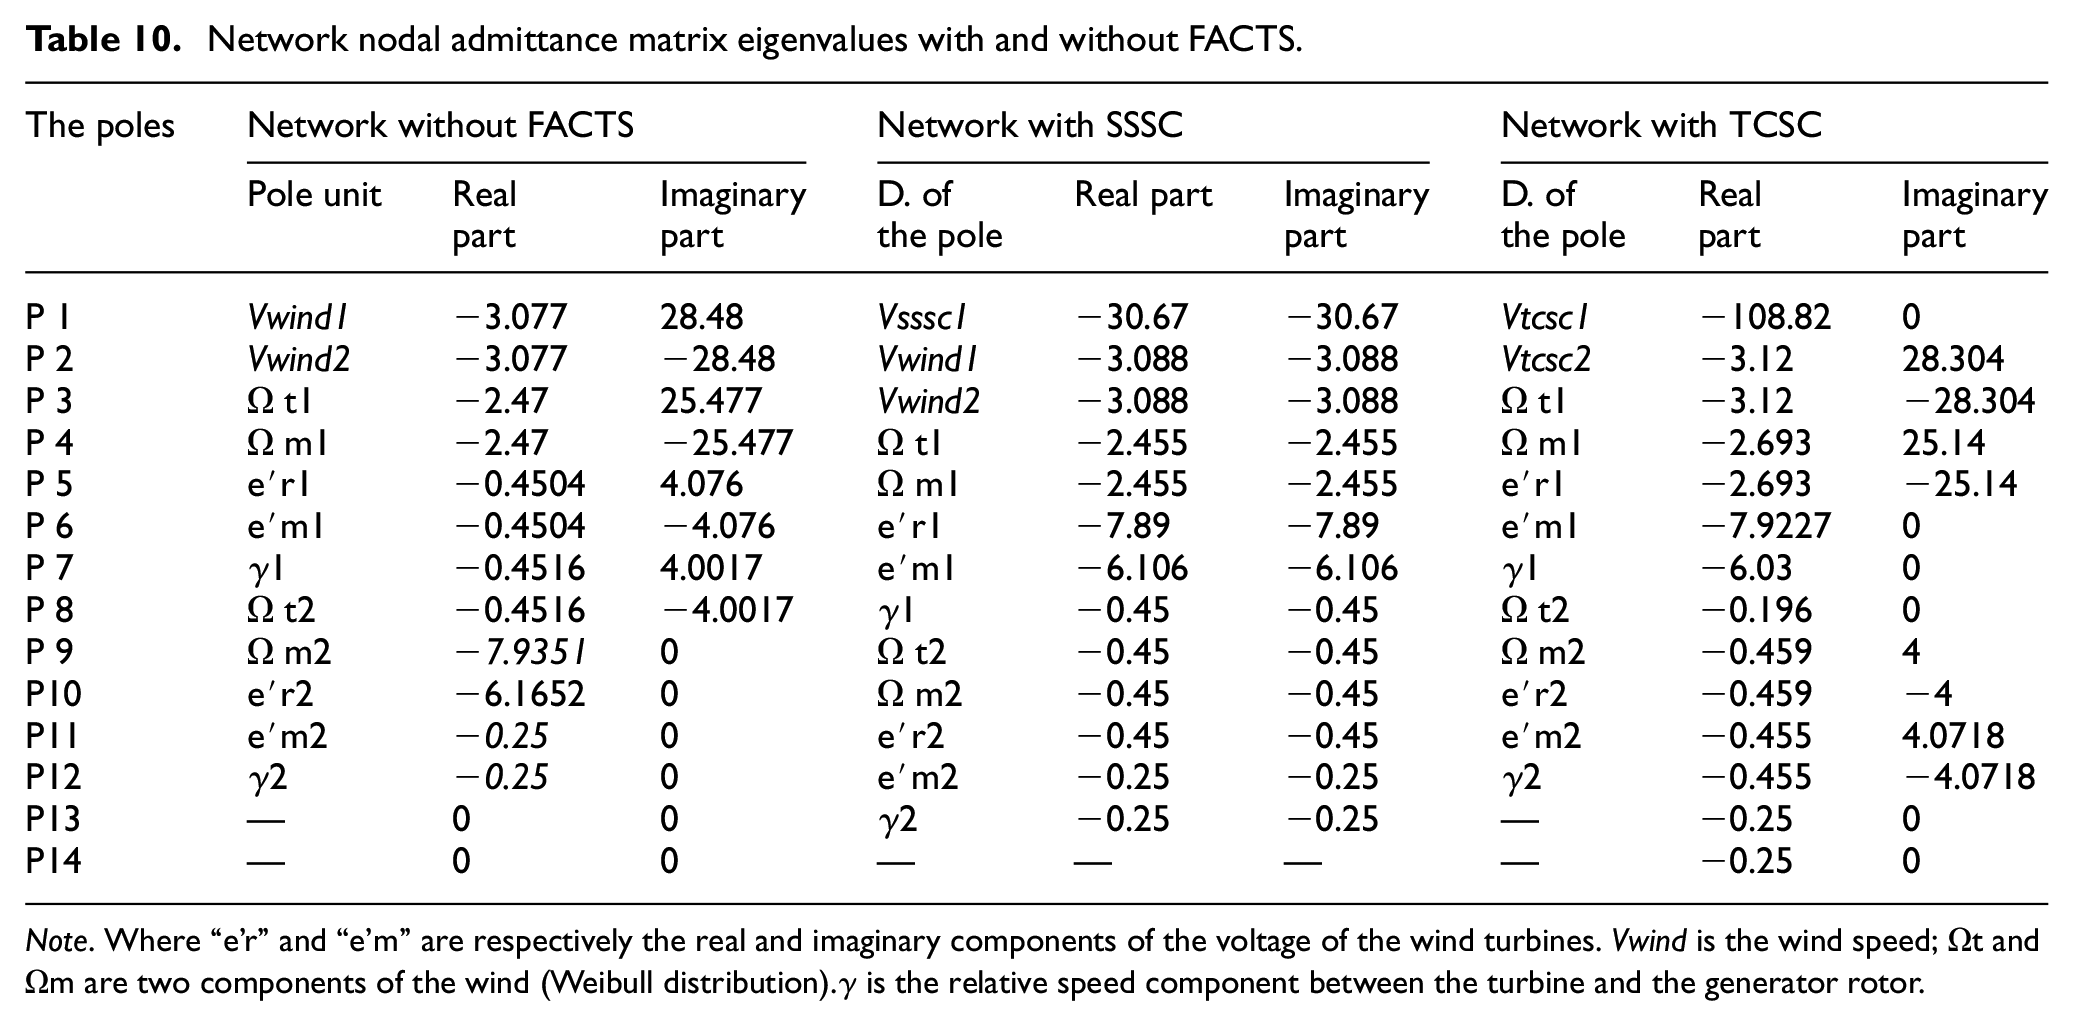
Note. Where “e'r” and “e'm” are respectively the real and imaginary components of the voltage of the wind turbines. Vwind is the wind speed; Ωt and Ωm are two components of the wind (Weibull distribution).
Figure 19 shows the eigenvalues of the nodal admittance matrix in the complex plane of the network with and without FACTS.
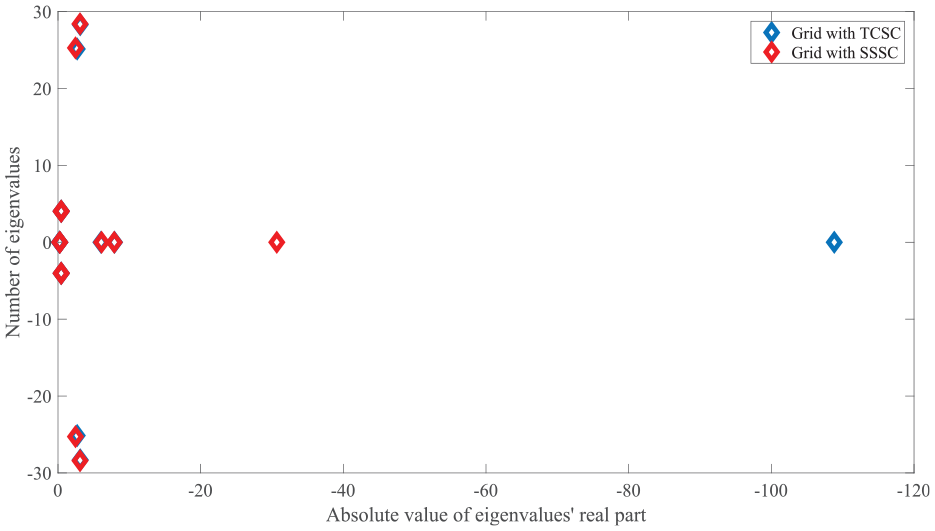
Eigenvalues of the nodal admittance matrix with and without FACTS.
According to Table 10 and Figure 19, using the TCSC, the minimum value for the real parts of the poles is 0.196 however the maximum is 108.82, in absolute terms. To have a pole having, in absolute value, more than 108 as a real part, this strengthens the whole system to have its state of equilibrium after all disturbance more at least violent.
The TCSC compensation system has significantly improved the stability of the system. On the other hand, the SSSC device has shown its power on voltage improvement, power control, but at the level of stability, it remains less reliable than TCSC.
It is clear the influence of each device for improving the state of the stability of the network. The exploit is really ensured by the TCSC followed by SSSC, but this applies singularly to the level of stability.
Conclusion
The problem addressed in this paper is to study the integration of wind energy sources into the grid. Indeed, in this work, two wind power farms are proposed to produce the active power using two variable profiles of the wind and to be closer to real conditions. By employing SSSC and TCSC type compensatory tools, we have significantly limited the disturbances of wind origin and resulting from the uncertain variation of active power injected.
We have focused on exposing the annoying effects of renewable energy to the grid. Wind-induced disturbances, if not controlled with devices to monitor for fluctuations in injected power, are presented. Indeed, the electrical quantities supplied by the wind generators are in fatal relations with the variation of the wind speed. This causes disturbances at the voltage amplitudes and frequency levels. The insertion of SSSC and TCSC as means of adjustment is really vital and imposed. In this paper, a comparative study between two series FACTS devices, SSSC and TCSC, installed separately in IEEE 14 bus power grid that contain two wind farms under different wind profiles is presented.
The obtained results show the performance of each device to drop the perturbation due to the wind speed variation. We have illustrated the evolution voltage magnitudes as well as the different electrical powers. In addition, the frequency and the injected harmonic caused by the FACTS devices were shown too. Additionally, the reducing of lost line powers was presented. Moreover, the stability condition was in order to indicate the most sensible bus that engenders the instability of the grid. This study demonstrates the performance of the TCSC against the SSSC device in the re-obtaining of dynamic performance of the power grid and the law injected harmonics as well as in reducing of power lost.
Footnotes
Declaration of conflicting interests
The author(s) declared no potential conflicts of interest with respect to the research, authorship, and/or publication of this article.
Funding
The author(s) received no financial support for the research, authorship, and/or publication of this article.
Data Availability of Material
Data sharing not applicable to this article as no datasets were generated or analyzed during the current study.