
Abstract
The objective of this study was to develop an optimal control approach by numerical calculus to predict how to reduce the overall uncertainty of survey instruments unable to directly measure inaccessible points. To reach our goal, two approaches were used to attain the objective. The first was inspired by mathematical models related to three methods appropriately selected and contained in Zhuo’s work proposed in 2012. These were Remote Elevation Measurement (REM), Remote Elevation Dual Measurement (REDM), and Front-to-Back Measurement (FBM) methods whose uncertainties on the measurements of points were deduced using error propagation equations. Optimal control technique helps us to show that for the REM, the height h of the prism contributed more than 70% compared to the global uncertainty for ranges
Introduction
The analysis of the contribution weight of the relative importance of each component of the overall uncertainty is essential to identifying the sources of uncertainty that can be addressed potentially, to reduce the overall uncertainty. Measurements in industries have become more important in view of the fact that, measurements provide the basis for any control. The management of random errors associated with any indirect measurement problem is a major concern in the field of surveying and even in all other areas of science. Surveying refers to the science of accurately measuring horizontal and/or vertical distances in the field. There are many surveying problems that can occur during the process: instrument errors caused by incorrect calibration or incorrect use of instruments; environmental factors such as wind, rain, or fog can distort or block the survey signal; human error where surveyors can make mistakes in taking measurements or in reading the instruments (see Idoje et al 1 and Hussein et al. 2 ). The reduction of errors due to the total station when measuring the vertical angle is a major problem in improving the accuracy of trigonometric leveling. The most popular techniques for identifying and analyzing sources of the overall uncertainty are developed in engineering literature such as the models which included the uncertainty in the sample’s mass and of the volumetric glassware (confere Harvey 3 and Cheng et al. 4 )
Thus, Zhou and Sun 5 proposes the method of leveling combining the total station with a tracking bar to reduce the sources of errors of trigonometric leveling. On the other hand, Ghilani and Wolf 6 analyzing the individual sizes contributes to functional error when measuring the elevation of a point. The combined standard uncertainty evaluation is performed and the uncertainties of azimuth and elevation angles are established and the system’s measurement accuracy is also calculated. 7 Nowadays, the coefficient of contribution to uncertainty plays an important role in the development of tools and the choice of electronic instruments such as total stations and GPS, that it allowed 8 to propose the coefficient of contribution to the uncertainty that is appropriate for the correlated and uncorrelated input variables. This allowed them to improve the procedure for determining the molar mass of lead and its uncertainty from the four isotopes of lead.
The three methods developed in this work have already been addressed by. 7 But the analysis of the weight of the individual contribution to the overall uncertainty needed to identify the parameters responsible for the rapid growth of the overall random error had not yet been made. Knowledge of the contribution of each of these parameters in the measurement of inaccessible points by applying one of the methods highlighted with less efficient equipment makes it possible to equal the result. The originality of this work lies in the fact that we performed numerical simulations of the weight of the individual contribution to global uncertainty and the law of propagation of uncertainties. This offers us a huge opportunity to find ways and means to improve the measurement process for the three methods. In addition, the geometric configurations associated with trigonometric methods play a very important role in the quality of the data obtained during the measurement processes. Surveyors always choose the most appropriate equipment such as total station which is capable of scanning interfaces through a cloud of points based on the control point and back sight and simulation process. For example, the T1 class total station is highly expensive piece of equipment than the T3 class total station. In light of this assertion that numerical simulations have an important role to play in probing the different configurations that can allow us to improve the measurement process, this allows us to be more efficient and to save cost and time in the end.
We assume that systematic errors are reduced during the measurement process. Then, only the random errors obey the law of propagation of the uncertainties. The purpose here is to study the effects of the propagation of random errors in an indirect measurement process and give appropriate recommendations for each method. To meet our defined objective, a numerical analysis is performed with the MATLAB software tool (R2019 a, win 64). The theory of these methods is presented and the theoretical uncertainty of each method is deduced and analyzed numerically. Then, the measurement of uncertainty is evaluated. In addition, some recommendations on methods are given. Using these indirect methods, the altitudes above the ground of inaccessible points can be measured with less risk and less effort, which will eventually save time and increase efficiency.
This paper is organized as follows: Section 2 presents the mathematical models of three methods. A brief classification of total stations according to the standard and the measurement of uncertainty for different class total stations are presented. Section 3 is devoted to analyzing the sources of errors and proposing error reduction strategy which is the core of this work. Our results ended up with a discussion and a conclusion.
Methodology
Many different techniques can be used to measure data quantities such as heights, plane coordinates, vertical and horizontal angles, horizontal and inclined distances. Numerous instruments and methods have been developed for this purpose. It is almost impossible to take observations in the surveying process that are completely stable; which means free from small variations caused by errors. With these error-prone measured data, it’s a matter of establishing their effects on the measurements. This involves starting from the indirect measurements and determining its mathematical relationship to evaluate its direct measurement.
The methodological approach used in this study (see Trélat 9 ) is that of an optimal control problem consisting of two parts: determining an optimal trajectory (distance, height, angle) joining an initial set (indirect measurements) to a target (minimizing overall uncertainty), and ascertaining that the target is attainable with reference to Zhuo’s 7 various methods. Next, numerical simulations will help us to better calibrate our instruments in order to assess its optimal trajectory.
The typical measurement propagation law for a quantity

where
Remote elevation measurement (REM) method
The principle of the REM (see Duggal 10 ) is illustrated in Figure 1 below:
where a prism B is vertically positioned under an unknown point A, the height

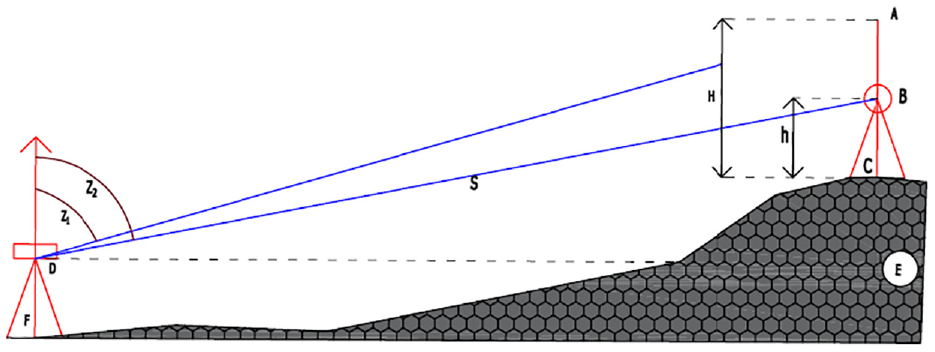
Schematic diagram of the REM, where the zenith distances
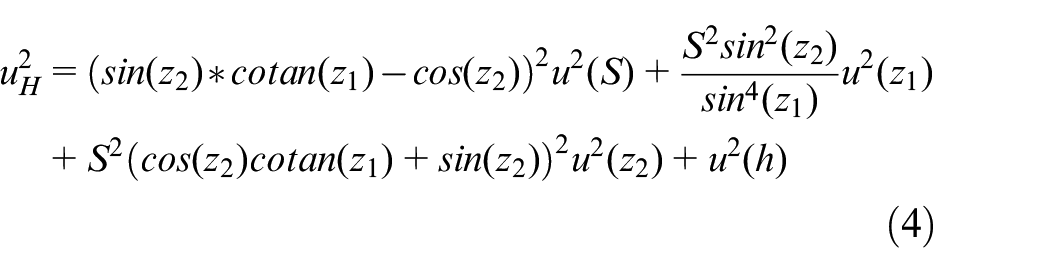
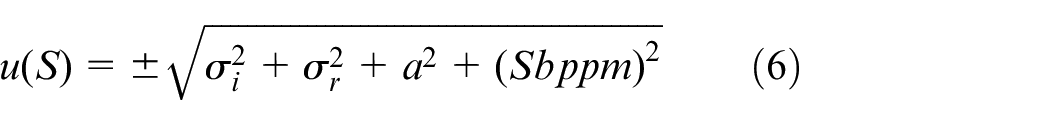
The standard uncertainty of the REM associated with height H above the ground is obtained according to JCGM 100 11 by the formula (1) of the combined standard uncertainty which can be written as
This is the law of propagation of uncertainties (see Zhang and Wang
12
), where
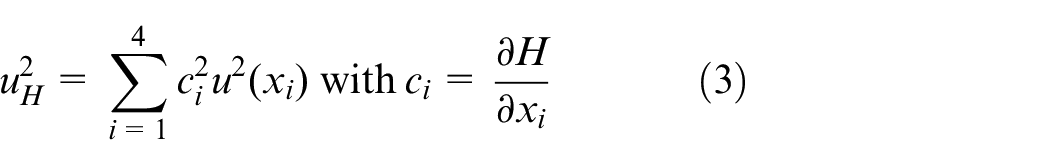
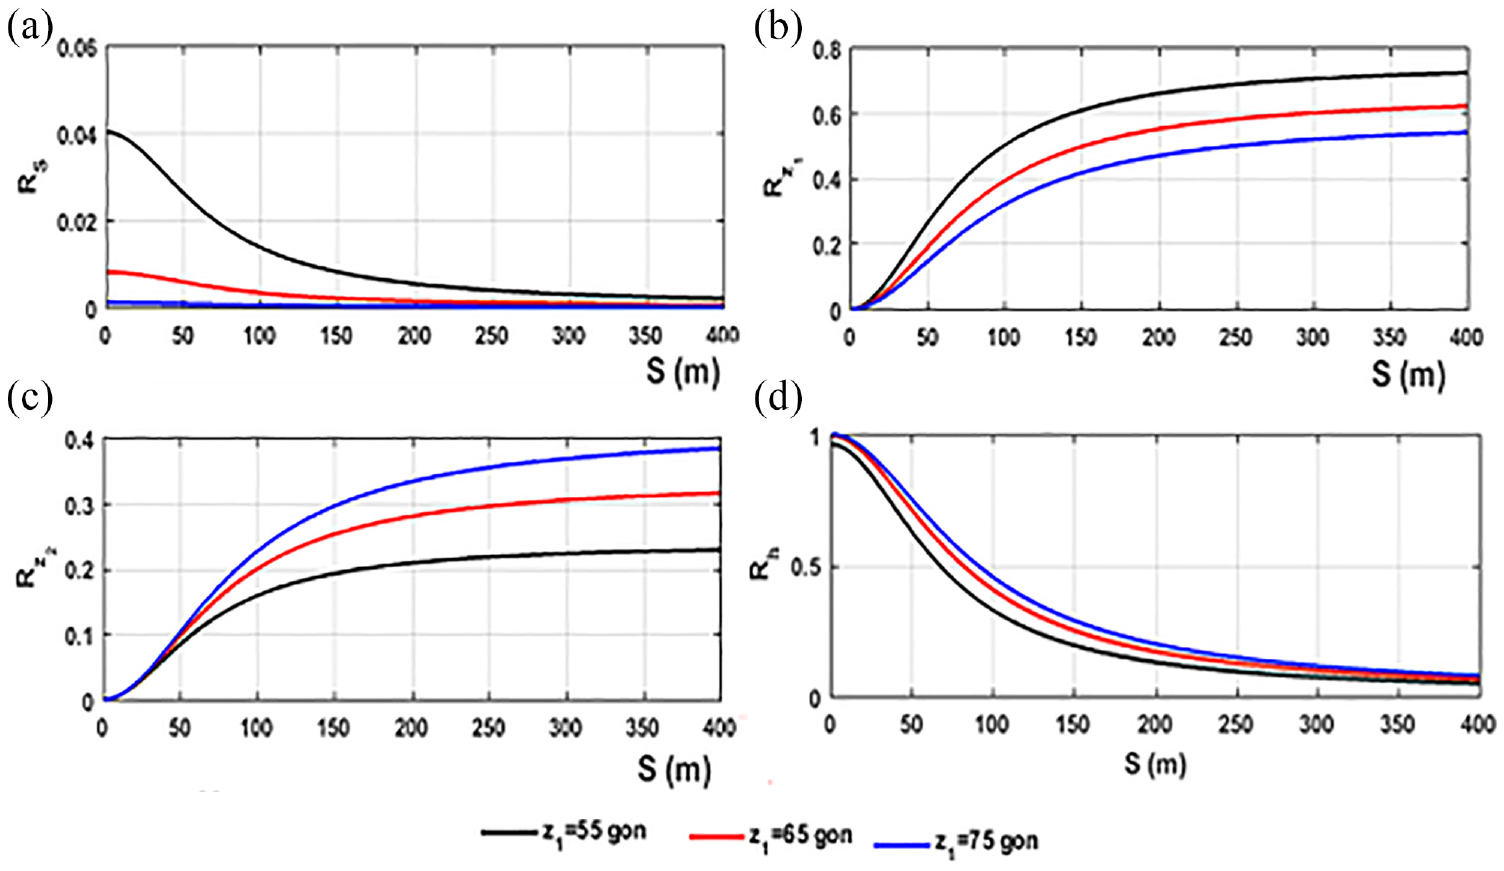
At this level, it may be useful to analyze the relative importance of each component of uncertainty. For this, we defined relative contribution coefficients:
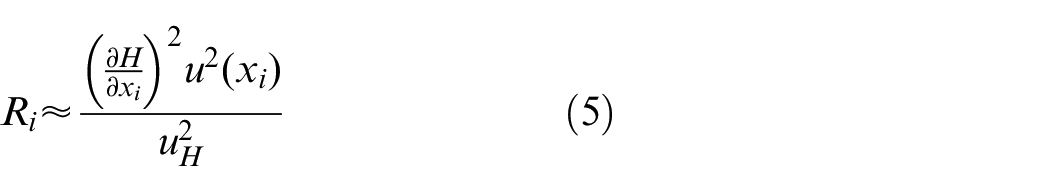
This is the eigenvalue contribution of the error variance (uncertainty square) on
The uncertainty analysis provides a formal and systematic framework for quantifying the uncertainty associated with system results. In addition, it provides the designer with useful information on the contribution of each stochastic fundamental parameter to the overall uncertainty of system outputs. This knowledge is essential for identifying the “important” parameters that need to be given more attention, in order to better evaluate their values and thereby reduce the overall uncertainty of the system results. When a system involves basic parameters whose values cannot be certain, the traditional approach is to perform a sensitivity analysis to quantify the rate of change of the output of the model, due to a change of unit in a basic parameter. In the equation (5), the individual terms
All electronically measured distance observations (confere Ceylan
13
) are subjected to instrumental errors that manufacturers consider to be a constant error
Where
where
Analysis of the relative importance of each component of global uncertainty for class T3 total station:
In this case, the equation (4) reads:
For
The tachymeter used to collect data in this study is a Leica TCR 403 total station with an angular precision of 1 mm gon and a distance precision of 2 mm + 2 ppm. The data to determine the numerical measurement uncertainty of the methods presented have been collected from a Swedish regulation called SIS-TS 21143: 2009 (see Cederholm and Jensen 15 ).
In this regulation, total stations have been classified as read in Table 1 below according to the expected standard uncertainties, with the aim of predicting the distances and zenith angles to measure, to obtain the lowest possible overall uncertainty of the object to measure.
Classification of total stations according to the SIS-TS 21143: 2009 standard.
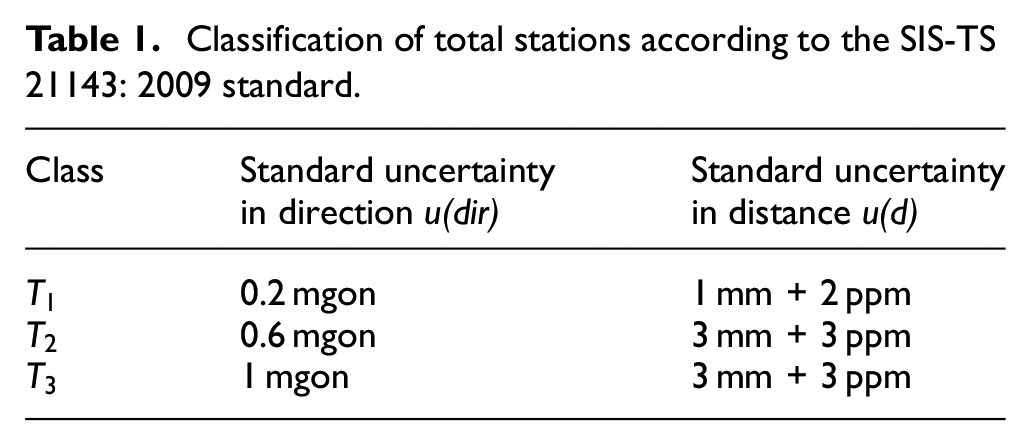
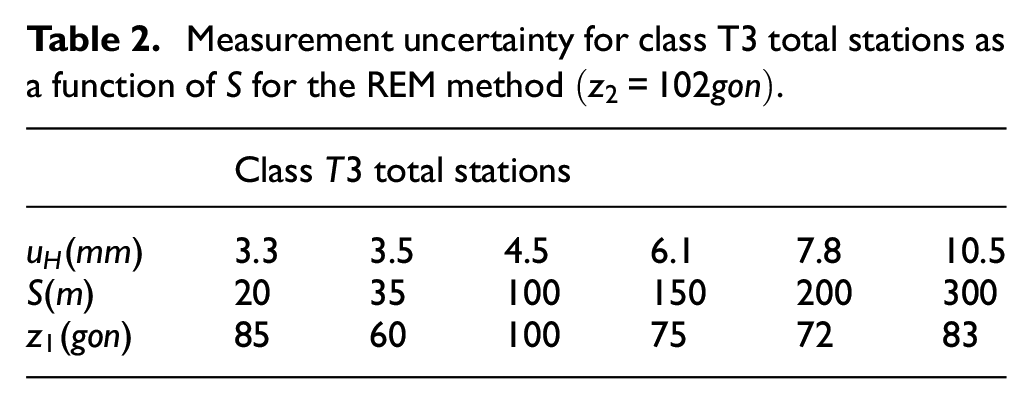
Table 2 below shows the values of the uncertainties under the influence of the parameters
Measurement uncertainty for class T3 total stations as a function of
The simultaneous effects of the main parameters of influence
Global uncertainty analysis for class T3 total stations according to parameters S and
The overall uncertainty increases rapidly as the stationing distance
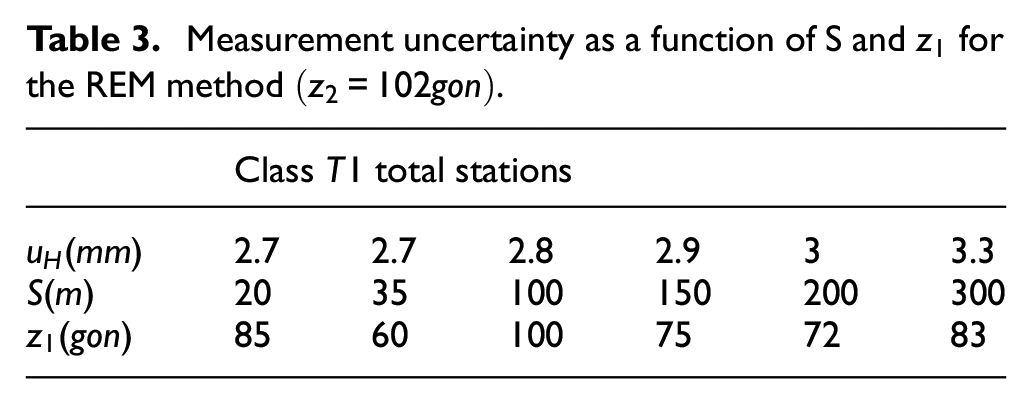
Measurement uncertainty as a function of S and
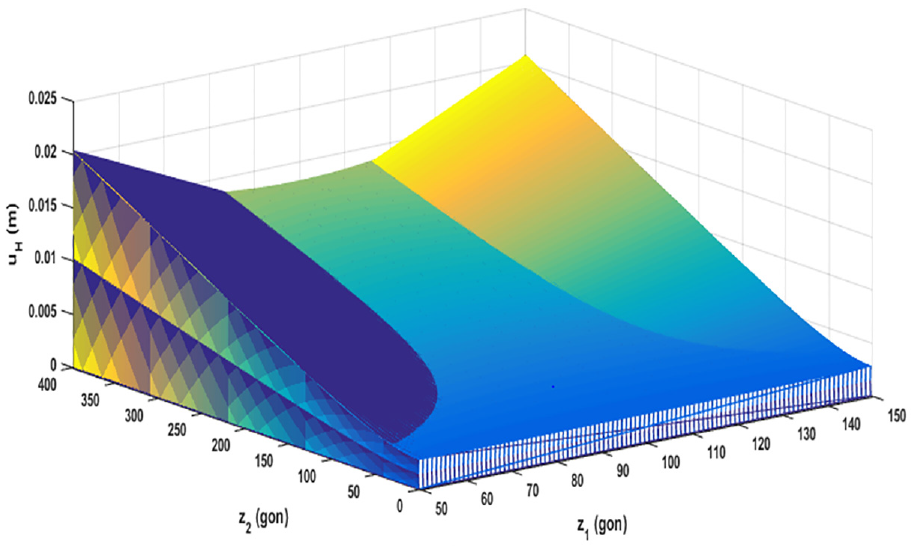
A graphical representation of the uncertainty as a function of parameters
Analysis of the overall uncertainty for a class T1 total station according to parameters S and
Moreover, for a fixed value of the global uncertainty on the height
Highlighting the maximum positioning distance for a class
Remote elevation dual measurement (REDM) method
The principle of the REDM is illustrated in Figure 6.
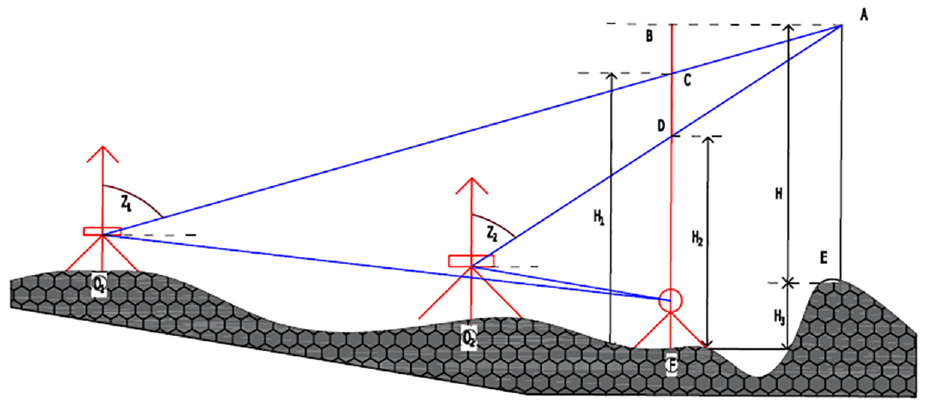
Diagram of the principle of the REDM method (confere Zhuo 7 ).
Heights
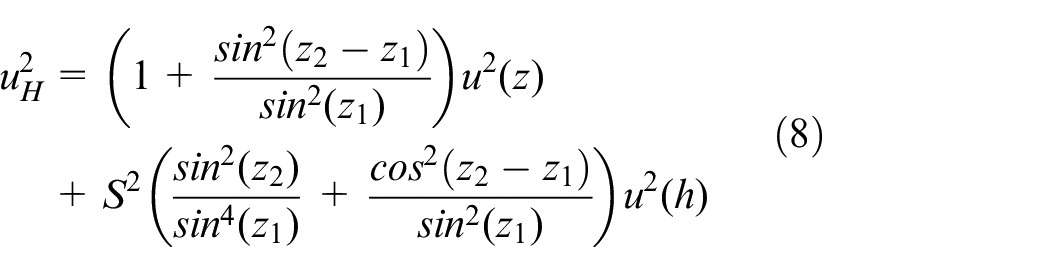
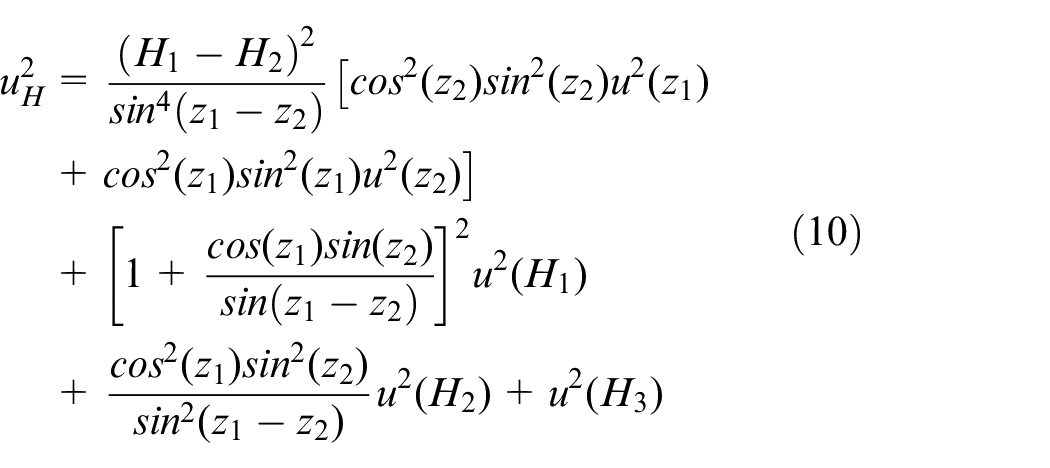
Recall formula (1), the explicit form of the combined standard uncertainty of height H above ground of unknown point A inaccessible reads:
It is important to identify the parameters that a small variation will induce a rapid increase in overall uncertainty. A graphical representation of the relative importance of each component of the uncertainty resulting from the equation (5) allows to obtain Figure 7.
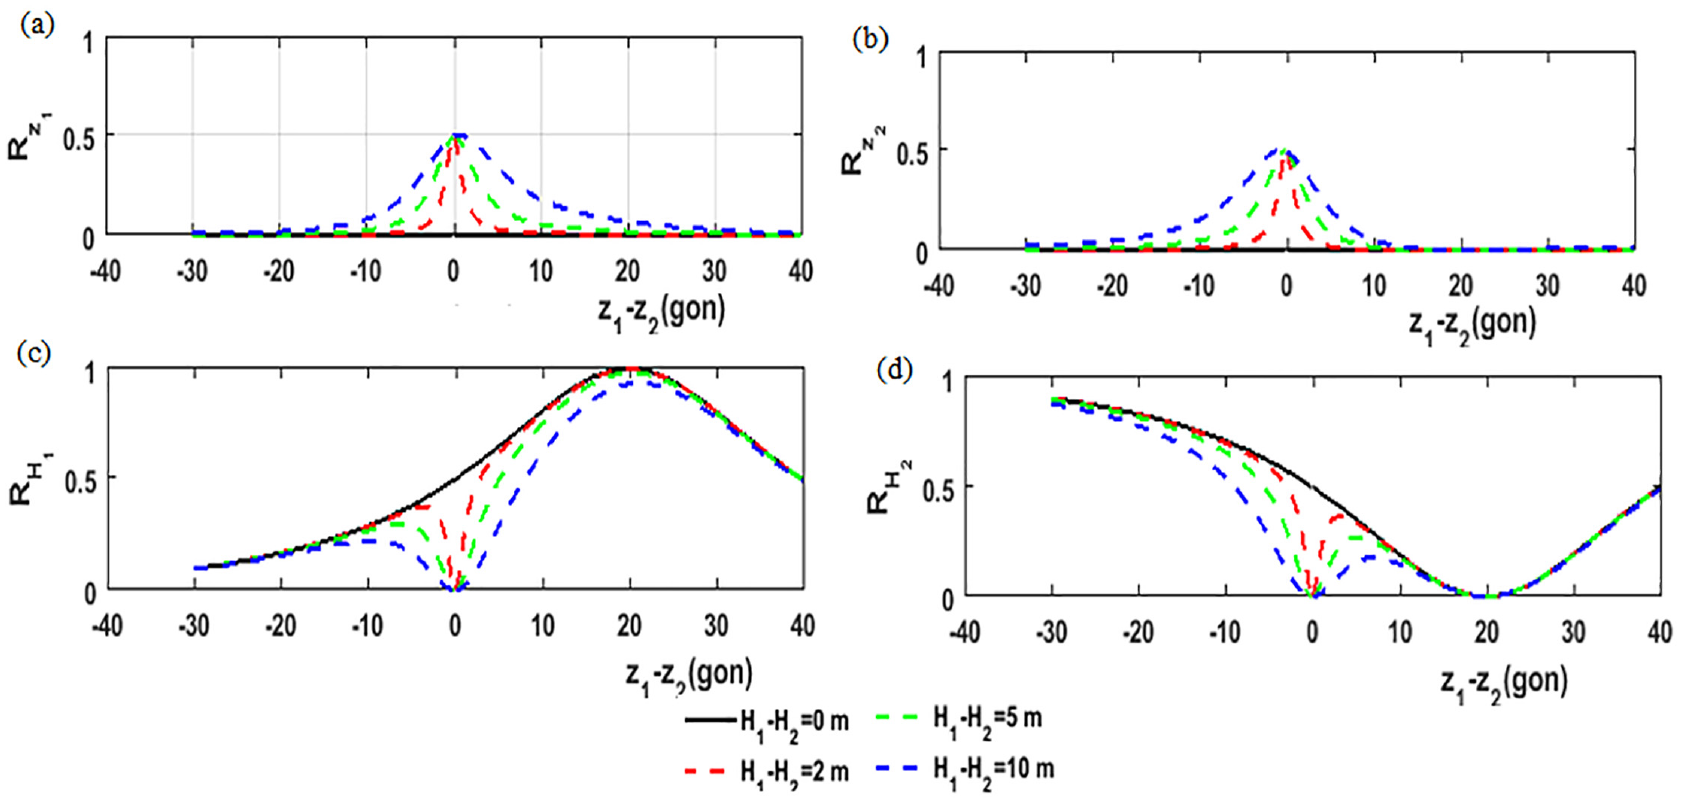
Analysis of the relative importance of each component of the global uncertainty for class T3 total station:
Generally, when
Thus, for values of
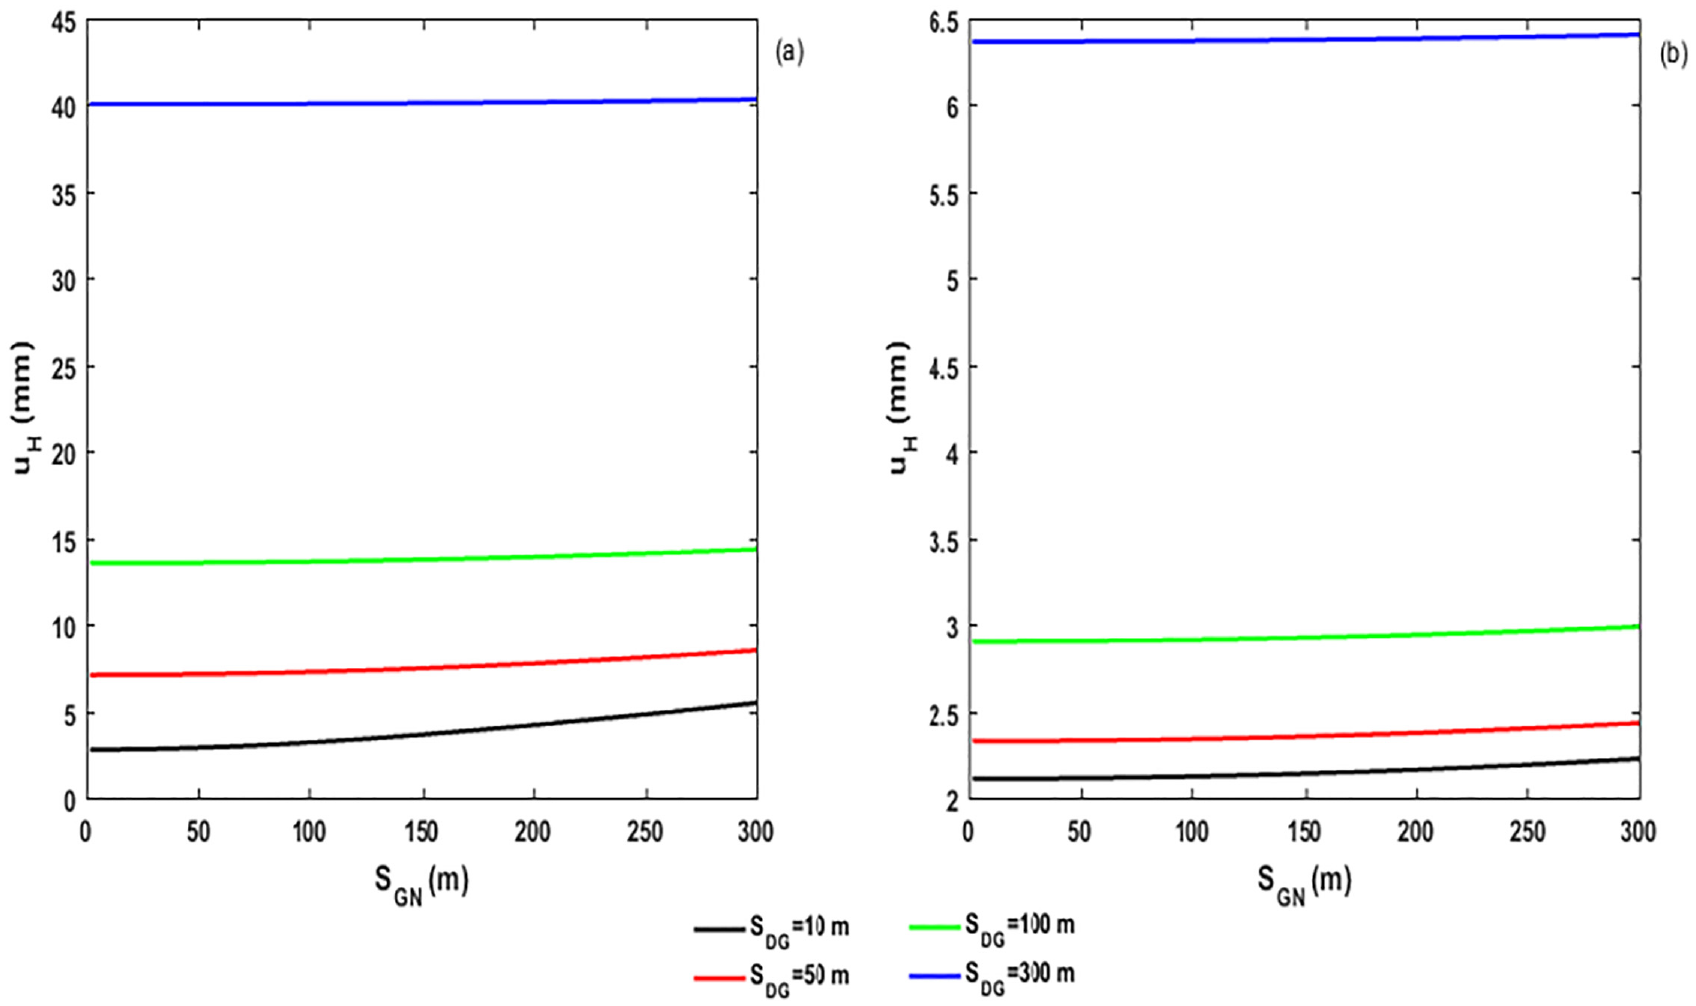
Measurement uncertainty as a function of
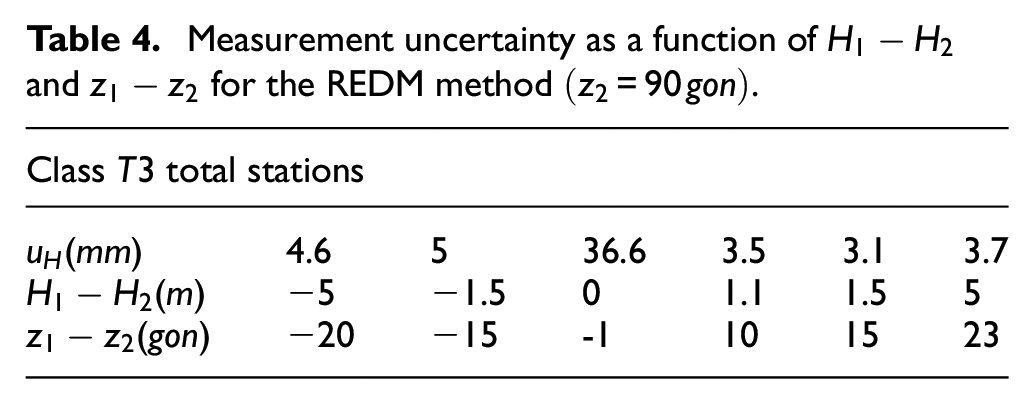
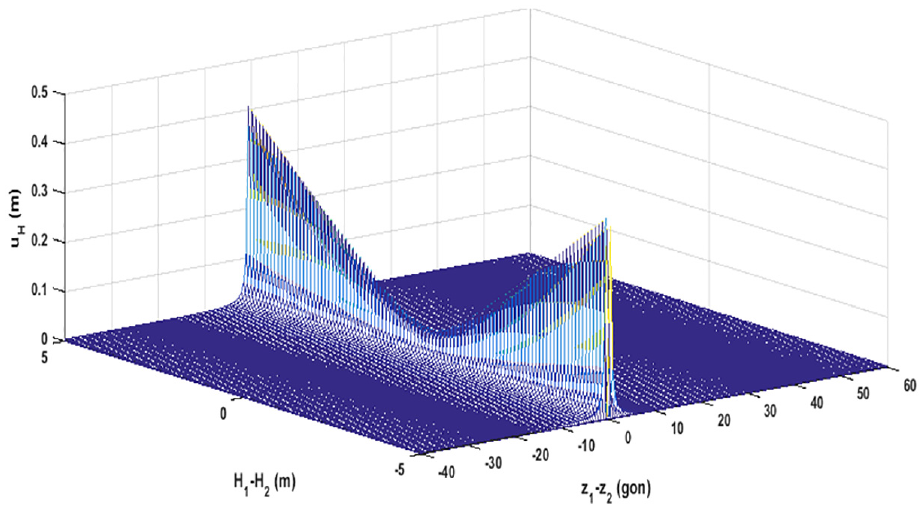
Variation for a class T3 total station of the global uncertainty as a function of
Thus, the increase in the difference
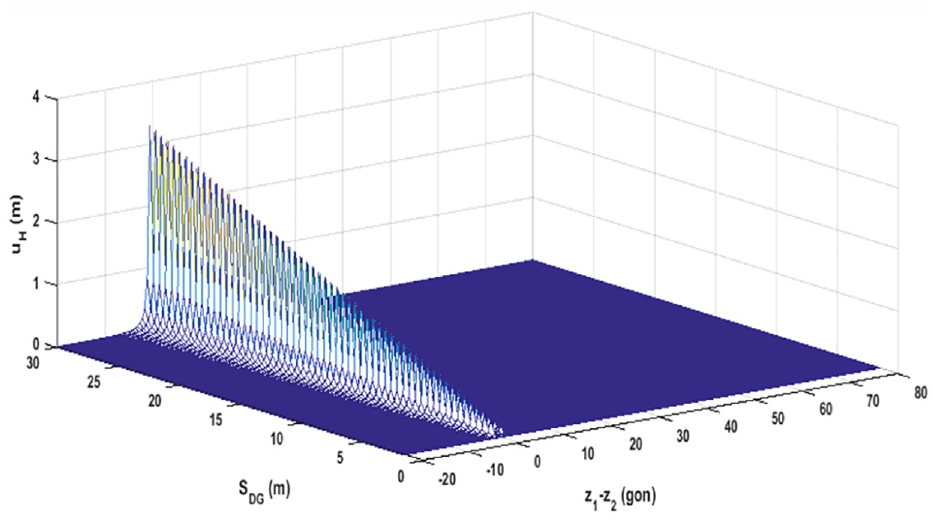
Measurement uncertainty as a function of
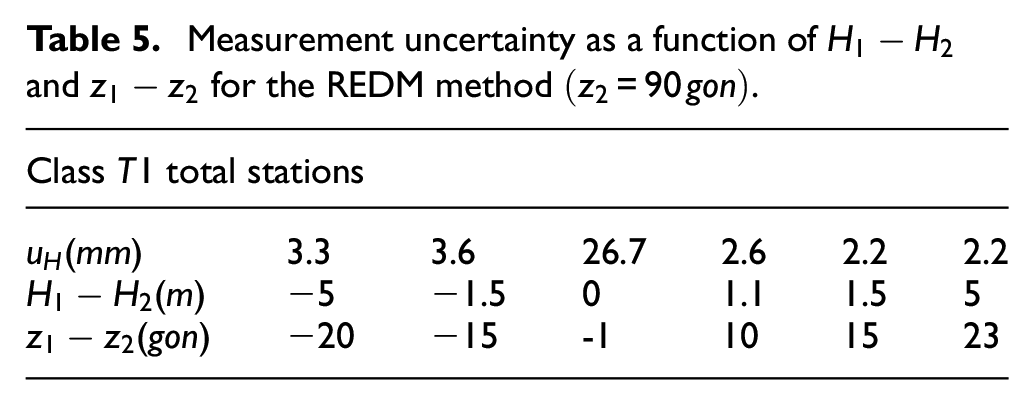
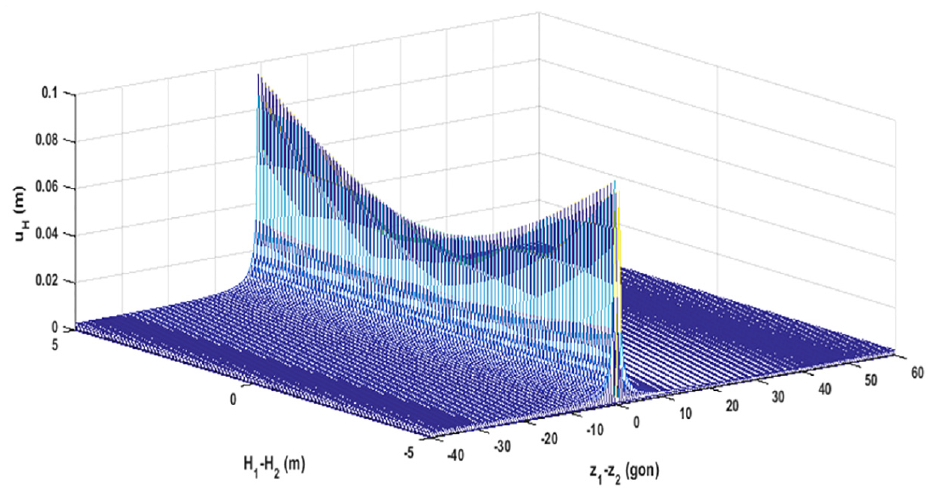
Variation for a class T1 total station of the overall uncertainty as a function of
A marked improvement in uncertainty is observed because the uncertainties obtained with a class T1 total station are more accurate than those obtained with a class T3 total station. The class of the total station has an important influence on the overall uncertainty of the height to be measured. Among the largest accuracies, we can expect an accuracy of
The front-to-back measurement (FBM) method
The principle of the FBM method is shown in Figure 10 below,
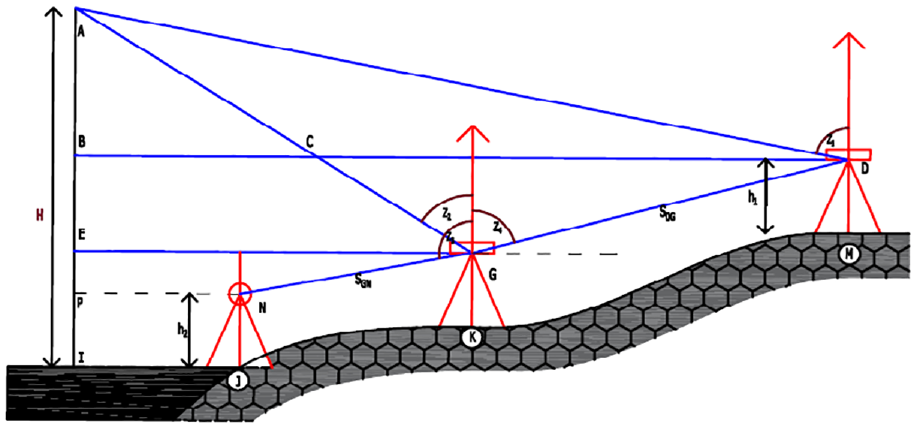
Diagram of the principle of the FBM method (confere Zhuo 7 ).
where a total station is placed at point M and its height
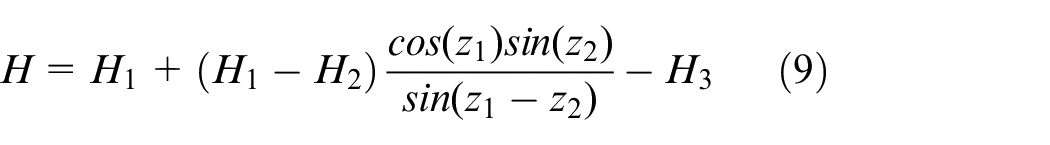
Thus, the height H above the ground of the unknown point inaccessible A reads:
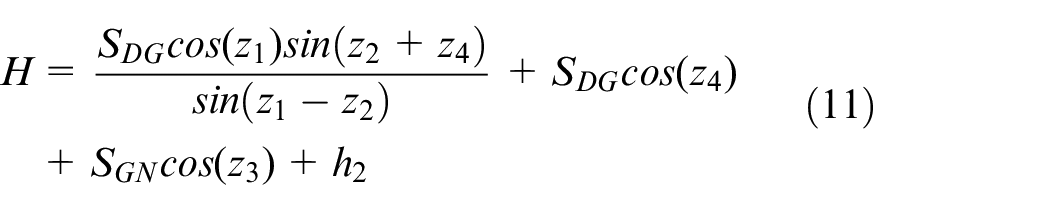
where
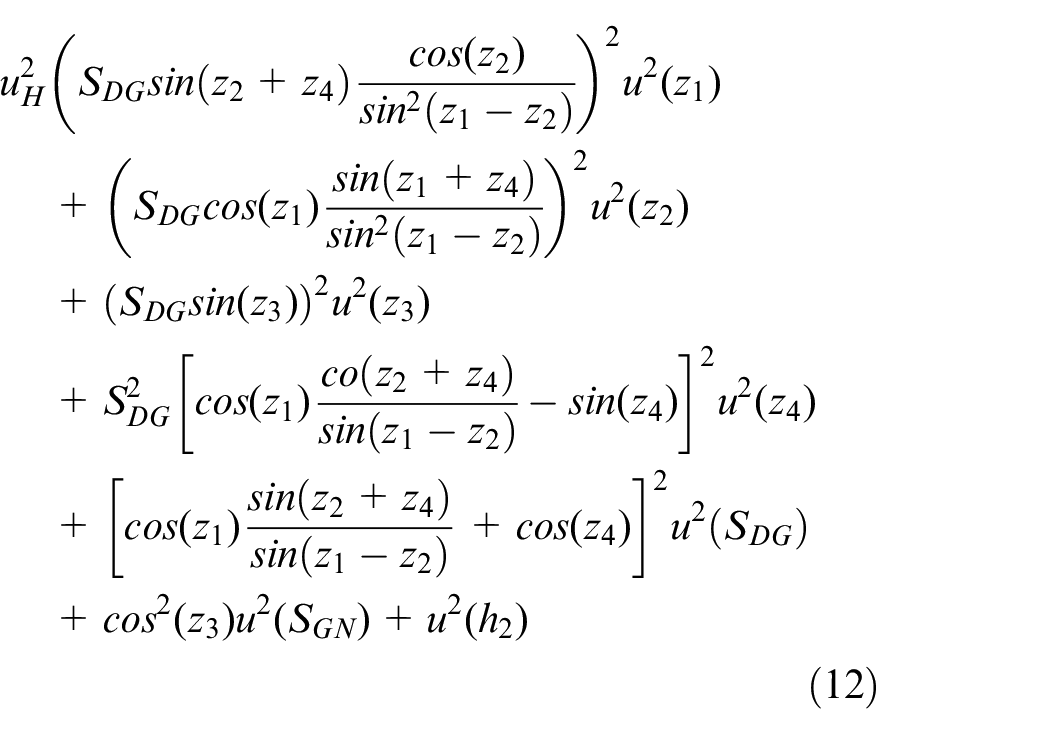
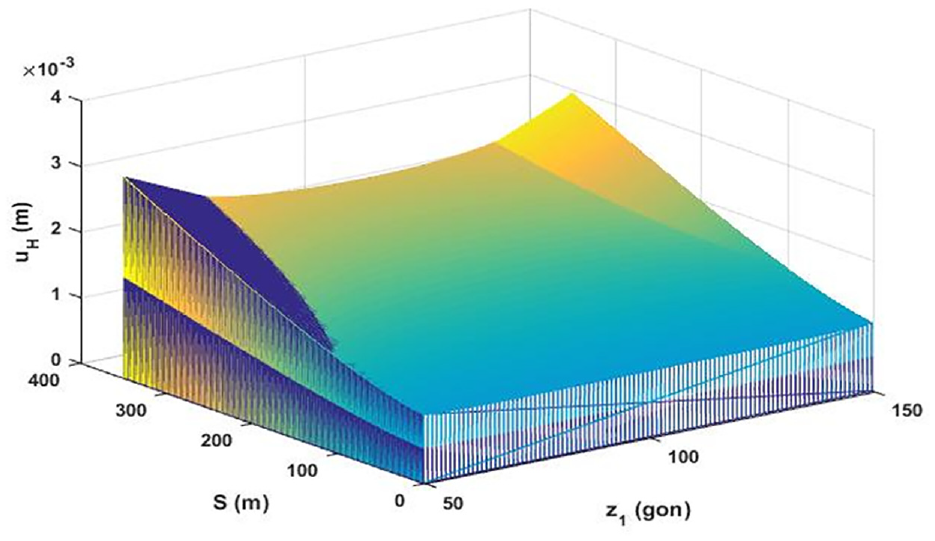
Equation (12) is a very complex functional relationship giving uncertainty as a function of indirect measurement parameters. It is therefore, important to analyze the weight of the relative importance of the specific contributions to the angle and distance parameters in relation to the overall uncertainty. Thus, the weight of the different sources of parameter errors is shown in Figure 11 below:
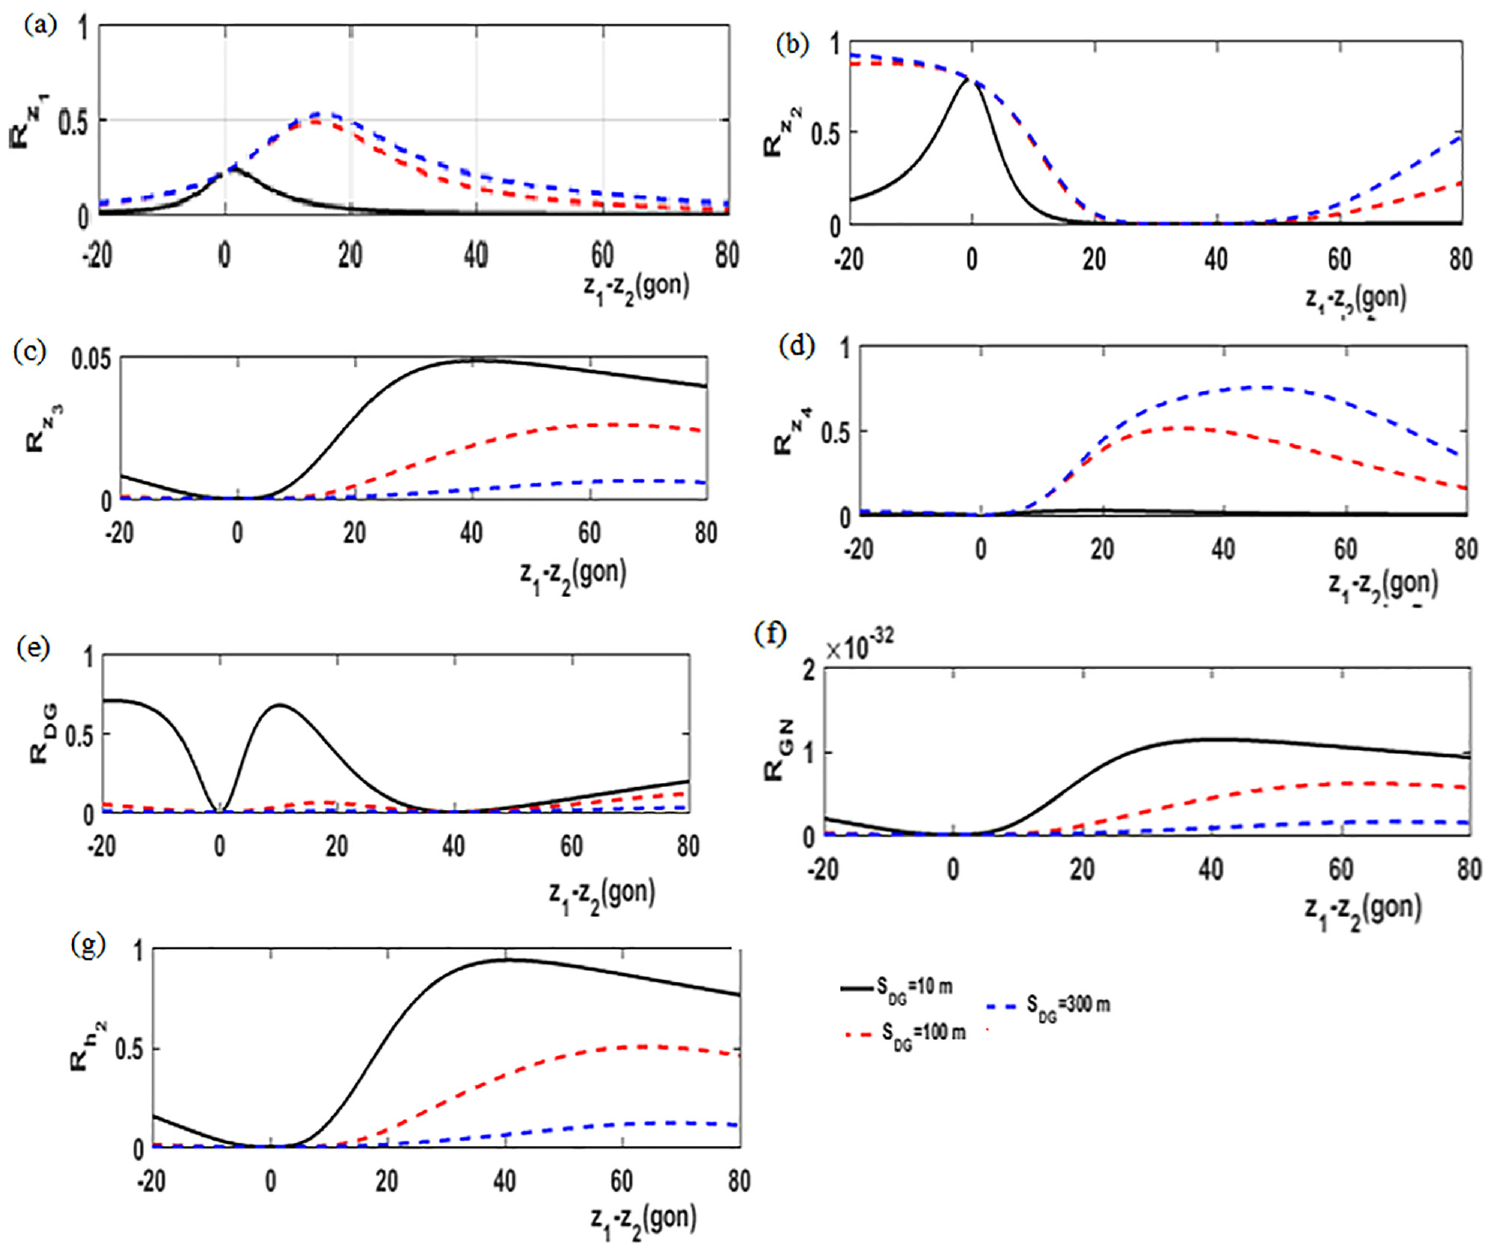
Analysis of the relative importance of each component of global uncertainty for class T3 total station:
When the distance
Slight variation of overall uncertainty as a function of
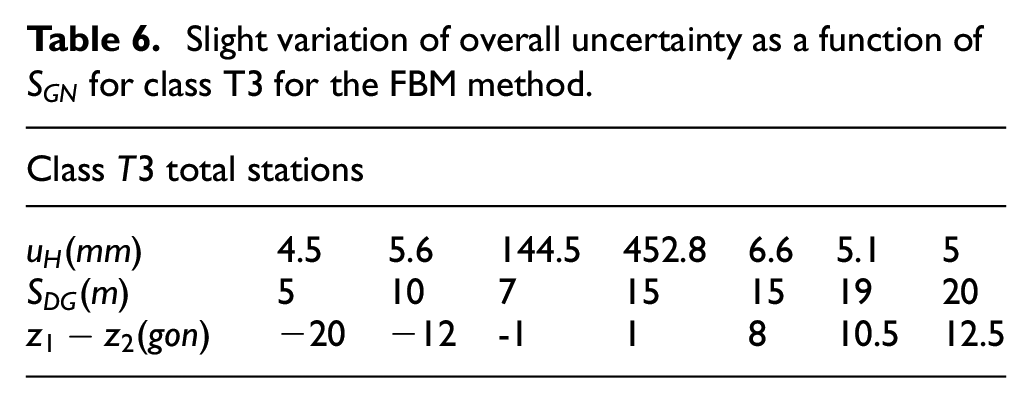
Slight variation of overall uncertainty as a function of
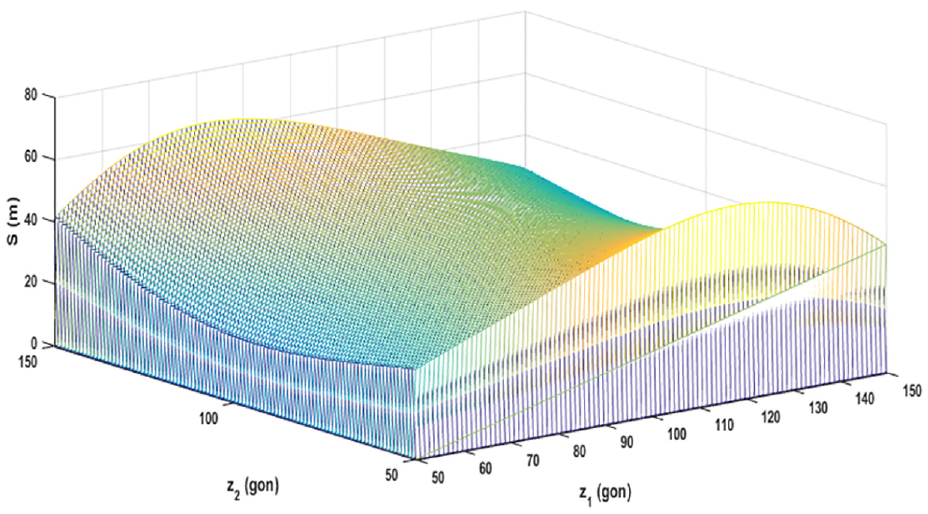
The overall uncertainty
However, the influence of the backsight characterized by the
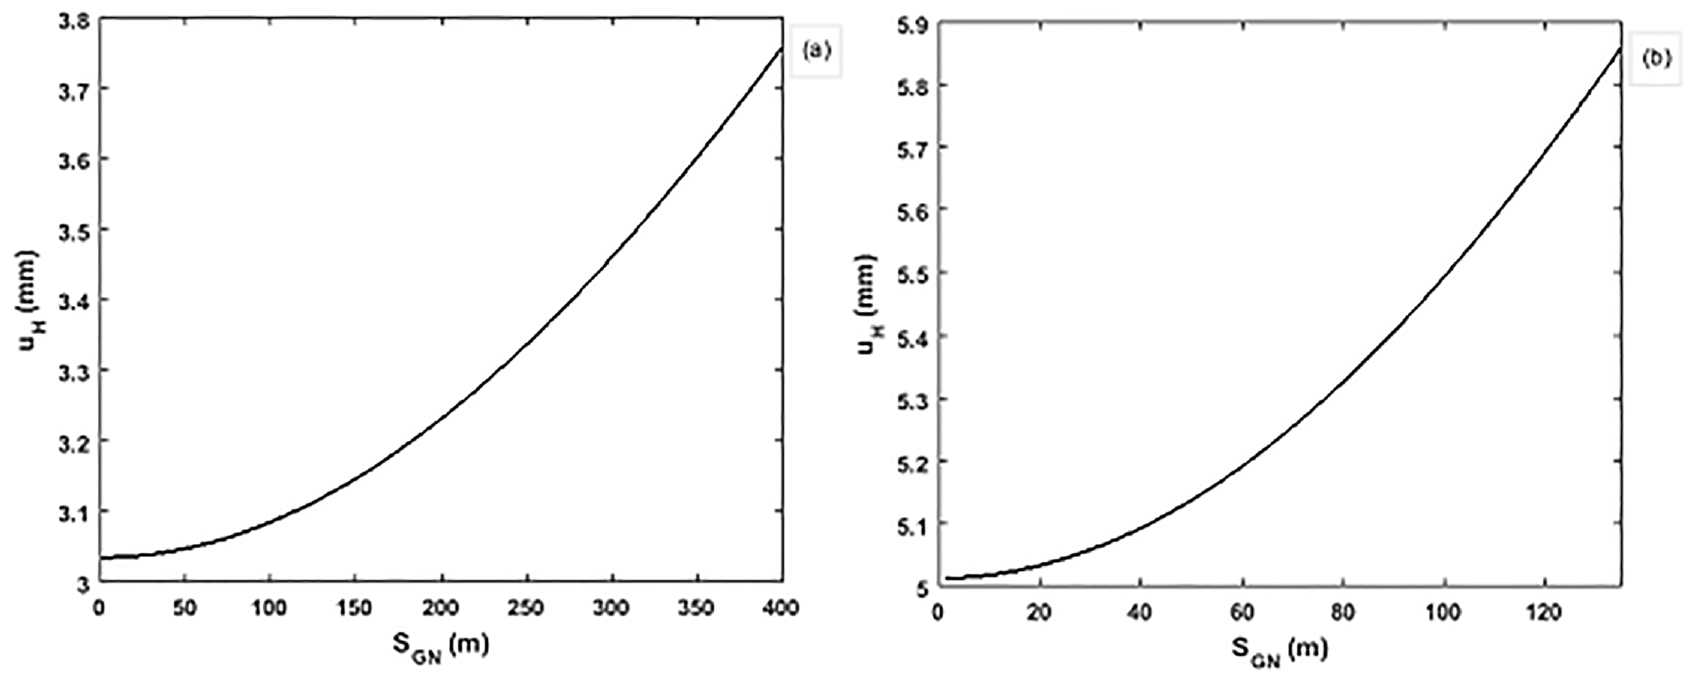
Strong influence of
Uncertainty strongly increase with
Moreover, Figure 14 above shows that the overall uncertainty
Variation of overall uncertainty as a function of
Results and discussion
In this work, the numerical simulations are performed in a context where the spans separating the prism of the instrument cannot go beyond 300 m. This has neglected the refraction of light and the effect of the roundness of the earth (see
14
). Thus, a good measure of the weight of the contribution of a component of the uncertainty must be without dimension such as
Figure 4 shows a clear improvement in the accuracy due to the characteristics of the class T1 total station compared to that of T3 obtained in Figure 3. The theory of the REM method is simple, but the observation process is a bit more complex, because when positioning the prism under the unknown point, the prism should be placed very close to the vertical area below or above the unknown point. Which is not always obvious in the field.
Moreover, the REDM is influenced by weights of
On the other hand, the FBM is influenced by weights of
Conclusion
The class T3 total station used as a survey instrument in this paper with appropriate method selected, gave us results as precise and convincing as much as would have given the total station of higher class T1 more powerful and 10 times more expensive. Thus, analysis of numerical simulations of the overall uncertainty of point measurement using a given method depends on the contribution affecting it, not the tool. For this reason, the optimal control technique informs us that the displacement altitude measurement method produces better height accuracy for points where it is possible to place a prism under the plumb line; whereas the double distance altitude measurement method is recommended, since in this case the prism can be placed at the target point provided that small differences in zenith angles
Footnotes
Acknowledgements
The authors are grateful to the National Advanced School of Public Works (NASPW) for providing the ideal framework for the completion of this work. Morever, this work is under the project sanctioned by the laboratory of topograghy modeling materials and methods of NASPW.
Declaration of conflicting interests
The author(s) declared no potential conflicts of interest with respect to the research, authorship, and/or publication of this article.
Funding
The author(s) received no financial support for the research, authorship, and/or publication of this article.
Data availability statement
The authors confirm that they have included data availability in our main manuscript file and the data will be made available on reasonable request. These data have been collected from a Swedish regulation called SIS-TS 21143: 2009 standard.