
Abstract
The evaluation of balance and postural stability holds significant importance in both medical rehabilitation and daily life. However, the clinical method is hindered by the inconvenience of immobility and relatively high costs associated with the force platforms. Wearable sensors, such as accelerometers, have emerged as an alternative solution, overcoming the limitations of traditional force platforms. Thus, the purpose of this study is to utilize data obtained from a low-cost, portable, small-sized IMU (specifically an accelerometer) to predict indicators derived from force platform devices. A miniaturized and portable acceleration test equipment was proposed. Together with the random forest algorithm, our classification method achieved classification results with accuracy, recall, precision, f1-score, and specificity scores above 95%, This study provides a more portable and highly accurate tool for assessing balance ability.
Introduction
Balancing or postural control is defined as the ability to keep the center of gravity within the support area marked by the outer contour of the feet. 1 Maintaining balance requires coordination and collaboration among the vestibular, visual, and proprioceptive systems. 2 The capability to balance effectively serves as a valuable reflection of the overall health of these intricate bodily systems, which is the foundation of clinic monitoring child development, assessing physical function in the elderly, and detecting falls. Numerous specific medical conditions, such as Parkinson’s disease, stroke, and multiple sclerosis, are closely linked to balance ability. 3 For instance, individuals with multiple sclerosis may experience balance defects due to slowed proprioceptive transmission and impaired central integration. 4 Consequently, balance ability is considered a crucial indicator for assessing the progression and rehabilitation of these diseases. Therefore, conducting effective assessments of balance ability holds paramount importance.
Currently, the primary methods used to assess balance ability include observational techniques, scale assessments, and quantitative postural analysis. 5 Observation and scale assessment methods, such as Single-leg Stance Test 6 and Berg Blance Scale, 7 are user-friendly and straightforward, yet their reliance on subjective judgments results in low reliability. Additionally, due to their dependence on extensive clinical experience, these methods are challenging to generalize widely. The quantitative postural analysis, referred to as the “gold standard,” utilizes force platforms to measure parameters such as support reaction force, moments, and others, to trace the trajectory of the center of pressure (CoP).8,9 This method employs swing velocity analysis (CoPv) or trajectory spatial dispersion analysis (area, root mean square, path length, etc.) to generate quantitative data outcomes. 10 It encompasses both static and dynamic postural analyses.
Among these, static postural tasks based on the Romberg test have become the most common and practical means in clinical settings due to their simplicity and ease of execution.11,12 However, the expensive and cumbersome nature of force platform devices hinders their further development and widespread applicability. In contrast, wearable sensors, characterized by easy management and relatively low cost, offer a promising alternative. 13 In the evaluation of postural stability, wearable sensors, particularly inertial sensors represented by accelerometers, are considered to have significant potential for broader applications.14,15
Although the measurement mechanisms differ from force platform methods, the reliability and effectiveness of accelerometers for assessing balance ability have been demonstrated. Force platforms reflect posture through the parameters of the center of pressure (CoP), and the average velocity of the center of pressure during quiet standing (COPv) is considered the most reliable measurement method for evaluating postural stability. 16 The COP velocity from force platforms reflects the acceleration of the center of mass (COM) rather than velocity (with a higher correlation). 17 Due to the proximity of the lower back region to the body’s center of gravity, accelerometers fixed in this area have been widely adopted in assessing postural stability. 18 As early as 1998, research found that the root mean square (RMS) of acceleration during two-foot standing demonstrated high absolute test-retest reliability but relatively low relative reliability. 19 Subsequent studies extracted moderately well-reliable indicators from Inertial Measurement Unit (IMU) systems. 10
Wearable accelerometers have a long history of development in balance measurement for specific diseases. Some studies have aimed to provide balance assessments for Parkinson’s disease (PD) and proposed three accelerometer data indicators with good reliability and sensitivity, 20 and detect PD progression. 20 Accelerometers have also been successfully used in explicit Huntington’s disease, 21 multiple sclerosis,4,22,23 stroke, 24 and acute sports-related concussions (SRC). 25 In the context of fall prediction, IMUs, represented by accelerometers, have been used to differentiate between fallers and non-fallers, as well as to assess fall risk.16,26,27
Previous research has demonstrated that IMUs, represented by accelerometers, are reliable tools for measuring postural stability, particularly excelling in the mediolateral direction for low-difficulty tasks.28,29 However, the accuracy of balance assessment based on IMUs compared to the “gold standard” force platforms remains unknown, and wearable sensors have not yet become the standard in postural measurement studies. 30 There are currently two main issues in the application of accelerometers for postural assessment. Firstly, the low correlation observed in direct data comparisons between accelerometers and force platforms suggests that these methods do not measure the same components of postural stability. 2 Parameters obtained from acceleration and Center of Pressure (COP) signals estimate different physical quantities, making it challenging to directly apply accelerometer data to the “gold standard.” Secondly, most studies employ statistical methods to analyze feature parameters or traditional machine learning approaches. They utilize various descriptive variables, assessment protocols, and sensor placement, leading to a lack of standardization in balance estimation. 31 Deep learning methods possess robust capabilities for processing complex data and have the potential to extract information related to human balance control from various parameters, thereby addressing these issues. Successfully applied to handle accelerometer data, deep learning methods offer a promising avenue for improving balance assessment. 32
Therefore, the purpose of this study is to utilize data obtained from a low-cost, portable, small-sized IMU (specifically an accelerometer) to predict indicators derived from force platform devices. The aim is to establish a direct correlation between the two methods of balance assessment, providing adaptability to the “gold standard.” During both open-eye (EO) and closed-eye (EC) conditions, we measured acceleration data using a belt-mounted accelerometer device fixed at the lower back’s L5 position. Employing methods such as machine learning, we constructed predictive models by learning complex relationships from intricate balance parameters and comparing the results with parameters obtained from force platform devices. Throughout this process, we also explored the impact of different signal processing parameters (low-pass filter cutoff frequency and test data time length) on the results. Ultimately, we achieved a comparably high correlation for the assessment model (ROD Ellipse Area 0.804, ROD length 0.812) and good classification accuracy (Ellipse Area 62%, length 75%). This study provides a more portable and highly accurate tool for assessing balance ability.
Research methods
We aimed to simultaneously record acceleration data while subjects performed the Romberg test on a force platform device. The ultimate goal was to derive evaluation metrics that distinguish between good and poor balance conditions from the acceleration data, provided by the force platform. To this end, volunteers were recruited to participate in the experiment. The experimental details are introduced in the experiment paradigm section, which includes two phases (EC and EO).
Given that the final purpose relies on two metrics (ellipse area ratio and sway length ratio), which are the ratios of these metrics between the two phases, that is, ellipse area EC/ellipse area EO and sway length EC/ sway length EO, our first objective was to separately predict the ellipse area and sway length values in these two phases, constituting a regression task.
To achieve this, we sought to construct regression models to predict the output metrics of the force platform device within each phase, namely, the sway ellipse area and sway path length. Therefore, we employed Random Forest regression models responsible for predicting each phase, motivated by the consideration that the human body is in states of closed and open visual systems during these phases, respectively. We hoped that using two models to handle the data separately would better identify the mapping relationships from acceleration data to the output metrics of the force platform in these two periods.
For better training of the Random Forest models, we performed several preprocessing steps on the samples, including dataset division, sample augmentation (increase in quantity), balancing the number of positive and negative samples, filtering, normalization, and feature extraction. Our hope was that the final results would adequately reflect the predictive capacity on data from subjects not seen by the model. Therefore, we randomly divided the training and test sets by name in a 7:3 ratio. During the model prediction process, three-fold cross-validation was adopted, among other techniques, to achieve the best prediction effects. We explored the impact of some parameters in these steps on predictive performance and analyzed the importance ranking of the features used.
Participants
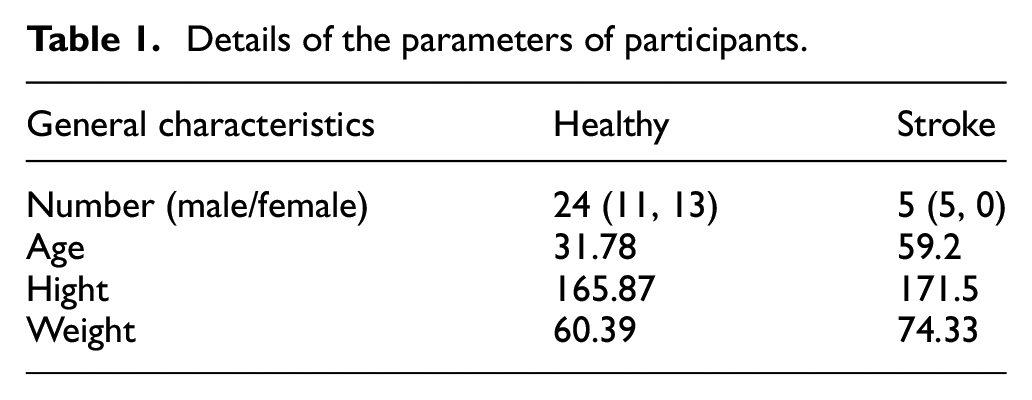
This study recruited 29 participants, whose information is presented in Table 1. The participants included hospital staff, student volunteers, and patients with stroke. All participants were capable of independently completing the tasks during the testing. The study was approved by the Ethics Committee of the First Affiliated Hospital of Nanjing Medical University (NO: 2022-SR-553), and participants provided written informed consent to participate.
Details of the parameters of participants.
Sensors
A three-axis accelerometer sensor (Figure 1(b)) was utilized for the collection of acceleration data. It is very small and extremely lightweight while achieving precise and sensitive three-axis acceleration data recording and wireless transmission. Its schematic diagram of functional components is shown in Figure 1(c). Its sampling rate was set at 1000 Hz, and data were wirelessly transmitted to the computer. The device utilizes the IIC communication protocol to enable data communication between the MPU9250 chip (InvenSense, USA) and the NRF52832 chip (Nordic Semiconductor, Norway), with the NRF52832 main control chip wirelessly transmitting acceleration data to a computer endowed with Bluetooth host functionality. The MPU9250 samples the object at a sampling frequency of 1000 Hz. The battery output management chip, TLV70028DDCR (Texas Instruments, USA), is employed to provide a stable power supply of 2.8 V to the entire sensor circuit, while the touch chip VKD233 (Vinka Microelectronics, China) is used to control the power on and off of the entire sensor.
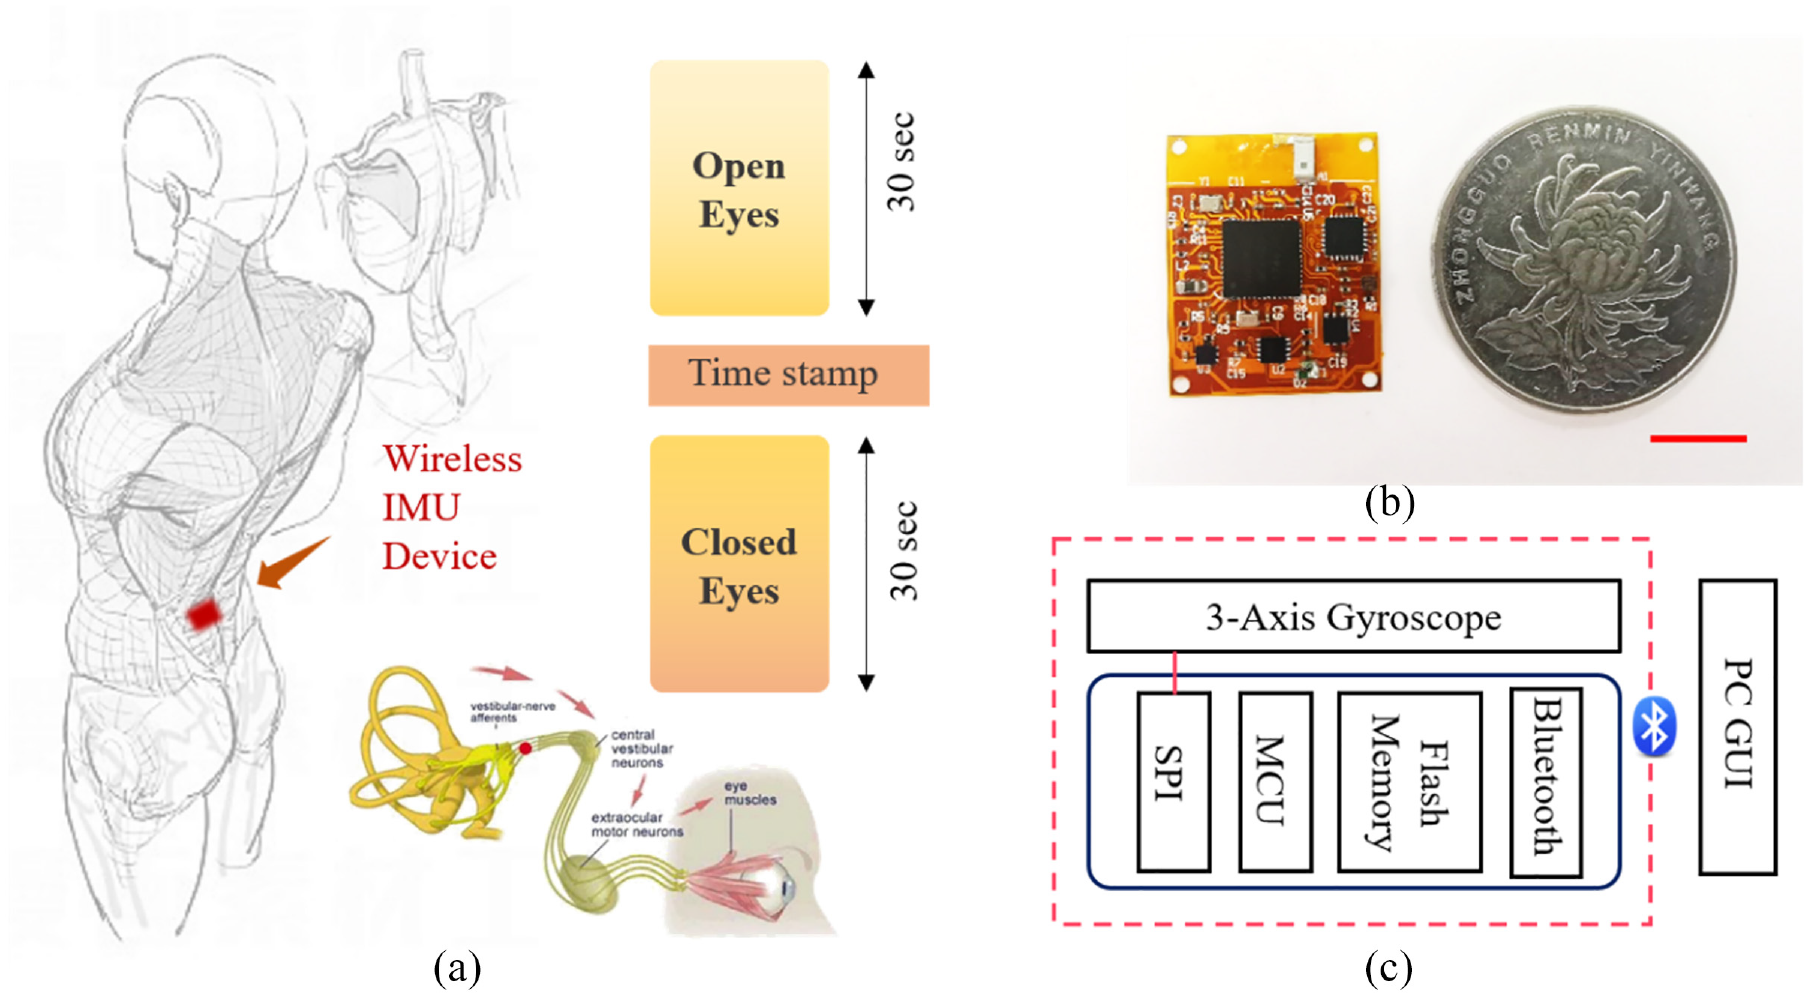
Three-axis accelerometer equipment used in the experiment. (a) The classification performance at different cut-off frequencies when the number of segments is 3. (b) The small accelerometer device compared with a coin. (c) Schematic diagram of the structure and functionality of our accelerometer device.
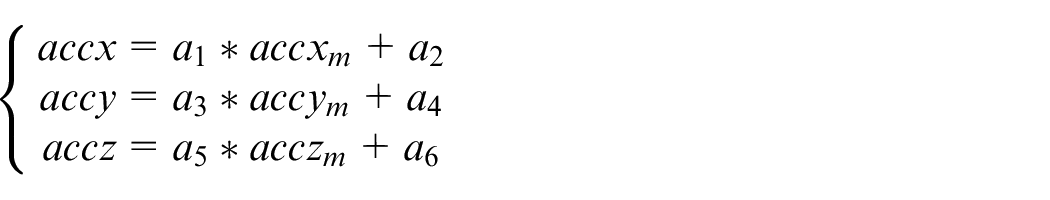
At the beginning of sensor use, it is necessary to calibrate the sensor by placing it in six different positions, each flat on a horizontal surface for a period of time, to collect a static three-direction acceleration dataset. This dataset is then used in the following three formulas for least squares fitting, where
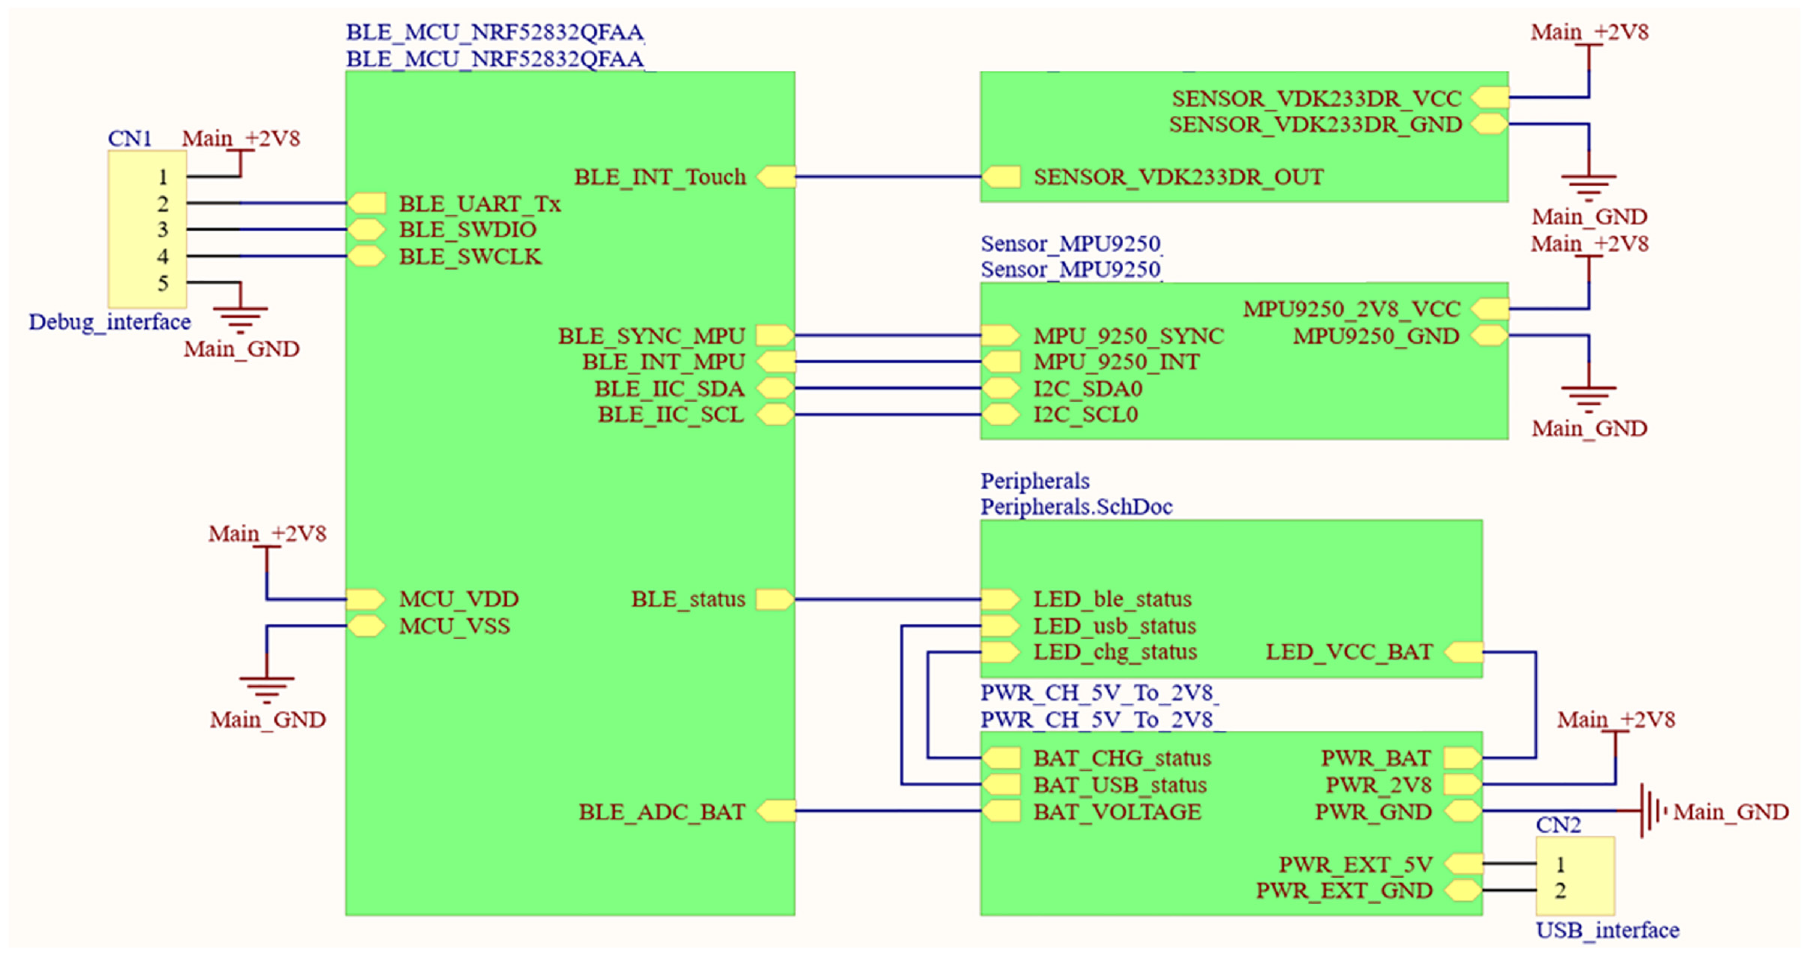
Circuit schematic of the accelerometer.
The sensor was securely fastened to the participant’s lower back at the L5 position using tape (Figure 1(a)). A balancing instrument (PRO-KIN Version, PK254, TecnoBody, Italy) for postural control tests was applied in the study. The device is capable of measuring tilts in both the anterior-posterior and left-right directions up to ±15°, with an angular accuracy of 1°. The frequency of signal recording is 20 Hz, and the input signal is filtered through a combination of analog and digital filtering methods. The parameters measured during the experiment could be outputted through the computer interface after the completion of the test.
Experimental paradigm
Before the commencement of the experiment, we provided clear explanations to all participants regarding the evaluation methods, procedures, objectives, and guidelines. We ensured that they fully understood and cooperated with the process. Each participant was asked to perform the following tasks: standing with both feet relaxed on the force platform while maintaining stillness and wearing a sticky silicone (GEL4317) with a securely attached accelerometer (Figure 3). The Romberg test consists of two stages of eye opening and eye closing. Postural instability occurs when the eyes are closed, but balance can be maintained when the eyes are open, which is sensory ataxia. When postural instability occurs under both open and closed eye conditions, it is cerebellar ataxia. 33 Therefore, in our study, each experiment consisted of two phases: eyes open (EO) and eyes closed (EC), each lasting more than 30 s. The force platform was configured to collect data for 30 s in each phase. To differentiate between these two phases in the accelerometer data, participants were instructed to perform a forward bend movement between the phases, with another forward bend occurring after completing the EC phase. Each participant repeated the experiment three times, and rest was provided after each experiment. Each experiment was treated as a sample, and each participant conducted 3 experiments, resulting in a total of 87 samples. Subsequent data processing was conducted using Visual Studio Code (Version 1.84.1, Microsoft Corporation, USA) and OriginPro 2022 (Version 9.90, OriginLab Corporation, USA).
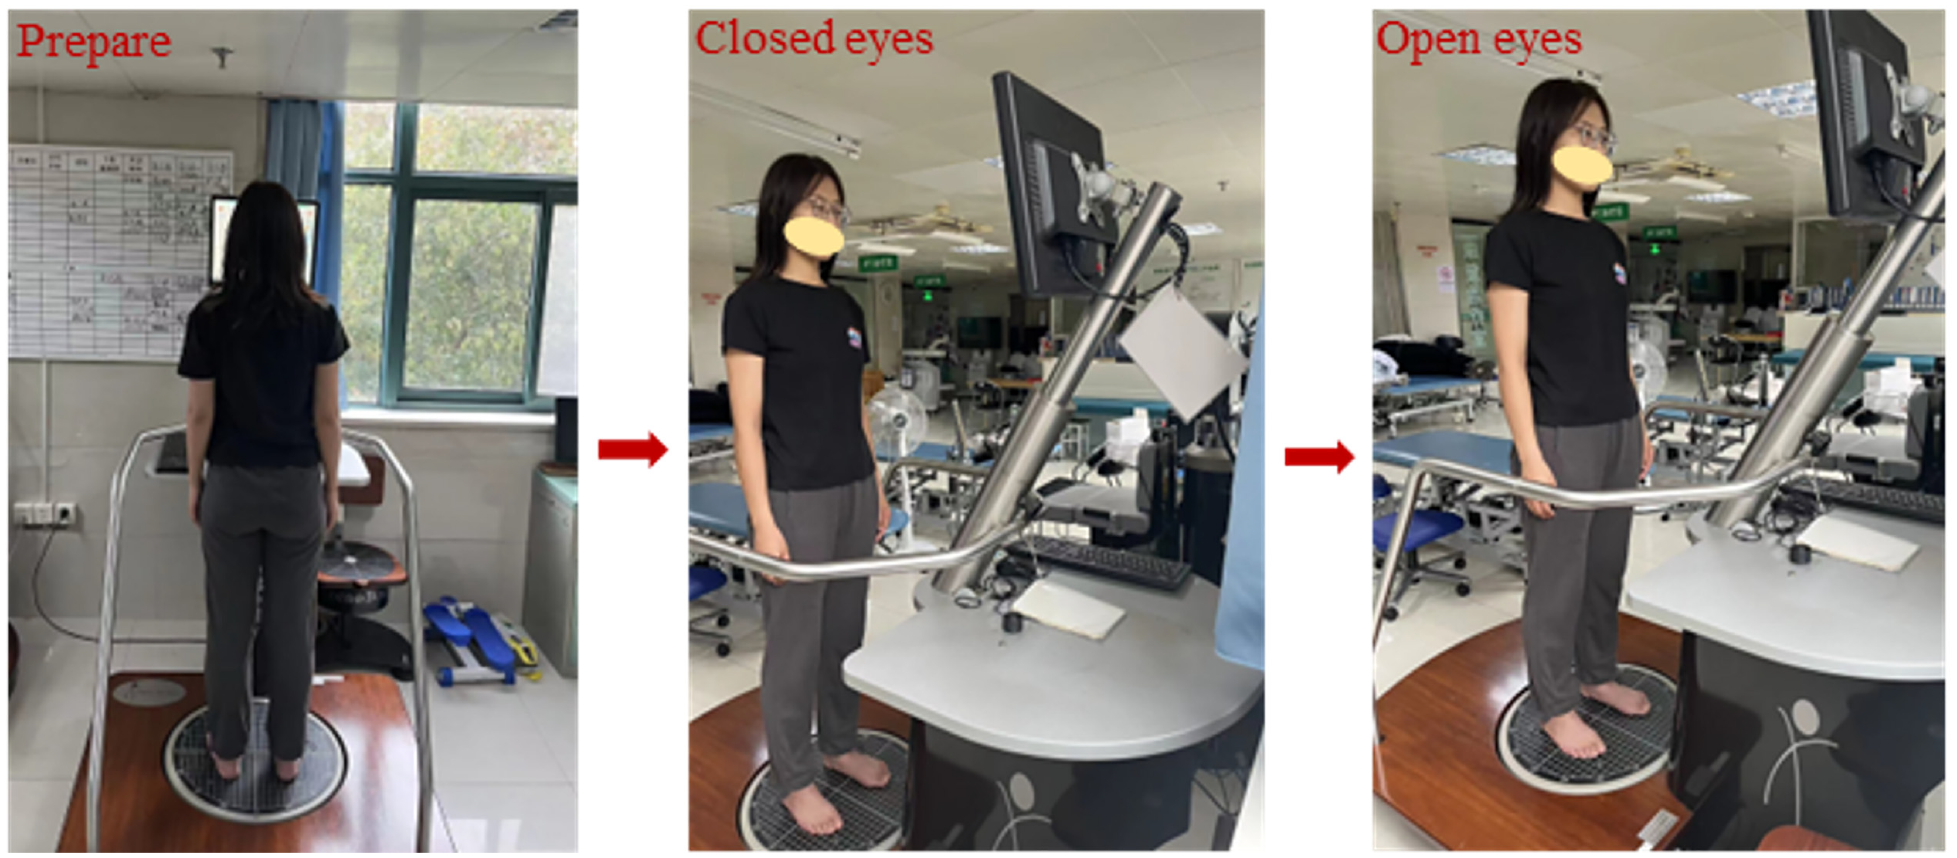
Participant standing on the force platform device.
Data processing
After excluding samples with equipment malfunctions, participant’s unintended movements (such as wiping sweat), and data errors caused by improper wearing, the remaining sample size was 67. The raw data of all samples were initially divided into EO and EC segments by identifying the forward bend movement. The middle 25 s of acceleration data for both time segments were then extracted to minimize the inclusion of bending and initial/final acceleration data. Therefore, the current data includes 25 s for both EO and EC segments (Figure 4(a)).
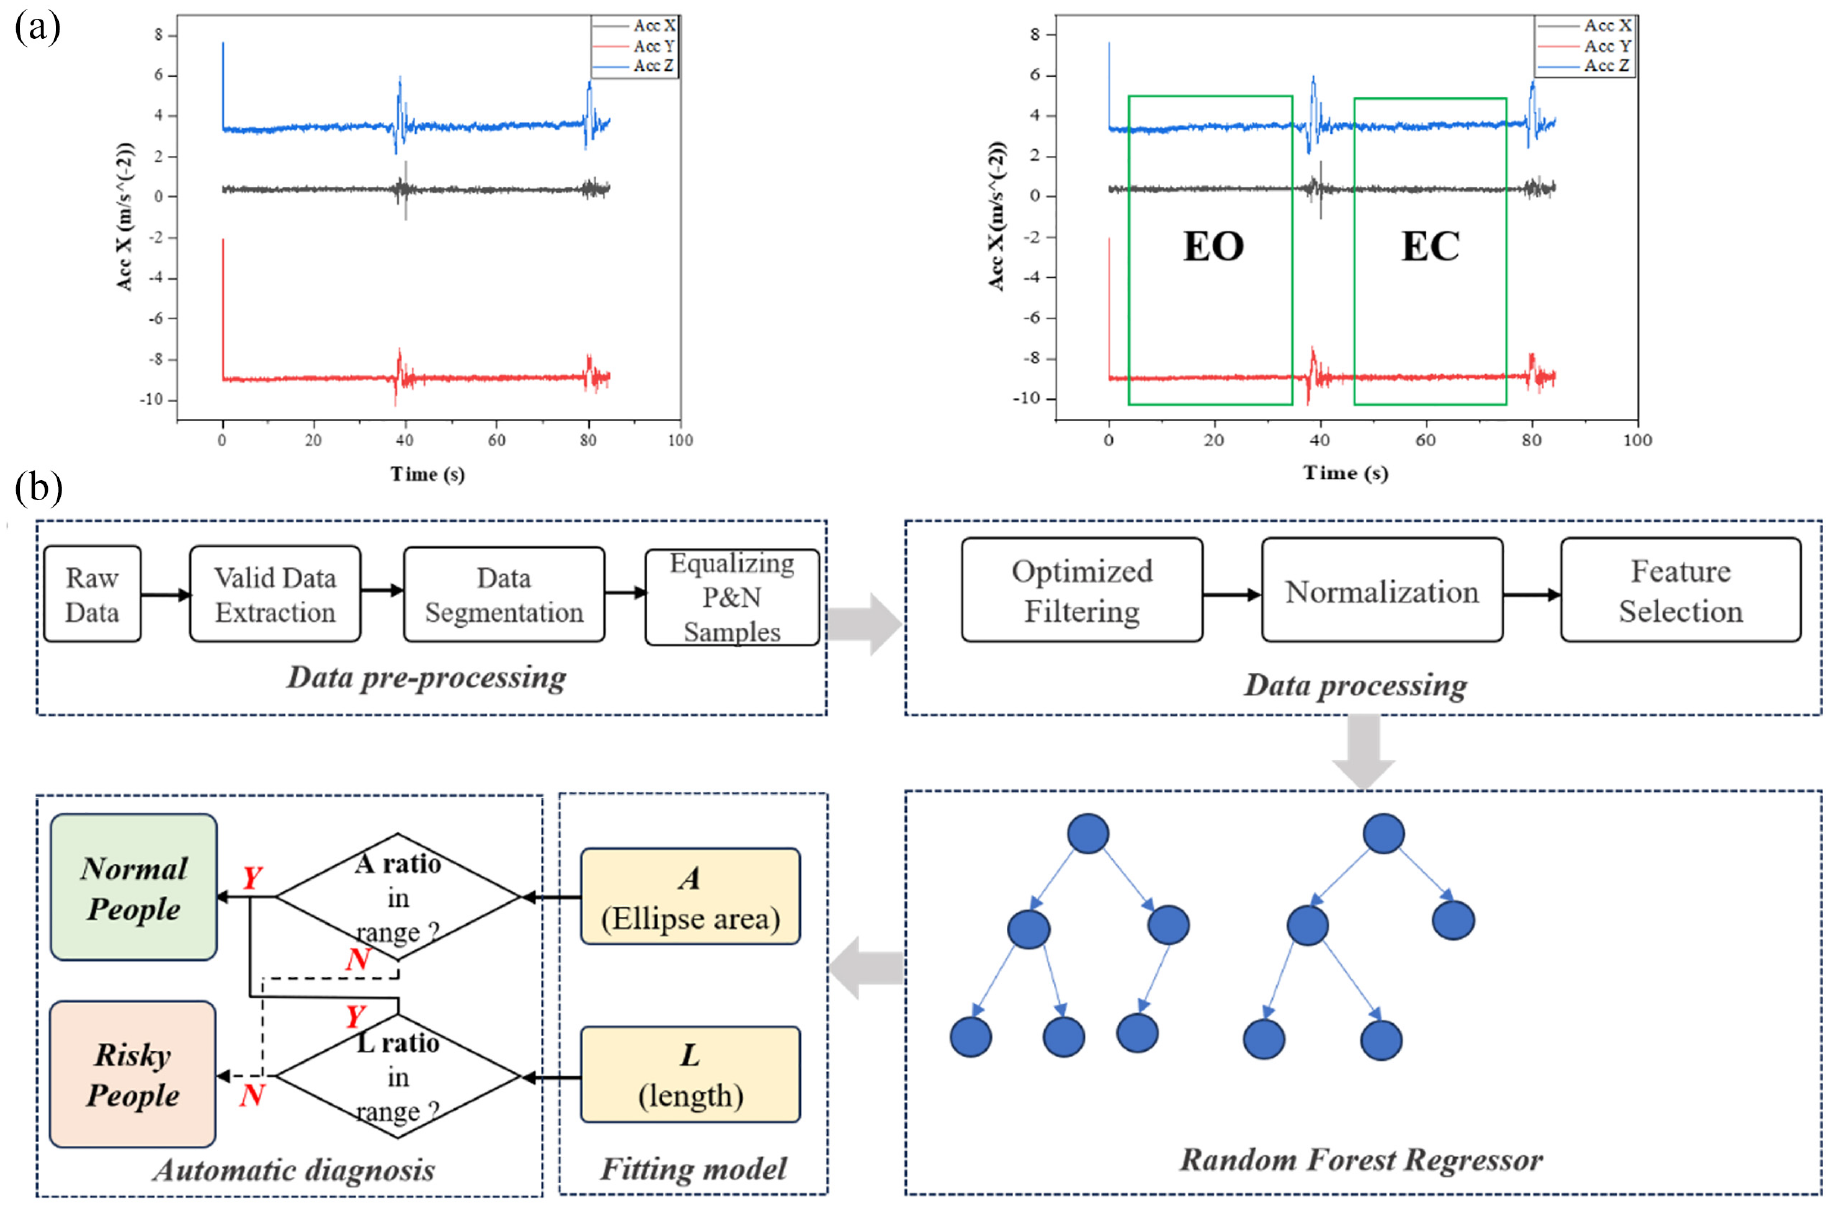
Flowchart of the entire experimental process: (a) The EO and EC segments contain 25 seconds of data each and (b) The complete data processing workflow.
To explore the optimal data time length and increase the number of samples for machine learning, both sets of acceleration data were divided into n segments of equal length, each lasting for 25/n s. The corresponding segments from the EO and EC phases were combined to create new samples, and the force platform output data indices of the new samples were set to be the same as the original data. This process increased the sample size by a factor of n2. Following the reference range of the 95% confidence ellipse area and the range of sway length in the literature, 34 the samples were classified into positive and negative samples in these two ways. If ellipse area EC/ellipse area EO < 2.96 and at the same time length EC/length EO < 1.73, they are considered to be within the healthy range; otherwise, they are considered to be individuals at risk of impaired balance, we use this rule to conduct binary classification. For both ratio metrics, there is a threshold to judge whether the candidate is within normal range or not, so we conducted balancing of positive and negative samples separately based on the thresholds of the two ratio-metrics. Since the original dataset had significantly more positive samples, random deletion of positive samples was performed to achieve a roughly equal quantity of both.
After segmenting the data with n = 4 and balancing the number of positive and negative samples, the final total number of training samples obtained through the above two methods were 512 (via the threshold of the ellipse area ratio) and 384 (via the length ratio), respectively. All samples were then subjected to filtering and normalization operations. A fifth-order Butterworth low-pass filter with a cutoff frequency of Fc, where Fc could be 5, 10, or 20 Hz, was used for filtering. We used Z-Score normalization, which brings all variables to a comparable scale without distorting differences in the ranges of values. Some features were extracted from the filtered three-dimensional data and normalized data in both the time and frequency domains, as listed in Table 4. These features were then flattened and input into two random forest models to predict the force platform device output in two phases EC and EO, and in both phases, the output is a two-dimension variable, with dimensions of indices of the ellipse area and sway path length. In the development of the Random Forest model, the Random Forest Regressor class from the sklearn module was employed. The number of estimators is set to 100, which specifies the number of decision trees in the forest. Other than that, all remaining parameters were maintained at their default values. We used three-fold cross-validation during the training process for a more accurate assessment of the predictive model. The complete data processing workflow is outlined in Figure 4(b).
Statistical analysis
We balanced samples according to the threshold of the sway ellipse area ratio metric, ensuring that the number of training samples within the healthy reference threshold was roughly equal to those outside the range, and trained to predict all area metrics’ outcomes, including fit results under different filtering and data segmentation parameters (Figure 5), and the final binary classification confusion matrices (Figure 6). Similarly, we balanced positive and negative samples based on the sway path length ratio metric threshold and obtained regression (Figure 5) and binary classification prediction results (Figure 6).
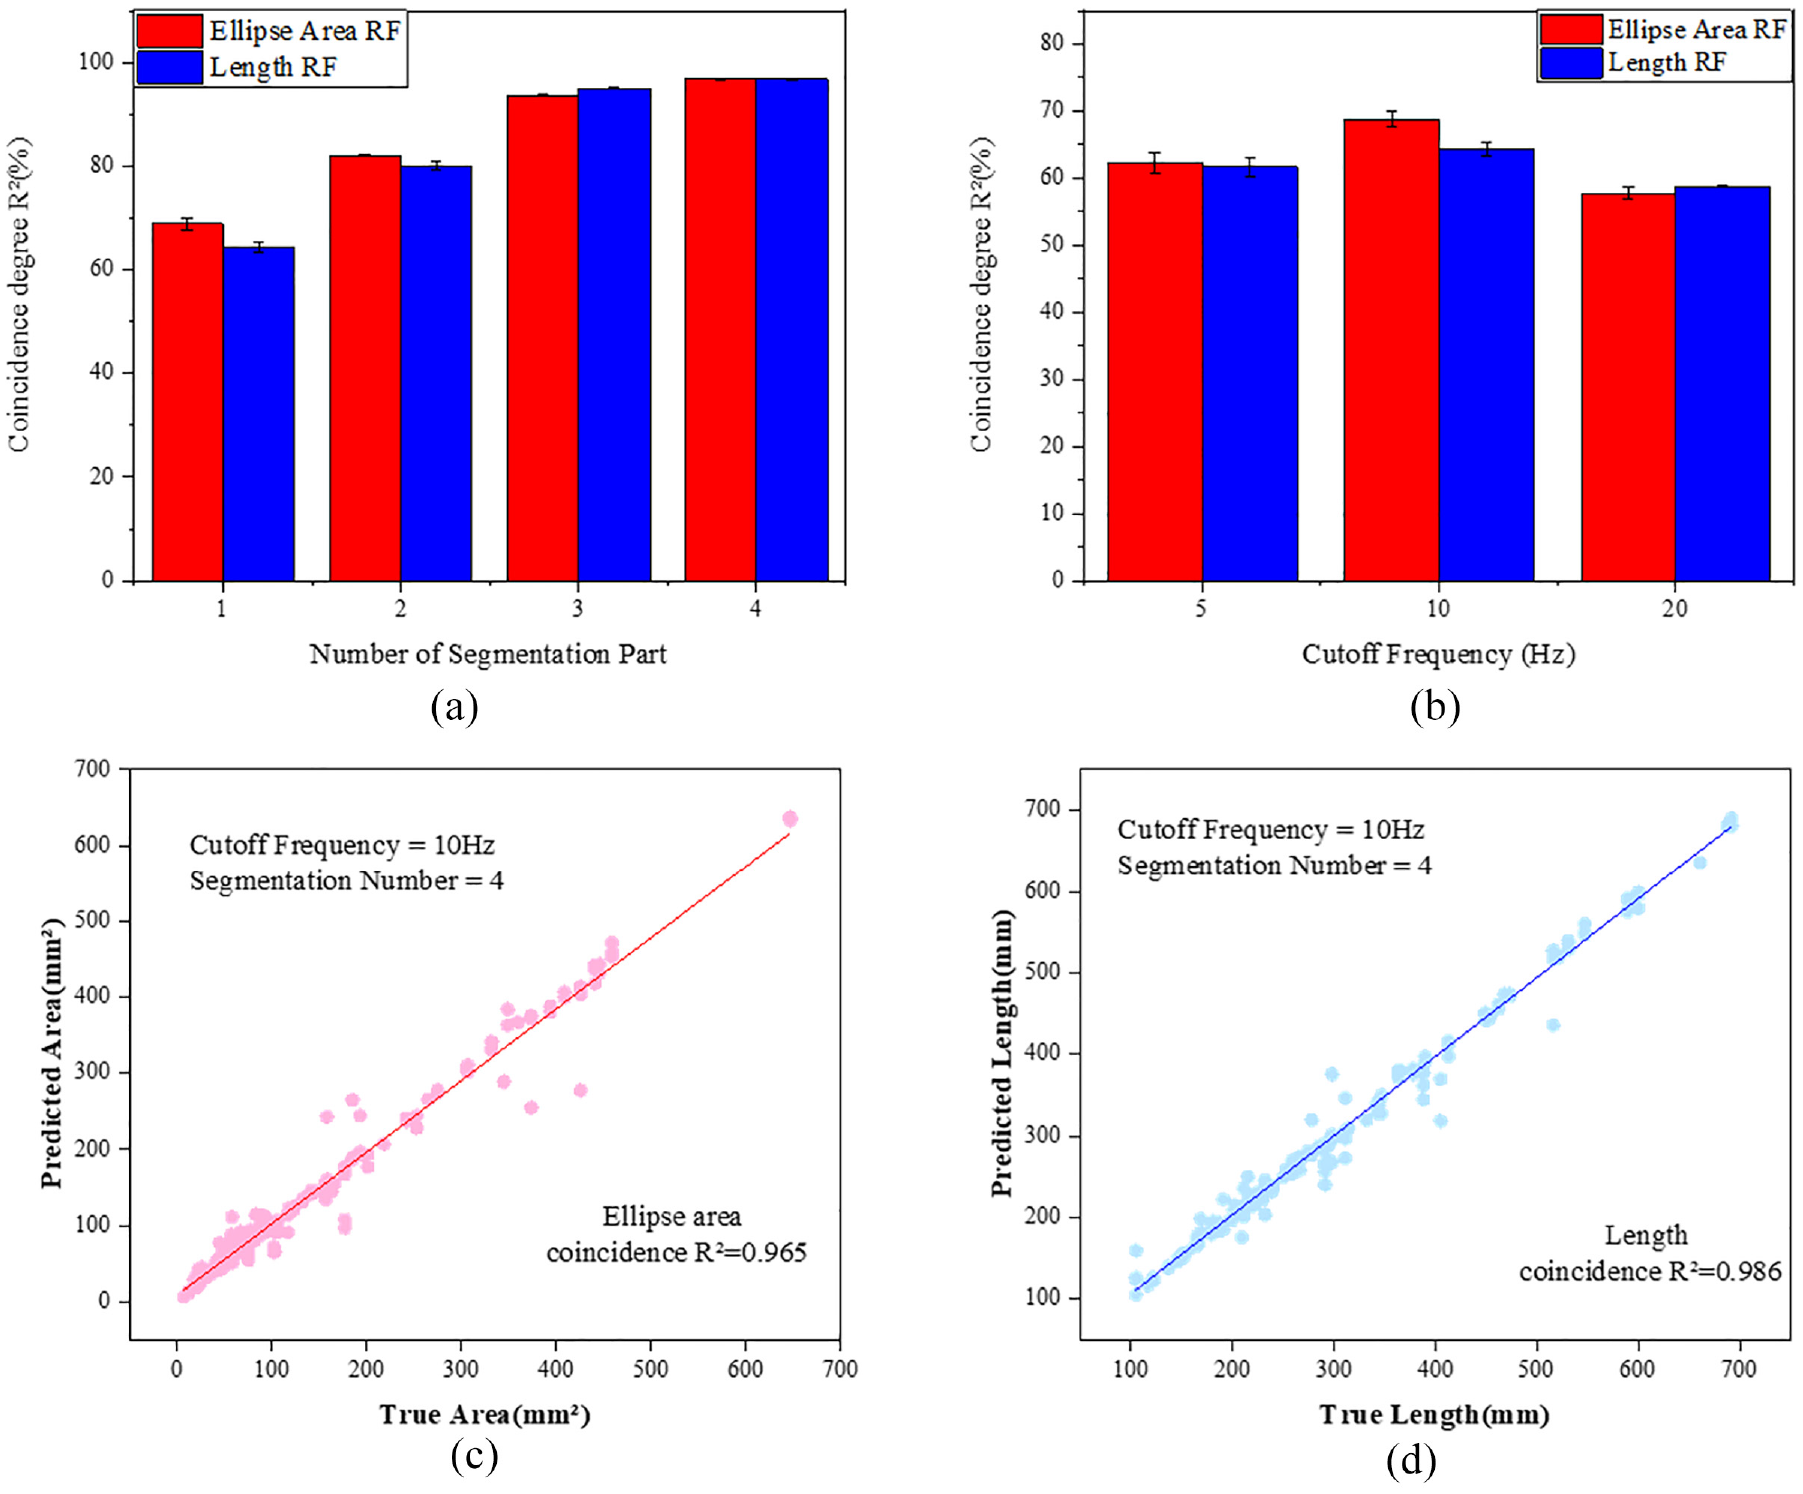
Fitting performance under different parameters. (a) COD of ellipse area and Sway path length under different number of segments when the cutoff frequency is 10 Hz (b) COD of ellipse area and Sway path length at different cut-off frequencies when the number of segments is 1. (c) Straight line fitting of ellipse area when the cutoff frequency is 10 Hz and the number of segments is 4. (d) Straight line fitting of Sway path length when the cutoff frequency is 10 Hz and the number of segments is 4.
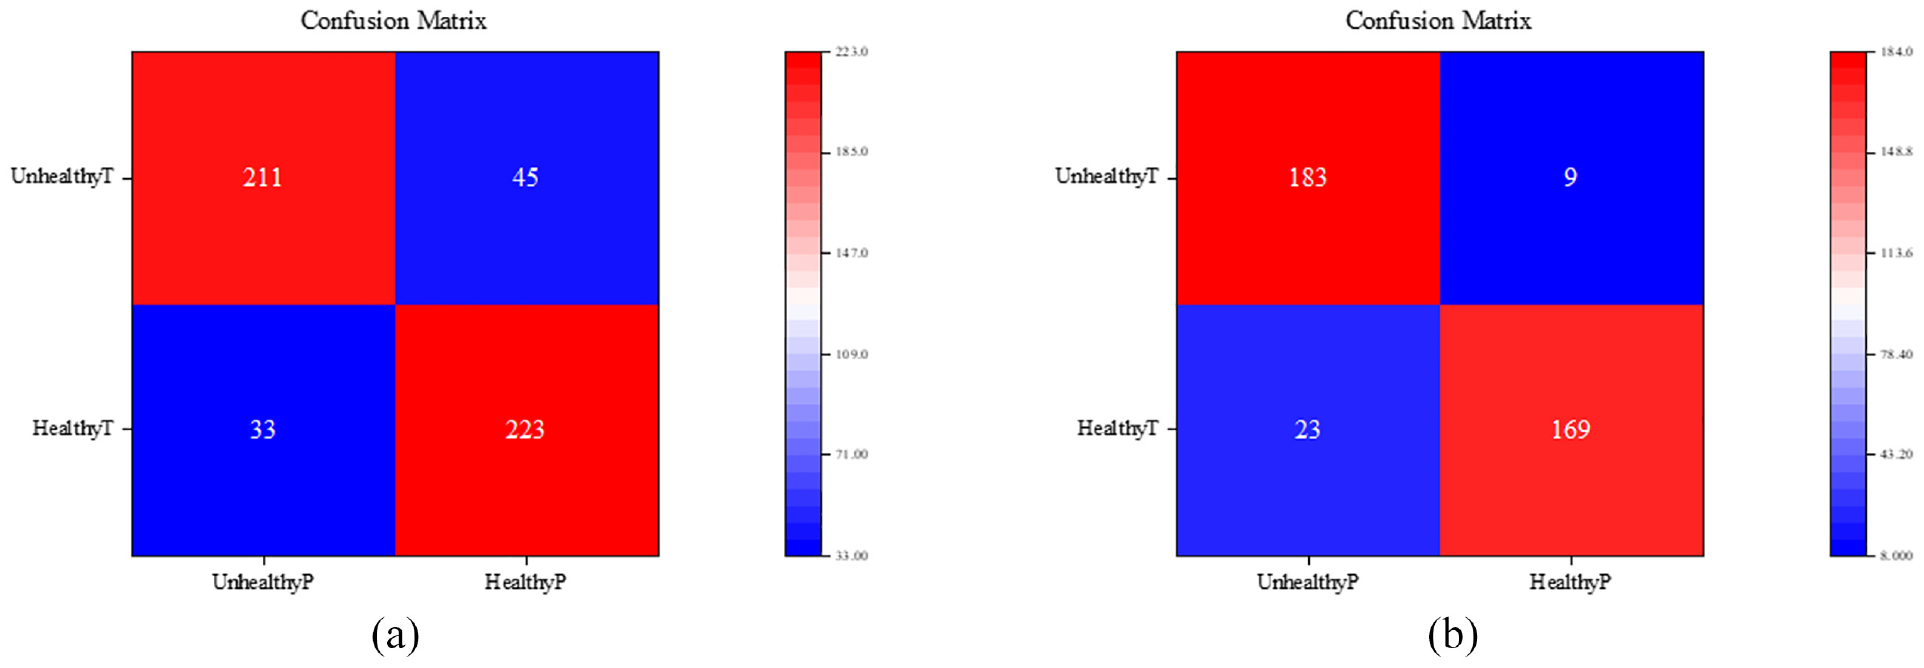
Confusion matrix of binary classification. (a) The classification results using balanced samples according to the threshold of the sway ellipse area ratio. (b) The classification results using balanced samples according to the threshold of the sway path length ratio.
The first objective of this study is to predict two indices, the 95% confidence ellipse sway area, and sway path length obtained by the force platform during the EO and EC phases from the data measured by the accelerometer. For both the target and predicted values of these indices, the coefficient of determination (COD) was used to measure the model’s predictive ability, the fitting results of ellipse area and length are in Figure 5(c) and (d), which come from one of the three folds. We investigated fitting results under different parameters to avoid potential errors introduced by them, and the results for different segmentation parameters and various filtering cutoff frequencies are shown in Figure 5(a) and (b), we fixed the value of n to be 1 and got Figure 5(b), and fixed the value of Fc to be 10 Hz and got Figure 5(a).
To further examine the classification of the typical Romberg ratio, as explained in data processing section, we got binary classification statistics in two ways of balancing positive and negative samples, which contains accuracy, recall score, precision score and f1-score, as shown in Tables 2 and 3, and constructed confusion matrixes to evaluate the result, as shown in Figure 6. The statistical parameters of the classification result are the average of the parameters over the individual folds, while the confusion matrix result is obtained by adding the results over all folds. All the mentioned indicators are results obtained after conducting three random experiments.
Classification statistics for Romberg data under different parameters using balanced samples according to the threshold of the sway ellipse area ratio metric.
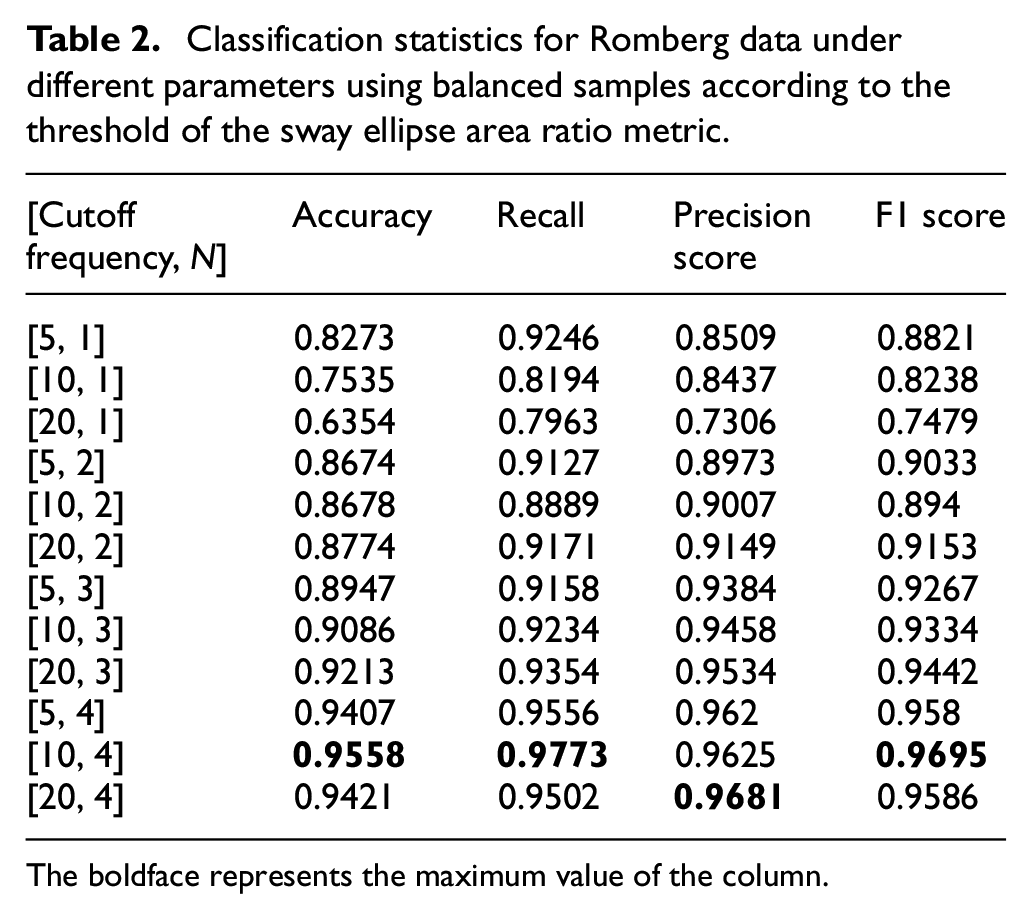
The boldface represents the maximum value of the column.
Classification statistics for Romberg data under different parameters using balanced samples according to the threshold of the sway length ratio metric.
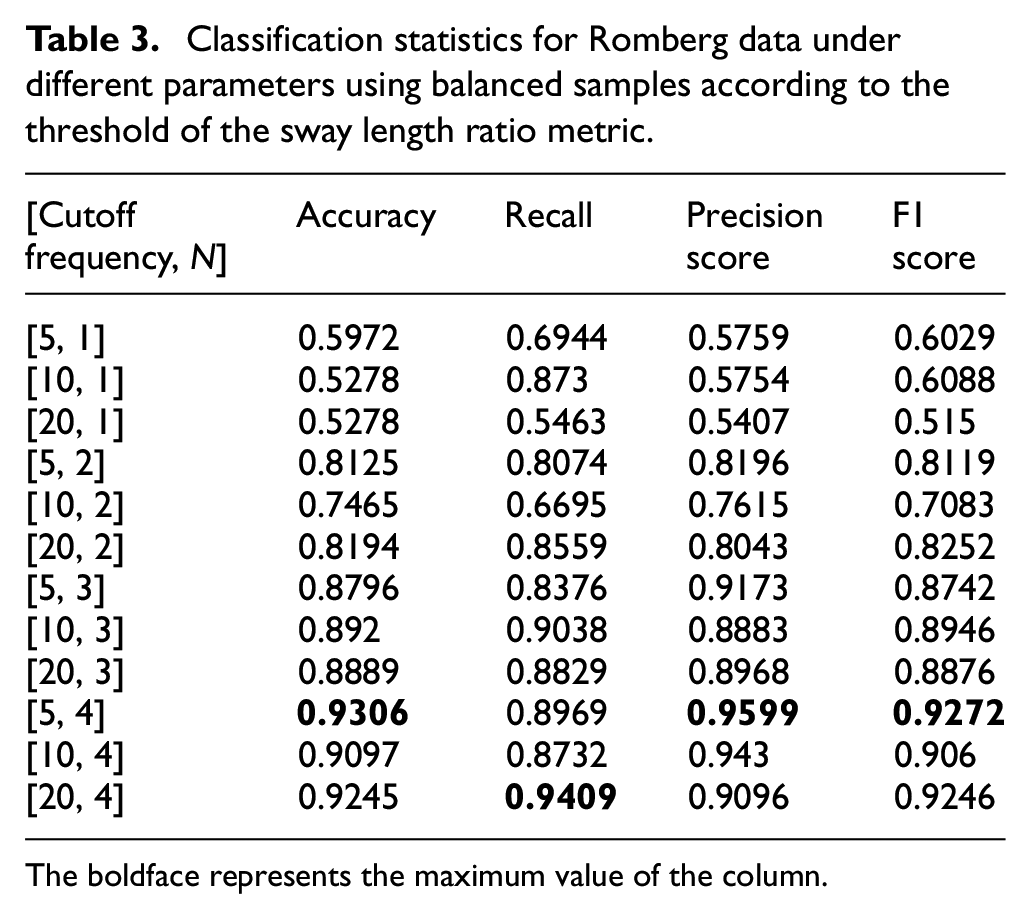
The boldface represents the maximum value of the column.
Additionally, we calculated the linear correlation parameters between various features and two target indicators. For all features, the absolute values of the Spearman correlation coefficients with the “area” indicator are less than 0.4, indicating low or no correlation. The correlation coefficients between all features and the “sway path length” indicator are presented in Table 4.
Feature attributes and Spearman correlations.
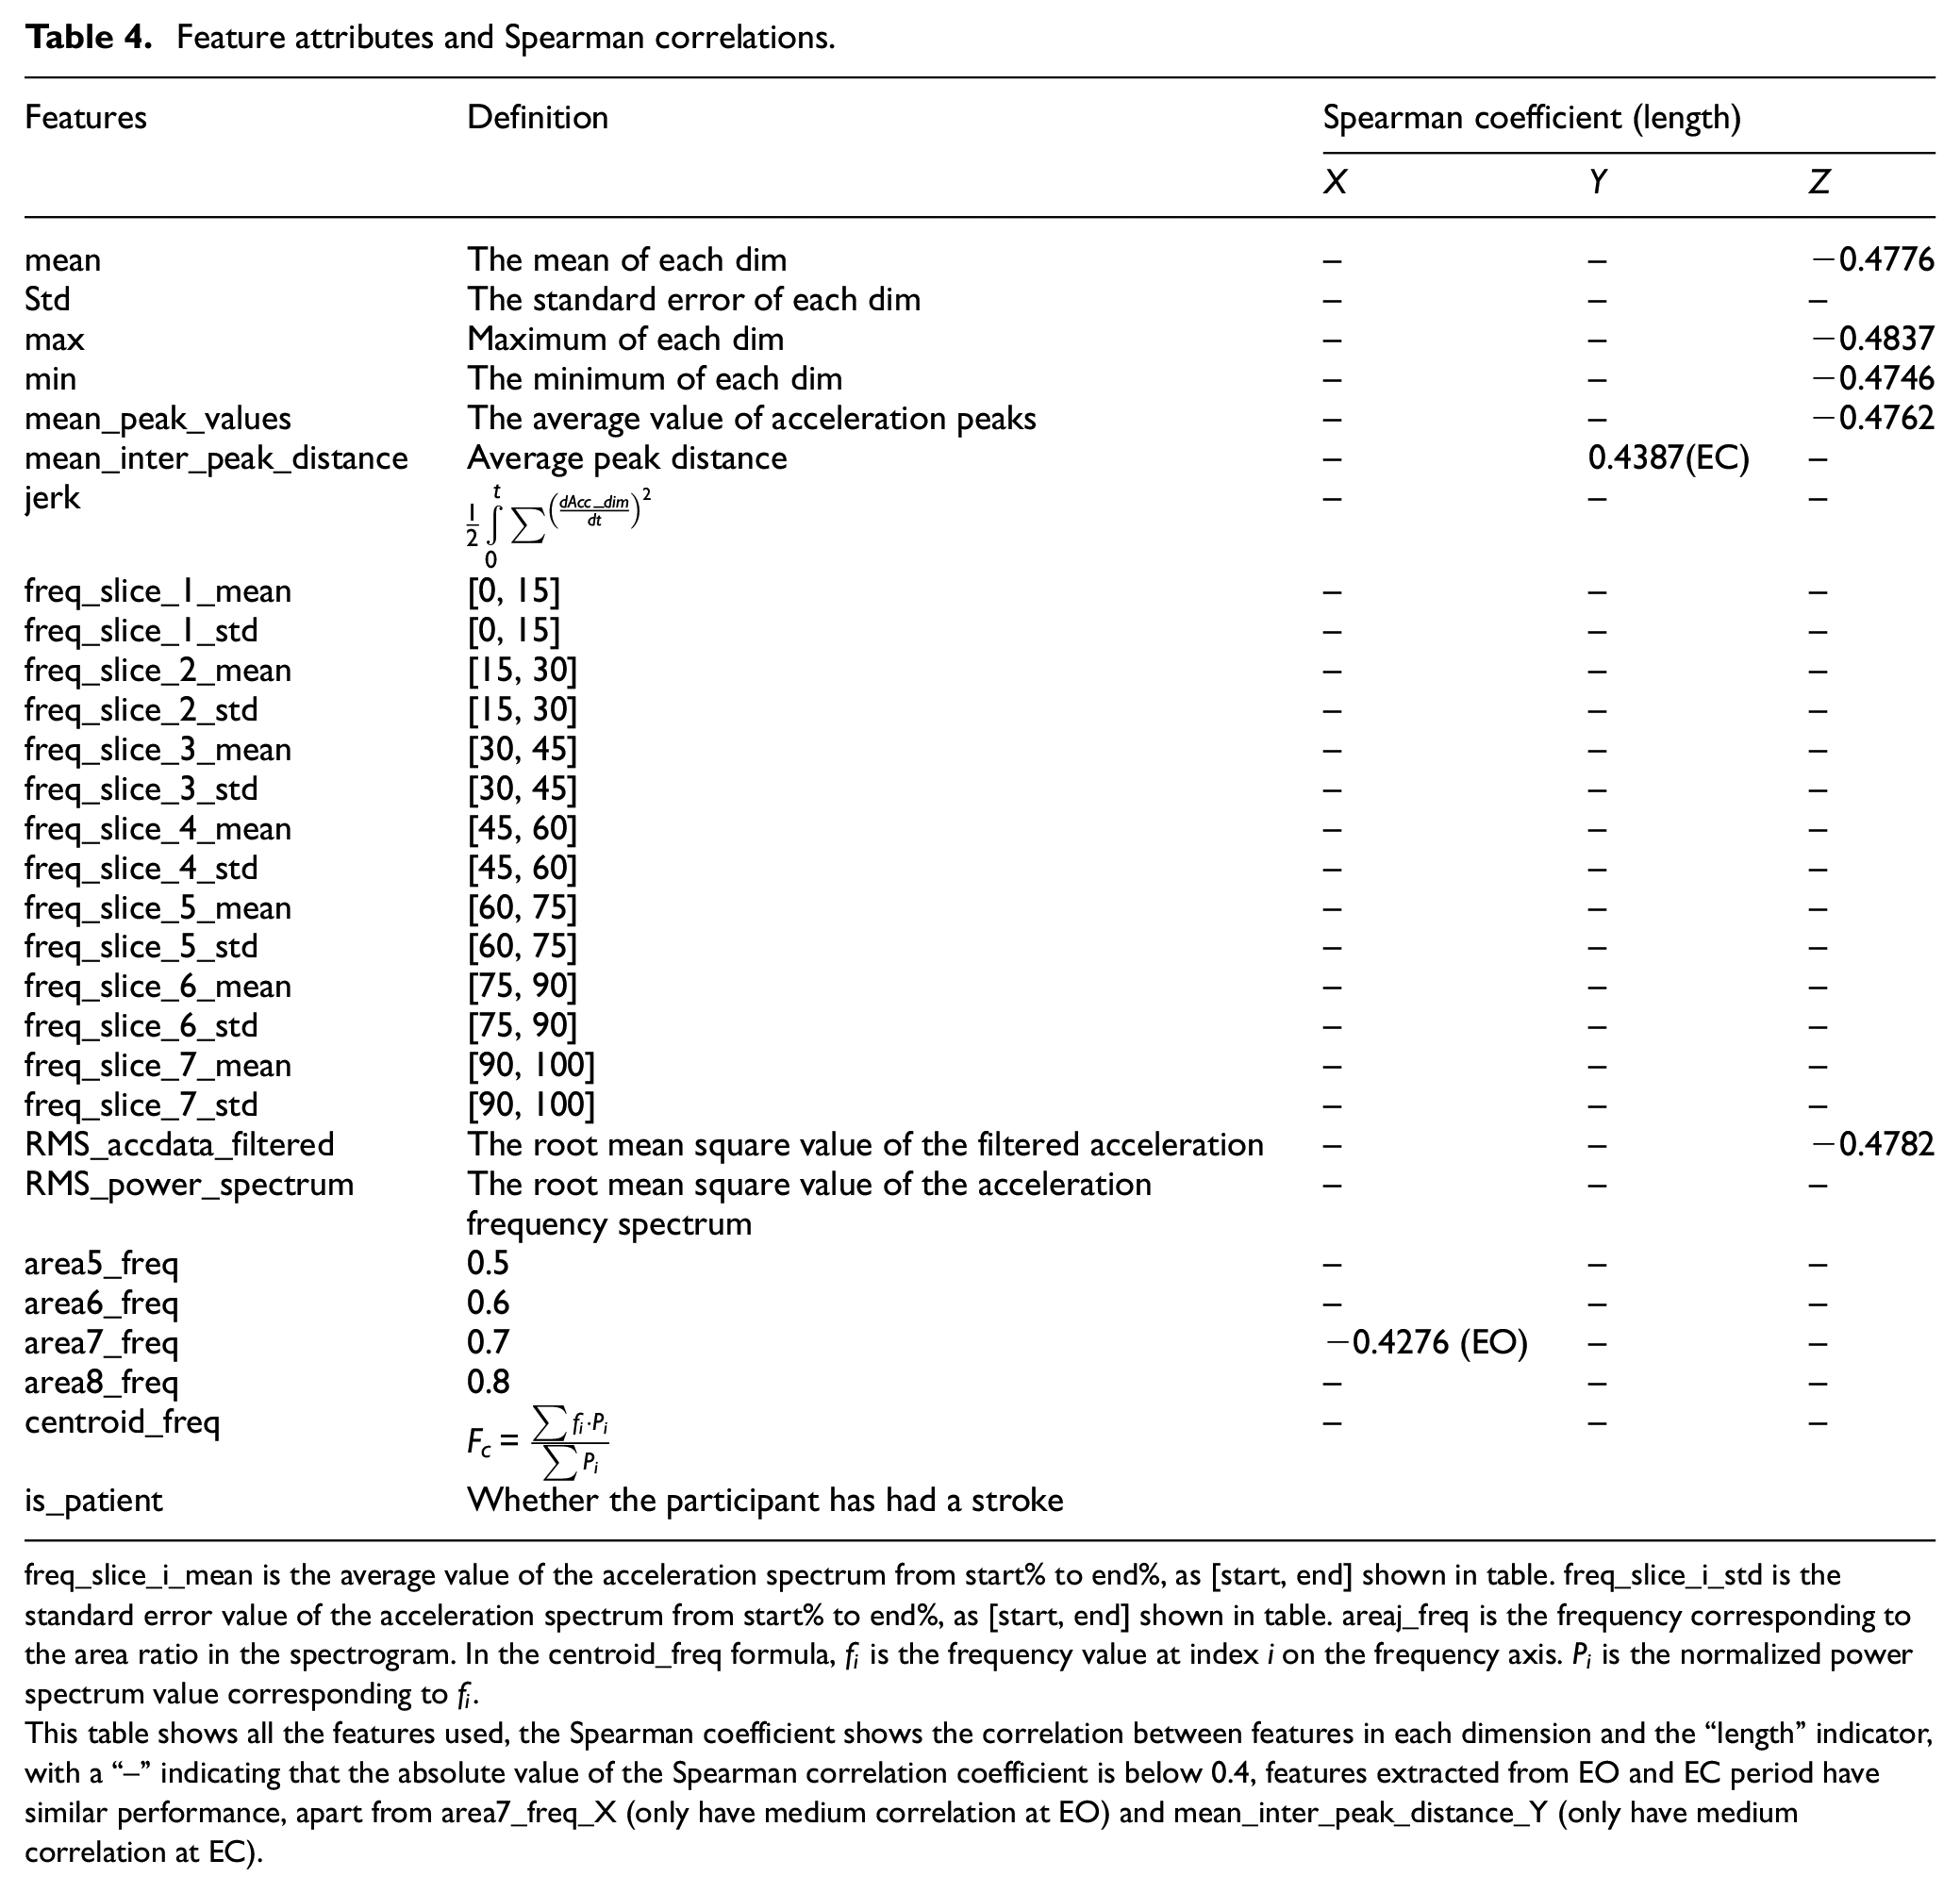
freq_slice_i_mean is the average value of the acceleration spectrum from start% to end%, as [start, end] shown in table. freq_slice_i_std is the standard error value of the acceleration spectrum from start% to end%, as [start, end] shown in table. areaj_freq is the frequency corresponding to the area ratio in the spectrogram. In the centroid_freq formula,
This table shows all the features used, the Spearman coefficient shows the correlation between features in each dimension and the “length” indicator, with a “–” indicating that the absolute value of the Spearman correlation coefficient is below 0.4, features extracted from EO and EC period have similar performance, apart from area7_freq_X (only have medium correlation at EO) and mean_inter_peak_distance_Y (only have medium correlation at EC).
For the features used in model training, feature importance analysis was performed using the SHAP (Shapley additive explanations) library tool. The tree explainer in the SHAP library was employed to calculate SHAP values, allowing for feature importance analysis based on cooperative game theory results (Shapley values). By quantifying the impact of each feature on model predictions, SHAP values help determine the importance of each feature in influencing the model’s decisions. SHAP values enable an in-depth understanding of the model’s decision-making process by quantifying the impact of individual features on predictions.
Results
Different parameters’ impact on random forest model prediction results
The results of area and length are obtained according to the two ways of balancing positive and negative samples mentioned in the data processing section, respectively. The COD results for different filtering cutoff frequencies under a fixed segmentation number of 1, which means using original samples, as well as the fitting COD results for different segmentation numbers under a fixed filtering cutoff frequency of 10 Hz, are shown in Figure 5(a) and (b). The model predicts the COD for the ellipse area best when using a filtering cutoff frequency of 10 Hz (COD = 0.69), and the COD for length is best when also using a cutoff frequency of 10 Hz (COD = 0.64), and that’s why we choose a fixed 10 Hz when evaluating the impact of segmentation number. When the segmentation number is 3 (corresponding to an acceleration data time length of 8.33 s), the COD for length is 0.95, and when the segmentation number is 4 (corresponding to an acceleration data time length of 6.25 s) and the cutoff frequency is 10 Hz, both of the COD for ellipse area and length are over 0.95, and got the best result, the COD for the ellipse area and length are 0.97. The fitting results illustrate the sensitivity of the extracted features to the mentioned parameters. The model performs well when the segmentation number is 3 or above, and a recommended filtering cutoff frequency is 10 Hz.
Classification statistics for Romberg data under different parameters using balanced samples according to the threshold of the sway ellipse area ratio and length ratio metric is shown in Tables 2 and 3, they are obtained by averaging the parameters corresponding to the folds of three repeated experiments.
As described in data processing section, our positive samples are those whose ellipse area EC/ellipse area EO < 2.96 and at the same time length EC/length EO < 1.73, they are considered as healthy in terms of postural control. In the classification statistics obtained using the first balanced positive and negative samples method, the highest accuracy, recall and f1 score were 95.58%, 97.93%, 96.95% respectively when filtering with a 10 Hz cut-off frequency and a segmentation parameter of 4. The highest precision score was obtained with a 20 Hz cut-off frequency filter. When the segmentation parameter is 4, the result is 96.81%, and the result of 5 Hz filtering is relatively the worst, but it is also above 94%. The highest sample accuracy, precision score and f1 score obtained by the second method were 93.06%, 95.99%, and 92.72%, respectively, when filtering with a 5 Hz cut-off frequency and a segmentation parameter of 4. The highest recall score was obtained with a 20 Hz cut-off frequency and a segmentation parameter of 4. It is 96.81%, and filtering with a cutoff frequency of 10 Hz gives relatively the worst result.
The result of the binary confusion matrix obtained from Figure 6, which is the sum of the folds of cross-validation, is obtained. It corresponds to a segmentation parameter of 4 and a cutoff frequency of 10 Hz. The specificity scores of the confusion matrix of the balanced samples obtained by the two methods were 82.42% and 95.31%, respectively. It is directly related to the ability of the model to identify the patients at real risk. The results show that, according to the length ratio index threshold to balance the number of positive and negative samples, the trained random forest model has better performance for identifying patients with postural control risk.
Feature importance analysis
The SHAP (Shapley additive explanations) tool identified the top features in terms of importance to model, as show in Figure 7, for the prediction task for phase EO (Figure 7(a)), the standard deviation value of x axis has the highest SHAP value, and for EC phase (Figure 7(b)), the most import feature is “freq_slice_4_mean” of x axis. These results suggest that for prediction tasks for EC and EO phase, there are different mapping relations between data from IMU and force platform device, reflected in the fact that they are affected by different features. In Figure 7(b), the second, third, and fifth features is_patient record whether the subject has a stroke or not. The data of the folded three axes are the same for the same person. The reason why they are repeated three times is to meet the consistency of the feature format, but tree explainer has errors when processing them. As a result, there are some differences in calculating the importance of these three identical values. Table 4 indicates that the linear relationships between the extracted features and the indicators do not align with the SHAP importance analysis results. The random forest predictive model is likely to handle more complex, deep-seated relationships than linear relationships. This is consistent with previous research findings: using trunk accelerations transformed to the horizontal axis can distinguish between young and elderly individuals and different experimental conditions during quiet standing, but the original data cannot distinguish. 35
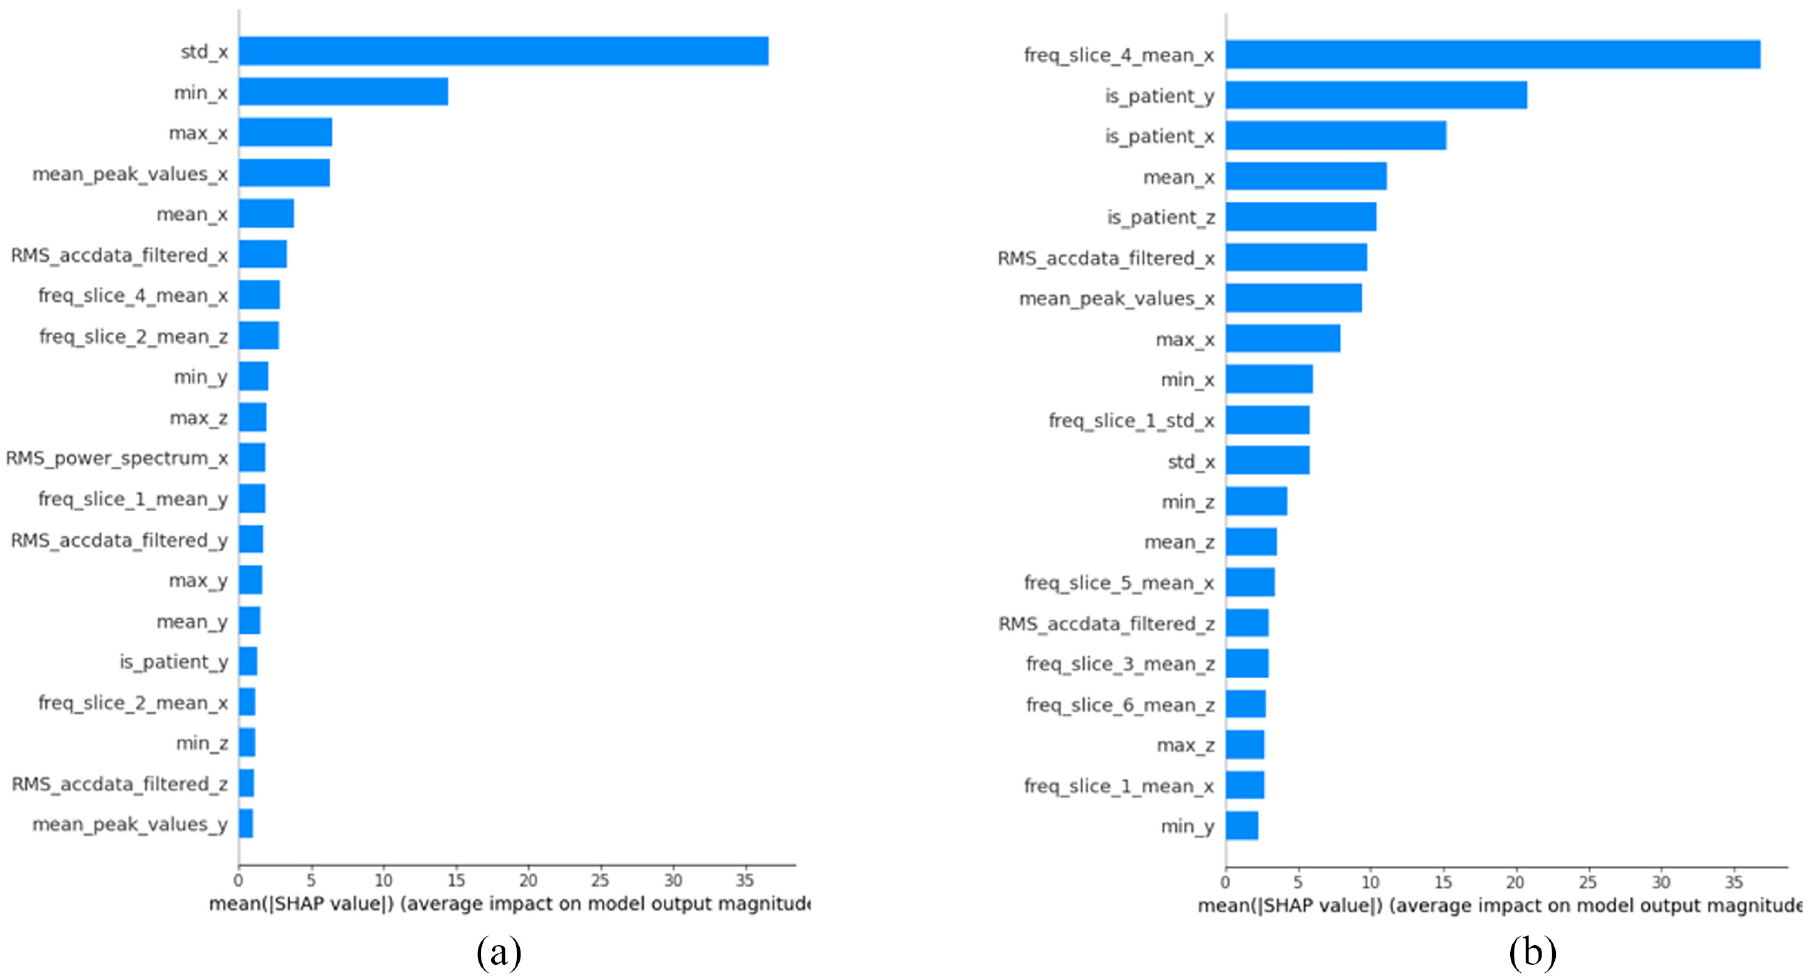
Results of SHAP features importance analysis: (a) The prediction task for phase EO and (b) The prediction task for phase EC.
Discussion
Wearable inertial sensor units typically include accelerometers, gyroscopes, and magnetometers. Three-axis accelerometers measure the appropriate linear acceleration of motion in a three-dimensional (3D) frame fixed to the sensor, including both motion and gravity components. Three-axis gyroscopes measure the intrinsic angular velocity in 3D space and assess the components of the turning rate in the three-dimensional frame fixed to the sensor. Rotations around three orthogonal axes are typically defined as Euler angles, such as “roll,”“pitch,” and “yaw.” Magnetometers measure the magnitude and direction of the local magnetic field in 3D space, with magnetic field components represented in the three-axis frame fixed to the sensor. Usually, accelerometer, gyroscope, and magnetometer measurements refer to the common three-axis frame fixed to the IMU. The choice of which wearable inertial sensor unit to use depends on the specific research context and experimental conditions. Among these, three-axis accelerometers are most commonly used in existing research and can be considered a key instrument, as nearly all studies in this field currently employ them. 30 In this study, three-axis accelerometer data were used, and gyroscopes were not used for coordinate system transformation.
In our research, accelerometers were manually fixed in the depicted position (Figure 1(a)). In reality, achieving perfect alignment of accelerometers during manual wear is challenging, and slight displacements may occur with body movement. In our study, data from the three dimensions of the accelerometer were processed separately, and features from each dimension were input into the model. In other words, we aimed to handle these complex relationships through the model, rather than precise calculations. Since the ultimate goal is to assess balance forces, the idea is logical to utilize indicators that may possess this reflective capability. Additionally, some studies have indicated that only the inner and outer axes of accelerometers show significant differences between static tasks, while all directions can demonstrate significant differences between static and dynamic tasks. 2 Therefore, emphasizing data from all dimensions would better suit future studies involving dynamic balance tasks.
Furthermore, research has attempted to place accelerometers in different forms on other parts of the trunk for posture assessment, such as the sternum, 18 suspended pendants, 36 helmets, 32 etc. Future studies may collect accelerometer data from various body parts for training purposes.
To examine the impact of individual parameters on model prediction results, we kept the filtering cutoff frequency fixed when investigating the influence of segmentation number and vice versa. However, the interpretation of the segmentation number here might be more complex than the cutoff frequency. Increasing the segmentation number simultaneously means that the duration of each segment of accelerometer data used for training is shortened to 1/n of the original length. This also leads to an increase in the number of samples to n2 times the original count. This change might influence the model training process since one of the initial motivations for segmenting the original data was the scarcity of samples.
Study implications and contributions
This research greatly promotes the application of portable, low-cost balance ability assessment, using accelerometers to assess the balance ability of stroke patients to replace existing clinical large-scale equipment. Through machine learning algorithms, it can be highly consistent with the clinic “gold standard” results, which paves the way for further clinical application. At the same time, future research will further optimize the prediction function to ensure wider application.
Conclusion
This study utilized data from accelerometer sensors and successfully predicted indicators outputted by the force plate during static balance tests. The fitting COD for the ellipse area and length indicators reached 0.97. Based on the way we divided healthy subjects and those at risk of postural control, our classification method obtained classification results with accuracy, recall, precision, f1 score, and specificity score higher than 95%. When applying a fifth-order Butterworth low-pass filter to the raw signals, the best regression prediction performance was obtained at 10 Hz. The model achieved its best performance when the duration of the acceleration data was 6.25 s.
Footnotes
Declaration of conflicting interests
The author(s) declared no potential conflicts of interest with respect to the research, authorship, and/or publication of this article.
Funding
The author(s) disclosed receipt of the following financial support for the research, authorship, and/or publication of this article: This research was funded by National Key R&D Program of China (2023YFB4706203), the Shandong Natural Science Foundation (ZR2022QH214), and the Key Research and Development Program of Jiangsu Province (Grant No. BE2021012-4).
Data availability statement
Data sharing not applicable to this article as no datasets were generated or analyzed during the current study.