
Abstract
The accurate determination of sugar content in tangerines plays a pivotal role in assessing their quality, nutritional value, and marketability. Traditional methods for sugar quantification often involve time-consuming and resource-intensive processes. In this paper, we introduce a novel approach for sugar determination in tangerines utilizing fluorescence spectroscopy in conjunction with an improved Partial Least Squares (iPLS) algorithm. A robust testing model was developed, incorporating a diverse dataset of tangerine samples with known sugar concentrations. Fluorescence spectra were acquired for 80 samples, of which 37 were used to build the iPLS model and were considered as the training dataset. The remaining 43 samples served as the validation dataset and were used to show the model’s efficacy. The training dataset was evaluated using cross-validation, and F-values were computed to determine how many main components should be utilized to build the model. The result approved validation dataset’s R-square and root-mean-square error were 0.9777 and 0.002992, respectively. These findings open the door to broader applications in the citrus industry and beyond, with the potential for automating the analysis process and improving overall quality control.
Introduction
Tangerines, renowned for their sweet and tangy flavor, are a popular citrus fruit enjoyed worldwide.1,2 The sugar content in tangerines not only influences their taste but also serves as a critical indicator of their quality, ripeness, and nutritional value. As such, accurate and efficient methods for determining sugar levels in tangerines are of paramount importance to growers, distributors, and consumers alike. The sugar profile of tangerines encompasses several components, with the primary focus often placed on measuring the concentration of simple sugars, such as glucose, fructose, and sucrose. These sugars contribute not only to the fruit’s sweetness but also influence its texture and mouthfeel. The intricate balance of sugars in tangerines undergoes dynamic changes during the fruit’s maturation process, impacting both taste perception and the overall sensory experience. In the realm of sugar assessment for tangerines, standardized methods and protocols are imperative to ensure accuracy and reliability. Various techniques, such as chromatography, spectrophotometry, and spectroscopy, are employed to quantify sugar levels with precision. These methods provide a detailed breakdown of the sugar composition, aiding in the evaluation of specific sugar types and their relative proportions. Furthermore, industry standards often guide the assessment of sugar in tangerines, outlining parameters for acceptable sugar levels that align with desired flavor profiles. Soluble Solids Content (SSC), representing the total dissolved solids in the fruit juice, is a key metric. Additionally, Titrable Acidity (TA), reflecting the acidity of the juice, complements the assessment, offering a comprehensive view of the fruit’s organoleptic properties. Therefore, a rapid, efficient, and high-precision detection method for sugars in tangerine has an important application value for the development of the tangerine industry.
Extensive research has been conducted to address the challenges associated with sugar quantification in fruits. In recent years, there has been a growing interest in non-destructive methods for assessing fruit quality. Among these, fluorescence spectroscopy has emerged as a promising tool due to its ability to exploit the natural fluorescence properties of certain compounds, including sugars.3–5 The intact nature of tangerines introduces complexities that differ from the processed states studied in existing literature. The presence of multiple components, each with distinct fluorescence characteristics, necessitates a tailored approach. Light interaction with the peel, pulp, and potential seeds requires careful consideration for accurate sugar determination. The challenge lies not only in obtaining representative spectral information but also in preserving the integrity of the fruit during analysis. It has outstanding advantages, including high sensitivity and selectivity, uses small sample amounts, is nondestructive, and is associated with high-analysis rates. In Ref. 6 proposed the use of a microstrip antenna-based sensor to detect salt and sugar contents in water in terms of the reflection coefficient quantified based on the dielectric properties of the solution. Even though this method is low-cost, the authors demonstrated the effectiveness of the method using only four samples whose contents were 20%, 40%, 60%, and 80%. In Ref. 7 proposed the use of gas chromatography-mass spectrometer and enzymatic method to analyze the sugar content in food products. Their results demonstrated that their method was capable of analyzing the sugar type but also achieved high sensitivity in providing sugar contents. However, the disadvantages of this method (time-consuming, relatively expensive, invasive, and low speed) limited its applications. In Ref., 8 Sidr, unifloral (Acacia), and multifloral (Acacia, Carisa, and Justicia) honey samples were evaluated for quality using fluorescence spectroscopy. Also, varying concentrations of cane sugar syrup were intentionally added to Sidr honey. These spectral fingerprints were used to classify Sidr, sugar syrup, and various concentrations of the Sidr-sugar mixture with the aid of a computer. In Ref. 9 developed an analytical method to quickly quantify the amount of starch in agricultural products. To do this, they analyzed the maturing banana fruit’s Raman spectra and compared the results to data from chemical samples of standard starch, sugar, and fiber. The viability of employing Raman spectroscopy to quantify soluble solids and specific sugars in apples is reported in Ref. 10 The effectiveness of Raman spectroscopy in combination with feed-forward neural networks (FFNN) for estimating the percentage concentrations of glucose, sucrose, and fructose in aqueous solutions is examined in Ref. 11 In fact, this technique is used to estimate the amount of sucrose in three firmly industrialized food products: cereal, cookies, and donuts using a classifier and a non-linear fitting system were both used to estimate concentrations.12,13
After the development of fluorescence spectroscopy in recent decades, many new analysis methods have been proposed based on the initial manifestations of excitation and emission spectra. From one perspective, the improvements in instruments and equipment have led to the emergence of new scanning methods, such as three-dimensional fluorescence spectroscopy, 14 synchronous fluorescence spectroscopy, 15 laser-induced fluorescence spectroscopy, 16 time-resolved fluorescence spectroscopy, 17 polarized fluorescence spectroscopy, 18 and low-temperature fluorescence spectroscopy 19 that can effectively solve the problem of spectral overlap; conversely use mathematical methods to perform secondary processing on the fluorescence spectrum. In Ref., 20 the measured spectrum underwent derivative operations, resulting in derivative fluorescence spectra. This process involved calculating the rate of change in fluorescence intensity with respect to wavelength, emphasizing specific spectral features and variations. In Ref. 21 involved the application of deconvolution techniques to the measured spectrum, allowing the extraction of the original spectrum from any convolution effects or distortions. This operation aimed to obtain a more accurate representation of the underlying spectral components. In Ref. 22 the composite signal resolution was achieved by performing multipeak fitting on the observed spectra using Gaussian or Lorentzian line types in order to acquire the distinctive spectra of pertinent monomers. The laborious “chemical separation” procedure is essentially replaced by the “mathematical separation.” Thus, the fluorescence spectrum’s selectivity can be enhanced even more. Fluorescence spectroscopic analysis is now more than just a source of spectra thanks to the development of chemometric methodologies; it is also a tool for solving specific problems (such as qualitative and quantitative analyses) in chemical studies.
The experimental design and optimization process involves signal processing, multivariate resolution and correction, and spectral pattern recognition. The combination of fluorescence spectroscopy and chemometrics makes full use of the advantages of rapid nondestructive testing of spectral analysis and the incomparable advantages of chemometrics in data mining and information processing, thus making spectral analysis an ideal online real-time analysis technology. In fluorescence spectroscopy, the commonly used chemometric methods mainly include the following:
(1) Spectral signal processing method. The spectra measured in experiments usually need to use some pre-processing techniques to achieve smoothing, denoising, and spectral transformation of spectral data. The methods mainly include differentiation, Fourier transformation, wavelet transformation, and multivariate scattering correction. At the same time, the genetic algorithm (GA), 23 simulated annealing algorithm (SAA), 24 ant colony algorithm (ACO), 25 and other methods can be used to realize variable selection and data compression of spectral data.
(2) Establishment of a multivariate correction model. Multivariate correction methods include linear and nonlinear correction methods. Linear regression methods include (among others) multiple linear regression (MLR), 26 principal component regression (PCR), 27 and PLS regression (PLSR). 28 Nonlinear regression methods include (among others) artificial neural network (ANN), 29 and support vector machine regression (SVR). 30 In practical applications, the nonlinear factor between concentration and spectral intensity is ubiquitous, especially when the concentration range of the sample is predicted to be high, and the nonlinear features are particularly obvious.
(3) Spectral pattern recognition technology. amalgamates spectral analysis methods with pattern recognition techniques. It employs pattern recognition methods to discern distinctive spectral characteristics within sample data, formulates classification rules based on these patterns, and applies these rules to classify and identify unknown samples. The classification techniques encompass well-known methods such as k-nearest neighbor (KNN), 31 Partial Least Squares (PLS),12,13 and self-organizing neural networks. 32
The existing literature has primarily focused on processed samples, leaving a significant gap in methodologies applicable to intact fruits. Given the unique characteristics of tangerines, including their complex structure and the potential influence of various components on sugar fluorescence, a dedicated study is warranted. This paper aims to contribute to the ongoing quest for improved methods of sugar determination in tangerines. Building upon the foundation of fluorescence spectroscopy, we propose a novel approach that leverages the power of iPLS algorithm. By combining the inherent fluorescence of sugars in tangerines with advanced multivariate data analysis techniques provided by iPLS.
Therefore, in this study, a new fluorescence spectroscopy method is proposed in combination with the iPLS method to detect the sugar content in tangerines. Berifly describe the methodology, including data acquisition, model development, and validation steps. The study includes an analysis of a diverse dataset of tangerine samples with known sugar concentrations, allowing us to evaluate the accuracy and reliability of our proposed method. Through this work, the advancement of techniques for sugar quantification in tangerines, ultimately benefiting producers, distributors, and consumers in the fruit market.
Materials and methods
Instruments, reagents, and materials
In this study, an LS55 fluorescence spectrometer (Perkin Elmer, America) with an ozone-free pulsed xenon lamp (wavelength range: 200–800 nm)33,34 was used to collect the fluorescence spectra of the tangerine samples. The excitation wavelength was set to 279 nm. The wavelength of the collected fluorescence light ranged from 200 to 600 nm with a scan step of 0.5 nm and was recorded by a photomultiplier. All the recorded spectra were transformed to the form of Excel to be processed with Matlab. The width of the slit was set at 5 nm, while the scanning speed was set at 500 nm/min. The tested tangerine juice samples were placed in a quartz cell (1 cm).
Sample preparation and spectral measurements
The low fluorescence intensity of the sugar and the influence of the excitation light as shown in Figure 1, we combined the iPLS method and the fluorescence spectroscopy. Utilize standard liquid samples with varying sugar concentrations to establish a baseline for sugar-related peaks. Each standard liquid sample should represent a different sugar concentration, enabling a systematic analysis of how fluorescence intensity varies with increasing sugar content. The systematic approach of incrementally adding a precisely known sugar standard to the tangerine juice allows for controlled variations in sugar content. This controlled addition ensures that observed changes in fluorescence are predominantly due to variations in sugar concentration. By correlating specific peaks in the fluorescence spectrum with known sugar concentrations, it can assign these peaks to sugar-related compounds. This correlation is crucial for establishing a quantitative relationship between fluorescence intensity and sugar content.
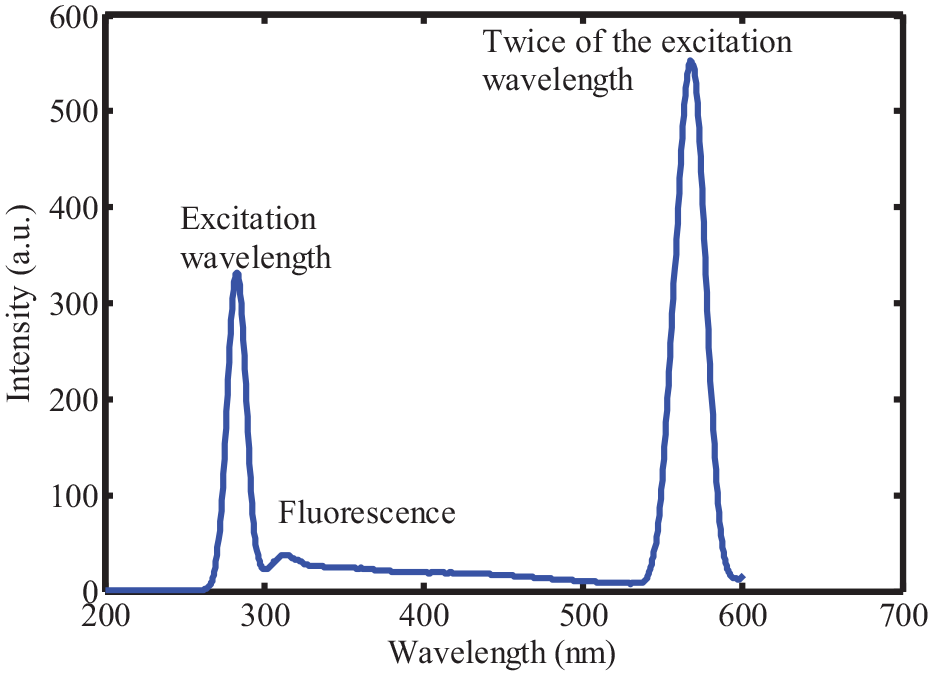
The fluorescence spectrum of pure sugar.
The tangerines were purchased from a local supermarket and squeezed to extract their juices using a juice extractor (Nohawk, China). A standard sample is meticulously prepared with a known sugar content of precisely 0.5 grams per milliliter (g/mL). This standard sample serves as a reference point for sugar concentration in subsequent analyses. To ensure a comprehensive range of sugar concentrations for analysis, a systematic approach is employed. In each iteration, precisely 0.2 mL of the standard sample are incrementally added to the tangerine juice. This incremental addition is carefully controlled to obtain a series of samples, each with a slightly different sugar concentration. The averaged fluorescence spectra of the tangerine samples are then compiled and presented in Figure 2. This figure provides a graphical representation of how the fluorescence properties of the tangerine juice vary with different sugar concentrations. It serves as a visual reference for further analysis and interpretation of the data.
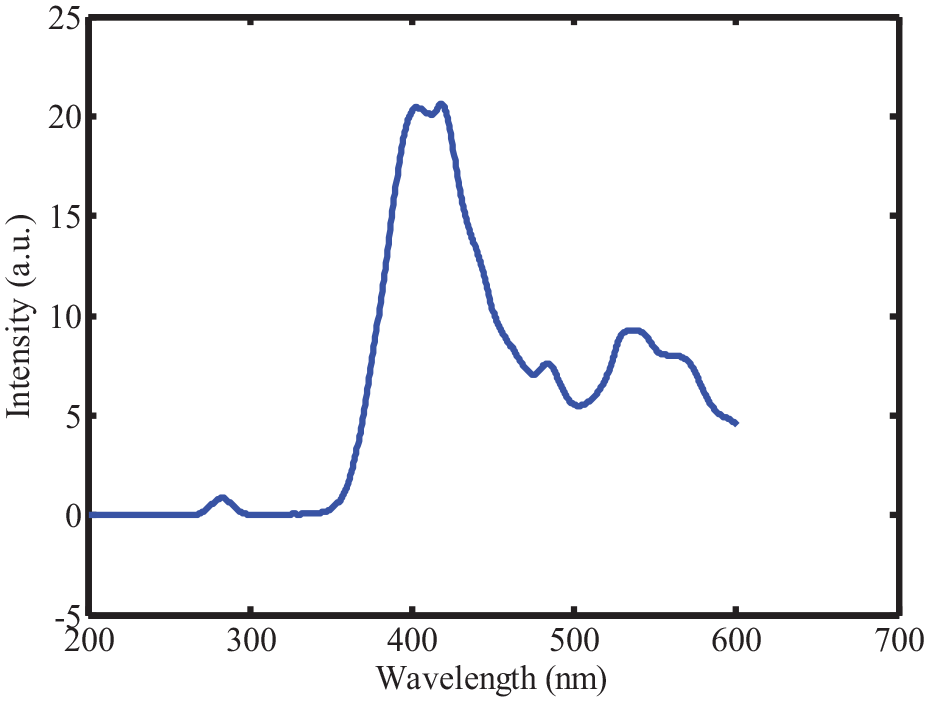
The measured fluorescence spectra of the tangerine samples.
Improved a Partial Least Squares (iPLS) algorithm
The improved PLS algorithms aim to provide more accurate, efficient, and robust solutions for complex data analysis tasks. Improved PLS algorithms often incorporate robust regression techniques to mitigate the impact of outliers and noisy data points. These techniques enhance the model’s stability and reliability, making it more suitable for real-world datasets. The mathematical equations for the improved Partial Least Squares (PLS) algorithm are derived from a series of iterative steps, involving matrix operations, to build predictive models as follows.
Deflate X and Y to remove the parts explained by the current latent variable:


where: P′ and U′ are the transposed matrices.
Regress

The performance of each algorithm was compared using these criteria.


Where,
Results and discussion
Sample set division outcomes
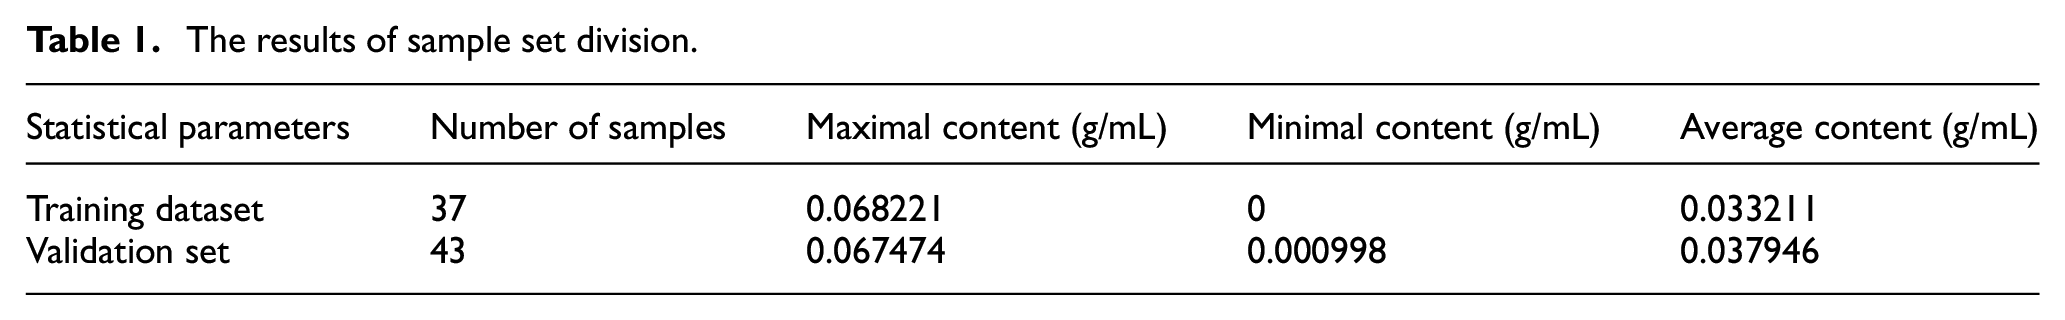
In total, 80 samples were used for experiments. Table 1 lists the division results of the tangerine fluorescence spectral samples; 37 samples were included in the training dataset and 43 samples in the validation dataset. Table 1 also lists the maximal content, minimal content, and average content of sugars in tangerine in the training and validation datasets. The validation set was included in the training set, thus indicating that the distribution of the validation set is reasonable and suitable for the validation of the constructed model.
The results of sample set division.
Analysis of outlier samples
Cross-validation was performed to eliminate outlier samples in the training dataset. Firstly, spectra of 37 samples are used to build the iPLS model with 10 principal components. Secondly, the spectrum of the left is calculated by the iPLS model to achieve the sugar content. These two steps, involving incremental additions of the standard sample to the tangerine juice and subsequent spectral measurements, are repeated iteratively. With each iteration, a unique sugar content corresponding to its spectral signature is obtained. All of these samples are then reserved as validation data for analysis. The culmination of this process yields a predicted vector y, which encompasses the anticipated sugar content for each sample. The comparison between the actual sugar content and the predicted sugar content is visually represented in Figure 3. The coefficient of determination R2 and root mean square error (RMSE) values of the linear fitting of actual sugar content and predicted sugar content in Figure 3(a) are 0.9584 and 0.003869; these indicate that the predicted and actual values are linearly related. The slope of the fitting line between the predicted and actual values is 0.9387, which is close to ideal value 1; this demonstrates the effectiveness of the model. Figure 3(b) shows the cross-validation error. The mean error of the cross-validation is ∼9.10182 × 10⁻⁵, which is two order of magnitude lower than the sugar content value. The cross-validation error indicated that there were no outlier sample values in the training dataset.
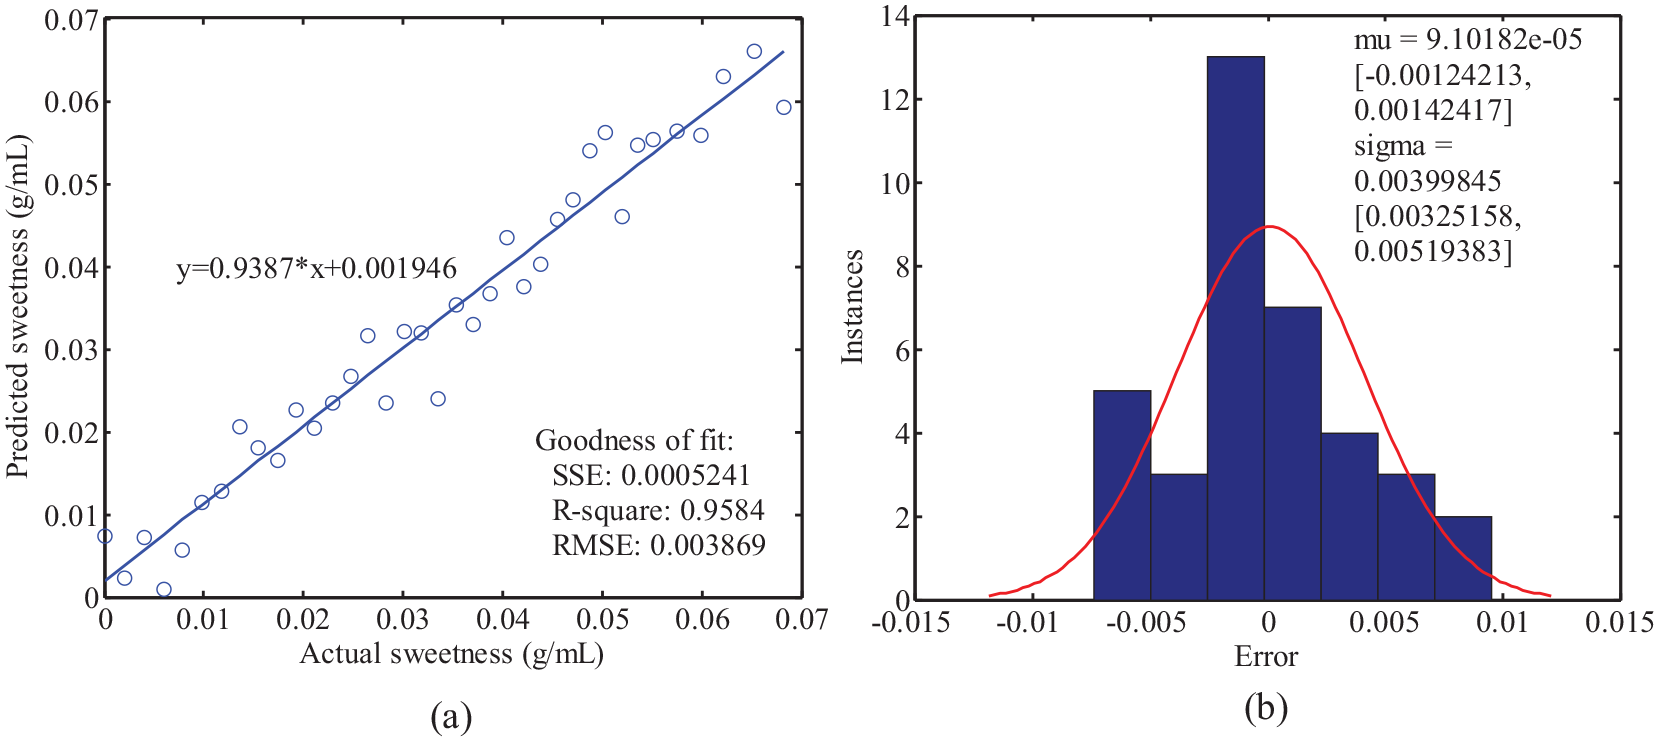
The results of the cross-validation for the training dataset: (a) the relationship between the predicted value and actual value and (b) the error of the cross-validation.
Selection of the number of principal components
Figure 4 shows the percent variance dominated by each principal component. As indicated, the percent variance dominated by the first principal component was higher than 95%, which means that all the principal components can be used to construct the model. To avoid the overfitting of the model, the Haaland and Thomas criterion was used to select a suitable number of principal components. Figure 5 shows the prediction residual error sum of square (PRESS) value when the model was constructed with different numbers of principal components. As shown, the minimal PRESS was achieved when three principal components were used. As a result, the
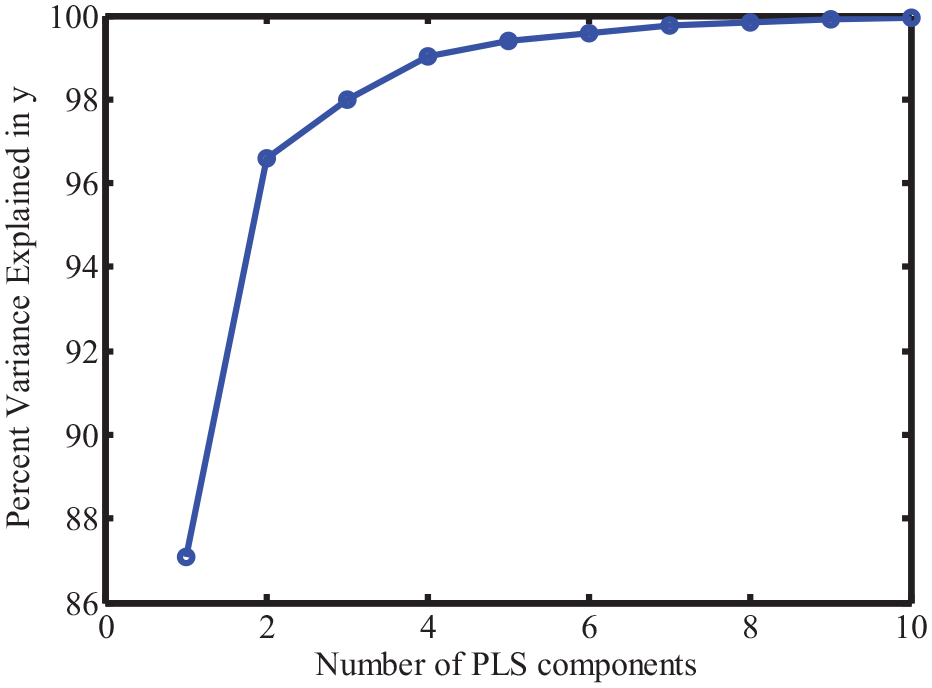
The percent variance dominated by each principal component.
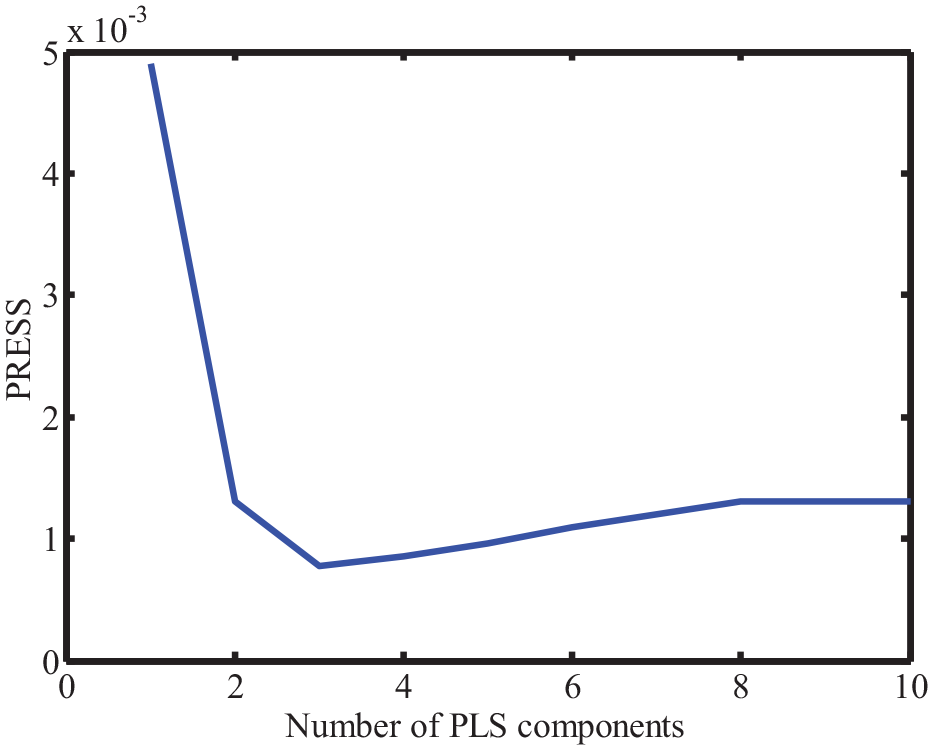
The PRESS value when the model was built with different numbers of principal components.
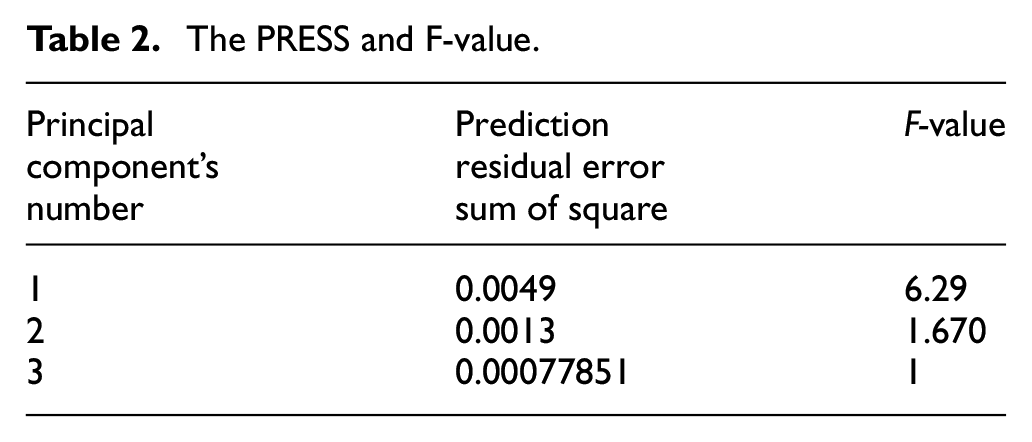
The PRESS and F-value.
Validation of the model
The prediction results of the model on the validation set are shown in Figure 6. As shown, the predicted and the actual values are evenly distributed on both sides of the straight line. The R2 and RMSE values in Figure 6(a) are 0.9777 and 0.002992. The higher value of R2 and lower value of RMSE for the training and validation datasets indicate that there was no underfitting of the model. The R2 and RMSE values for the validation dataset are close to those of the training dataset of the cross-validation, which means that there was model overfitting. The slope of the fitting line in the plot of the predicted and actual values was 0.9563, which is close to the theoretical value of one. The maximum and average errors are ∼0.0082 and ∼6.7 × 10⁻⁴. All these results demonstrate that it is feasible to use the iPLS model combined with fluorescence spectroscopy to predict the sugar content in tangerine.
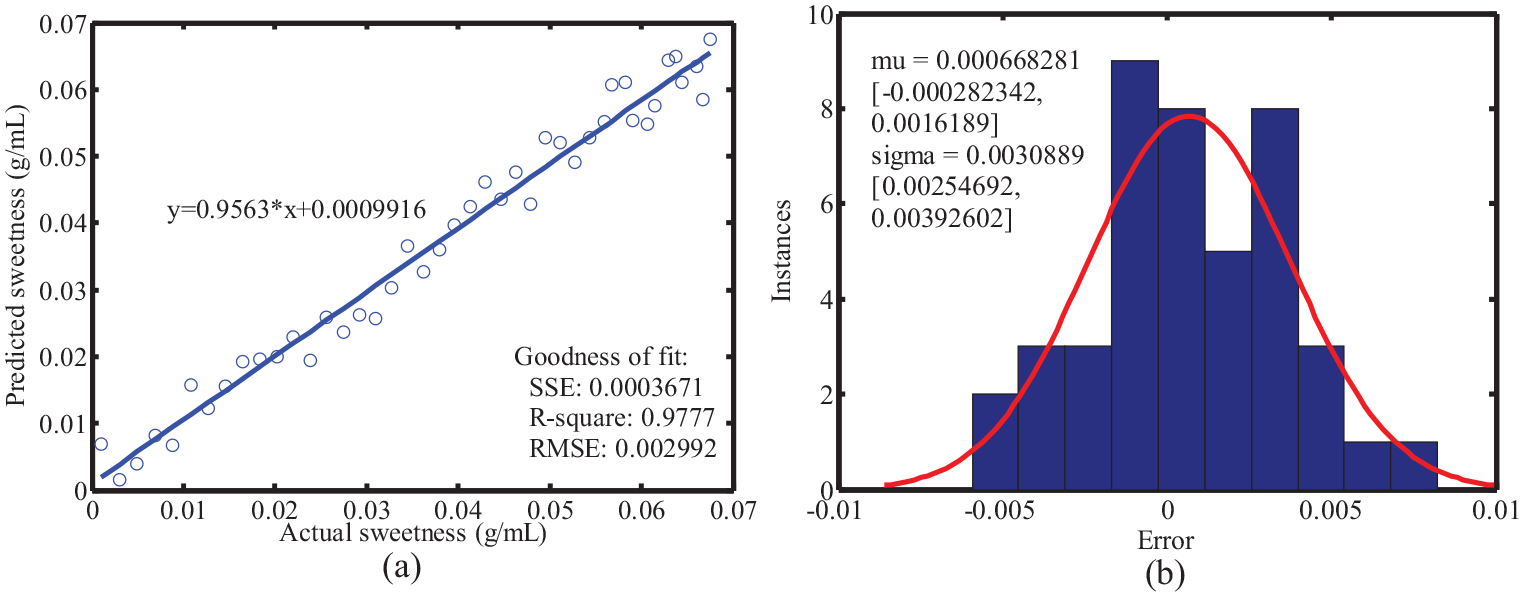
The relationship between the predicted value and the measured value for verification sample set. (a) The linear fitting of the actual sweetness and predicted sweetness, (b) The error histogram.
Finally, we randomly selected 16 samples from the training dataset and validation dataset. Each dataset was selected 8 samples. Figure 7 shown the results predicted by the model. The slope of the fitting line in the plot of the predicted and actual values was 0.9471, which is close to the theoretical value of one. The R2 and RMSE values in Figure 7 are 0.9827 and 0.002595. All the results demonstrated the effectiveness of the method.
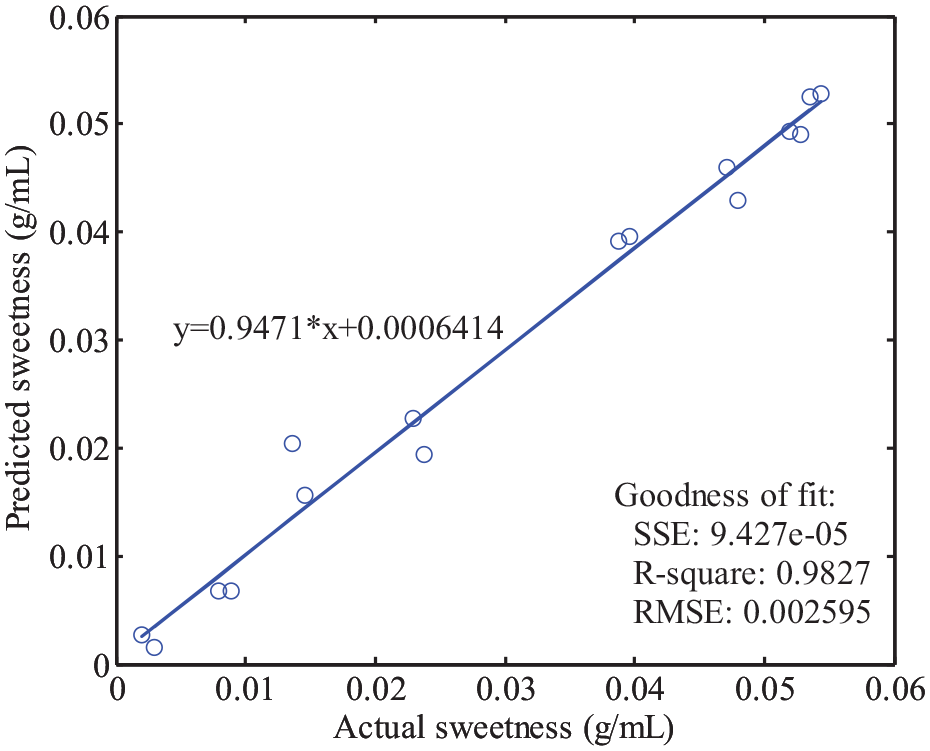
The results predicted by the model of the randomly selected samples.
Conclusions
In this study, a novel approach for the determination of sugar content in tangerines using fluorescence spectroscopy in conjunction with iPLS algorithm. The process used the SG method first to smooth the original spectrum, then extracted two principal components, and finally established a iPLS prediction model to quantify the tangerine sugar content. The coefficient of R2, RMSE, the slope of the fitting line, and average error of prediction for the training dataset were 0.9584, 0.003869, 0.9387, and 0.000091, respectively, and the coefficient of R2, RMSE, the slope of the fitting line, and average error of prediction for the validation dataset were 0.9777, 0.002992, 0.9563, and 0.00067. Exploring the potential for simultaneous determination of multiple quality parameters in tangerines, such as acidity or vitamin content, using fluorescence spectroscopy and multivariate analysis, could open new dimensions in fruit assessment.
Footnotes
Declaration of conflicting interests
The author(s) declared no potential conflicts of interest with respect to the research, authorship, and/or publication of this article.
Funding
The author(s) disclosed receipt of the following financial support for the research, authorship, and/or publication of this article: International Science and Technology Cooperation Project of Huaian City (HAC201615), and the Research Funds for the Central Universities (No. 30919011205).
Data availability statement
Data sharing not applicable to this article as no datasets were generated or analyzed during the current study.