
Abstract
Aiming at high misdetection of mechanical faults under imbalanced samples, a roundtrip probability-based method is proposed. By roundtrip mapping between latent variables and real fault data, biased estimation of the probability distribution of real fault data is obtained. Further, virtual fault data are sampled according to such distribution to increase sample amount. For recognition of real and virtual data, loss function based on binary cross-entropy is designed. For reconstruction between fault data and its roundtrip mapped results, objective function based on mean square error is designed. Thus, it preserves boundary data and avoids too many virtual data in central area. Meanwhile, a strategy for eliminating abnormal samples is designed to reduce boundary deviation. For supporting the advantage of roundtrip, in-depth reasons for misdetection are analyzed from empirical risk and structural risk. Experiments on 30 benchmark imbalanced test sets show that fault detection rate increases after amount enhancement. Additionally, it is verified on blade cracking and bearing fault detection. Results show that F1 score increases from 0.485 to 0.51 and 0.725 to 0.775 for such two cases.
Introduction
Fault detection is crucial for ensuring the safe operation of mechanical equipment. In recent years, data-driven detection methods have received widespread attention,1,2 mainly because they do not establish kinematic and dynamic models, avoiding in-depth analysis about mechanical equipment’s physical system.3,4 However, in industrial applications, normal data is far more abundant than fault data. Classification decision boundary may be shifted, resulting in data-driven methods being prone to misidentifying fault state as normal state. Especially, in early failure stages, it is extremely difficult to detect equipment faults. Currently, solutions to fault detection under imbalanced samples mainly include data-level methods and algorithmic-level methods. 5
Data-level methods achieve balance by increasing minority class samples (i.e. fault samples) or decreasing majority class samples (i.e. normal samples). Typical methods include SMOTE (Synthetic Minority Over-sampling Technique), ADASYN (Adaptive Synthetic Sampling), ENN (Edit Nearest Neighbor), and GAN (Generative Adversarial Network). For instance, Chawla et al. 6 used SMOTE to perform nearest-neighbor sampling to solve class imbalance problems. Bunkhumpornpat et al. 7 combined density estimation algorithm with SMOTE to balance the dataset while retaining features of minority class samples. Huang et al. 8 combined ADASYN with extreme learning machine to diagnose sliding electrical contact fault under imbalanced samples. He et al. 9 generated minority class samples using ADASYN and then modified the decision boundary of classifier to improve detection rate. Batista et al. 10 studied the behavior of SMOTE-Tomek and SMOTE-ENN for generating virtual minority class samples that conform to the overall dataset distribution. Wei et al. 11 designed a sample-characteristic-based SCOTE (Sample-characteristic Oversampling Technique) resampling method and found that fault detection rate significantly increases after balance on bearing fault diagnosis. Aiming at out-of-distribution detection, Han and Li 12 designed a deep ensemble method for these unseen data. Liu et al. 13 proposed a multi-scale GAN method for generating wavelet spectrograms to expand the amount of fault samples and experimental results showed that GAN could effectively generate two-dimensional spectral fault data. Fan et al. 14 embedded one-dimensional convolutional neural network in WGAN(Wasserstein GAN) to generate vibration data and experimental results on two bearing cases showed that this method could improve fault diagnosis accuracy. Han et al. 15 proposed a semi-supervised adversarial discriminative learning approach for the scarcity of annotated samples.
Algorithmic-level methods reduce false negative rate by raising the cost of fault samples, including cost-sensitive learning and multi-kernel learning. Domingos 16 combined cost-sensitive learning with pattern recognition to improve recognition rate by assigning different classification errors with unequal costs. Wang et al. 17 proposed a cost-sensitive learning approach for multi-class data to improve fault detection in pumping units, which are characterized by a typical long-tailed distribution and severe class imbalance. Ng et al. 18 proposed an intelligent electricity pricing classification method based on cost-sensitive learning and streaming imbalance-reversed bagging. Zhu et al. 19 introduced a weight matrix and regularization term into multi-kernel learning to solve pattern recognition problems with imbalanced samples. Ma et al. 20 combined multi-kernel learning with cost-sensitive learning to ensure model fitting and enhance the support of decision boundaries for minority class samples.
Despite significant improvement on detection of minority class samples by the two types of methods, there are still obvious limitations (see Section 1.1 for details). (1) Data-level methods synthesize or remove samples within certain neighborhood, which is not effective for handling multi-cluster or non-convex cluster data; (2) Algorithmic-level methods require in-depth analysis of costs and the designed cost function needs to match specific problems, which lacks generality and needs extremely professional mathematical basis.
To overcome such drawbacks, this work proposes a mechanical equipment fault detection method based on roundtrip probability estimation. By adversarial roundtrip, we achieve bidirectional mapping between latent variable space and sample space, such that it fits the probability distribution of fault data. Further, we sample some virtual data to achieve balance. Verifications on 30 UCI benchmark data show that detection rate of minority class samples significantly increases after balance. Additionally, the proposed method is validated on real mechanical equipment fault detection and results show a significant reduction in false negatives. The main contributions are summarized as follows:
1) To improve fault detection accuracy, roundtrip method is modified to adapt to fault detection under imbalanced data.
2) To generate reliable fault data, novel loss function and adversarial training is designed to ensure convergence.
3) An outlier identification method is designed to preserve the sample boundary.
Imbalanced samples problem analysis and research motivation
Imbalanced samples problem analysis
Due to prohibition of operating with faulty equipment, collected data consist mostly of normal state samples and very few fault samples, resulting in a significant imbalance in quantity. 21 Additionally, in industrial applications, equipment immediately shut down for inspection once detected fault. Most of collected fault samples are in early failure stage, embodying weak fault features. If adopting data-driven methods to analyze such imbalanced samples, there may be a situation where the overall accuracy is high but fault detection rate is low.
Taking binary classification as examples, we analyze the in-depth reasons from the perspective of empirical risk minimization and structural risk minimization. For empirical risk minimization model 22 (such as logistic regression), precise prediction is achieved by minimizing mean squared error (MSE) cost function.
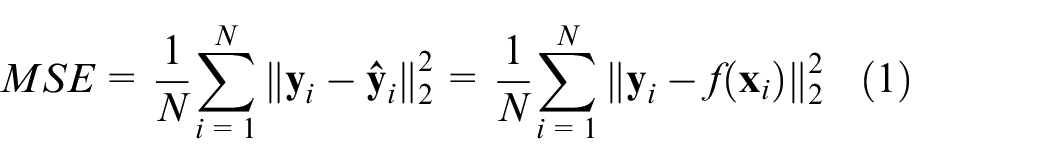
Where N denotes the sample amount;
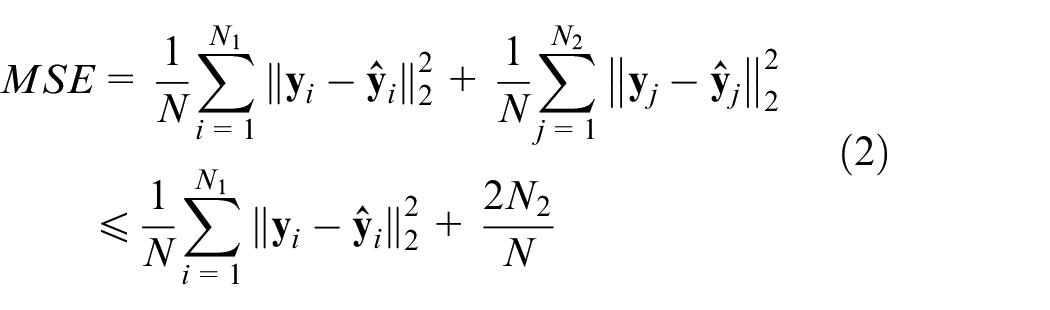
Where N1 denotes normal sample amount and N2 denotes fault sample amount. Since N>>N2,
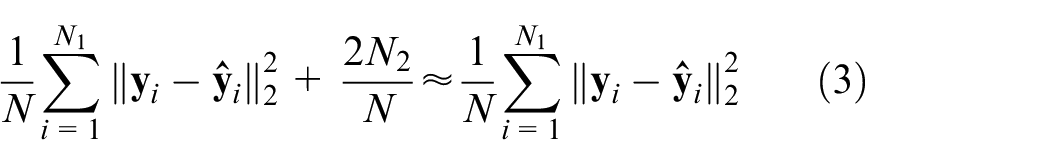
It is concluded that MSE only focuses on normal samples and ignore fault samples. The consistency between predicted values and target values is ignored, leading to misclassifying fault samples. Especially, in early failure stages, detection methods may fail due to the overlap between normal state and fault state in feature space.
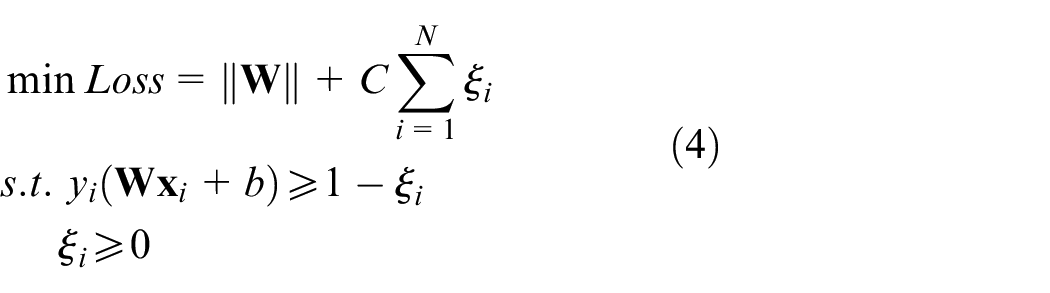
For structural risk minimization in case of linear separability (such as support vector machine, SVM), 23 decision surface is obtained by minimizing the following objective function.
Where
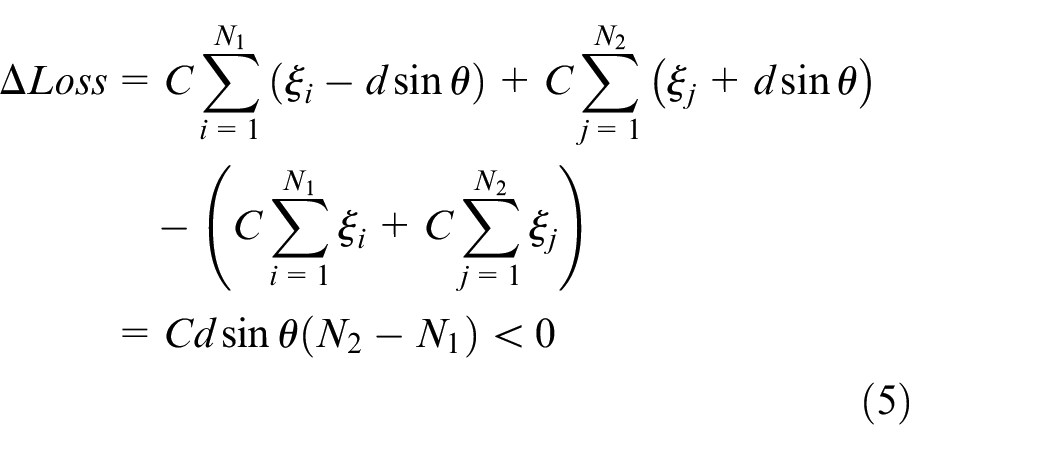
Where N1 denotes normal samples and N2 denotes fault samples; θ is the angle between decision surface and x-axis.
Through the above equation, we found
Research motivation
Based on the analysis in section 1.1, increasing the cost of fault samples can alleviate the above problem, but it may lead to overfitting due to insufficient sample size and the cost function needs redesigned for various problems. Therefore, synthesizing virtual samples can achieve generalizability and balance the cost function in an indirect way. SMOTE 24 is a representative sample synthesis methods and many methods are its improvement, such as WMOTE(Weighted Majority Over-sampling Technique), SCOTE, etc. Their core idea is to synthesize samples using the following equation:

Where
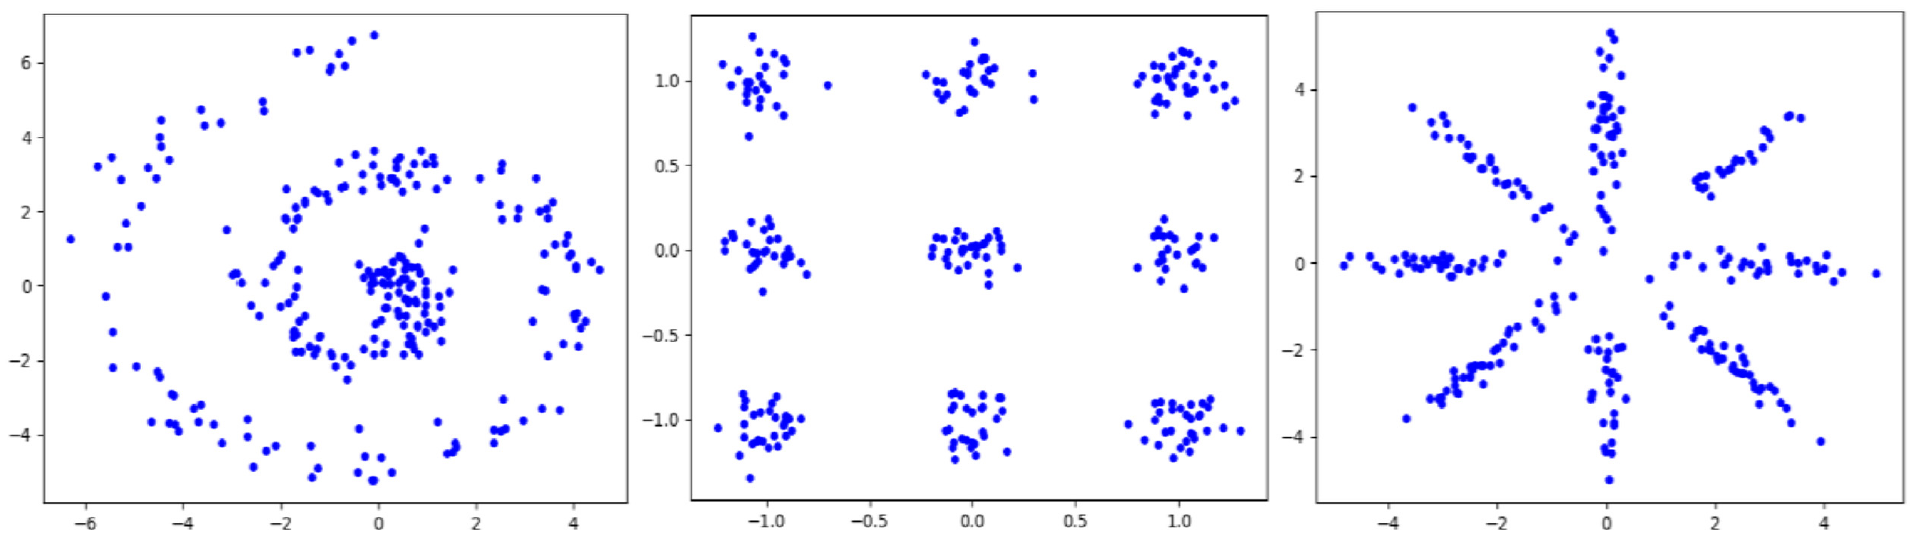
Non-convex, multi-cluster sample distribution.
Different from SMOTE-based methods, GAN generates synthetic samples by fitting the probability distribution,25–27 which can better handle multi-cluster and non-convex problems. GAN is implemented by maximizing and minimizing the following equation:
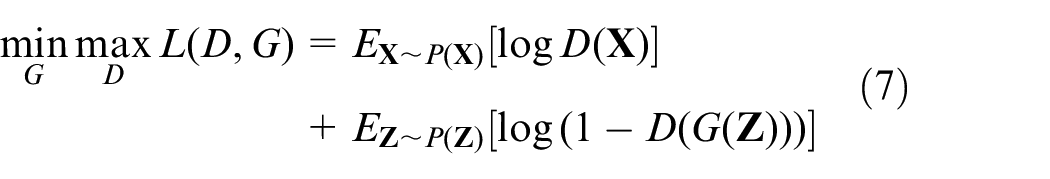
In GAN framework, G denotes generator, D denotes discriminator,
Roundtrip 28 uses a bidirectional GAN to achieve mutual mapping between sample space and latent variable space. It introduces two discriminators to ensure consistency between the distributions of virtual data and real data. Due to reconstruction error term in objective function, generated samples may not tend to high-density regions (otherwise, reconstruction error increases). Therefore, roundtrip can generate many boundary samples while covering real sample space, which is beneficial for high detection accuracy.
Roundtrip fault detection method
Basic principle of roundtrip probability estimation
Roundtrip is a novel approach published in PNAS in 2021. The basic principle can be found in referenced. 28 The overall framework of roundtrip method is shown in Figure 2.
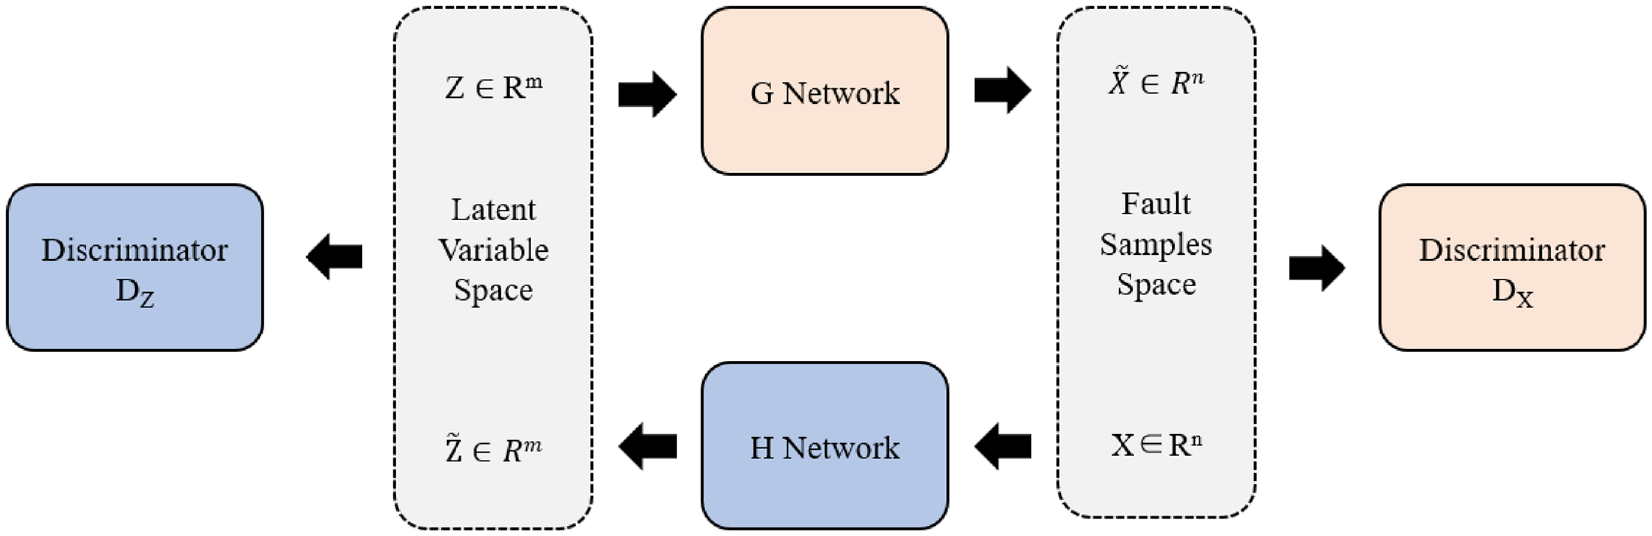
Overall framework of roundtrip.
It mainly includes four parts: generator networks G and H, discriminators D


H network implements mapping from latent variables to fault samples, while G network implements mapping from fault samples to latent variables. For discriminator D
After each objective function stabilizes, probability distribution of fault samples can be obtained using Laplace approximation method, as shown in equation (11).
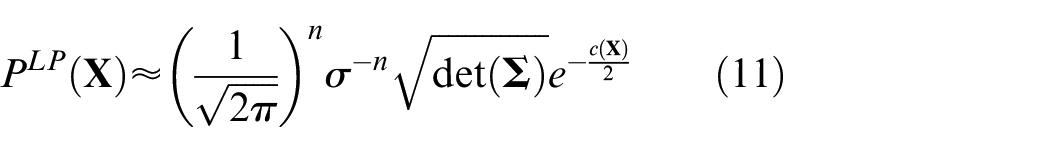
where
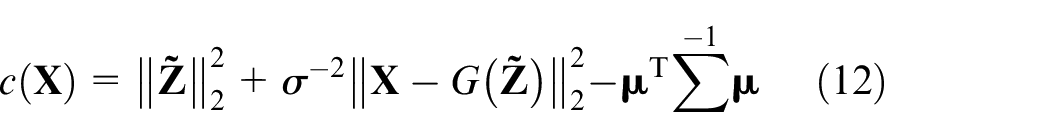

In equation (13),
Improvements of roundtrip method
Detailed implementation of roundtrip network model
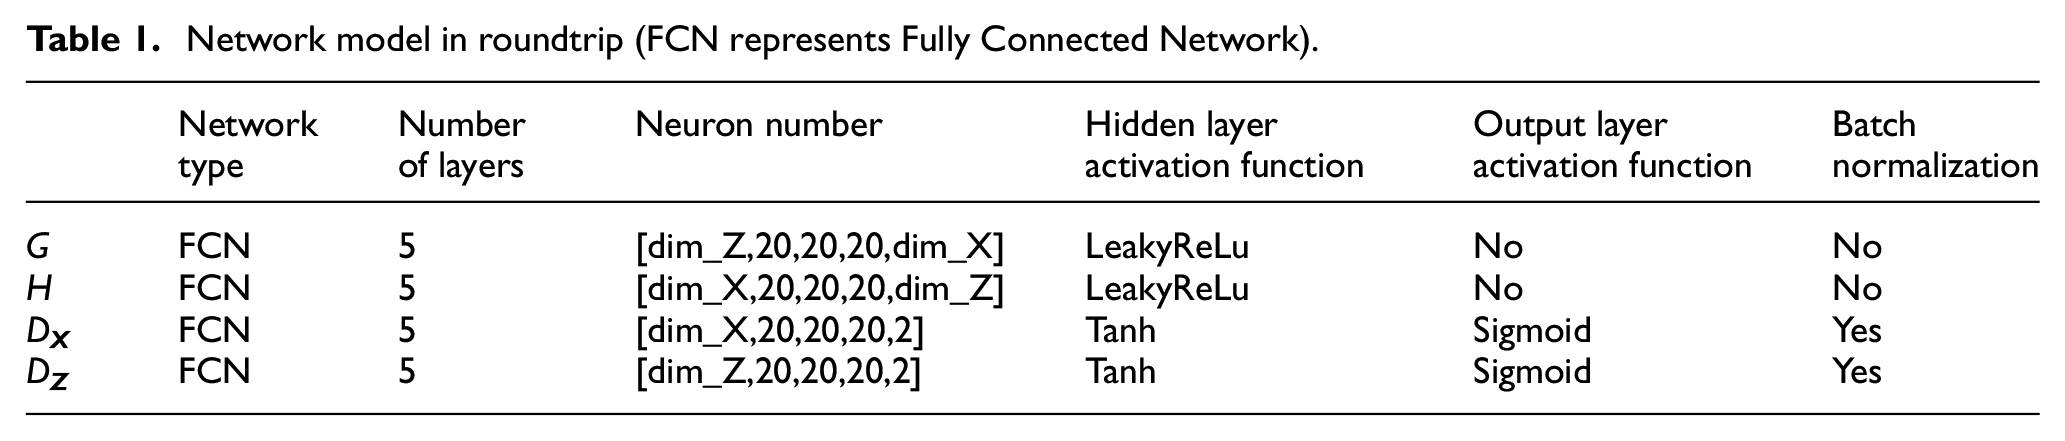
Considering that fault samples used in the experiment are one-dimensional time series data, G, H, D
Network model in roundtrip (FCN represents Fully Connected Network).
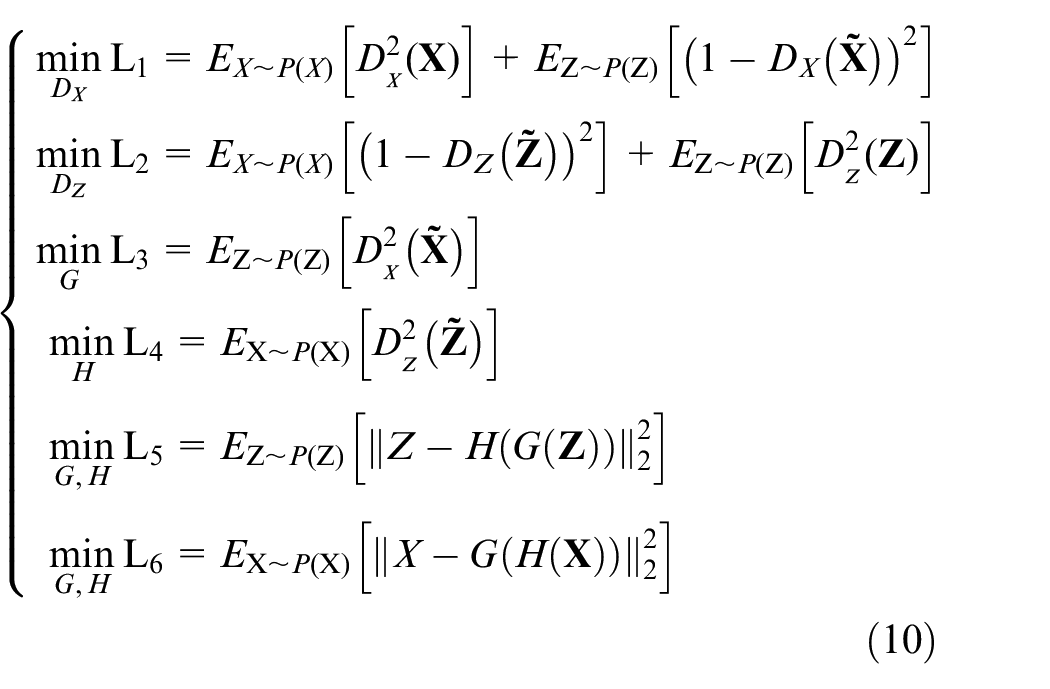
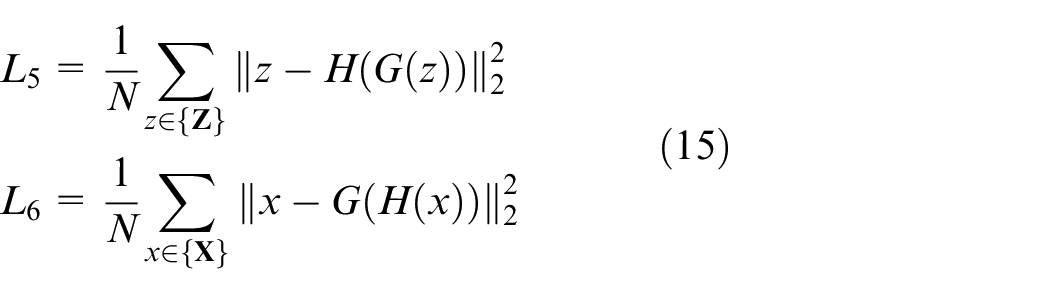
Detailed implementation of loss function
Mean squared error (MSE) is effective for measuring consistency between two random variables. Therefore, it is fit for L5 and L6 in equation (10), which correspond to reconstruction of both latent variable and fault samples. However, gradient of MSE is very small around global minimum, which brings slow convergence when used for D
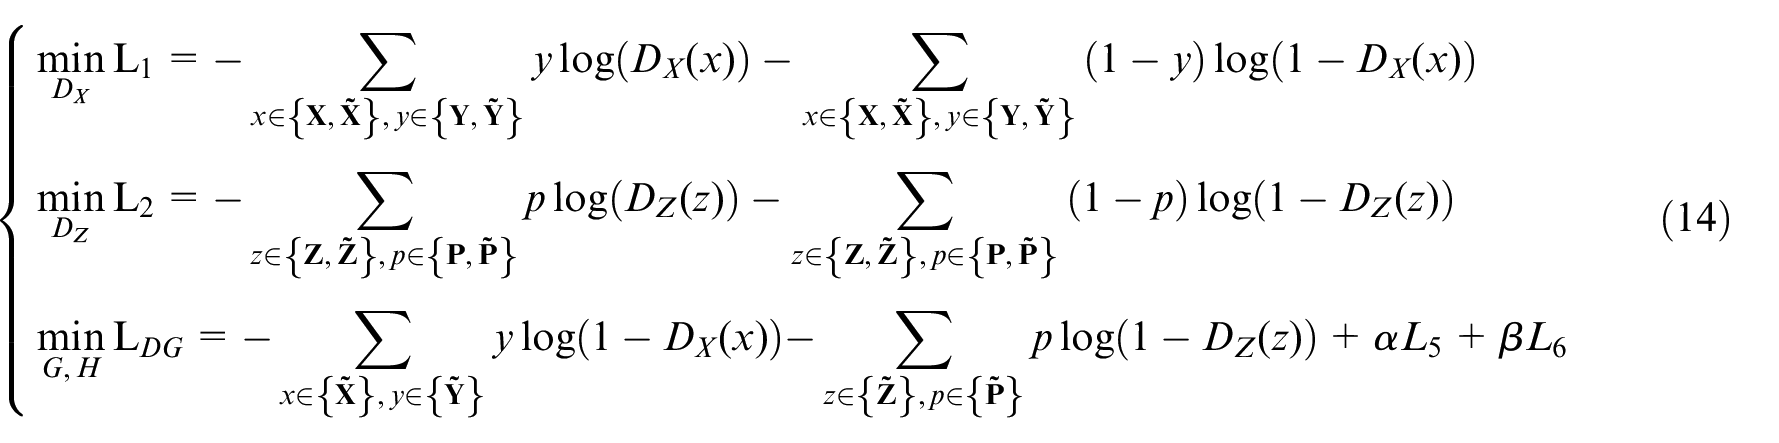
With
In equation (14),
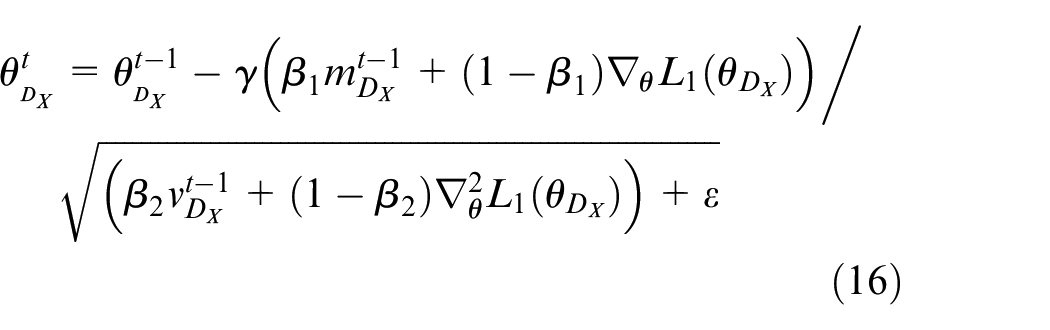
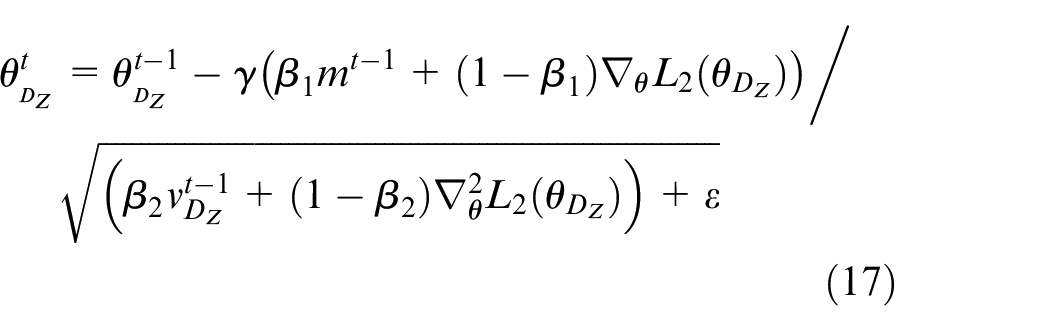
Adversarial training
In adversarial training process, Adam algorithm is used to minimize the three objective functions in equation (14). During each iteration, parameters of discriminator D
In the above equation,
where
Where
Identification of outlier samples
As roundtrip implements a mapping from latent variable space to sample space, outlier samples may be sampled from low probability density regions. To identify and remove outlier samples, the following equation is used:
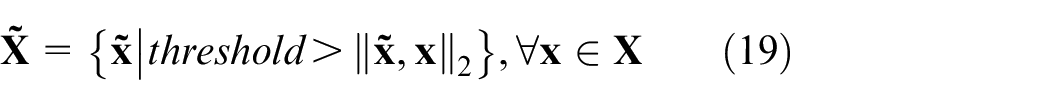
Where
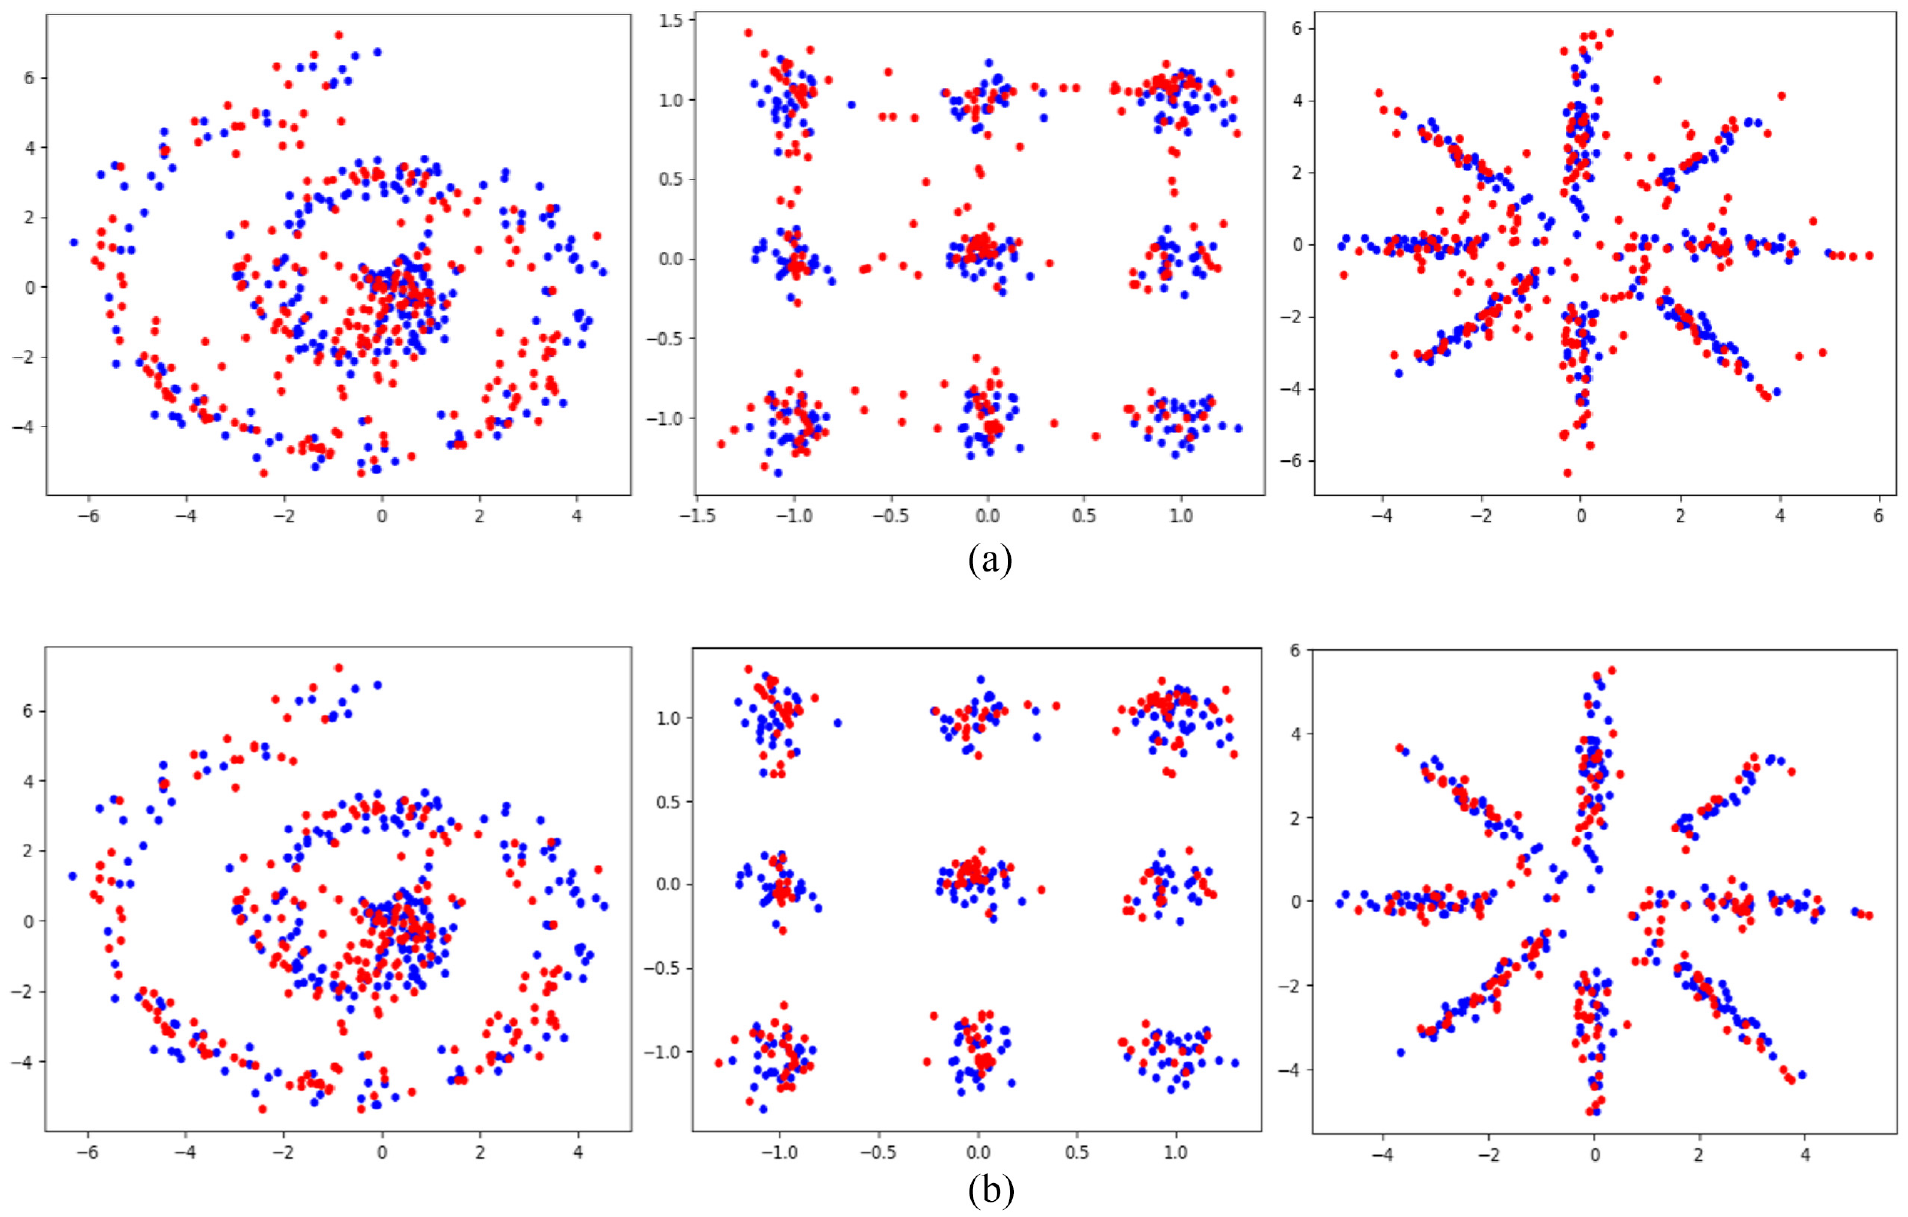
Real Fault samples (blue points) and virtual fault samples (red points, generated by roundtrip): (a) before removing outlier samples and (b) after removing outlier samples.
Note that for the cases in Section 3 and Section 4, data are in high dimension and cannot be visualized. Therefore, it is hard to find the optimal threshold. For benchmark in section 3, threshold is set as 0.4. For the two cases in section 4, threshold is set as 10, which are also achieved by trial and error.
Overall framework
The overall framework of roundtrip for mechanical equipment fault detection is shown in Figure 4. The details are as follows.
(1) Collect normal state samples and fault samples of mechanical equipment.
(2) Input fault samples into Roundtrip model to train G and H and obtain probability density function of fault samples according to equations (11)–(13).
(3) Sample virtual fault data to enhance fault sample amount.
(4) Merge normal state samples, real fault samples and virtual fault samples to obtain a balanced dataset, input it into classifier to perform fault detection.
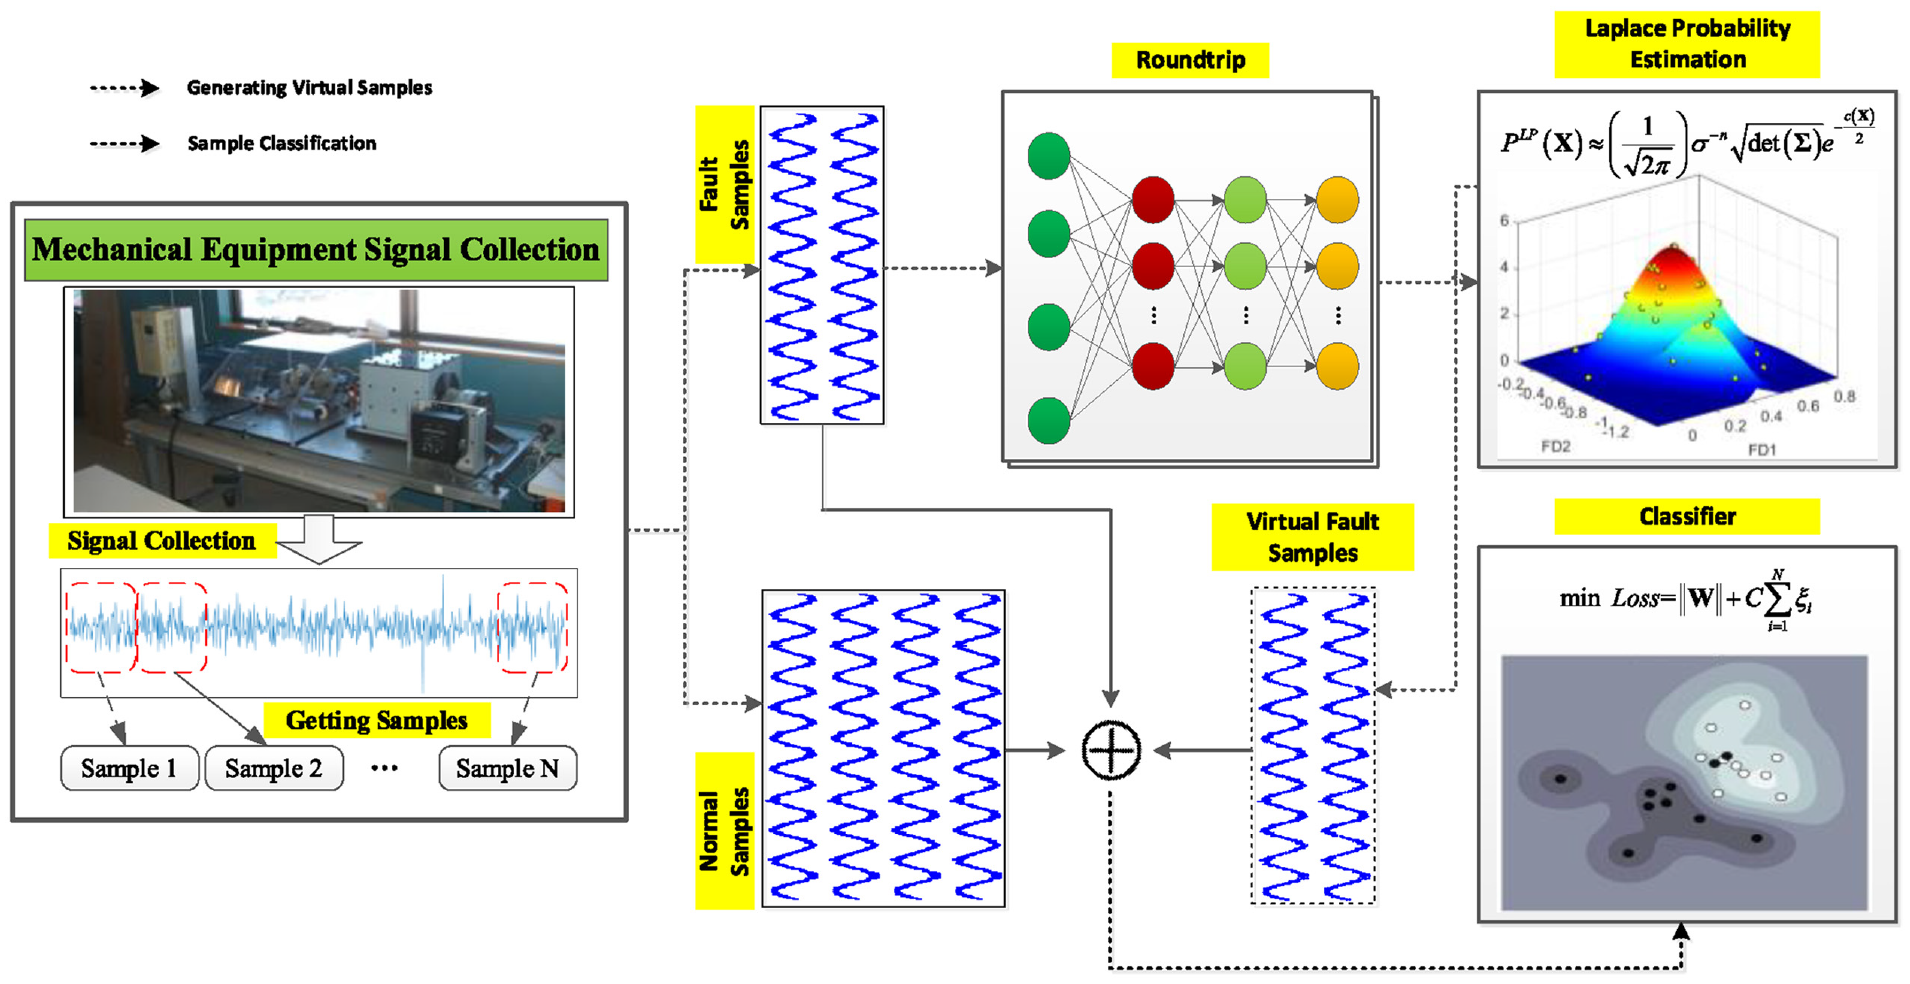
Overall framework of fault detection under imbalanced samples.
Benchmark experiment
Dataset description
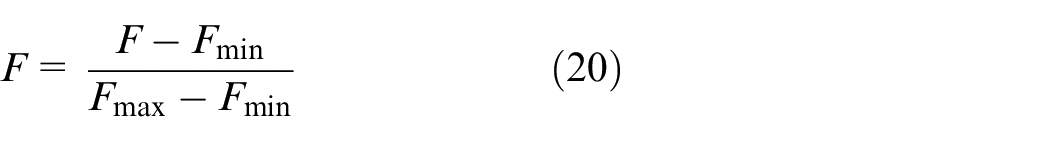
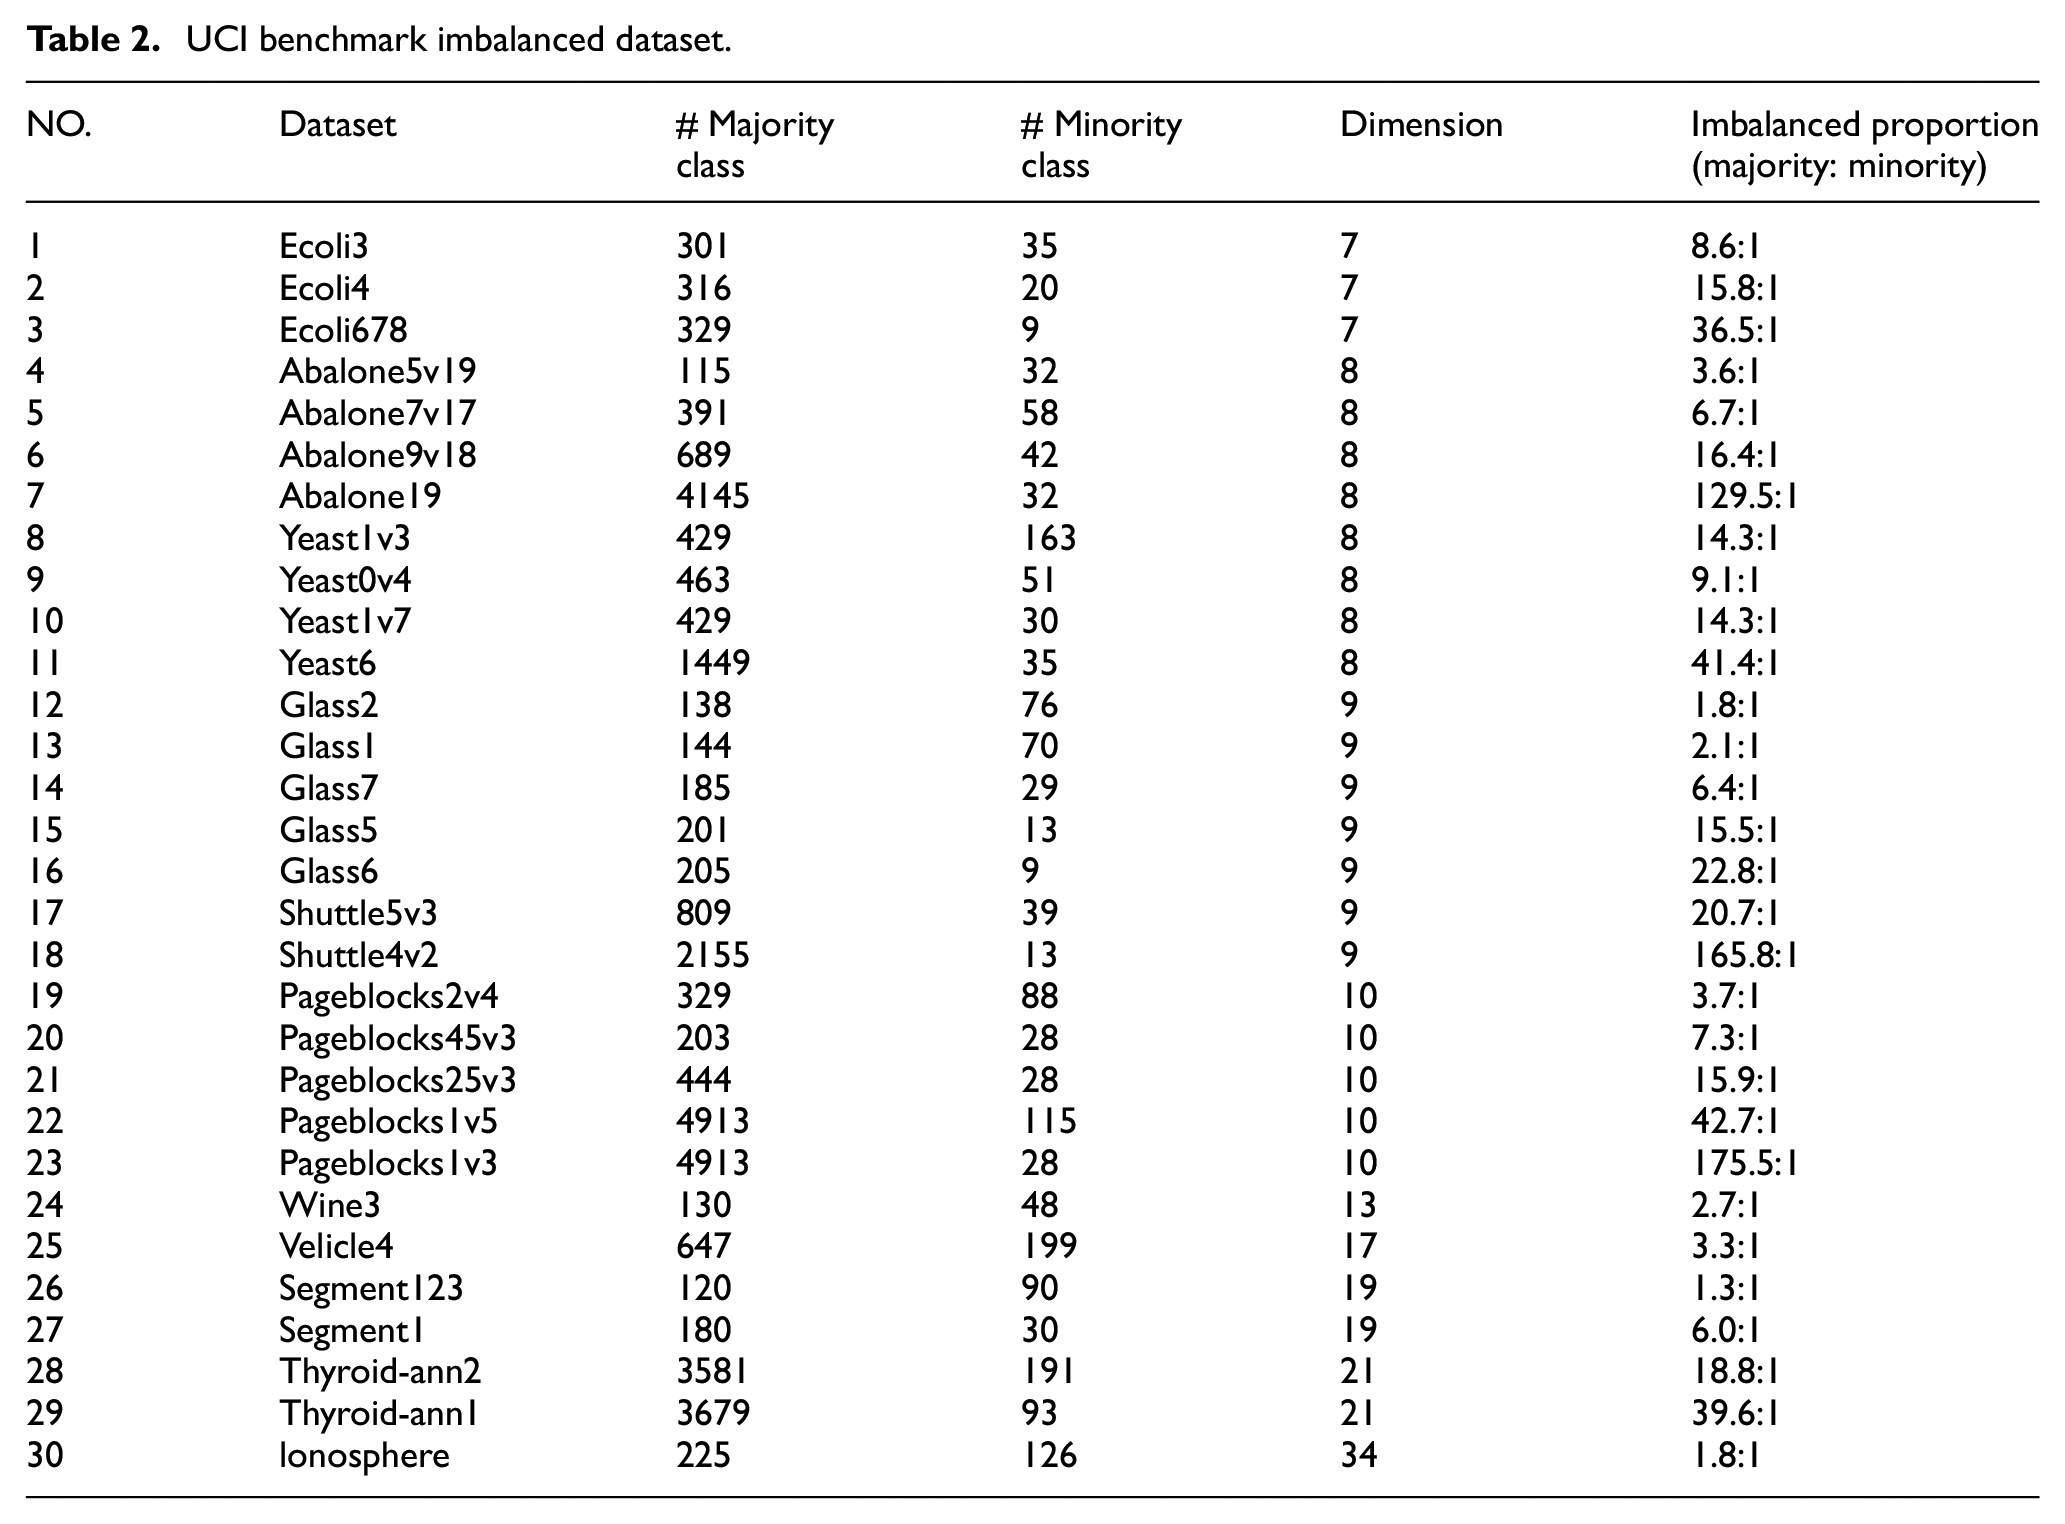
We verified the proposed method on UCI (University of California Irvine) benchmark imbalanced dataset, which is obtained from http://archive.ics.uci.edu/ml/index.php. As shown in Table 2, there are 30 datasets, all of which are binary classification problems with the number of features ranging from 7 to 34. The minimum and maximum imbalance ratios are 1.3:1 and 175.5:1 respectively. UCI dataset has been widely used to test various learning methods as a standard dataset, making it suitable for evaluating the performance of the proposed method. Considering multiscale characteristics of different features, we use equation (20) to normalize each feature and rescale them to the range of [0,1].
UCI benchmark imbalanced dataset.
Where F represents feature to be processed; Fmin and Fmax are the minimum and maximum feature values in historical data.
Evaluation metrics
F1 score is selected as evaluation metric to assess performance, since it considers both sensitivity (recall) to fault samples and reliability (precision) of detection method. A detailed analysis of this metric can be found in reference. 30 F1 score is calculated as follows.


Where P denotes precision and R denotes recall. Since the amount of minority class samples is small, a three-fold cross-validation is adopted and F1 score is calculated by averaging the results of three-fold cross-validation.
Results and analysis
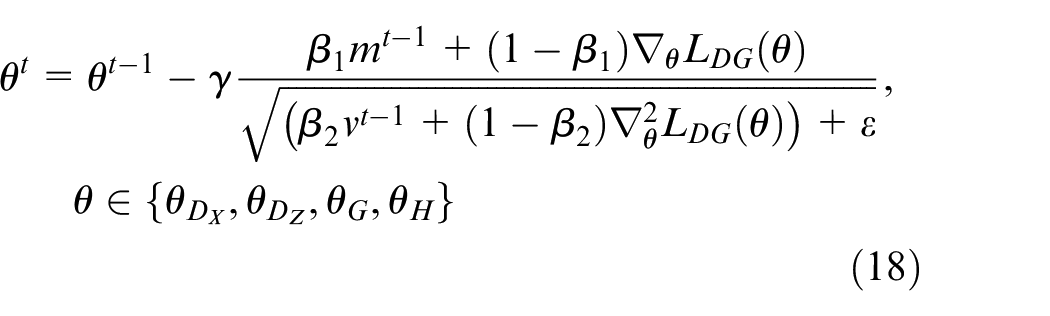
Experimental parameters are set as follows: α and β in equation (14) are set to 10; learning rate γ in equations (16)–(18) is set to 0.01; the first and second momentums β1 and β2 are set to 0.9 and 0.999 respectively; threshold in equation (19) is set to 0.4; number of iterations is set to 10,000. It should be noted that these parameters are obtained through multiple trials. In addition, considering the cost balance between real samples and virtual samples in equation (14), the size and dimension of virtual latent variables are the same as those of real samples.
Four datasets (Ecoli3, Yeast0V4, Pageblocks1v3 and Wine3) are selected for analysis. Variation of objective function during iterations is shown in Figure 5. L1 and L2 do not conflict and their sum is shown for the ease of iteration. As seen, two curves show a decreasing trend, indicating that the iteration process is reasonable. In addition, during the descent process of LDG, L1+L2 may fluctuate. This is because the generated samples are close to real samples, making it difficult for discriminator to distinguish between real and virtual samples, resulting in an adversarial effect.
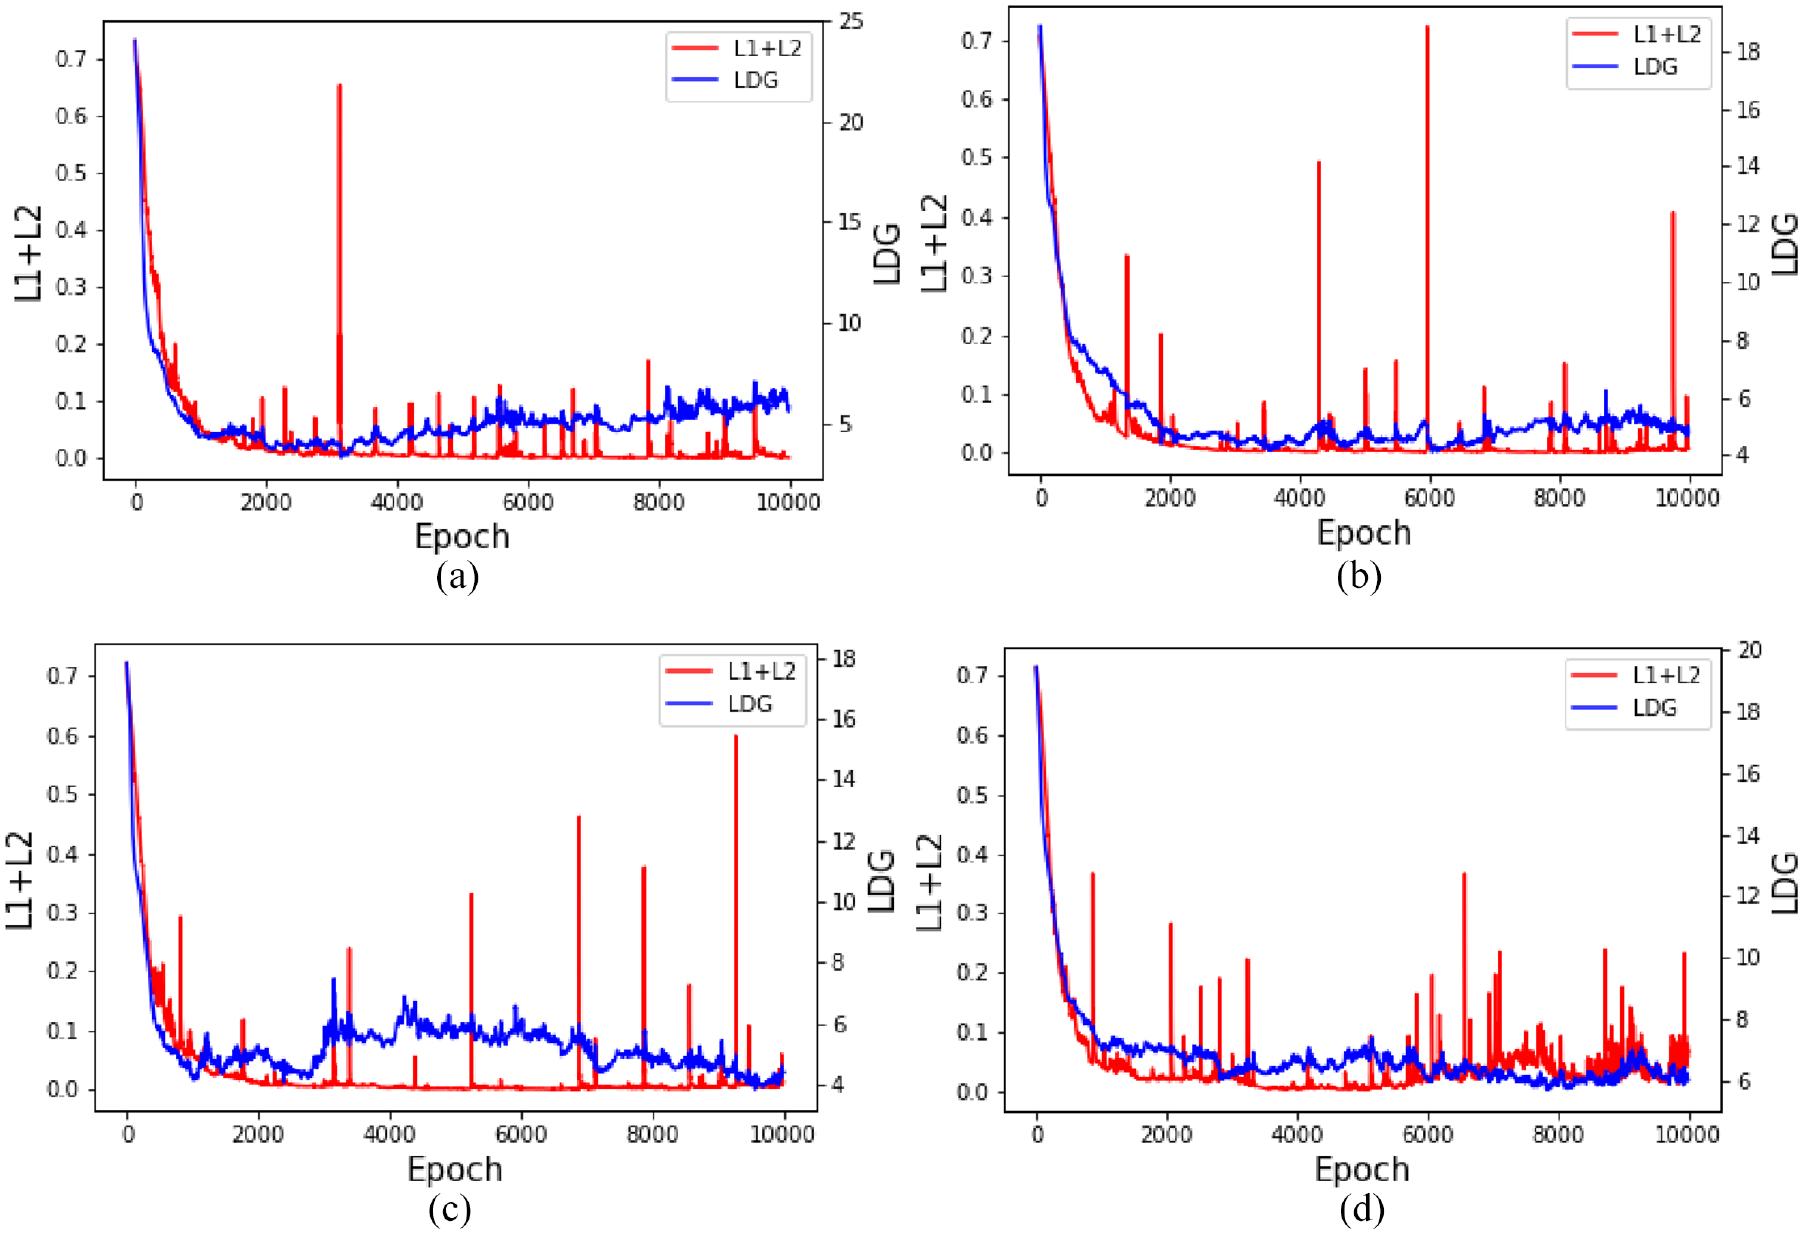
Iterative process curve: (a) Ecoli3, (b) Yeast0V4, (c) Pageblocks1v3, and (d) Wine3.
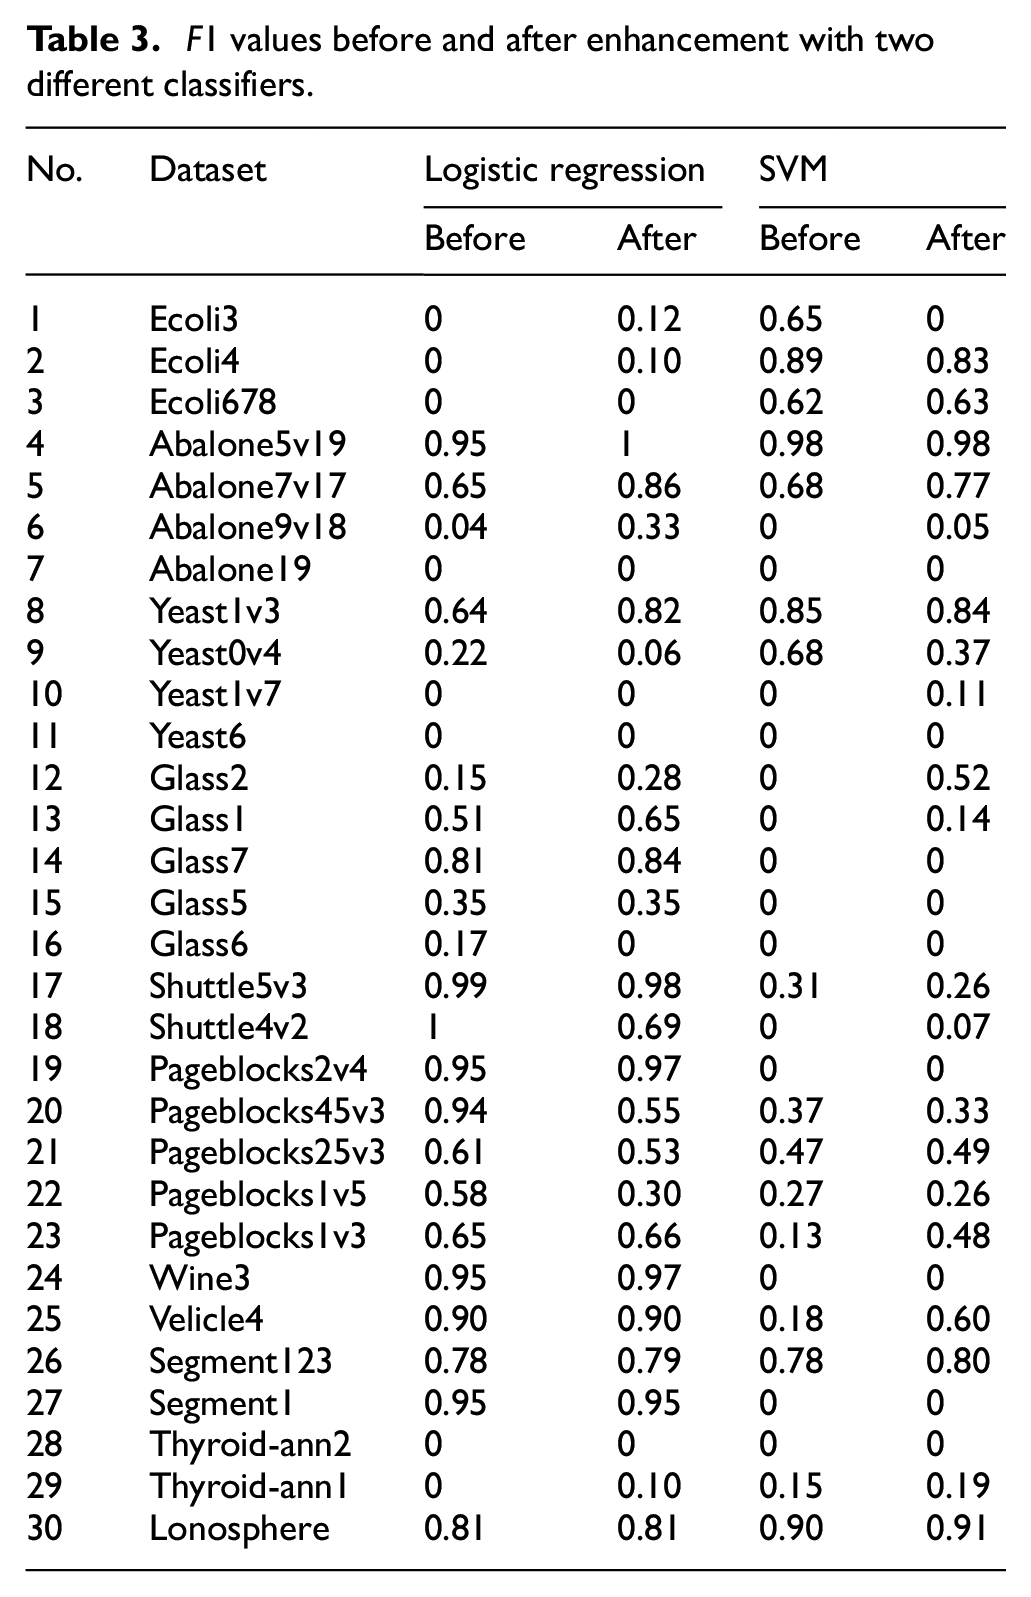
According to equation (11), probability distribution of minority class samples is obtained and virtual samples (number=# majority class - # minority class) are sampled. Logistic regression and SVM are used to recognize the datasets. For SVM, RBF kernel is adopted with a regularization factor of 1.0. F1 values are shown in Table 3. It is seen that with logistic regression classifier, there are 14 F1 values greater than that before enhancement, 9 equal value and 7 smaller value. With SVM classifier, there are 13 F1 values greater than that before enhancement, 10 equal value and 7 smaller value. It indicates that roundtrip method can generate effective virtual samples, thereby reducing misdetections.
F1 values before and after enhancement with two different classifiers.
Case studies on mechanical fault detection
Wind turbine blade crack detection
Dataset description
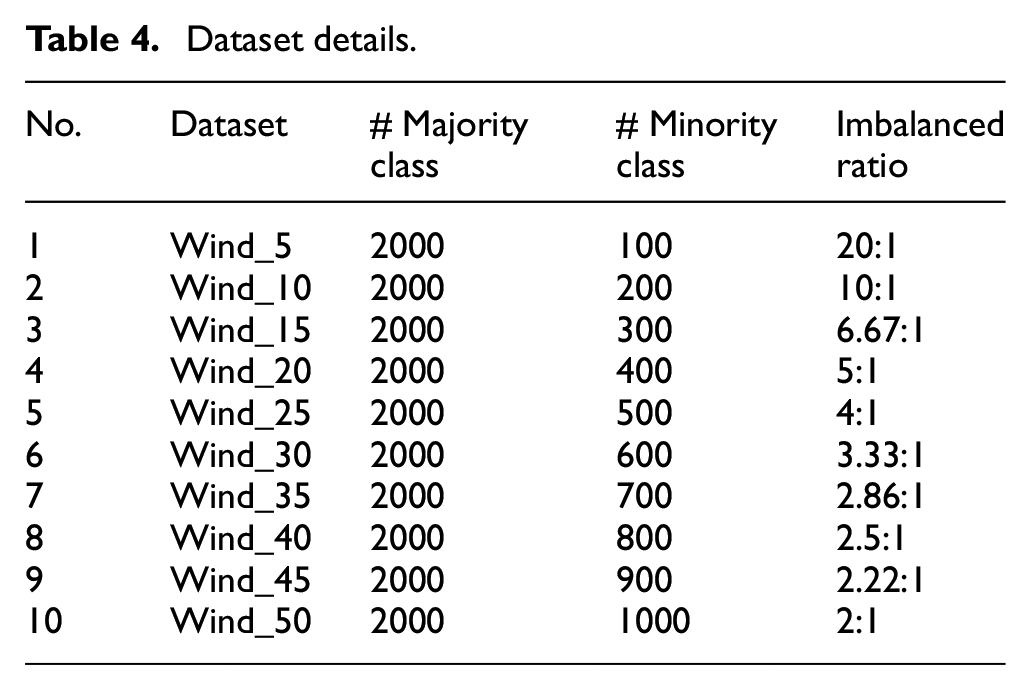
Wind turbine, whose structure is shown in Figure 6, is widely used for wind power generation. Wind turbine blade is the main energy conversion component of wind turbine and operates under heavy loads. According to statistics, accidents caused by blade cracks account for 30% of total accidents and they occur frequently during high-wind power generation periods. In this case study, data provided by State Power Investment Corporation Limited is used for validation, which can be referred to https://www.datafountain.cn/competitions/302. There are 2000 normal samples and undetermined amount of blade crack samples, forming 10 imbalanced datasets, as listed in Table 4. The minimum imbalance ratio is 2:1 and the maximum is 20:1. Each sample contains 75 features, such as pitch motor current, x and y direction vibration, and inverter grid-side current.
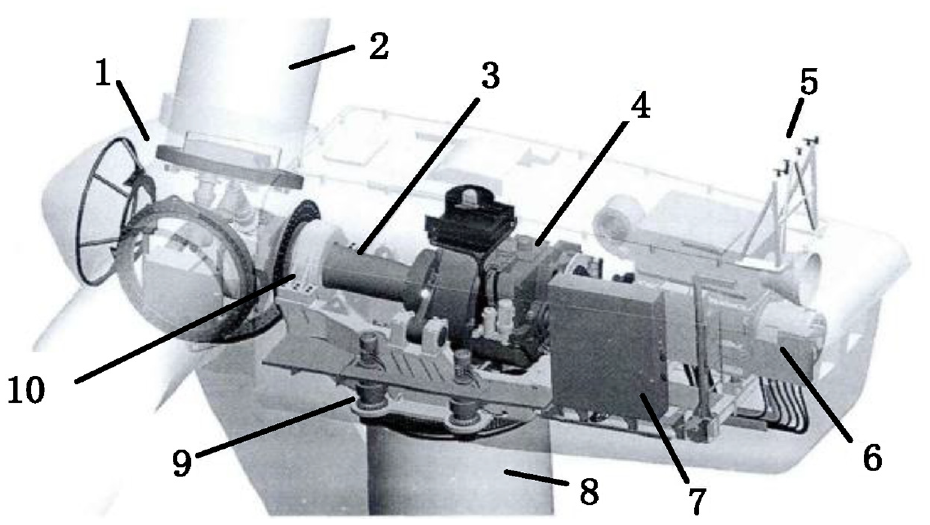
Structure diagram of wind turbine. (1) wheel hub; (2) blades; (3) rotor; (4) gear box; (5) anemometer and wind vane; (6) generator; (7) control box; (8) tower; (9) yaw system; (10) main bearing.
Dataset details.
Detection results with different classifiers
For equation (14), α and β are both set to 15 (obtained through repeated experiments) and other parameters are configured as described in 3.3. Normalization is performed using equation (20). The first four data are selected and their objective function change curves during iteration process are shown in Figure 7. It is seen that the two curves show downward trend versus iteration progresses, indicating that the iteration is reasonable. In the early stage of iteration, when LDG decreases, L1+L2 will produce violent fluctuations because the generated virtual samples are close to real samples, making it difficult for discriminator to distinguish them. Besides, when L1+L2 decreases, LDG will fluctuate because the cost that virtual samples identified as real in LDG will increase as discriminator improves. Overall, at the end of iteration, the two objective functions are stable.
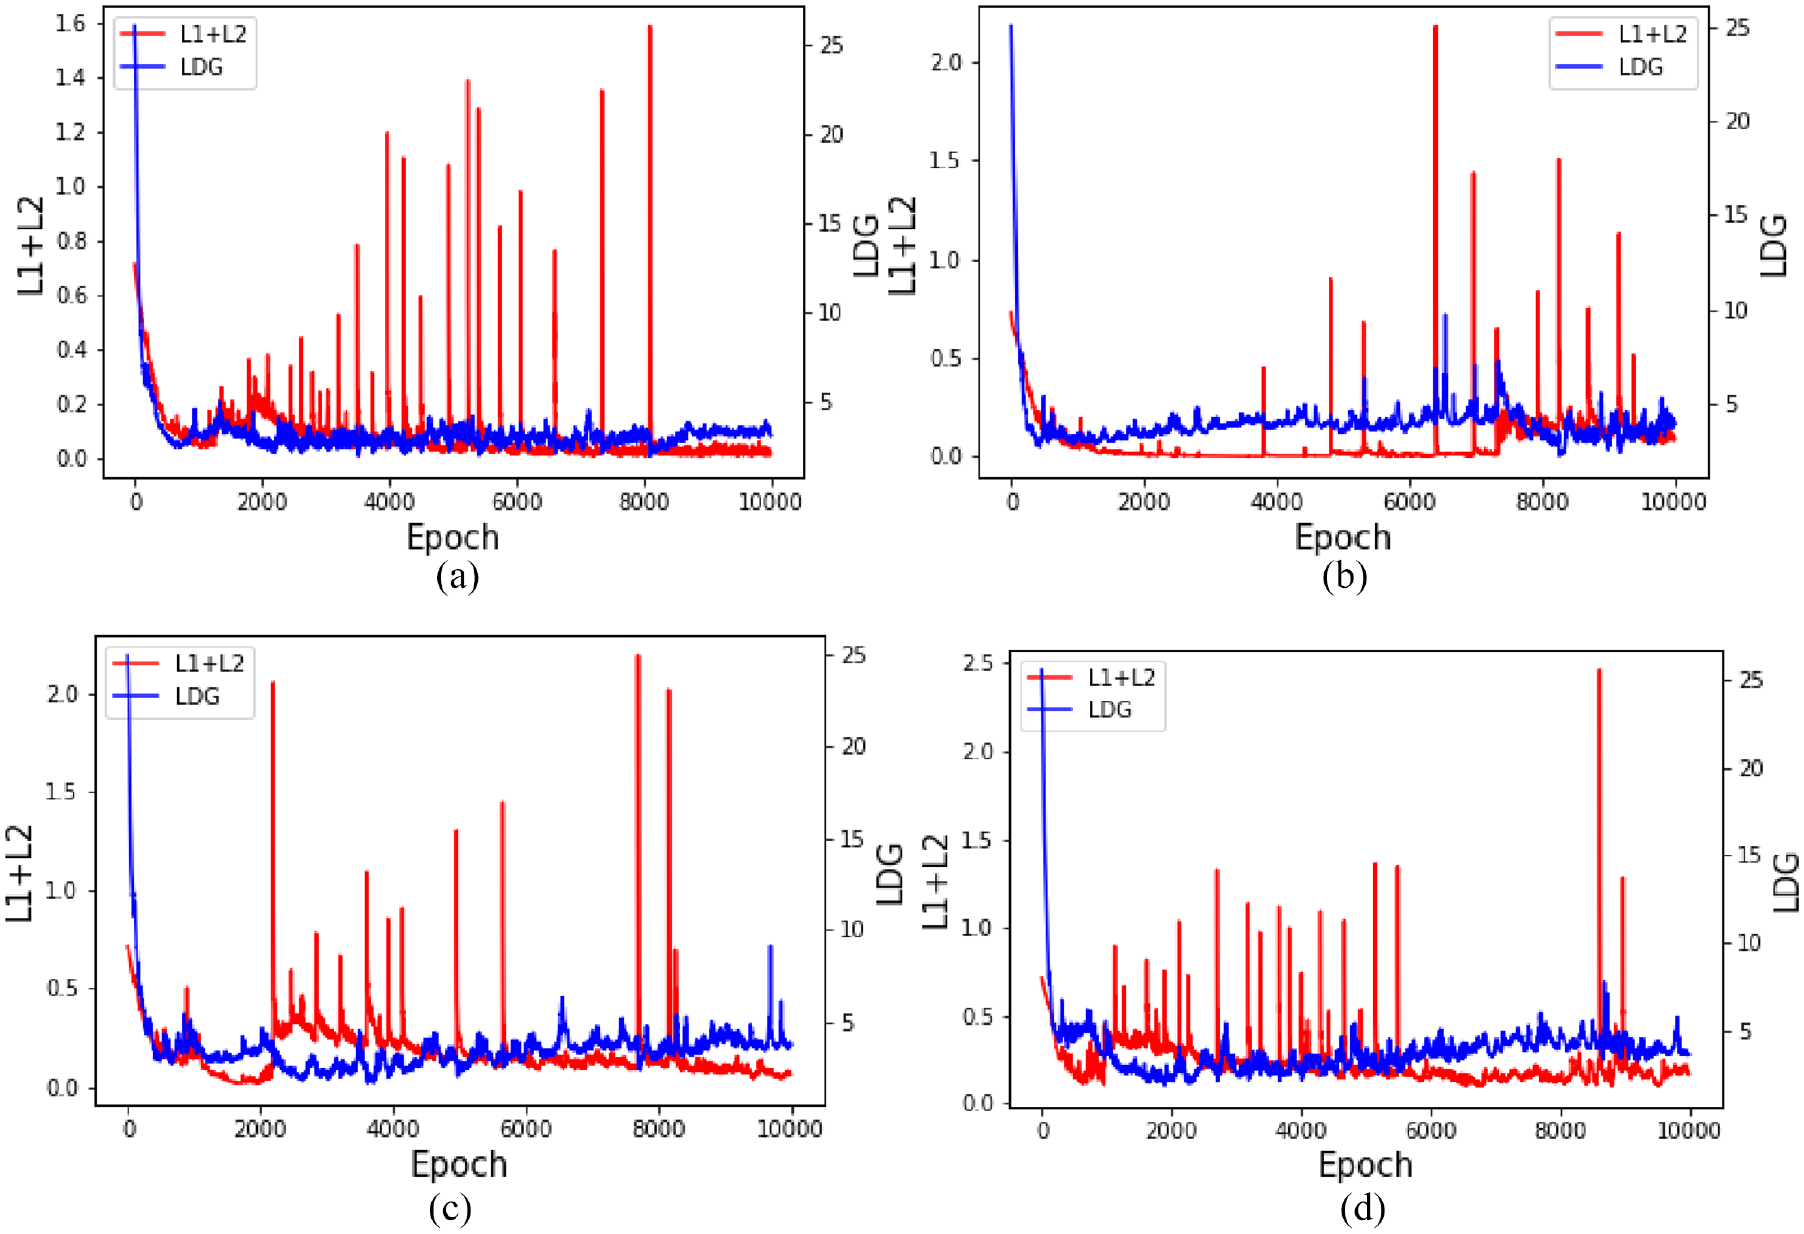
Iterative process curve: (a) Wind_5, (b) Wind_10, (c) Wind_15, and (d) Wind_20.
As shown in Table 5, with logistic regression classifier, 5 F1 scores improve after enhancement, 2 F1 scores get worse, and 3 F1 scores are the same as that before enhancement. With SVM classifier, 7 F1 scores get larger after enhancement, but 3 F1 scores get worse. The average F1 score of the 10 groups has increased from 0.54 to 0.56 and from 0.43 to 0.46. Moreover, as the number of minority class samples increases, F1 score improves. But, when it reaches 35% (ratio of minority class to majority class), F1 score tends to stabilize or even decrease. This is because improving the recognition of minority class samples will increase misidentification of majority class samples. However, F1 score measures the overall recognition rate, so a decrease appears. Combining the two classifiers, average F1 score before enhancement is 0.485 (i.e. (0.54 + 0.43)/2) and average F1 score is 0.51 (i.e. (0.56 + 0.46)/2) after enhancement. It indicates that the designed method improves wind turbine fault detection rate and reduce the misdetection while ensuring the overall recognition rate.
F1 values before and after balance under two different classifiers.

Comparison with other methods
Comparison method
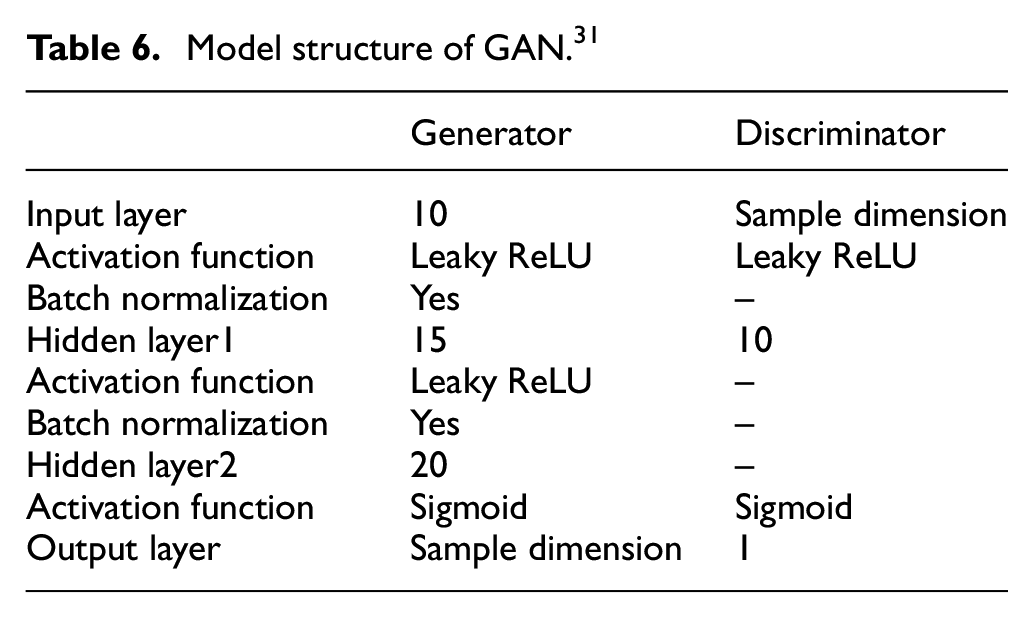
To further verify advancement of the proposed method, it is compared with three other methods, including SMOTE, 5 GAN, 31 Roundtrip1 (Roundtrip without removing outlier samples). For SMOTE, the number of nearest neighbor is 5, which is a common used value. For GAN, model structure is listed in Table 6, which is the same as that in reference. 31 Roundtrip1 have the same structure as Roundtrip.
Model structure of GAN. 31
Comparison results
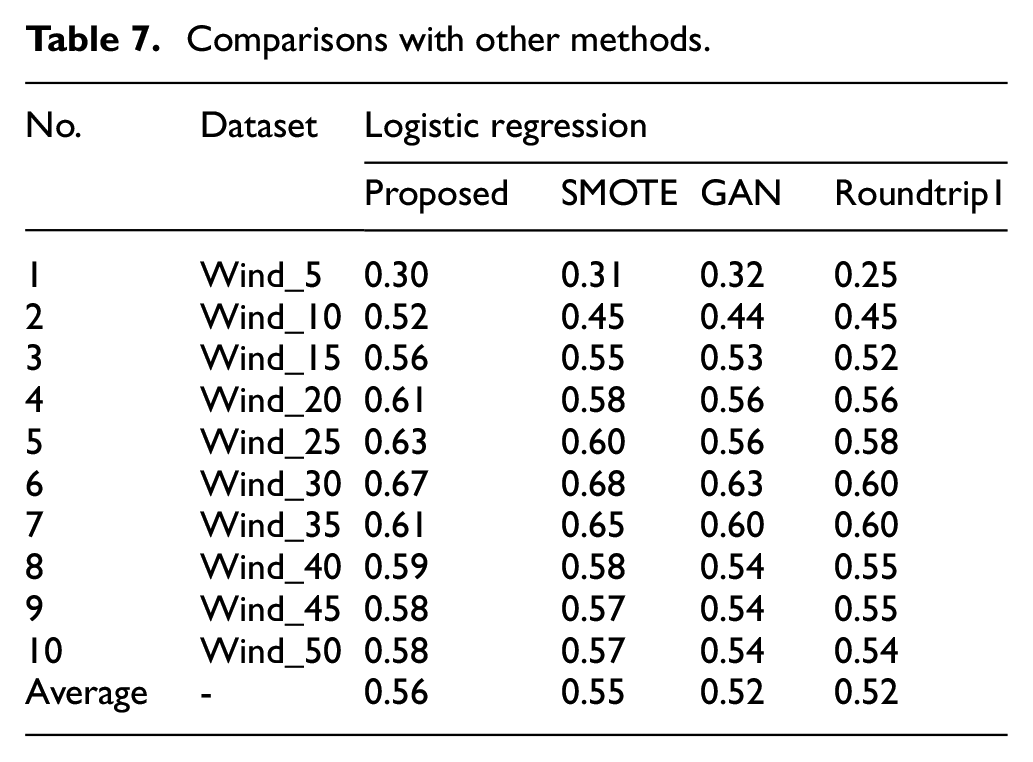
Comparison results are listed in Table 7. Mean F1 score for the three comparison methods are respectively 0.55, 0.52, and 0.52. Overall, the proposed method is just slightly better than SMOTE, but obviously better than GAN and Roundtrip1. Specially, there are two F1 scores lower than SMOTE and one F1 scores lower than GAN. Likewise, F1 scores increase as imbalance ratio alleviates, but when reaching 35%, F1 score stabilize or even decrease (see section 4.1.2). In summary, the proposed method can improve wind turbine fault detection rate while ensuring the overall recognition rate.
Comparisons with other methods.
IMS bearing fault detection
Dataset description
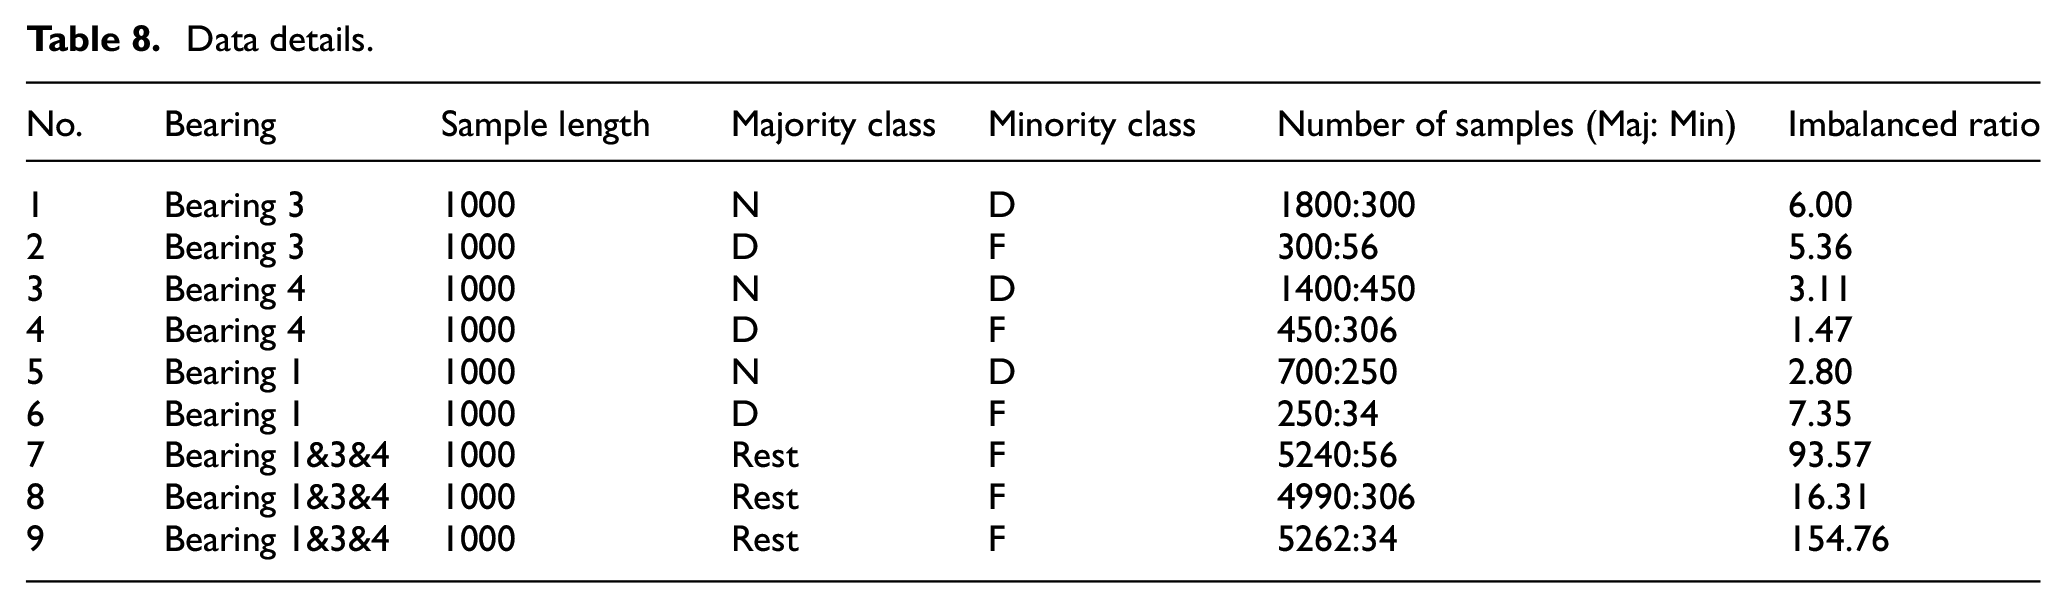
Bearing vibration data provide by NASA is used for validation. Figure 8(a) shows the experimental setup, which has four Rexnord ZA-2115 double-row bearings installed on the shaft, each with 16 rolling elements. A radial load of 6000 pounds is applied on the shaft and the sampling frequency is 20 kHz. More details can be found in reference. 32 Figure 8(b) to (d) show the degradation signals of three bearings, where green line represents normal state (N), blue line represents degraded state (D) and red line represents faulty state (F). It can be clearly seen that the sample size is imbalanced and the specific sample information is shown in Table 8. Since rotating machinery has periodicity, each sample is transformed into frequency domain. Due to the symmetry of the spectrum, the length of each transformed sample is 1000.
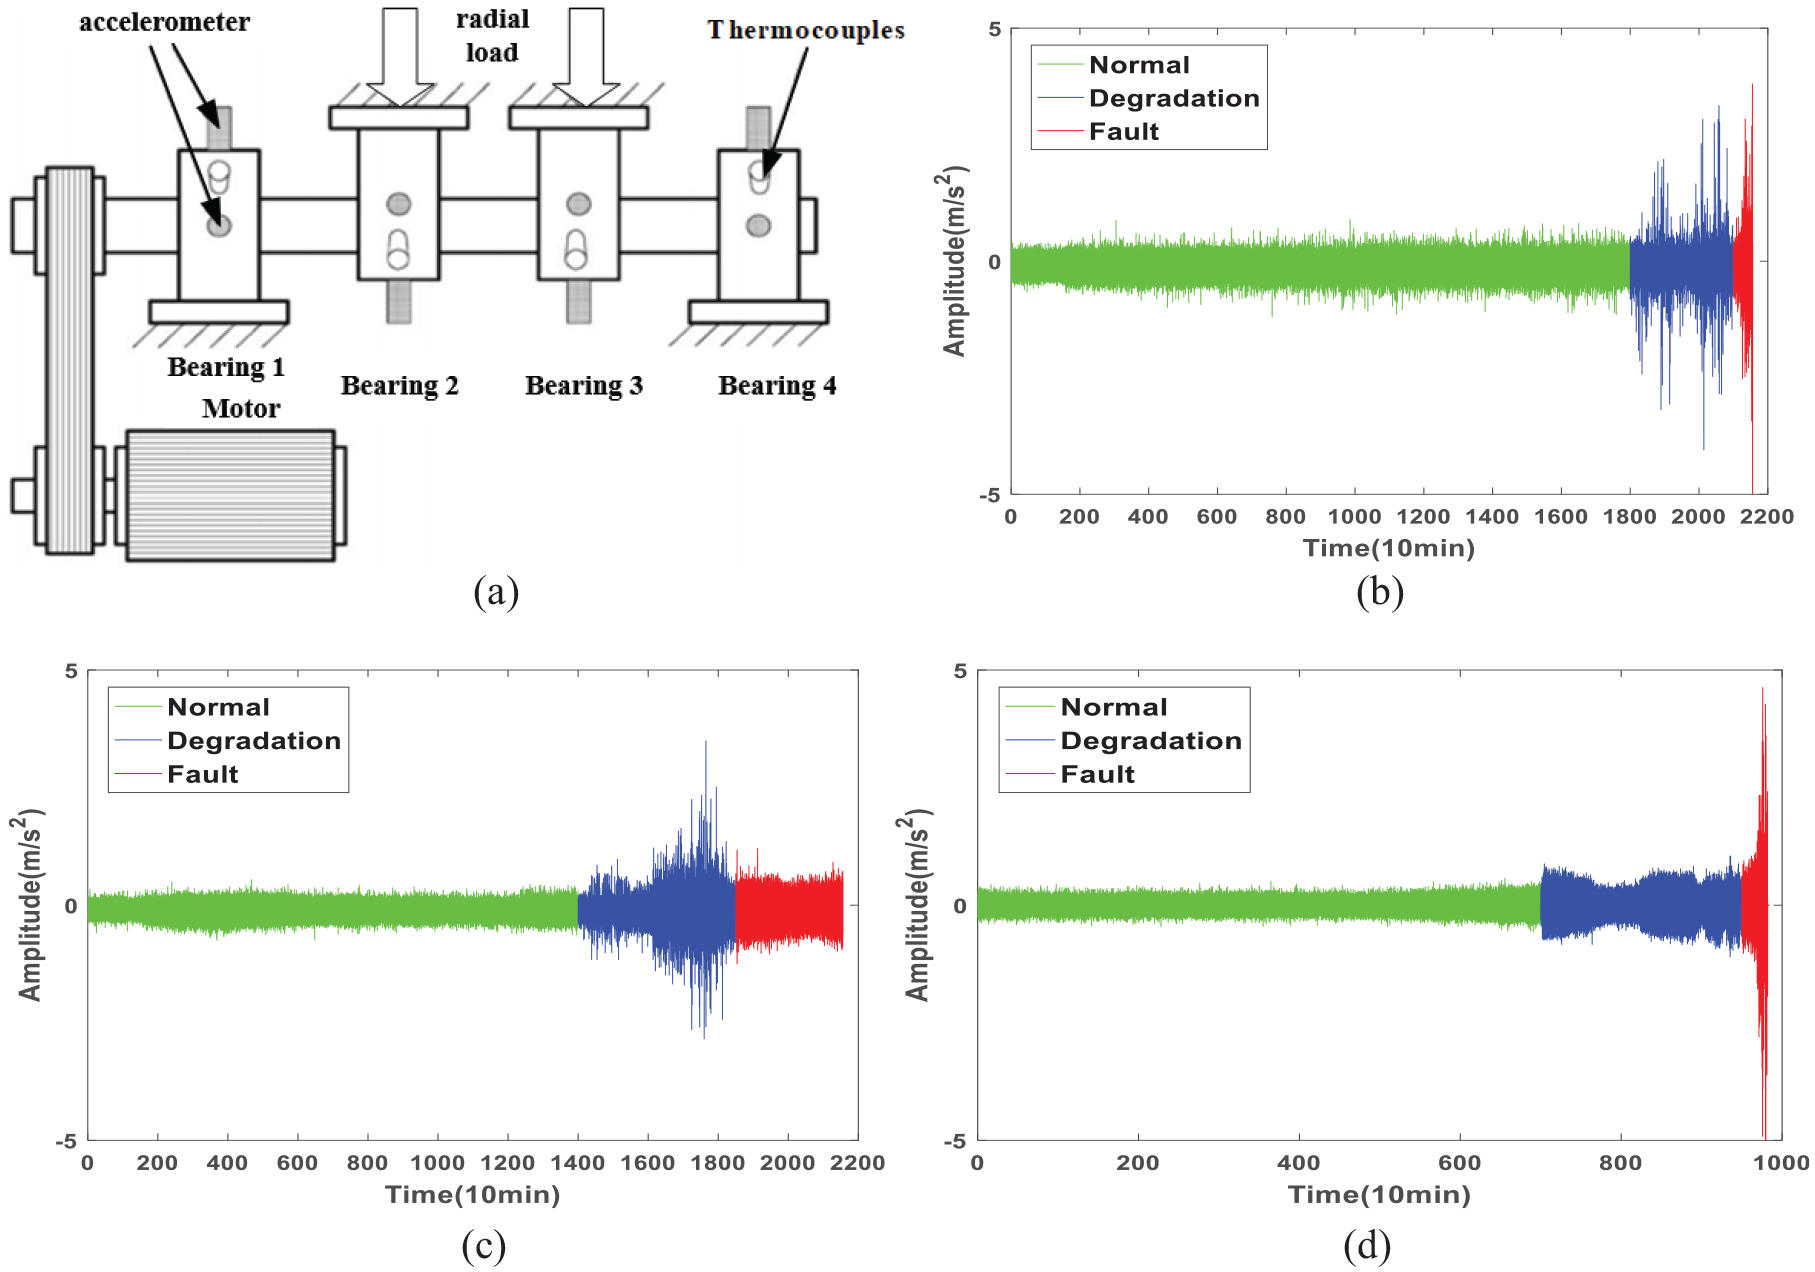
Bearing test device: (a) test rig, (b) acceleration signal of bearing 3, (c) acceleration signal of bearing 4, and (d) acceleration signal of bearing 1.
Data details.
Detection results with different classifiers
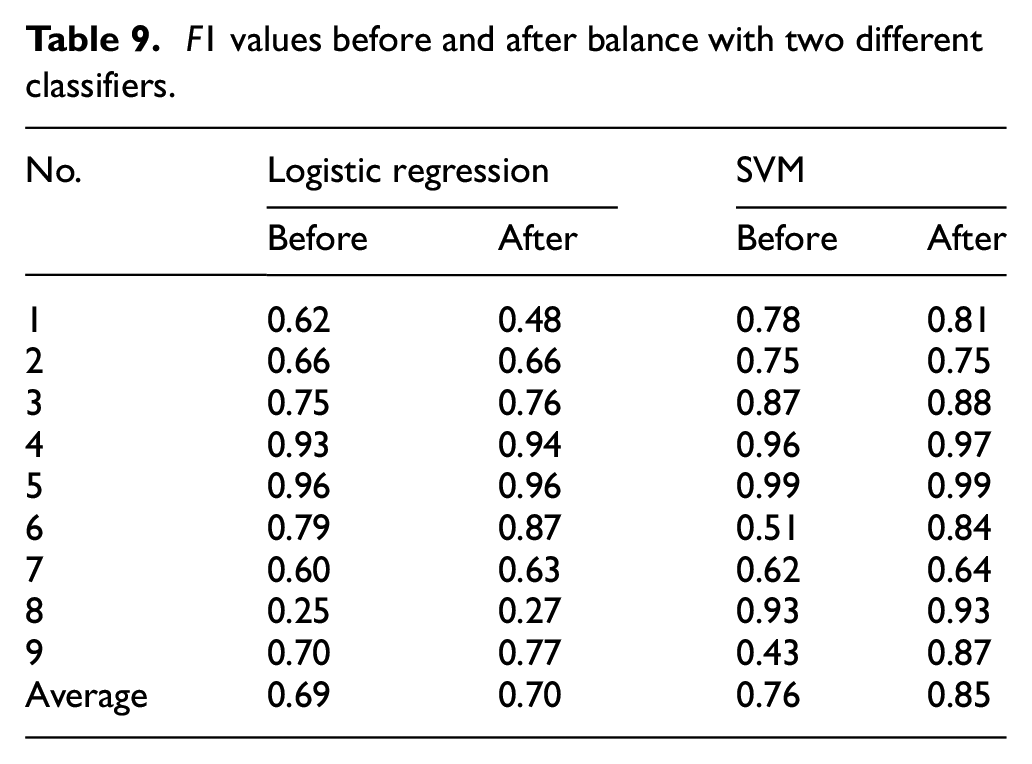
Experimental parameters are set as the values in Section 3.3 and normalization is performed using equation (20). The second and the sixth groups of data are selected. Objective function change curve during iteration process is visualized in Figure 9. It can be seen that after 10,000 iterations, both curves tend to be stable. The F1 values with two different classifiers are shown in Table 9. It is observed that with logistic regression classifier, there are six larger F1 scores after enhancement, two equal F1 scores and one smaller F1 scores. With SVM classifier, there are six larger F1 scores after enhancement and three equal results. The average F1 values increase from 0.69 to 0.70 and from 0.76 to 0.85 respectively. With logistic regression classifier, the average value does not increase significantly, because the first F1 score is much worse than that before enhancement. But the following four F1 scores show a significant improvement. In summary, F1 average value before enhancement is 0.725 (i.e. (0.69 + 0.76)/2) and F1 average is 0.775 (i.e. (0.70 + 0.85)/2) after enhancement. It indicates that Roundtrip method can improve detection rate of bearing faults and reduce possibility of misdetection while ensuring the overall recognition rate.
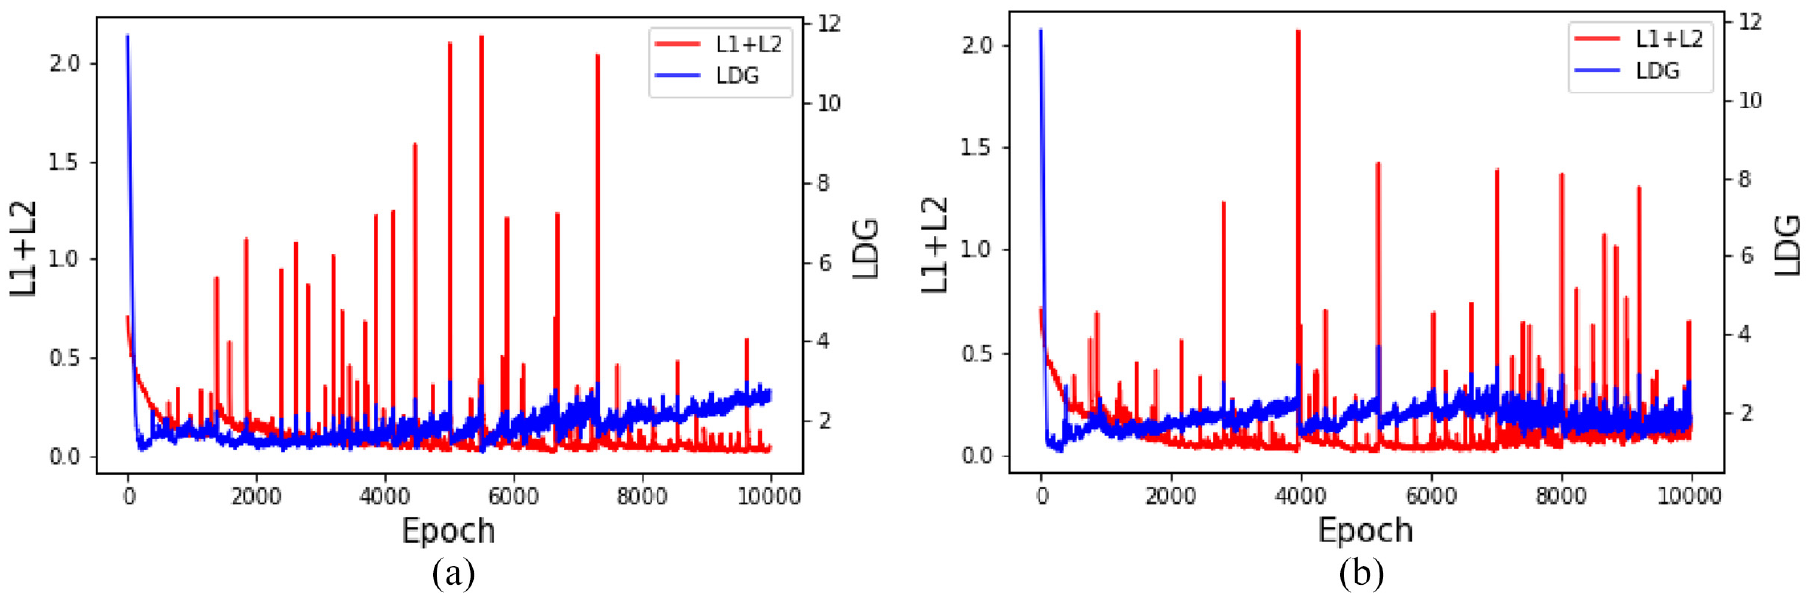
Iterative process curve: (a) Data 2 and (b) Data 6.
F1 values before and after balance with two different classifiers.
Comparison with other methods
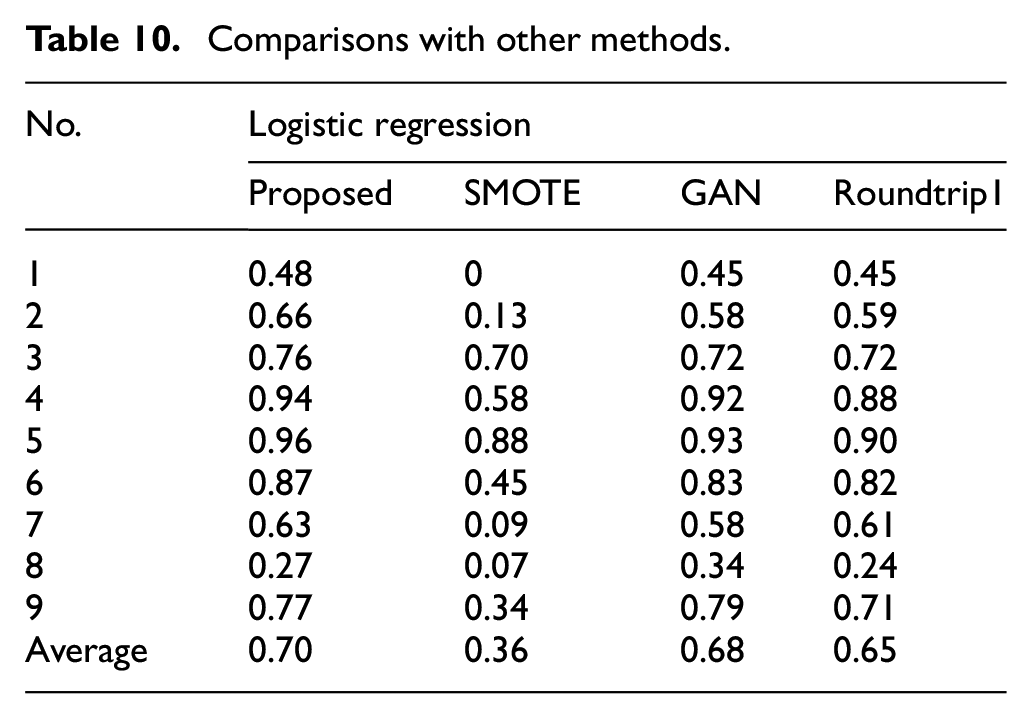
The proposed method is compared with three other methods, including SMOTE, GAN, Roundtrip1. Their parameters and structure are listed in Section 4.1.3. The results are listed in Table 10. The mean F1 score for the three comparison methods are respectively 0.36, 0.68, and 0.65. Overall, the proposed method is just slightly better than GAN, but obviously better than SMOTE and Roundtrip1. Obviously, SMOTE nearly fails because of its limitations. Although GAN has two higher F1 scores, but other 7 F1 scores are far worse than the proposed method. For Roundtrip1, the results clearly show the effectiveness of removing outlier samples. Overall, the proposed method is effective for improving fault detection rate while ensuring the overall recognition rate.
Comparisons with other methods.
Conclusion
Data-driven method is a hot topic in the field of mechanical fault detection. However, imbalanced samples bring a shifted decision boundary, resulting in misdetection. In this paper, we propose a fault detection method based on roundtrip probability estimation. By bidirectional mapping between latent variable space and sample space, we increase the amount of fault samples and reduce misdetections. The method is applied to 30 benchmark test sets and results show that classifier’s F1 value improves after roundtrip enhancement. The method is also applied to wind turbine blade cracking and NASA bearing fault detection. Results show that the roundtrip method can significantly improve recognition rate of fault states and reduce misdetections while ensuring the overall recognition rate.
In future work, we will focus on the generation of multi-class data for handling coupling imbalance. Meanwhile, we will focus on more different industrial applications.
Footnotes
Declaration of conflicting interests
The author(s) declared no potential conflicts of interest with respect to the research, authorship, and/or publication of this article.
Funding
The author(s) disclosed receipt of the following financial support for the research, authorship, and/or publication of this article: This work was supported by National Natural Science Foundation of China [Grant Numbers 52105536], Key Scientific and Technological Research Projects in Henan Province [Grant Number 212102210072], Guangdong Basic and Applied Basic Research Foundation [Grant Number 2022A1515140066], Key Research and Development Projects of Henan Province [Grant Number 221111240200], Open Project of Henan Key Laboratory of Intelligent Manufacturing of Mechanical Equipment, Zhengzhou University of Light Industry [Grant Number IM202309], Key Scientific Research Projects of Institutions of Higher Learning in Henan Province [Grant Number 22A460033].
Data availability statement
Data sharing not applicable to this article as no datasets were generated or analyzed during the current study.