
Abstract
The fixed green wave speed and staged statistical flow used in arterial signal coordination are not adaptable to the fluctuations in vehicle travel speed and traffic flow on roads, resulting in a mismatch between the signal scheme and the optimal green wave speed and traffic flow demand. This discrepancy negatively impacts the efficiency of intersection traffic. In traditional signal control systems, the cycle and green light timing are typically set independently. However, such a setting method poses problems in practical operation. In this paper, we combine vehicle arrival and vehicle location information, and consider the interaction of speed guidance and dynamic signal optimization to construct a model. This study is developed along the following steps: in the vehicle-road coordination environment, based on the MAXBAND model, a global coordination scheme is obtained, incorporating the speed guidance method; then, based on the vehicle saturation of the inlet lane of the arterial intersection, a multi-objective optimization model for arterial signal coordination under vehicle speed guidance is established based on global coordination with the maximum green wave bandwidth and the minimum delay of arterial vehicles, the minimum number of arterial stops and the minimum delay in the minor direction road as the optimization objectives. Based on global coordination, adopting an integrated control mechanism of cycle and green light timing allows for dynamic adjustments according to real-time traffic conditions. The improved multi-objective particle swarm algorithm is chosen to solve the model, and the simulation environment is built based on the COM interface of VISSIM software and C# platform. Three adjacent intersections of Ganjiang Middle Road in Nanchang are selected as case studies, and the methods in this paper are compared with the current timing scheme, the MAXBAND method and the optimization scheme under speed guidance only, respectively. The results show that the model proposed in this paper achieves significant optimization effects on the indicators of arterial delay, arterial stopping times and the delay of minor roads.
Keywords
Introduction
Arterial signal coordination control refers to the coordinated control of multiple adjacent intersections on the main road in order to achieve the effect of vehicles passing through the intersection without stopping as much as possible. However, the arrival of vehicles has a certain randomness, that is, the traffic flow does not arrive at the same rate in each signal cycle, and it is easy to have a situation where the green time is wasted on the arterial while vehicles are waiting in line in the minor road direction; as well as a situation where the green time is insufficient on the arterial, and there is a surplus of green time in the minor road direction.
At present, the methods of arterial signal coordination control are mainly traditional arterial coordination optimization methods based on historical traffic flow data. Zhang et al. 1 considered the effect of saturation on speed guidance and vehicle operation status, and established a vehicle-road cooperative signal control optimization method considering the loading degree condition by setting a prediction time window. Li et al. 2 considered the optimization of signal timing and phase difference and further transformed the signal optimization and coordination problem into a two-level signal control problem, thus proposing a prediction-based iterative solution to the two-level problem method. However, Abu-Lebdeh 3 pointed out that the volatility of vehicle speed, the uncertainty of vehicle arrival, and the randomness of initial queue length all have an impact on the coordination control in the passive optimization method.
Compared with fixed traffic signal control, inductive signal control is more adaptable to the volatility of traffic flow and more conducive to improving vehicle capacity. 4 Peng and Wang 5 developed an asymmetric arterial signal coordination control optimization model based on mixed integer linear programing and quadratic programing, which considered the traffic demand in both directions of the arterial and combined oversaturation control and green wave control strategies, thus optimizing the arterial capacity in the oversaturated direction and increases the green wave bandwidth in the unsaturated direction to solve the tidal traffic congestion problem. Oblakova et al. 6 considered two traffic control methods for fixed and semi-driven arterials in the traffic environment of two intersections, and the results showed that the semi-driven control can better reduce vehicle delays in the case of uneven traffic flow. Lu et al. 7 proposed an inductive coordinated control method with variable public cycle by optimizing the public cycle using rolling optimization for the coordinated signal control demand of unsaturated road sections, and the experiments showed that the method can adapt to fluctuating and changing traffic flow and effectively realize the linkage control of arterial intersections.
In addition, a number of researchers have also proposed a two-way interaction between vehicle operation and signal system. Long et al. 8 proposed a method of guiding vehicle speed by coordinated linkage control of arterial signals in a vehicle-road cooperative environment, and established an optimization model in which vehicle speed guidance and arterial green wave are integrated, and the results showed that vehicle speed guidance has significantly improved the traffic efficiency of arterials. Zhang et al. 9 considered the traffic flow into saturated and unsaturated cases, proposed a speed guidance model considering queuing and phase difference in a vehicle-road cooperative environment, and constructed a multi-objective optimization model for dual-cycle arterials under vehicle speed guidance. However, this method only performs signal optimization from two states, saturated and unsaturated, without real dynamic interaction. Wang et al. 10 combined the optimization of vehicle speed and signal timing and established a joint control model for the control of vehicle speed and trunk line signal coordination to maximize the capacity of the trunk line. Jiang et al. 11 optimized the vehicle speed guidance and signal control scheme in both directions, and proposed a new arterial traffic signal coordination control strategy with the optimization objective of reducing the number of vehicle delays and stops, which was optimally solved using the finite exhaustive method, and the validity and feasibility of the model were verified. Yi et al. 12 proposed an Occupancy-Based ASC control strategy and established a Maximum Likelihood Estimation (MLE) model to estimate vehicle arrivals, aiming to optimize signal timing and reduce total passenger delay in the low CV penetration environment.
Currently, reinforcement learning is widely used in various traffic control problems. Ibrokhimov et al. 13 propose an RL-based multi-intersection traffic light control model with a simple yet effective combination of state, reward, and action definitions, aiming to reduce the travel time of vehicles and increase overall throughput. However, this method evaluates the authenticity of RL-based methods using simulated traffic lights, not considering the complexity of real-world traffic situations. Jie et al. 14 proposed a multi-target reinforcement learning model (NACRL) for network-wide coordinated signal control, incorporating attention mechanisms into the critic network for dynamically capturing the spatio-temporal dependencies between intersections, tacking the challenges of multi-objective network-wide coordinated control. Although reinforcement learning has many potential advantages, it also has some drawbacks and challenges. Reinforcement learning is based on statistical methods to discover patterns, but its results lack provability and can be unpredictable in certain situations. As a result, it is not widely used in applications that require high reliability.
Summarizing the existing literature, it is found that although there are also studies on the optimization of vehicle-signal interaction considering factors such as signals, speed guidance, and intersection operation status, these studies still suffer from shortcomings such as changing only the green light duration, single vehicle operation status, and only considering the optimization of mainline flow coordination. As a result, these approaches are unable to fully adapt to the complex traffic flow conditions and diverse needs. Mengyun et al. 15 proposed a deep-learning based Signal-control Refined Dynamic Traffic Graph (ScR-DTG) Model, which creatively constructs an adjacent graph with dynamic order for more accurately capturing the ever-changing spatial relevancies. To address the shortcomings of existing research, this paper establishes a multi-objective vehicle-road cooperative control model based on the arrival rate of vehicles in each flow direction at intersections, and integrates signal timing and speed guidance parameters to improve the passing capacity of vehicles at arterial intersections. This method of coordinated control of vehicle speed guidance and signal timing can improve the effectiveness of coordinated control of arterials under vehicle-roadway cooperation and will further extend the adaptability and stability under different traffic environments.
Problem description and model assumptions
Problem description
Coordinated control with fixed green wave speed and speed guidance can maximize the efficiency of vehicles passing through intersections and effectively extend the arterial green wave bandwidth under a fixed coordinated signal. However, road traffic flow is always dynamically changing. When the vehicle arrival rate at an arterial junction in the direction of the arterial flow is large, and saturation is high at a certain time, the arterial operating speed will be reduced, and speed steerable conditions will deteriorate. When the mainline vehicle arrival rate is low, this, in turn, may lead to under-utilization of green time in the mainline direction and additional delays in the slip road direction. If, on the basis of arterial coordination and speed steerability, the green signal ratio of the signal is controlled so that the main road inlet loading level is at around 0.8, while considering that delays in the minor road direction are not excessive, the time and space resources of the junction can be further exploited dynamically on the basis of arterial coordination to improve the efficiency of arterial coordination control.
Based on the above ideas, the research in this paper can be divided into three steps: firstly, the signal timing of several adjacent intersections on the arterial is coordinated and controlled in a vehicle-road cooperative environment; secondly, the speed of vehicles entering the coordinated intersection is guided so that as many vehicles as possible pass the stop line during the green light period; at the same time, the traffic flow arrival situation at each inlet of the intersection is detected in real time, and when the saturation level of the main road inlet is greater (or less) than the threshold, then the green time of the current phase is adjusted to adjust the capacity of the main road inlet while ensuring that the signal cycle remains unchanged, so that the load level in the direction of the main road is always in the best condition. The ideas in this paper are shown in Figure 1.
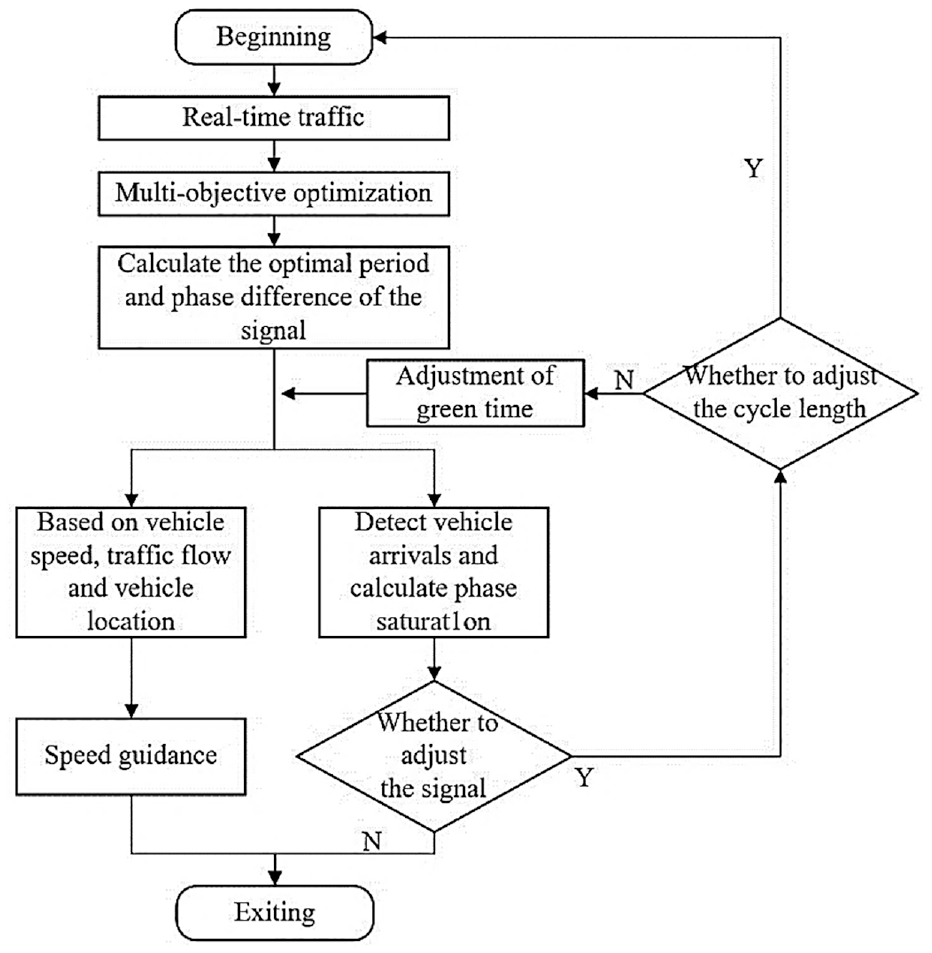
Flow chart of the research.
Model assumptions
To simplify the problem, this study is based on the following assumptions:
CAV refers to vehicles that have both connectivity and autonomous driving capabilities. Communication delays between on-board devices and roadside devices in the CAV are negligible.
All vehicles will drive normally through the signalized intersection according to the speed guidance policy provided by the system.
Speed guidance beyond two cycles is not considered, that is, vehicles are induced to cross the intersection on the current cycle or the next cycle after speed guidance.
Interference from bus stops, non-motorized vehicles and pedestrians are not considered for the time being.
The phase combination scheme for intersections along the route has been determined.
Optimization method for coordinated control of arteria signals
Area division
At signalized intersections, CAV make different decisions about whether they can cross the intersection at their current speed, resulting in an unstable traffic flow condition. In order to improve the efficiency of the intersection, vehicles in the inlet lane are chosen to be guided so that they can pass through the intersection in a queue at the target speed to make the most of the green light time. In order to be able to eliminate the interference of lane changing behavior on queue control and to better realize the process of speed guidance, the upstream section approaching the intersection is divided into buffer and platoon control area in order from near to far, as shown in Figure 2.
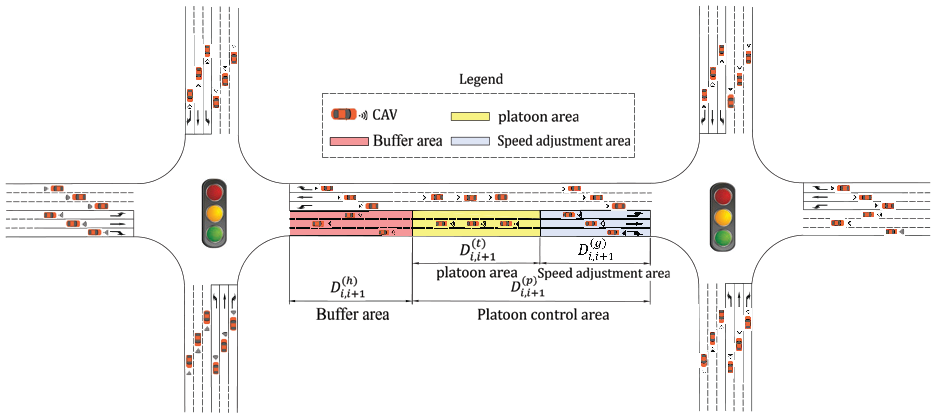
Schematic diagram of area division.
Buffer area
As shown in Figure 2, we define the length of buffer area is
Platoon area
In the platoon area, the vehicle will receive control information on the vehicle queuing situation and speed guidance at the downstream intersection. The vehicles are free to move from the previous intersection to the platoon area, where they are formed according to the different turns and controlled in real time as a convoy. The platoon area can be further divided into the queuing area
In the queuing area, vehicles in close proximity to each other in the same lane can be formed into a queue by using the headway time distance as a judgment condition, and the remaining time of the signal phase can be combined to constrain the length of the convoy to ensure that vehicles in the same convoy can cross the signal intersection under the same guidance strategy.
Once the queue is complete, the vehicle will enter the speed adjustment area, and the driver will control the vehicle through the intersection in real time according to the speed guidance strategy. The length of the speed adjustment area is such that the vehicle has sufficient time to adjust its speed at any feasible speed.
Green wave bandwidth model
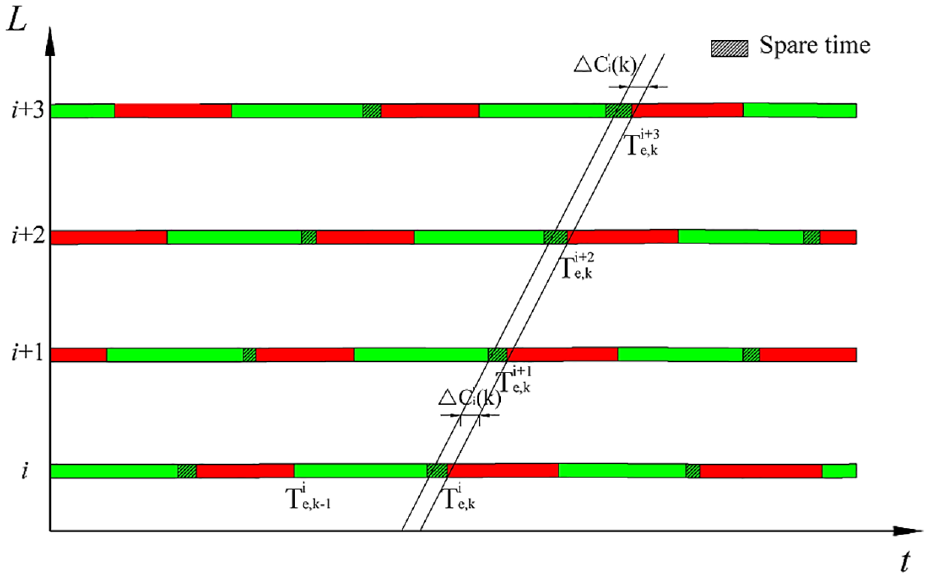
Select n intersections on the arterial road, numbered 1,2, …, i, i + 1, … n. Assume that the direction from i to i + 1 is the upward direction, and the opposite direction from i + 1 to i is the downward direction, and the common period is taken as C. Arbitrarily select two adjacent intersections i and intersection i + 1 as an example, the Space-time diagram of green wave coordinated is shown in Figure 3.
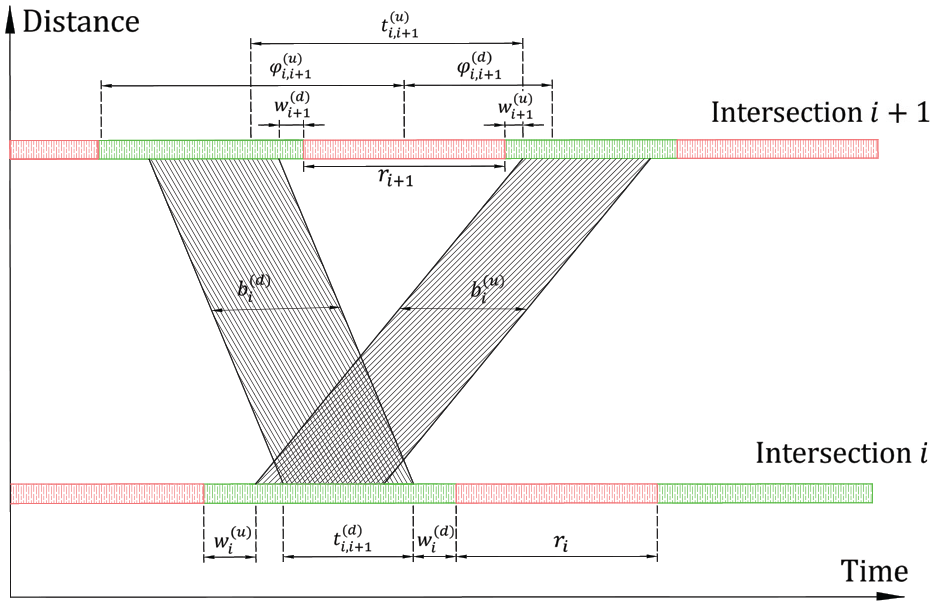
Space-time diagram of green wave coordinated control.
In Figure 3:
In this paper, the phase difference is defined in terms of the midpoint of the red light and the constraint is shown in equations (1), (2), and (3):
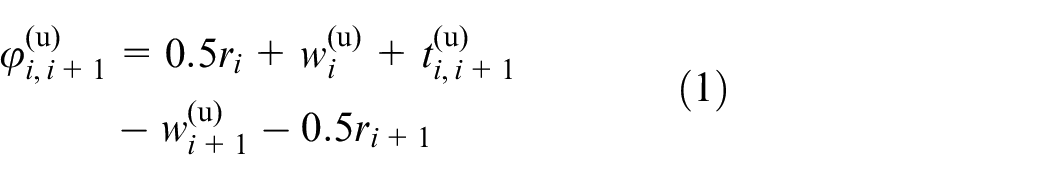
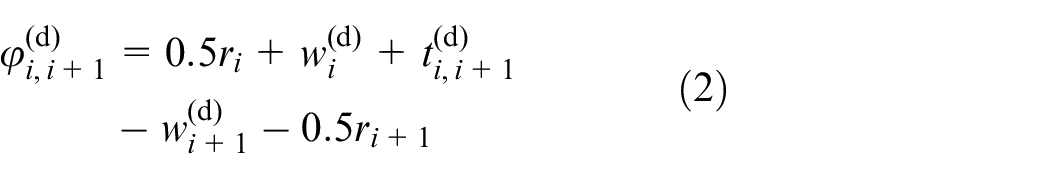
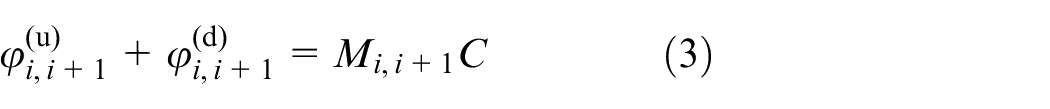
where
As seen in Figure 3, the time interval between the green band boundary and the red light boundary of the previous cycle is


where
The queue clearing time involved in the above relationship consists of two components: (i) the time it takes for the start wave to pass from the stop line to the point of maximum queue length, and (ii) the time it takes for vehicles at the point of maximum queue length to cross the intersection. This is expressed as:


where
Delay model
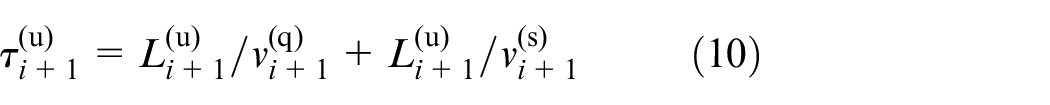
In speed guidance, vehicle trip delay is defined as the difference between the actual time it takes for a vehicle to pass through a section of road and the time it would take to travel at free-flowing speeds. Specifically, this delay metric reflects the additional time vehicles experience due to traffic congestion or other limiting conditions. For this study, delay is simply defined as the sum of the difference in time between the target vehicle speed under the speed guidance strategy and the time for each vehicle crossing the intersection at free-flowing speeds for a given detection time and length of the delay detection zone (greater than the length of the speed adjustment area), denoted by
In equation (12),
Stopped times model
The average number of stops is an important indicator for assessing the effectiveness of the current signal control. It provides crucial information about traffic flow and the level of congestion experienced by vehicles. The number of stops is the number of times a vehicle has to stop while crossing an intersection due to the influence of the signal or the operating status of the vehicle in front of it. The average number of stops generated by a vehicle during the detection time1 refers to the model in HCM (2010). 17
Multi-objective function
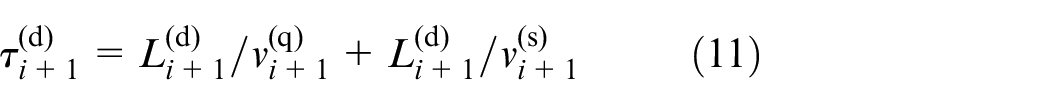
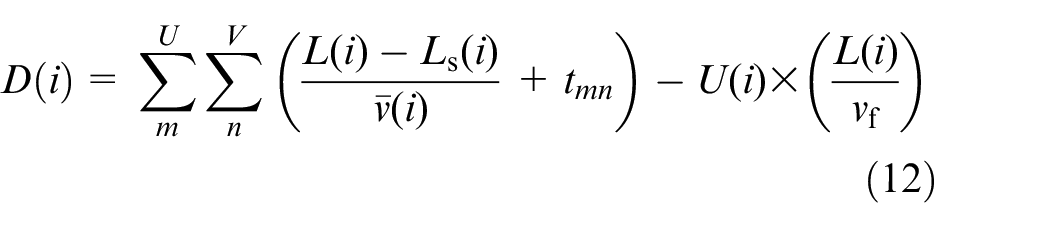
In this paper, the optimization objective function is chosen to maximize the actual green wave bandwidth, minimize the total delay in the arterial coordination direction, minimize the number of stops and minimize the total delay in the minor direction road at the intersection. The decision variables are phase difference, green light time and signal cycle. The optimization model constructed is shown in equation (13).
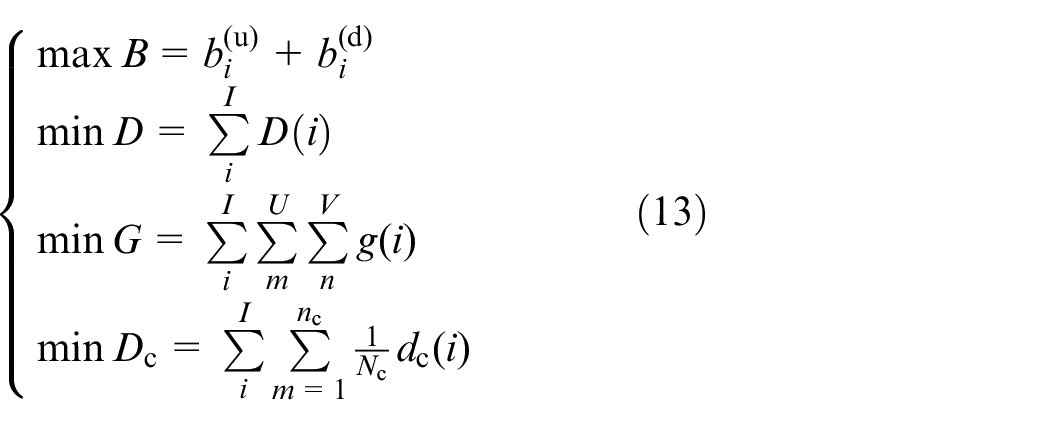
In equation (13),
Joint speed-guided and signal control model
The process of the joint speed guidance and signal control model includes both speed guidance and optimization of the signal cycle and timing, as shown in Figure 4.
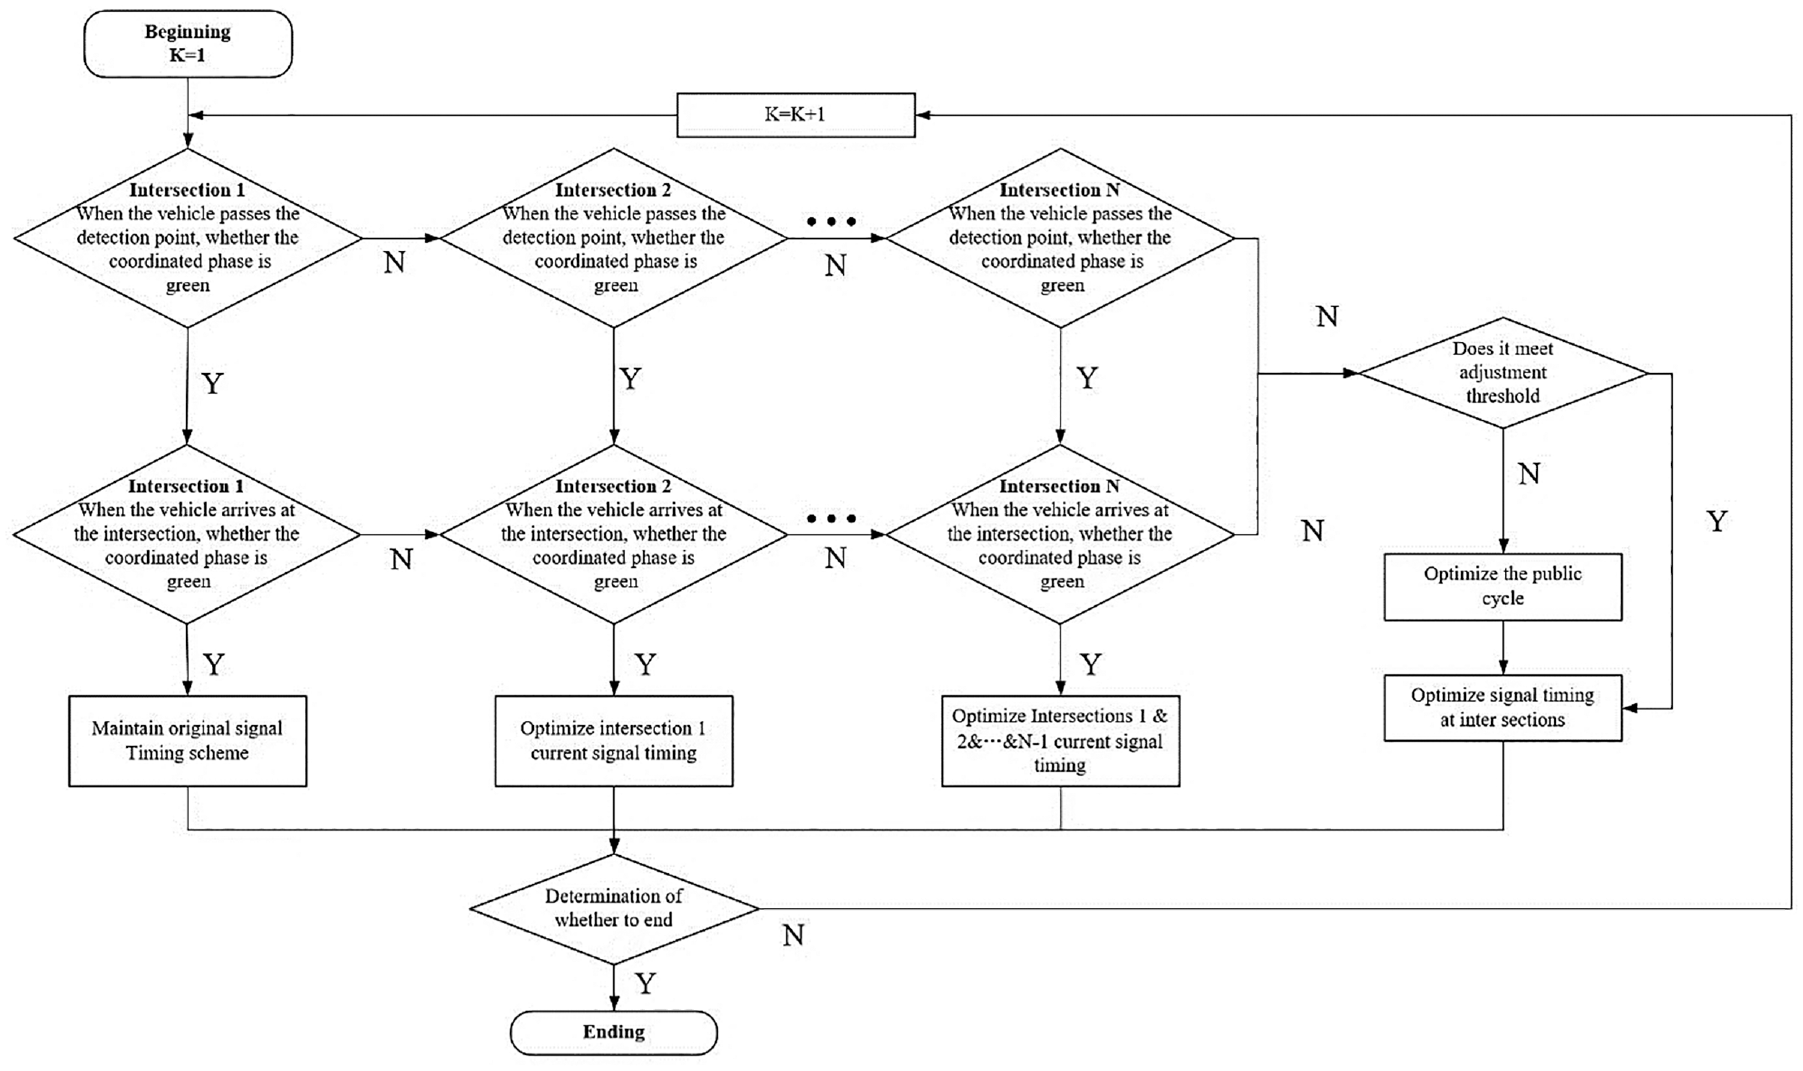
Flow chart for signal cycle and timing optimization.
In this paper, the speed guidance model is based on the literature, 18 using an improved full velocity different (FVD) tracking model. This speed-guided model identifies the convoy and calculates the optimum speed for each vehicle in the convoy and can be divided into three modes: mode 1 (vehicles can accelerate through without stopping), mode 2 (vehicles can slow down through without stopping), and mode 3 (induced slowing down and stopping with minimum vehicle stopping time). The identification of convoys, which can be formed into groups by the headway between adjacent vehicles, is intended to ensure guidance in convoy form. Signal cycles and timing are optimized to ensure that convoys can cross the intersection with minimum waiting times.
Speed guidance mode 1
In the speed adjustment area, when the lead vehicle is traveling at the current speed, it will not catch up with the rear of the queue and will pass through the intersection without difficulty. In order to increase the passing rate of vehicles at the intersection, the target speed of the lead vehicle is set to
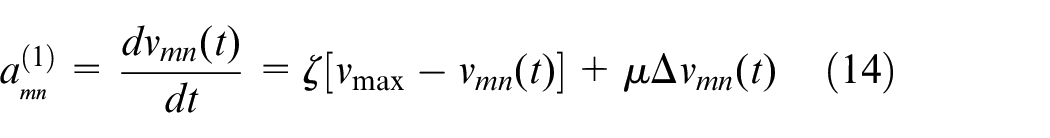
In equation (14),
Therefore, the optimal acceleration of the following vehicle is calculated in equation (15):
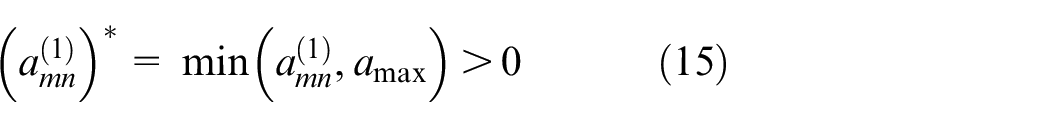
Speed guidance mode 2
If the vehicle cannot be guided through the intersection using the acceleration strategy, it can be guided by the deceleration strategy to wait for the next green light to pass. So that the speed of the lead vehicle arriving at the intersection stop line just as the light turns green is
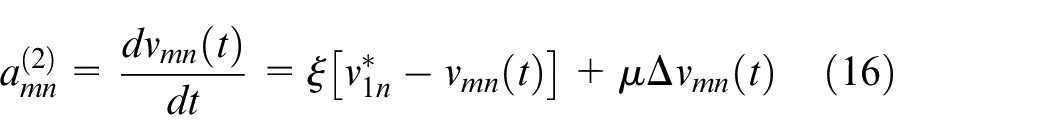
Therefore, the optimal deceleration speed of the following vehicle is described in equation (17):
Speed guidance mode 3
Regardless of acceleration or deceleration, the lead vehicle has no chance of avoiding stopping in front of the intersection, and the convoy is guided to slow down smoothly to a stop in order to prevent an emergency vehicle braking situation. In this case, the optimal deceleration speed of the lead vehicle is calculated in equation (18):
Therefore, The following vehicle’s following deceleration is calculated in equations (19) and (20):
where
Dynamic signal adjustment
The number of vehicle stopping situations within the non-green wave bandwidth is often one of the key factors affecting the effectiveness of arterial signal coordination control, which is usually achieved by optimizing the coordinated phase green time and guiding vehicles through the intersection stop line at the coordinated phase green time to achieve the control objective.
In view of the fact that continuous traffic arriving at the intersection is blocked by the limitation of the green time of the signal phase, thus reducing the efficiency of the intersection, the signal cycle and timing are optimally adjusted to improve the green light utilization of the phase. Based on the information obtained in real time on the traffic flow in the inlet lane and the vehicles queuing downstream of the intersection, the public cycle of the coordinated intersection is firstly judged to be in need of adjustment; secondly, with the signal cycle determined, in order to ensure that there is no impact on the linkage of the intersection in the minor direction road when adjusting the green time of the coordinated phase, an optimization scheme is implemented for the green time of the first phase after the signal optimization calculation, which requires the first phase to be The adjusted green light duration is adjusted back in the remaining three phases. The optimization flow chart is shown in Figure 4.
A few short-term traffic fluctuations often occur during the coordinated control of the trunk lines that have an impact on the trunk line system. If only a few of these intersections are adjusted periodically in the system, there may be some loss of green wave bandwidth in the arterial system. Therefore, the public cycle of the coordinated intersections should be adjusted when the same situation occurs at all of the arterial coordinated intersections (e.g. an increase in queuing traffic or an idle green light at the coordinated phase).
Since the adjustment of the public cycle scheme in the arterial coordination system affects the efficiency of the non-coordinated phase vehicles, it is not possible to apply a direct cycle extension or shortening strategy. Based on the literature, 7 the following section describes both the public cycle extension strategy and the public cycle shortening strategy.
Public Cycle Extension Strategy
When the coordinated phase at each intersection has stalled vehicles in multiple cycles, the additional required stalled vehicle dissipation time that occurs during the cycle time is used as the additional time required to extend the cycle within a single interval of the coordinated phase, as shown in the equation (21). In the case of multiple consecutive cycles requiring adjustment, the signal adjustment of adjacent cycles is combined and further optimized by taking the average cycle extension time of intersection i over z cycles as the unit of adjustment, calculated as in equation (22):

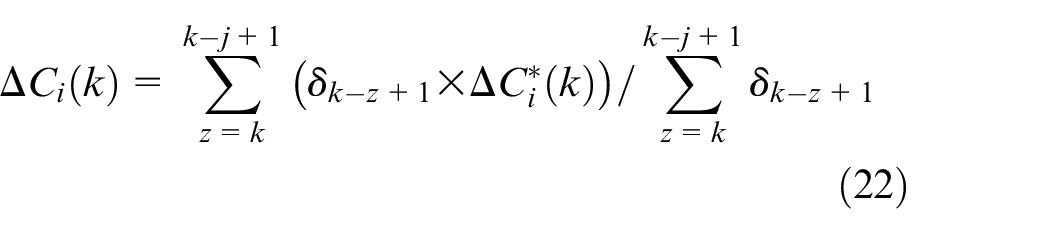
In equations (21) and (22),
To ensure the coordination of the adjusted arterial intersections, the cycle durations of the coordinated intersections must be agreed within two cycle intervals, regardless of the length of the green light extension for each phase. In addition, to ensure the efficiency of the non-coordinated phases, the adjusted public cycle duration needs to satisfy the maximum constraint, that is, the extended public cycle duration satisfies equation (23):

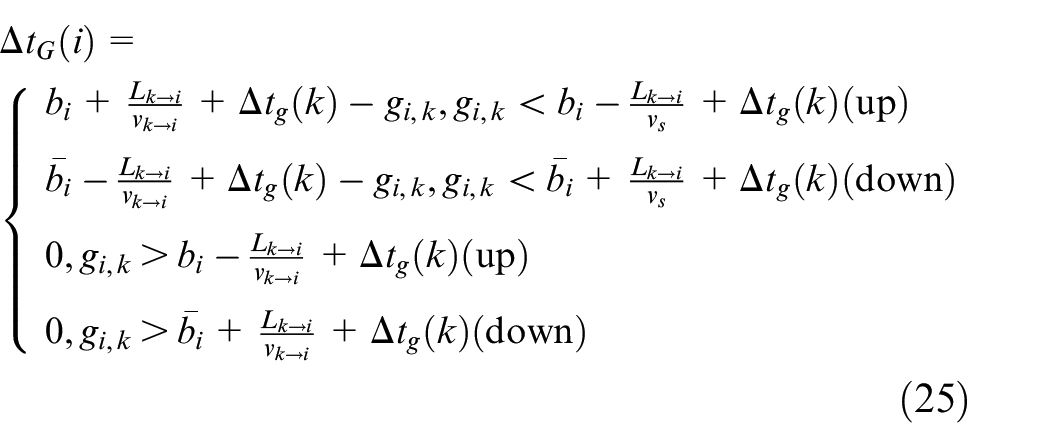
When the adjustment of the public cycle duration is calculated, the corresponding green light duration and phase difference will also have a certain impact. Therefore, further adjustments need to be made, and the adjustment process is shown in Figure 5, equations (24) and (25).

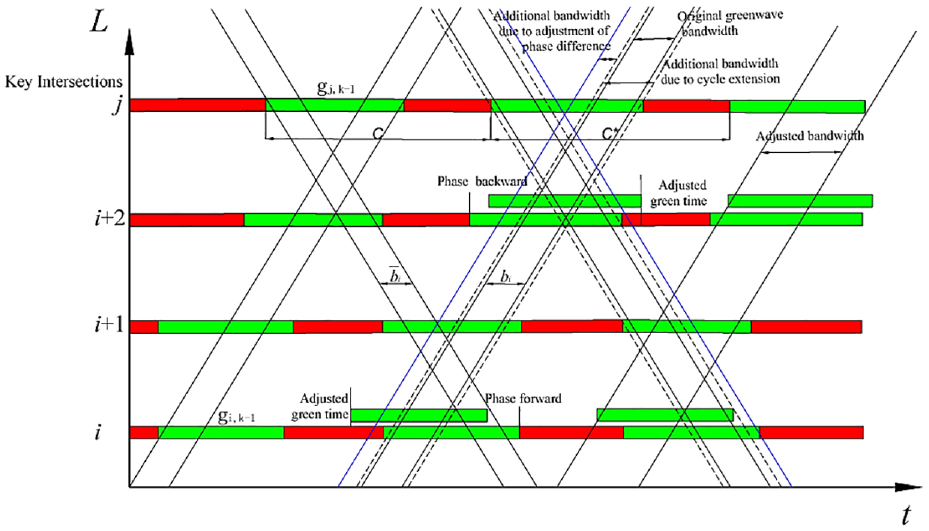
Schematic diagram of the public cycle extension strategy.
In equations (24) and (25),
Public cycle shortening strategy
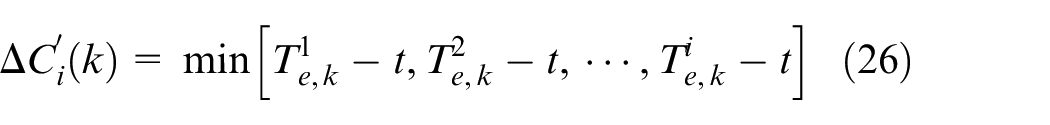
When the overall reduction in the traffic flow of the arterials at each intersection occurs, in order to avoid a mismatch between the green light duration and the traffic flow in the coordination direction, which in turn reduces the capacity of the intersection, when the remaining time of the green light is detected at the coordination intersection in multiple cycles, the intersection public cycle is shortened and adjusted. The adjustment schematic is shown in Figure 6, and its public cycle shortening duration in a single cycle is calculated as in equation (26), and it needs to satisfy the minimum constraint, as in equation (27).

Schematic diagram of the public cycle shortening strategy.
Signal timing optimization strategy
After the adjustment of the public cycle, the signal timing needs to be further optimized. The public cycle adjustment time is first allocated to each phase in proportion to the original timing scheme. Then, the efficiency of the signal-controlled intersection is used as the target for adjustment, and the signal is fed back to the signal control system through real-time vehicle detection, thus achieving the purpose of dynamic signal adjustment. The level of service at signal-controlled intersections is usually evaluated in terms of saturation. Phase saturation is, therefore, used as an indicator of green light adjustment time. The phase saturation is calculated in equation (28):
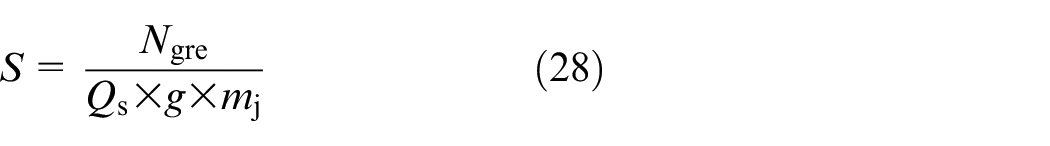
where
The basic idea of signal optimization based on critical flow loading is to detect the number of vehicles arriving at the inlet lane of the main road with a known number of queuing vehicles at the intersection and calculate the phase saturation under the current guidance strategy and signal scheme. The saturation level is used as a measure of the level of service at signal-controlled intersections. Through signal adjustment, the mainstream direction load degree is controlled at the optimal level
Therefore, the corresponding coordinated phase green light duration is calculated in equations (29) and (30):
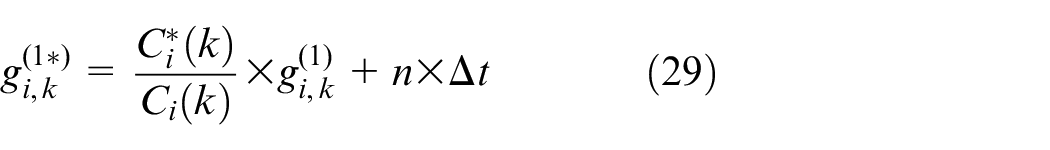
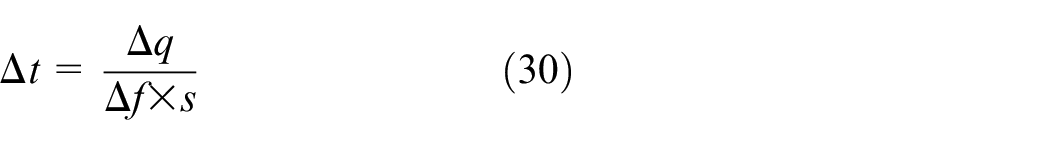
where
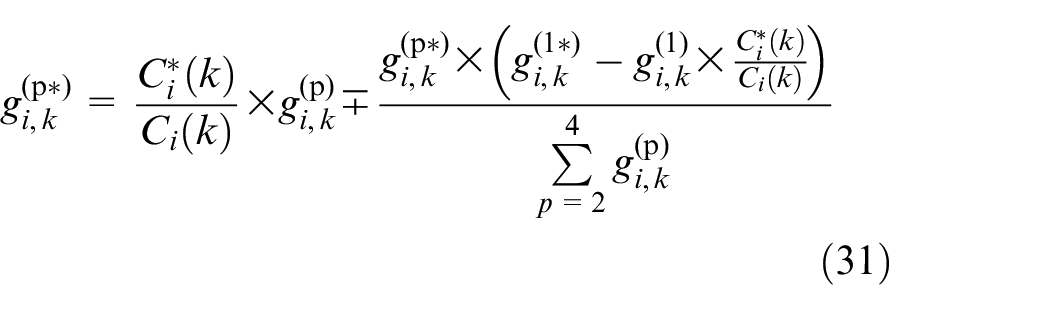
where
Pareto MO-PSO multi-objective particle swarm algorithm
The particle swarm algorithm (PSO) is a classical intelligent algorithm with the advantages of fast search speed, high efficiency, and simple processing. The multi-objective particle swarm algorithm (MOPSO) is a particle swarm algorithm to solve the optimal search principle to add the idea of non-dominated sorting, and the common idea is to combine the Pareto queuing mechanism and particle swarm algorithm through the dominance of the relationship between the particles to determine the optimal solution.
Pareto optimal solution
In a multi-objective optimization problem, the Pareto optimal solution is only a feasible solution to the optimization problem. Generally, there are multiple optimal solutions that form the Pareto optimal solution set, and the region formed by the value of the objective function corresponding to these solutions is the Pareto optimal frontier.
In the Pareto multi-objective particle swarm algorithm solution process, a new particle elimination criterion 19 is used to compare the Pareto dominance relation with the density distance, and to select the individual historical optimal position and the global optimal position using a tournament selection strategy, so as to enhance the algorithm’s optimization seeking capability. The comparison process is as follows:
Step 1: By sorting the particles according to the different dominance relationships of particle fitness, the Pareto fronts with different ordinal numbers can be obtained, with particles with small ordinal numbers dominating particles with large ordinal values, and the Pareto optimal fronts being the objective function values with ordinal number 1.
Step 2: The density distance of each particle position with the serial number 1 at the first front end of Pareto is compared, and the particle with the greater density distance value is preferred, and its corresponding signal timing scheme is the globally optimal position in this iteration. If the current fitness function value dominates the current global optimal position, the global optimal position is updated; if the current iteration number is greater than 2, it is combined with the global optimal position from each previous iteration to form a new non-inferior solution set, and the dominated particle position is removed.
The final set of non-inferior solutions is obtained by iterating until the model accuracy or the number of iterations is reached, from which the solution corresponding to the optimal total vehicle delay is selected as the optimal solution.
Solving steps
Step 1: Initialization. The variables such as particle position, maximum particle velocity, learning factor, and inertia weight are initialized, and m particles are randomly generated.
Step 2: Constraint processing. If the constraint is not satisfied, go to step 3; otherwise, go to step 4.
Step 3: The value of this variable is adjusted to the range corresponding to the constraint by the formula
Step 4: The number of iterations
Step 5: Let
Step 6: Calculate the adaptation values for the green wave bandwidth, total vehicle delay, and average number of vehicle stops targets.
Step 7: When the current position of the particle is due to the individual historical optimal position p, the new particle position is used to replace p; the signal matching time corresponding to the optimal particle is selected as the global optimal position in this iteration based on the density distance, and if the fitness value of the global optimal position is the current optimal at this time, then the global optimal position Gbest is updated and merged with the global optimal position of each previous iteration to form a new non-inferior solution set, thus removing the dominated particle position from the solution set.
Step 8: Repeat the iterations until the algorithm reaches the maximum number of iterations or the precision of the particles reaches the pre-set requirements.
Step 9:The dominance value of each solution in the non-inferior solution set is calculated, and the algorithm ends with the output of the adaptation value (evaluation index value) corresponding to the Pareto solution with the largest dominance value and the timing scheme of each signal.
Simulation and analysis
Simulation scenes
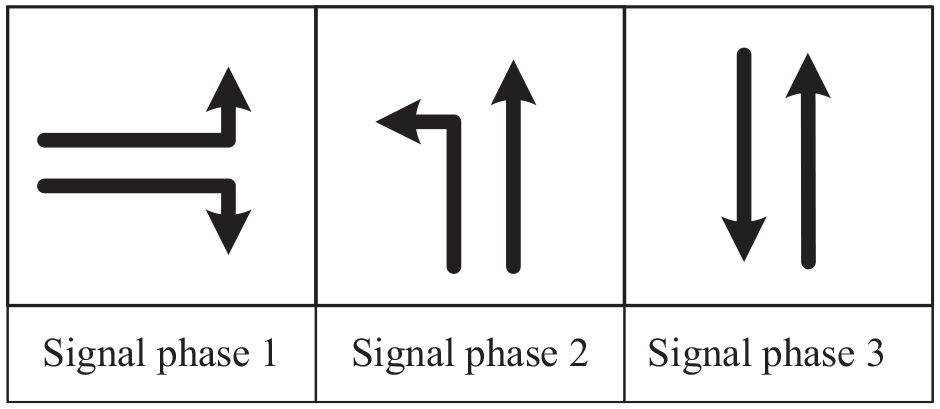
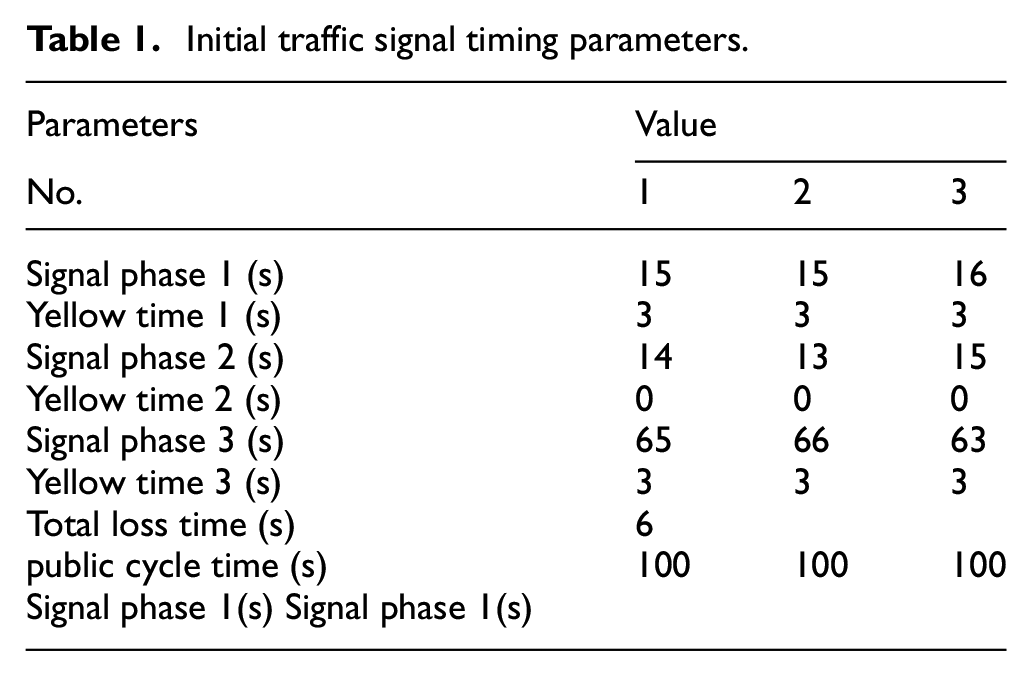
To verify the effectiveness of the model, the performance of the proposed joint control model is tested in VISSIM/C# simulation in this paper. The real-life scenario is an arterial road with three adjacent intersections in Nanchang, Jiangxi, China. Real traffic data collected from this arterial is used to calibrate the VISSIM parameters. All intersections along the arterial are T-shaped intersections, and the spacing between adjacent intersections is 485 and 460 m. The arterial is a six-lane road in both directions with a central divider and a machine-off green barrier. The layout of the intersections is shown in Figure 7, and the signal phasing is shown in Figure 8. The signal timing scheme for each intersection is shown in Table 1.
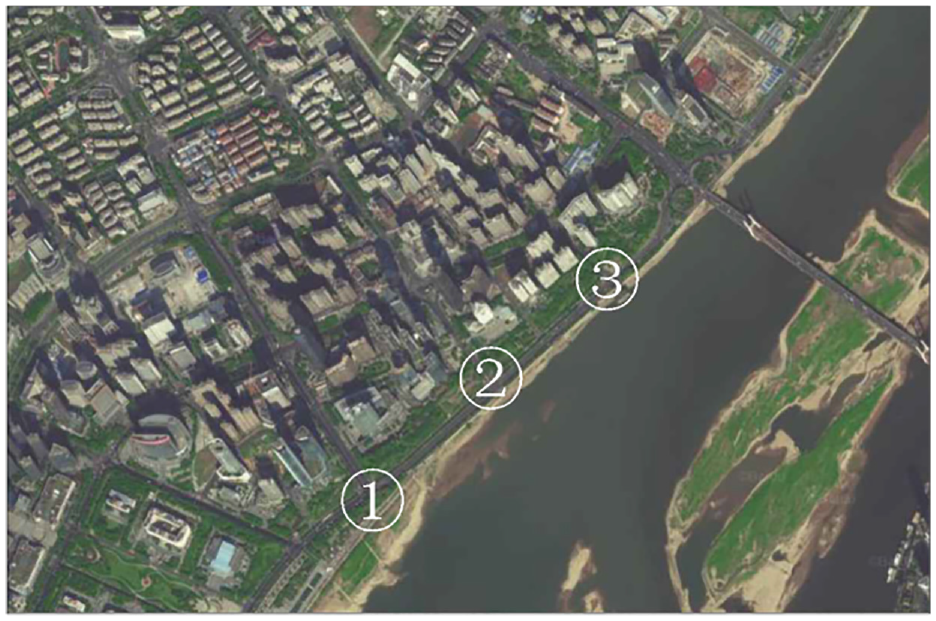
Simulated scenario: Nanchang, Jiangxi, China.
Intersection signal timing scheme.
Initial traffic signal timing parameters.
In order to verify the feasibility of the joint speed guidance and signal control model, we chose the status quo scenario, the classical MAXBAND scenario and the speed guidance only scenario as reference results for the simulation, speed guidance only scenario reference. 13
Speed guidance scheme and the optimization model in this paper: set the length of the speed adjustment area to 100 m, the length of the queuing area to 50 m based on the traffic flow. The maximum speed of vehicle guidance is set to 17 m/s, the minimum speed is set to 2 m/s, the transmission speed of the initiation wave is set to 4.8 m/s, the maximum acceleration is set to 2.5 m/s2, and the maximum deceleration is set to -2.5m/s2. The saturation flow rate is 1650 pcu/h in the straight lane and 1550 pcu/h in other inlet lanes. The standard headway time distance is 2 s, and the driver reaction time is 1.5 s. The loading degree threshold
The simulation parameters are set for the VISSIM software: the simulation period is 4500 s. Considering the instability at the beginning of the simulation, the first 900 s is set as the simulation warm-up period, and the remaining 3600 s simulation time is used for experimental analysis.
Solution
The maximum and minimum values of the cycle time are 140 and 80 s, respectively, and the shortest green time is 18s, where the green interval is 3 s. The maximum number of iterations of the Pareto-based multi-objective particle swarm algorithm
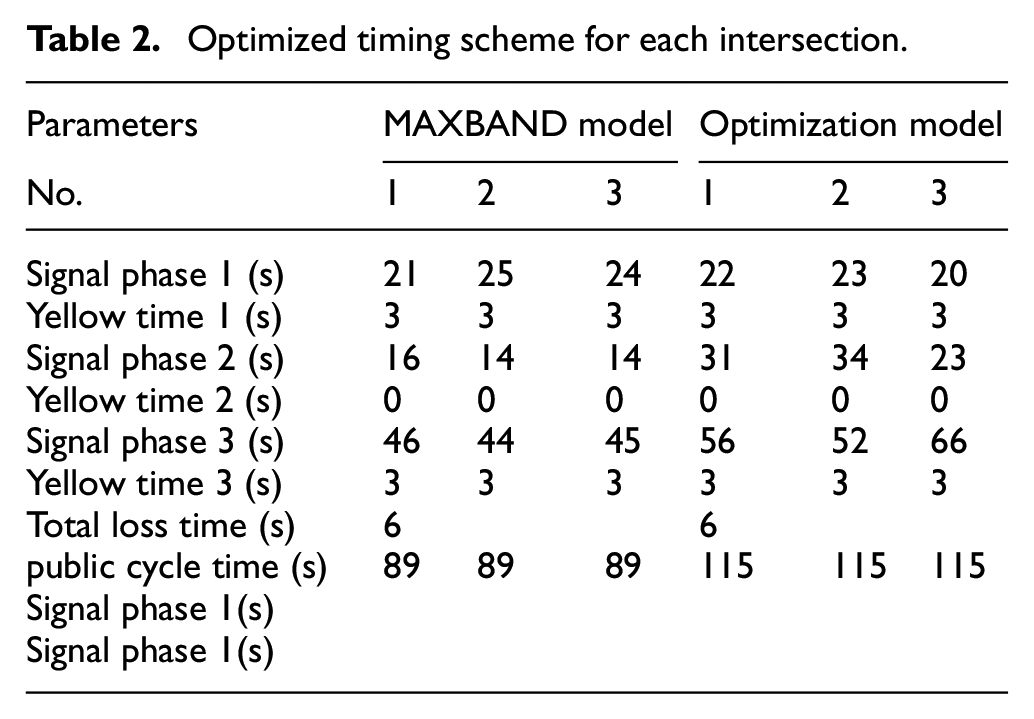
Optimized timing scheme for each intersection.
Model validation
In order to test the overall effect of the optimization scheme, the average journey time, the average delay of trunk line vehicles, the average number of stops on the trunk line and the average delay of vehicles in the minor direction road were used as evaluation indicators for the simulation results.
Identification results of the first vehicle in the fleet
A detector is set at the starting point of the queuing area to collect the headway of passing vehicles. Automatically identify the first vehicle ID of the fleet according to the judgment conditions of vehicle formation identification. The identification results are shown in Table 3.
Identification results of the first vehicle in the fleet(partial).
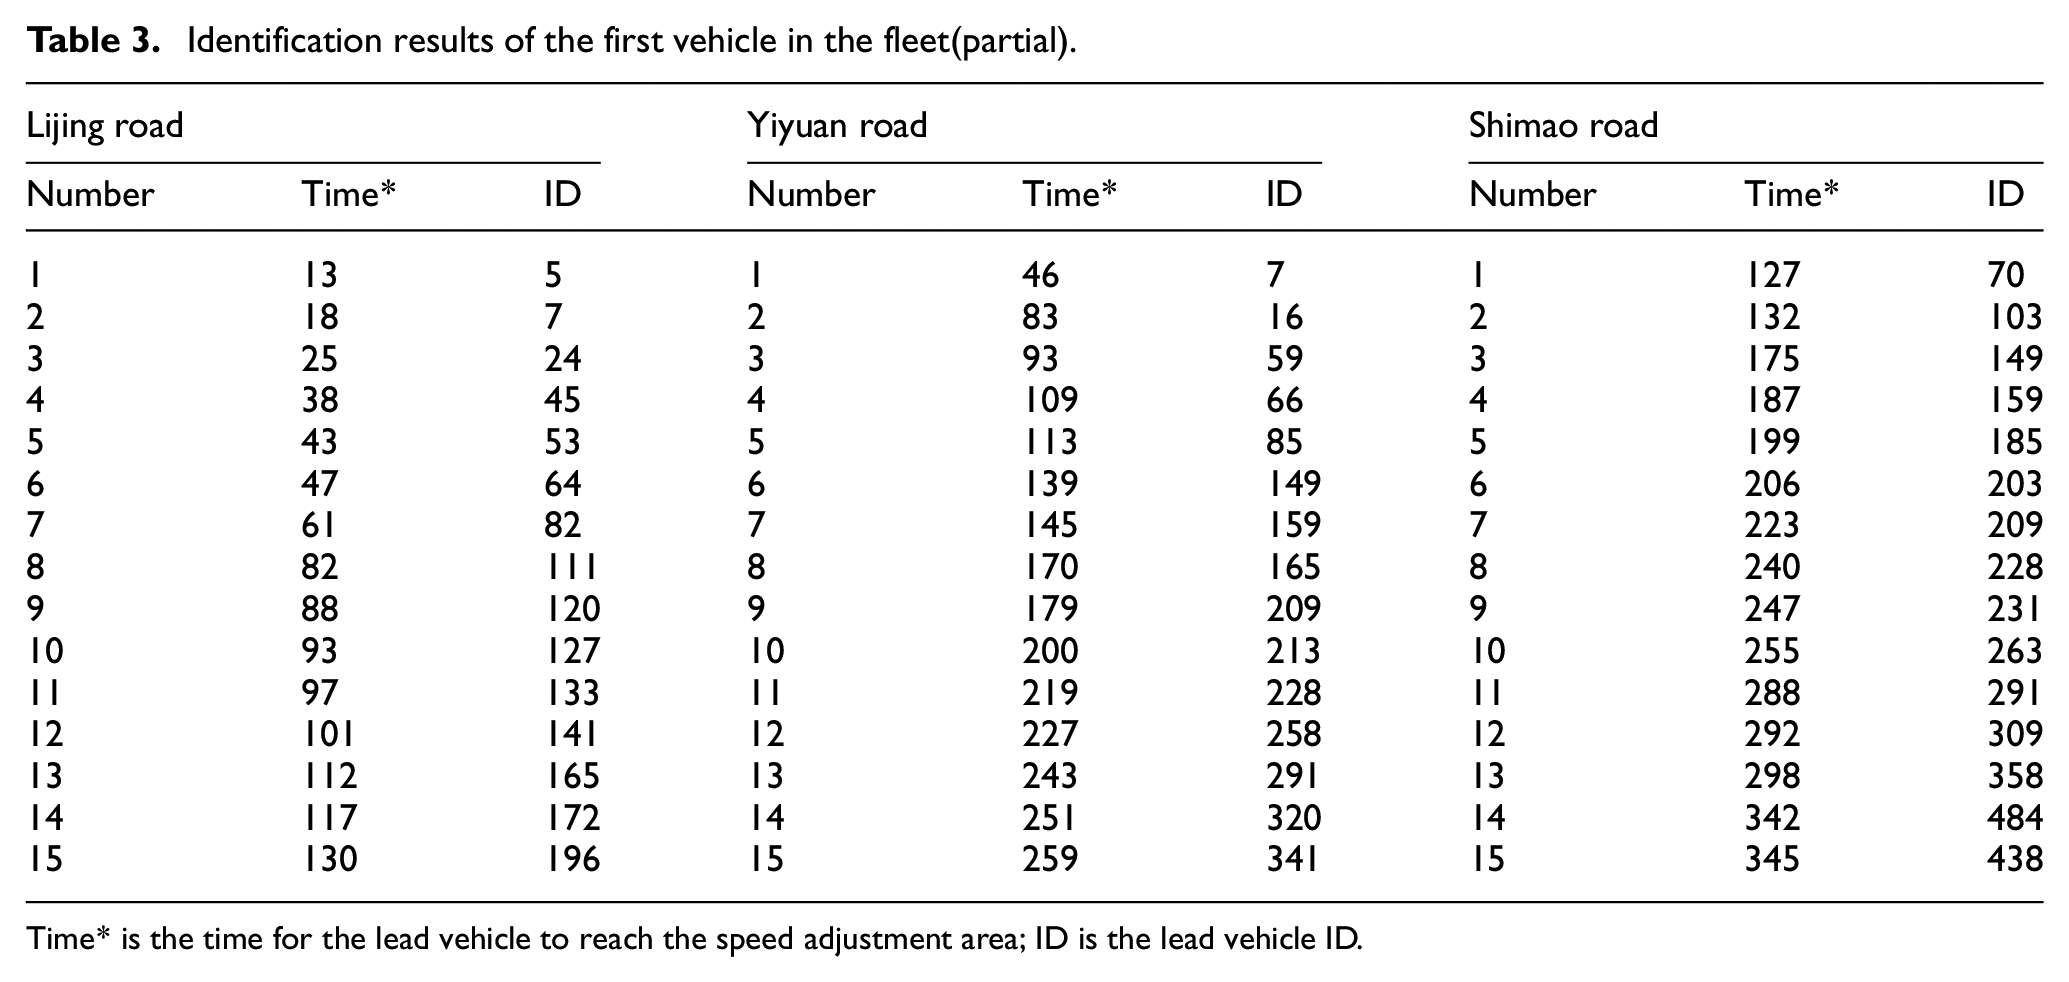
Time* is the time for the lead vehicle to reach the speed adjustment area; ID is the lead vehicle ID.
Optimization index analysis
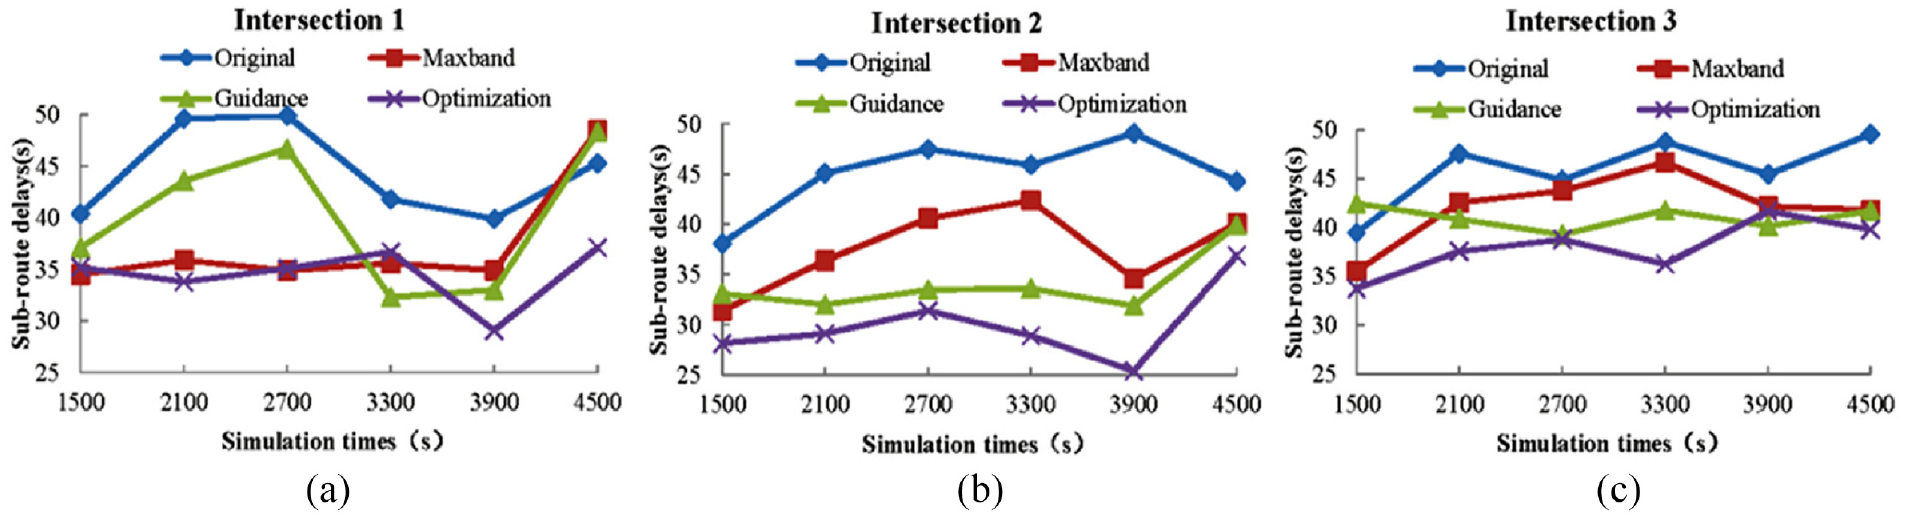
The evaluation results reflect the average delay for vehicles on the arterial through the intersection, the number of stops, and the average delay for vehicles in the minor direction road of the intersection. From Figure 9, it can be observed that Intersection 1 and Intersection 2 exhibit similar trends in terms of vehicle delay, reaching peak values at around 3300 s. On the other hand, Intersection 3 shows a similar trend at around 2100 s. The traffic flow at intersections is obtained from actual collected data, and the flow is subject to fluctuations. Therefore, during the simulation process, the corresponding delay situations will also be inconsistent due to the fluctuating traffic flow.
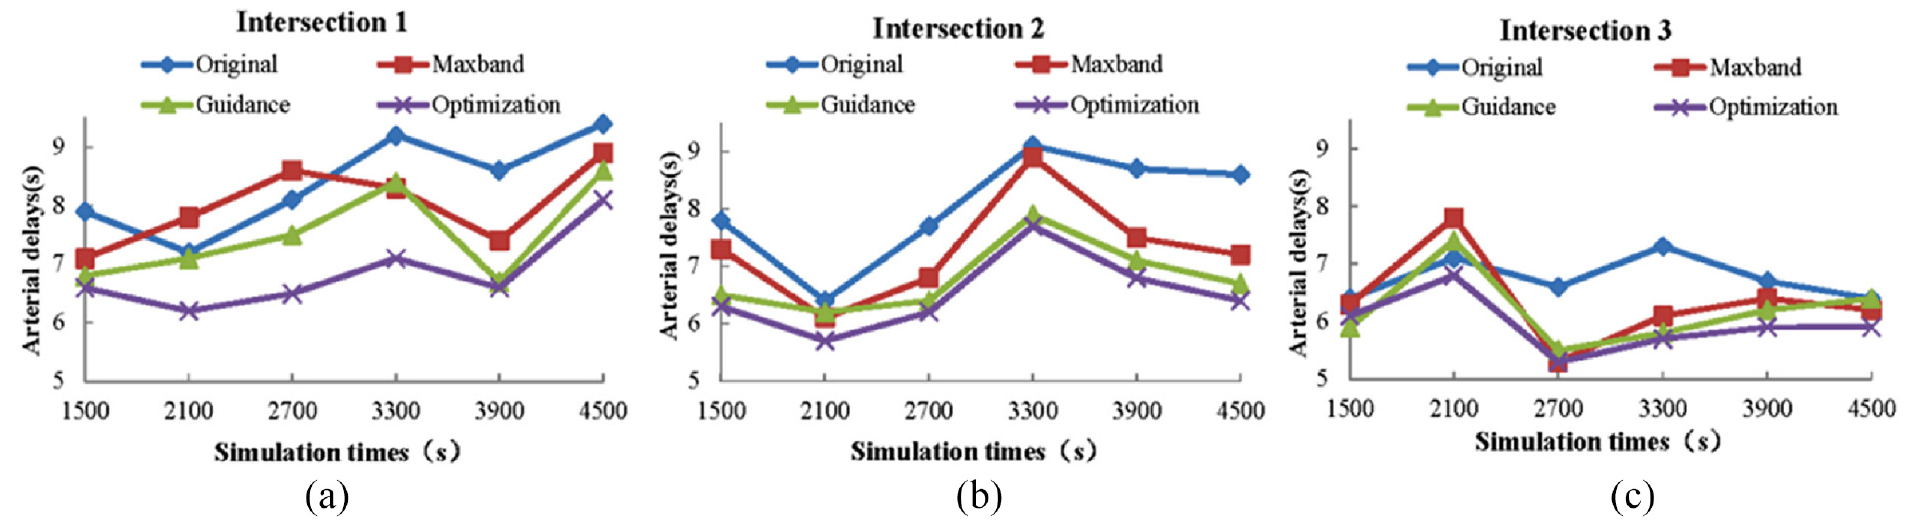
Arterial delay of intersections: (a) Intersection 1, (b) Intersection 2, and (c) Intersection 3.
Figures 9 to 11 illustrate the average delay and number of stops for vehicles on the arterial and the average delay for vehicles in the minor direction road for each scenario. It can be seen that the average delay of vehicles on the arterials, the number of stops and the average delay of vehicles in the minor direction road can be significantly reduced under the coordinated optimal control of the arterials in this paper, and the number of vehicles that can pass through the intersection without stopping becomes more. Therefore, the joint speed-guided and signal control model in this paper can lead to some improvement in the utilization of green light time on urban roads. The green wave time distance diagram obtained from the optimization experiment is shown in Figure 12. Table 4 shows the final evaluation metrics for the combined speed-guided and signal control model.
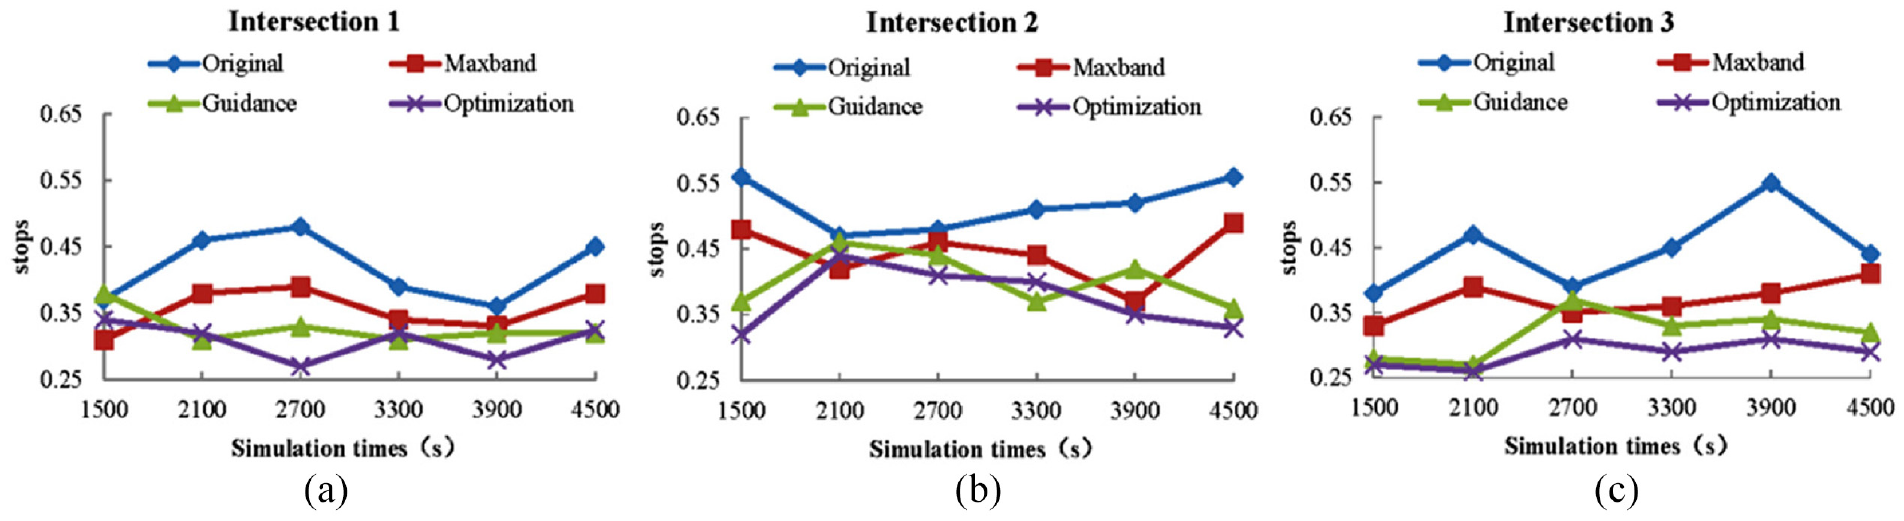
Stops of intersections: (a) Intersection 1, (b) Intersection 2, and (c) Intersection 3.
The minor direction road delay of intersections: (a) Intersection 1, (b) Intersection 2, and (c) Intersection 3.
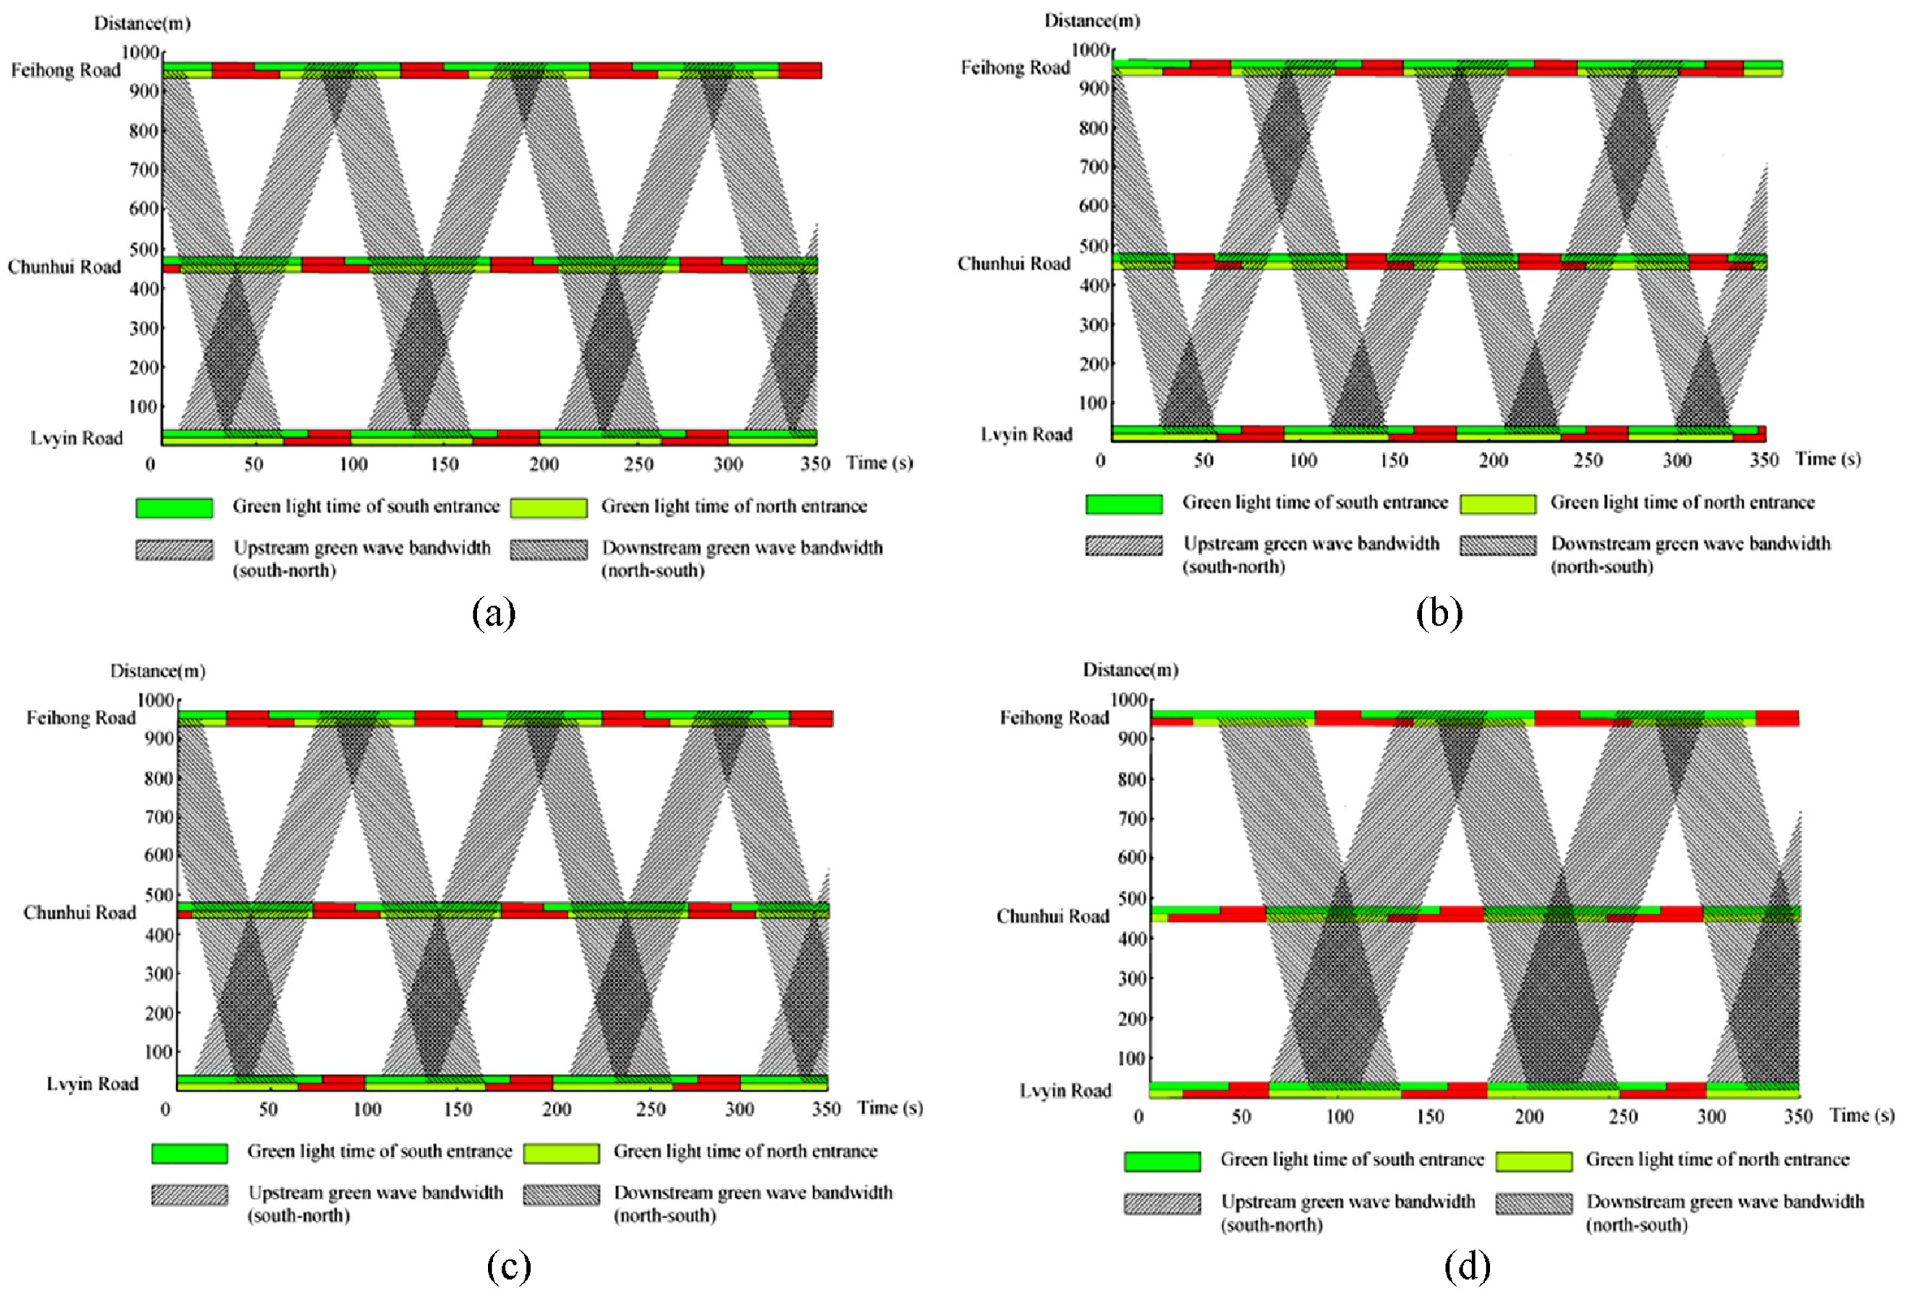
The green wave space-time diagram calculated for each program: (a) Current program, (b) MAXBAND program, (c) speed guidance program, and (d) optimized program.
Comparison of simulation results.
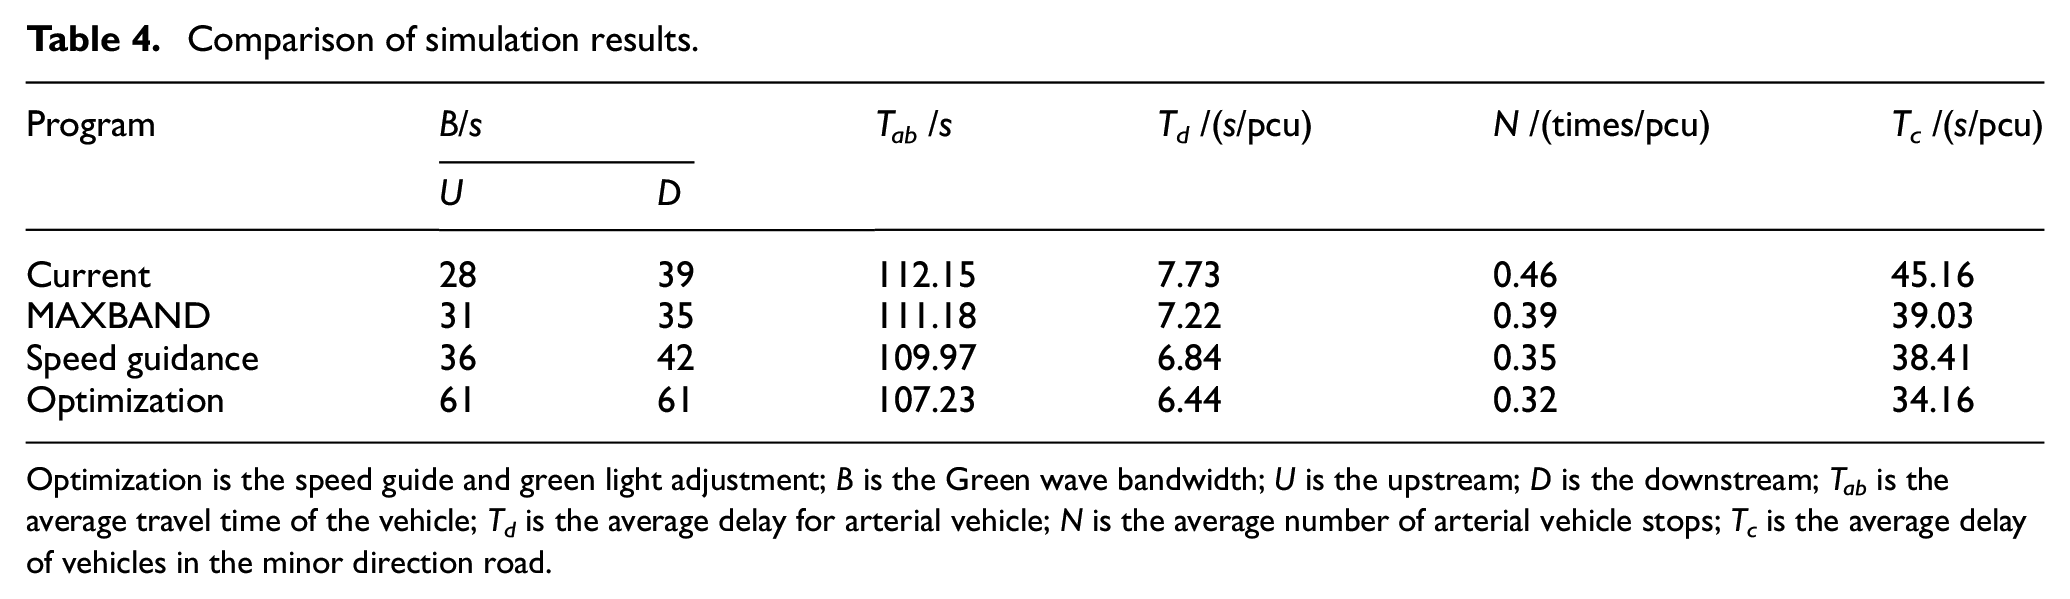
Optimization is the speed guide and green light adjustment; B is the Green wave bandwidth; U is the upstream; D is the downstream; Tab is the average travel time of the vehicle; Td is the average delay for arterial vehicle; N is the average number of arterial vehicle stops; Tc is the average delay of vehicles in the minor direction road.
From Figure 12, it can be seen that the proposed scheme is better than the other schemes, and the green wave bandwidth in the trunk direction is increased compared with the current scheme, and the bi-directional bandwidth optimization in this scheme is more significant. Among them, the optimization of green wave bandwidth in the upstream direction is more, while the optimization of green wave bandwidth in the downstream direction is less.
Based on the data in Table 5, we are able to conclude accordingly: in the optimized model of this paper, vehicles can reduce the queuing time at the intersection and, at the same time, avoid frequent start-stop and deceleration of vehicles in front of the stop line, so the average journey time, the average delay of arterial vehicles, the number of arterial stops and the average delay of vehicles in the minor direction road are all improved. Compared to the current scheme, the average journey time is reduced by 4.4%, the average trunk line delay by 16.7%, the average trunk line stop by 29.6% and the average minor direction road delay by 24.4%.
Comparison of the optimization results.
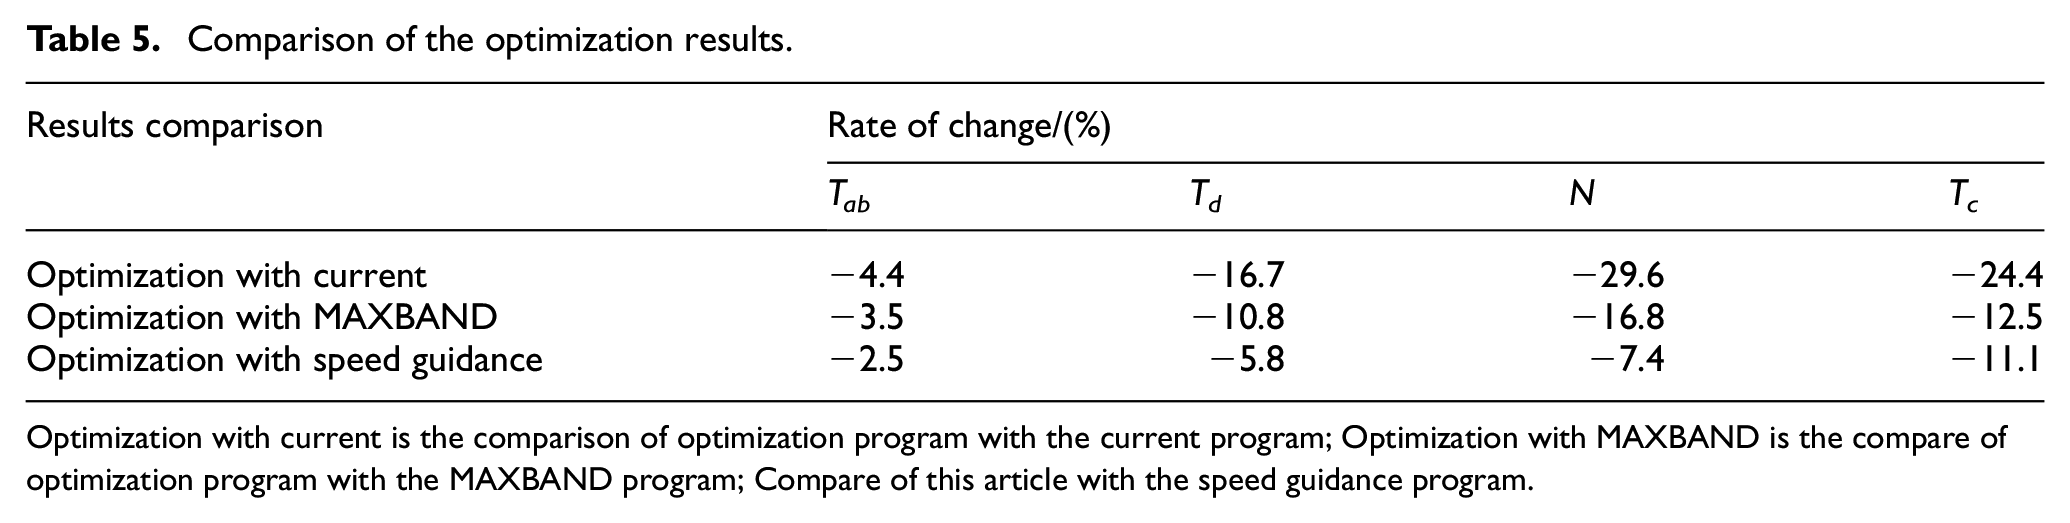
Optimization with current is the comparison of optimization program with the current program; Optimization with MAXBAND is the compare of optimization program with the MAXBAND program; Compare of this article with the speed guidance program.
Compared to the MAXBAND scenario, the average journey time is reduced by 3.5%, the average mainline delay is reduced by 10.8%, the average mainline stop is reduced by 16.8%, and the average delay in the minor direction road is reduced by 12.5%. The model studied in this paper is a modification and enhancement of the existing Maxband framework. Firstly, a relatively basic scheme was optimized based on traffic flow, primarily utilizing the Maxband model. Subsequently, real-time traffic flow was monitored through the COM interface, and an optimization model was employed to calculate the required extension or reduction in time. The computed time values were then transmitted to VISSIM via the COM interface, where they were executed in the relevant processes.
Compared to the speed-only scenario, the average journey time is reduced by 2.5%, the average mainline delay is reduced by 5.8%, the average mainline stop is reduced by 7.4%, and the average minor direction road delay is reduced by 11.1%.
According to the results, it can be seen that although the optimization model in this paper has limited delay reduction in the arterial direction, the delay reduction in the minor direction road is larger. Therefore, it can be shown that the model constructed in this paper can effectively improve the comprehensive benefits of trunk-line coordinated intersections.
Vehicle space-time trajectory analysis
The data from 1250s (time period 900–2100s) in the simulation was selected for analysis, and the results are shown in Figures 7 and 8. It can be seen that the vehicles are guided by the optimization model in this paper, the speed change is relatively smooth, and the number of vehicles needing to stop and pass again at the intersection is significantly reduced. This is because the vehicles in the platoon control area can obtain the information ahead of time and can pass through the intersection at the target speed of the vehicle without stopping, optimizing the speed change of the vehicle during the driving process, while using the improved Leader-Follower model to increase the number of vehicles coordinating to pass through the intersection without stopping.
As can be seen from Figure 13, the vehicles are guided by the model in this study, the speed changes more smoothly, and the number of vehicles needing to stop and pass again at the intersection is significantly reduced. This is because of real-time detection of vehicle arrivals in the inlet lane and adjustment of the green light duration in the coordination direction to extend or shorten. Additionally, vehicles in the platoon control area can obtain information ahead of time and pass through the intersection at the guided speed, optimizing the speed change of vehicles in the driving process. As a result, the number of vehicles passing through the coordinated intersection without stopping increases.
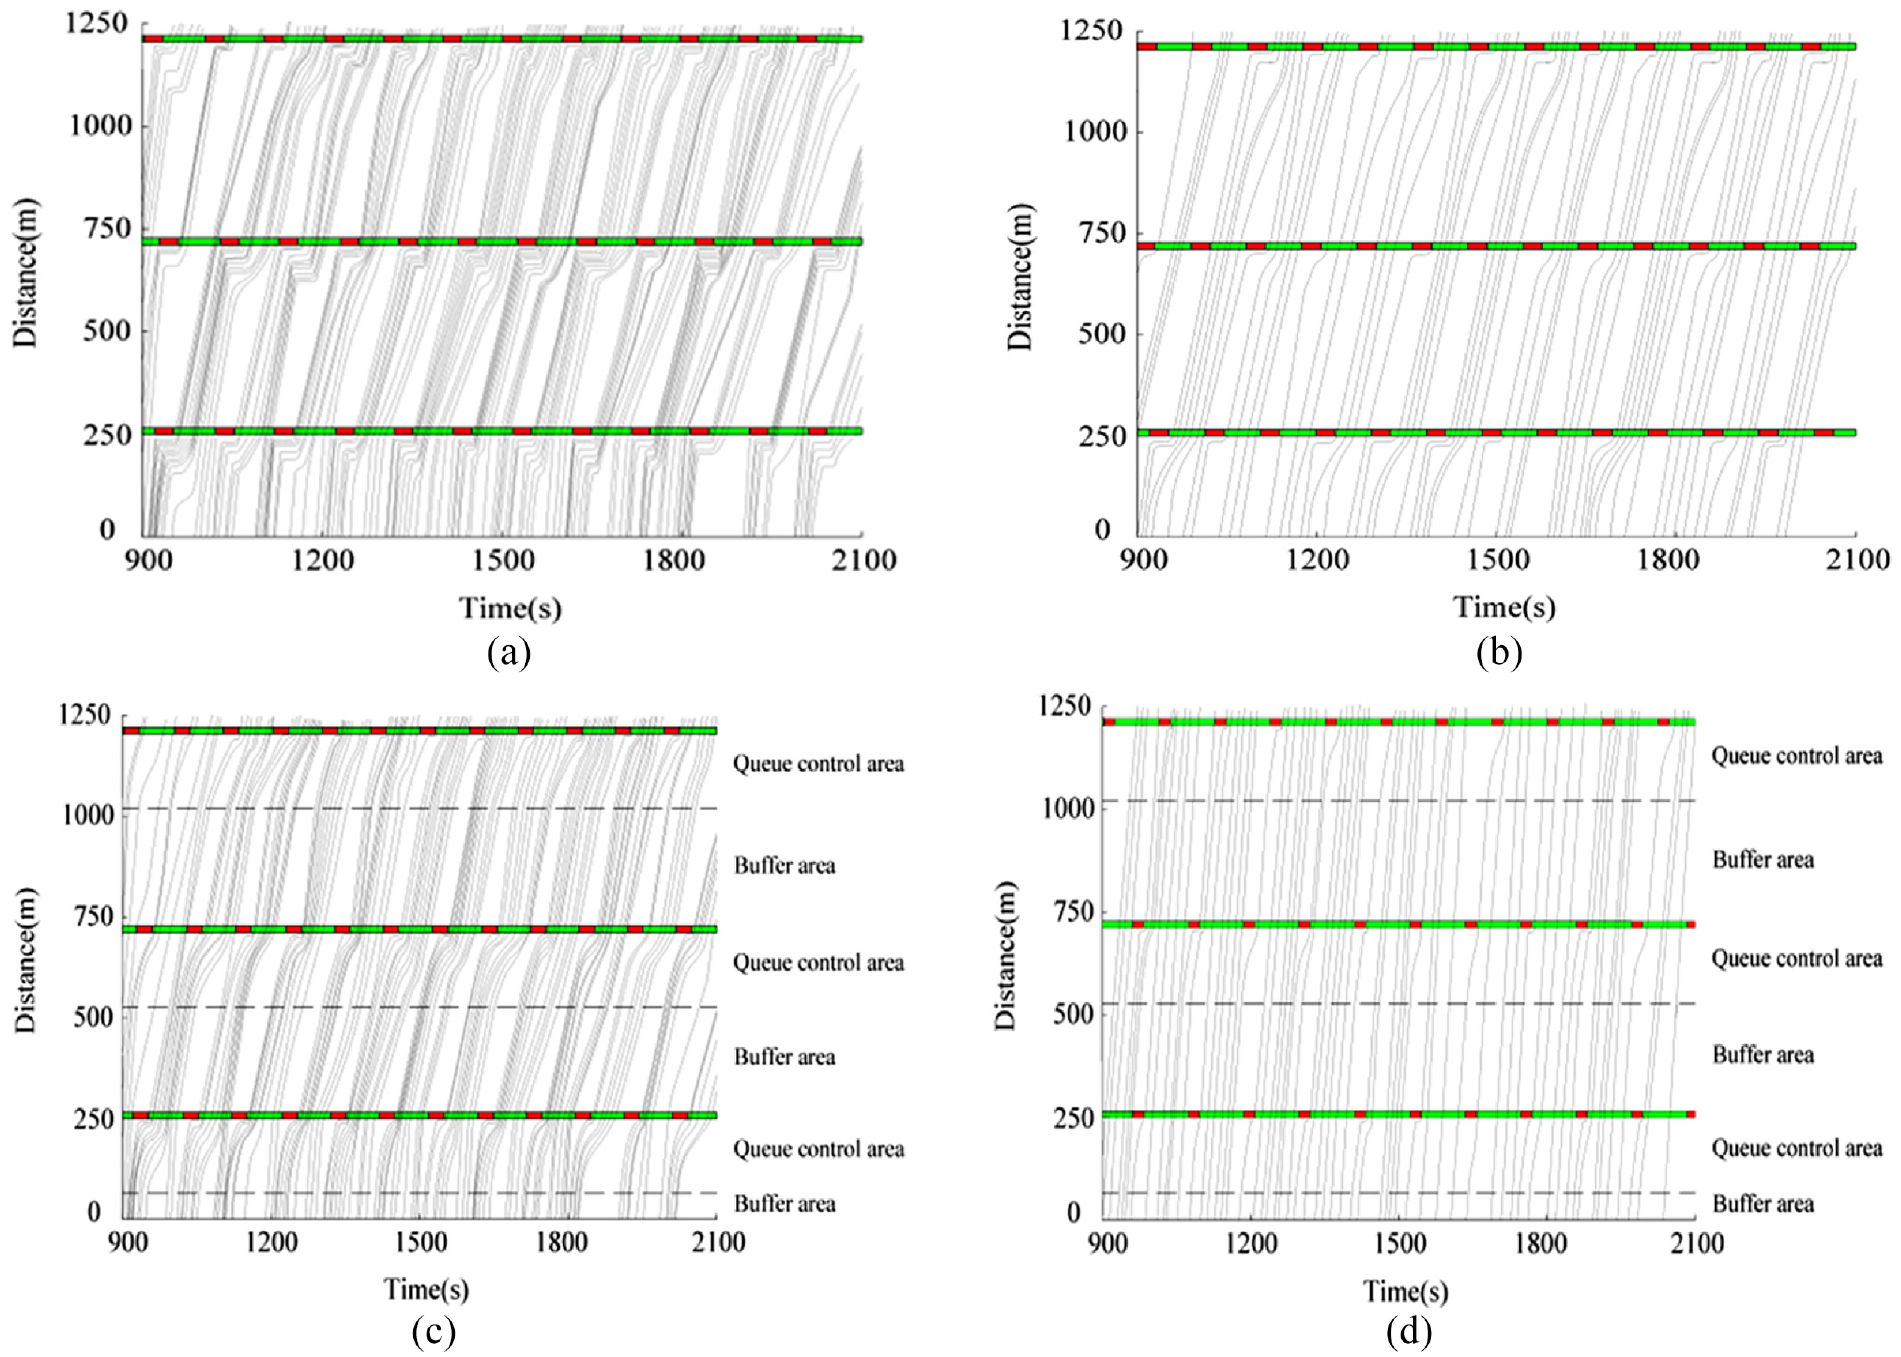
The spatio-temporal trajectory of model vehicles (partial): (a) Current program, (b) MAXBAND program, (c) speed guidance program, and (d) optimized program.
Conclusion
This paper proposes a cooperative and optimal control method for arterial roadway vehicle-road systems. The method integrates arterial coordination control, vehicle speed guidance, and intersection signal optimization. The method optimizes the cycle and phase differences by treating adjacent intersections as a whole on a macroscopic and spatial scale to maximize the arterial coordination bandwidth; on a microscopic scale, it considers the vehicle travel position at single intersections and forms a traffic queue through the intersection through speed guidance, while optimizing the green light time for each phase at individual intersections based on the arrival of vehicles in the guidance queue and the minor road direction. From the validation results, the average journey time, average vehicle delay and average number of stops were optimized after the adoption of speed guidance, indicating that the introduction of speed guidance in arterial coordination control can optimize the efficiency of traffic flow in the arterial direction. Applying the methods in this paper, each operational indicator is further improved, indicating that considering the traffic flow demand and using multi-objective optimization methods on top of global coordination and speed guidance to optimize and adjust the signal scheme of a single junction to create interaction between vehicles and signals can further exploit the spatial and temporal resources of the arterial junction.
In this paper, it is assumed that all vehicles will proceed through signal intersections according to the speed guidance strategy information provided by the system, but as the current vehicle-road collaboration technology is in its initial development stage. Therefore, the arterial coordinated interaction control method under different penetration rates of net-connected vehicles will be an important research direction in the next stage. In addition, when different combinations of intersection coordination phases are used, it will also have an impact on the arterial coordination control strategy, which also needs further research.
Footnotes
Declaration of conflicting interests
The author(s) declared no potential conflicts of interest with respect to the research, authorship, and/or publication of this article.
Funding
The author(s) disclosed receipt of the following financial support for the research, authorship, and/or publication of this article: This work was supported by the National Nature Science Foundation of China (No. 51965021).
Data availability statement
The data used to support the research of this paper are available from the corresponding author upon reasonable request.