
Abstract
Scholars and engineers attach great importance to fault detection in mechanical systems due to the unpredictable faults that arise from long-term operations under complex and extreme conditions. The fact that each type of fault embodies unique characteristics makes it challenging to obtain sufficient fault samples, and conventional machine learning methods fail to provide satisfactory fault diagnosis results. To address this issue, a simulation-driven fault detection method has been proposed in this paper. Firstly, the DT model of the gear transmission system was established. An improved multi-objective sparrow search algorithm (MOSSA) was employed to update the model and obtain an adequate number of simulation fault samples as well. Secondly, a two-stage adversarial domain adaptation model with full-scale feature fusion (ADAM-FF) was utilized to align and integrate the features of simulated and generated fault samples. This enables model training and classification of combined samples, facilitating the detection of unknown faults in actual measurements. Lastly, a simulation-driven equipment health index assessment model which accurately and non-destructively evaluates the degradation status of the equipment was introduced. This model effectively quantifies the extent of equipment degradation, thereby facilitating the transfer from the simulation realm to practical engineering applications. To validate the effectiveness of the proposed fault detection method, an experimental study was conducted on the extruder gear reducer of a petrochemical enterprise. The proposed fault detection method has the potential for widespread application across a range of large-scale mechanical equipment. As such, the utilization of this method will enable proactive maintenance planning, ensure safe and stable equipment operations, and minimize energy loss.
Introduction
The gear transmission system plays a crucial role in critical equipment utilized in aerospace, rail transportation, energy, and the chemical industry. It operates in demanding environments where high torque, large impact, variable loads, and high-temperature corrosion need to be endured. These conditions accelerate wear and tear on gears and bearings, leading to performance degradation and potential failures. Such failures can cause unplanned equipment downtime and maintenance delays and even incur major accidents such as machine damage and human death.1–3 Consequently, early fault detection becomes necessary for ensuring the reliable and uninterrupted operations of equipment. 4
Fault detection, diagnosis, and classification hold significance for equipment condition predictions and maintenance decision-making. Their main objective is to monitor the operational status of the equipment and promptly identify the specific type of failure. As a result, these processes enhance decision-making during maintenance activities and contribute to the formulation of effective maintenance rules. 5 Accurate fault detection, diagnosis, and classification of equipment can bring several benefits to process manufacturing companies. These include identifying the type of fault, reducing unplanned downtime, avoiding unnecessary maintenance, and maximizing equipment uptime. Additionally, these processes can improve work efficiency, cut down maintenance costs, and enhance overall economic benefits. 6 Currently, enterprises adopt various methods for fault detection, diagnosis, and classification, which include model-based approaches, data-driven methods, and combinations of model-based and data-driven methods.7,8
The model-based methods use sophisticated computing units to establish mathematical models that present the physical characteristics or mechanisms of equipment degradation. Such models are utilized to characterize and evaluate the equipment degradation process, predict equipment failure, and estimate the remaining life of service.9–11 Aivaliotis et al.12,13 simulated machine behavior in a virtual environment and proposed a method to calculate the remaining service life based on a physical simulation model. The simulation results can predict the machine’s health status and guide maintenance activities. Klein and Bergmann 14 developed a method to generate mechanical and electrical predictive maintenance data by using a physical plant model equipped with multiple sensors, which can reproduce data from actual failures. Kang et al. 15 introduced the concept of designing a meta-model including both non-monotonic and monotonic models for degradation models like stochastic process models. Wang et al. 16 suggested a comprehensive framework for applying model-driven designs to the twin-screw granulation process, and the framework can be extended to encompass the pellet formation process as well.
Despite the advantages of high accuracy and strong adaptability, model-based methods encounter difficulties in modeling complex non-linear processes and feature long development cycles. 17
The data-driven method focuses on utilizing reliability statistics technology and artificial intelligence to extract normal and characteristic data of performance degradation, enabling the derivation of the equipment’s evolution process from normal operation to failure. This method allows for the development of data-driven predictive maintenance tools.18,19 However, the limited quantity and poor quality of sample data for component performance degradation may result in major errors during derivation.20,21 Wan et al. 22 presented extraction methods for redundant features at different levels of decomposition to describe different gear crack levels. They used principal component analysis to reduce dimension and achieved a high-precision prediction of service life. Chen et al. 23 developed an Internet of Things system for monitoring centrifugal pumps. The researchers in this study primarily relied on online monitoring data to improve the accuracy of service life prediction and maintenance optimization. Similarly, Liu et al. 24 utilized the convolutional neural network (CNN), a dislocated time series, to analyze the collected signals for predictive maintenance and motor fault diagnosis.
In the context of data-driven prediction, a “black box” or “gray box” model is established through retrieval. Once a model is detected, it requires model iterations, transfer learning, and model validation. The model verification process involves acquiring a large amount of data, facilitated by various steps including data preprocessing, feature extraction, and fault identification. Finally, continuous model training is performed to obtain prediction results. The model-based method, also known as the conventional expert-knowledge-based method, requires establishing problem-solving methods using mathematical models. However, these two methods fail to take into account the diverse states of equipment in the continuous production process, and the short-term and incomplete data of degraded samples. As a result, they have low model fidelity, poor update timeliness, and insufficient data analysis capabilities. The lack of interaction and synergy between these methods ultimately leads to inaccurate and untimely diagnosis results. 25 To leverage the advantages of both model-based and data-driven methods, many scholars have proposed a method that well combines models and data and can be seen as a mathematical solution set to practical problems.26,27 The results from both methods are complementary, remarkably improving the prediction accuracy while reducing computational complexity and cost. 28
The application of AI in anomaly detection faces challenges such as class imbalance and insufficient labeled fault samples. Consequently, extensive research was conducted by numerous scholars on fault diagnosis driven by model and data fusion. Xiang et al. 29 utilized the finite element simulation analysis, along with wavelet transform and support vector machine algorithms, to analyze the imbalance, shaft misalignment, and friction impact of the rotor-bearing system. They managed to classify and diagnose a balanced mixture of four types of faults, the result demonstrated a strong fault class identification capability. Building upon this foundation, Liu et al. 30 employed the finite element method to design a numerical simulation model of gear faults in order to obtain sufficient gear fault samples. The scholars then adopted the extreme learning machine method to accurately classify gear faults, thereby paving the way for designing personalized diagnostic methods. In the study on simulation amplification, enhancement, and sample transfer methods, Gao et al. 31 proposed an innovative approach that combines finite elements with generative adversarial networks (GANs). This approach not only amplifies fault samples through finite element simulation but also enhances them by using GANs. By synthesizing fault samples, the type of unknown fault was identified. Additionally, Gao et al. 32 utilized numerical simulation data and real data samples to generate synthetic fault samples for gear classification. They employed CNN, recursive neural networks, and stacked auto-encoders to classify unknown fault samples. Lou et al. 33 put forward a personalized diagnosis method based on finite element simulation under the context of transfer learning integrated with fault sample expansion. They utilized fault categories obtained through simulation to augment the original fault samples in the source domain and employed an adversarial domain to automatically align the features of the target domain and source domain samples via an adaptation network. This approach was found to facilitate the migration and expansion of samples, ultimately enabling the classification of rolling bearings and gears based on fault detection.
The digital twin (DT) technology provides a novel approach to address the aforementioned challenges. 34 It aims to create highly accurate virtual models of physical entities that are capable of capturing complex attributes, as well as accurately representing the actual behavior and status of the entity. The monitoring, simulation, evaluation, optimization, and prediction capabilities of the virtual models allow them to closely resemble physical entities. 35 The DT technology is currently regarded as crucial to the convergence of physical systems. 36 Leading manufacturers have successfully integrated the DT technology into the entire life cycle management of equipment, including such processes as planning, design, production, distribution, operation, use, maintenance, recycling, and disposal. This integration effectively combines equipment manufacturing with digitalization and intelligence, showcasing the synergy between modern information technology and DT technology. 37
In 2019, Booyse et al. 25 introduced a deep DT model aiming at detecting early failures, tracking equipment performance degradation, and identifying failure modes in both operation and shutdown states. This model was trained solely on healthy operational data of bearings. Similarly, Tao et al. 38 proposed a five-dimensional DT model architecture in the same year. This architecture was utilized to research fault prediction of the wind power gearbox and suggest a method for equipment life-cycle health management 39 to realize closed-loop optimization of product design, production, operation, and maintenance. Anis et al. 40 presented a probabilistic approach for consistent prediction of vehicle or system health, the remaining useful life, and mission success. Li et al. 41 developed an electromagnetic wave while drilling the tool fault analysis model based on the Wei-bull distribution model. They intended to assess the longevity and remaining service life of the antenna system using the fault analysis model. To evaluate the reliability of the instrument system and optimize the safety of tool operation and maintenance, the Kolmogorov-Smirnov test was employed to simulate the Wei-bull distribution model. Chao et al. 42 designed a model and data fusion-driven health status assessment method specifically for axial piston pumps and developed a quantitative evaluation index for assessing the pump health status. Aivaliotis et al. 12 introduced a method to predict the remaining service life of industrial robots using physical models and the DT model at the component level. The machine’s status information at the component level was continuously updated through joint simulation models and data, and specific methods were employed to support user allocation on the machine.
Insufficient explorations have been conducted on the different states of equipment during continuous production and component performance degradation in actual engineering, regardless of whether it is a model-based or a data-driven diagnosis method. Anomaly detection faces challenges such as class imbalance and a lack of labeled fault samples. Although simulation and data fusion-driven methods have expanded the number of fault samples and effectively migrated fault samples, these solutions still hold limitations. For complex equipment like gear reducers and gear pumps in actual operation, it is difficult to accurately obtain simulation model parameters under uncertain boundary conditions, and time-consuming to manually adjust model parameters, resulting in discrepancies between the simulation data and experimental measurements. Furthermore, in practical engineering applications, the uncertainty pertaining to the fitting surface of the mechanical system introduces a challenge whereby the simulation time of the model increases. This poses difficulties in making timely judgments and can result in delayed fault detection. Despite the immense promise held by DT technology, there are several challenges and barriers that still need to be addressed. Firstly, constructing an efficient and high-fidelity twin model with precise accuracy is a complex endeavor. Secondly, effectively characterizing large volumes of low-quality operational data remains a daunting challenge. Thirdly, describing the failure mechanism of power couplings in an effective manner remains a difficult task. Lastly, fully integrating the complex and constantly evolving model data poses its own set of difficulties.
A fault detection scheme driven by simulation is discussed in this paper. In comparison with existing studies, this study features the following highlights and engineering significance: (1) A DT model of the gear transmission system is established to address the problem of insufficient fault samples of the real gear transmission system, and the model was updated using the multi-objective sparrow search algorithm (MOSSA). (2) To label and transfer fault samples, a two-stage adversarial domain adaptation model with full-scale feature fusion (ADAM-FF) is employed. This model aligns the features of the simulation samples and generated samples by combining them into fusion samples used for model training and classification. (3) A simulation-model-driven equipment health index assessment model which quantitatively characterizes the degree of equipment degradation is introduced to accurately assess the non-destructive evaluation of the fault generation process. The effectiveness of the model is further validated using actual data collected from the extruder gear reducer of a petrochemical enterprise.
The structure of this paper is organized as follows: Section II provides the construction methods of the DT and domain adaptive models, as well as the description of the evaluation model. The evaluation outcomes obtained through the integration of real-life engineering cases are presented in Section III. Finally, Section IV concludes the paper and offers recommendations for future research endeavors.
Methodology
This section outlines the process of constructing the DT model for the extrusion press gear reducer box. A simulation-driven approach to detect faults in the extruder gear reducer and evaluate the equipment health index has also been explored. Furthermore, insights into parameter calibration techniques for the DT model and the development of the adversarial domain adaptation model are provided.
Framework
The proposed framework in this paper is illustrated in Figure 1 as a visual representation of the framework put forth in this study. A digital replica approach is employed by this framework to fuse data-driven and model-based techniques, aiming to enhance the precision of probability density functions and prediction outcomes. By dynamically updating the parameters of the virtual model, the obtained solution findings are refined.
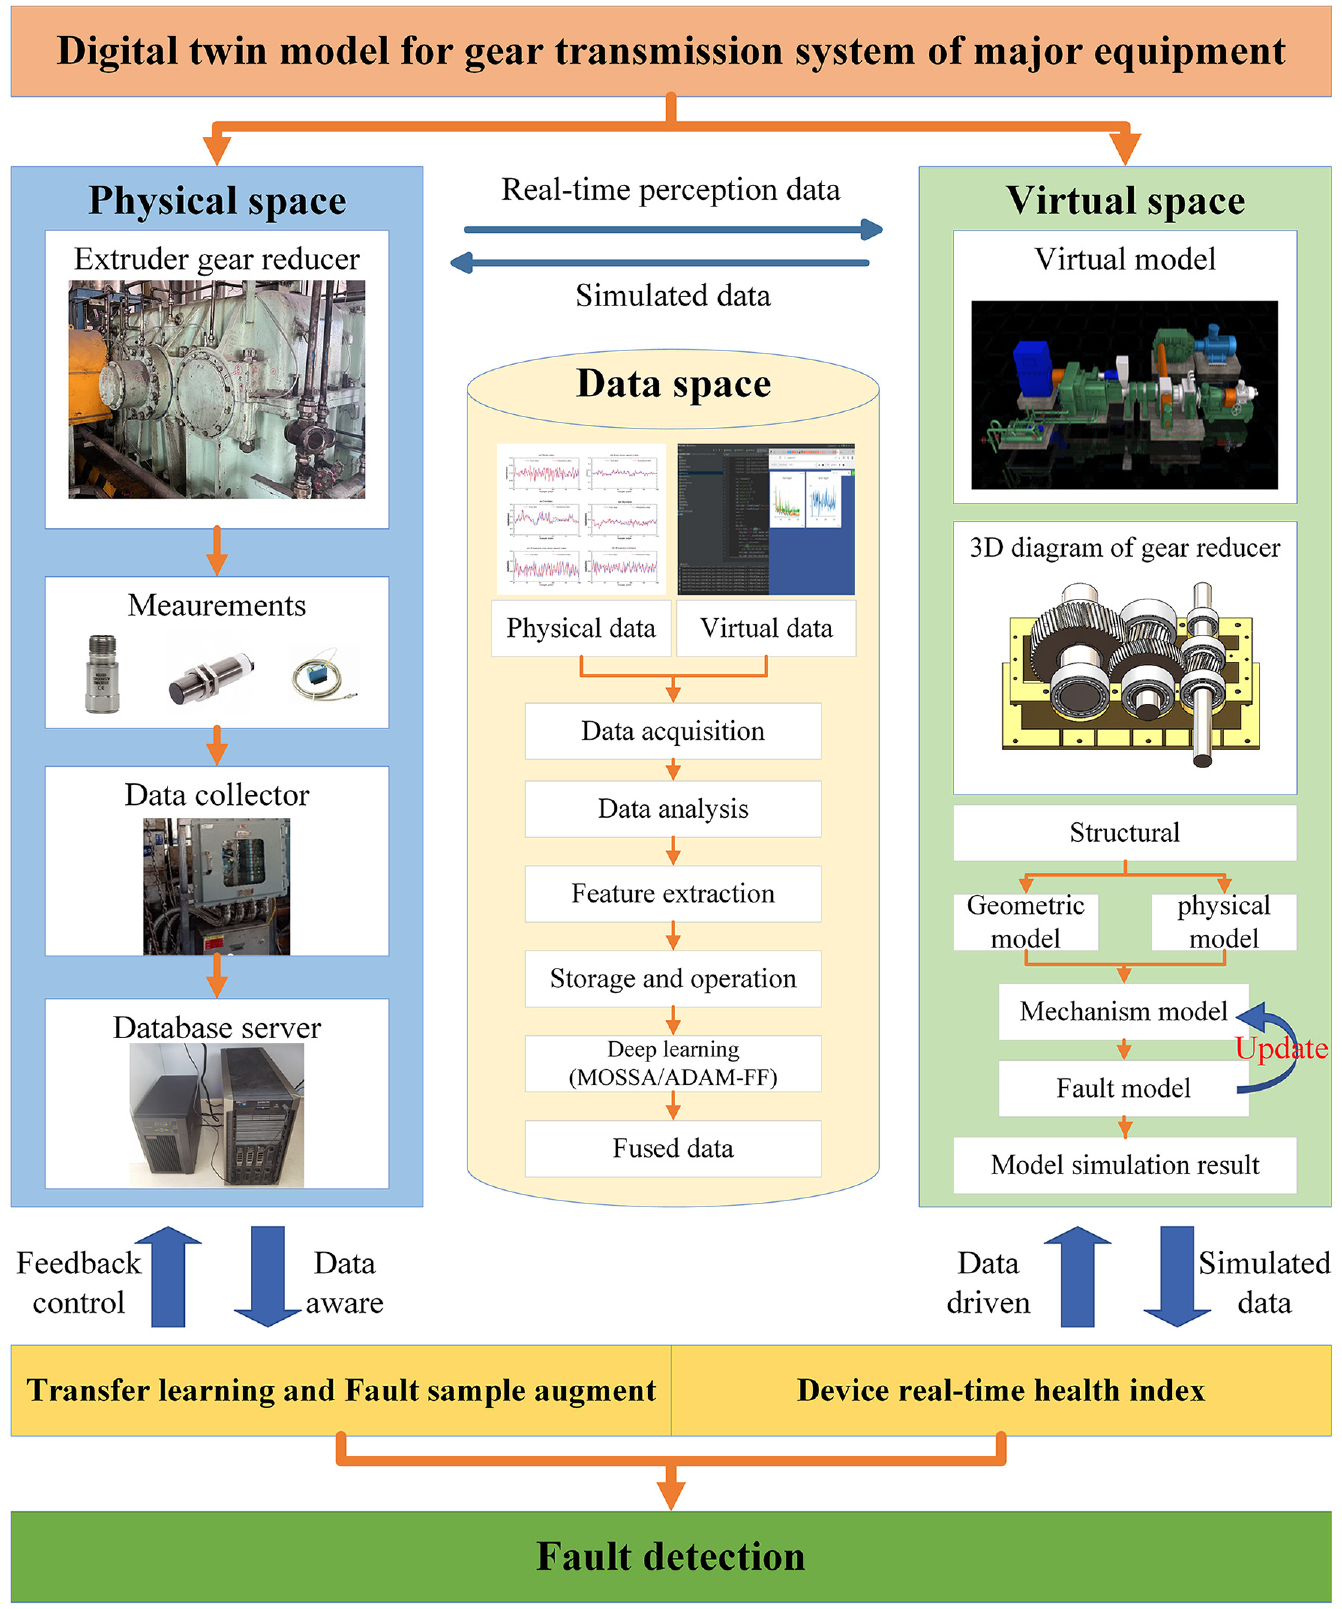
The framework of simulation-driven fault detection.
The simulation-driven fault detection method consists of three main steps. Firstly, a simulation model is established using drawing parameters and measurement parameters. Secondly, the ADAM-FF is developed for full-scale feature fusion. The simulated data is used to expand the fault samples of the source domain, and a two-stage GAN is employed to achieve full-scale feature alignment between the fault samples of the target domain and the source domain, which enhances the fault sample set. Thirdly, an equipment health index evaluation model and a pre-established maintenance plan are developed. Various fault samples can be simulated and inputted using this method, enlarging the size of fault samples and enabling accurate and non-invasive fault detection of the gear transmission system. This approach aids in the development of appropriate predictive maintenance measures to ensure the safe operation of equipment. The DT model can be established by utilizing the measurement data obtained from the operation of the extruder gear reducer in a petrochemical company. The extruder gear reducer, a widely used gear transmission system in major equipment, is renowned for its characteristics of continuous operation, high torque, and alternating load. The extruder gear reducer of the petrochemical company serves as the foundation to establish the DT model in this study.
The following section will provide a detailed explanation of the process involved in building up the DT model for the extruder gear reducer.
Implementation
Using a modular modeling approach, researchers in this study have successfully established the DT model for the extruder gear reducer. The employed approach involves dividing the extruder into multiple subsystems, specifically the mechanical, electrical, and control subsystems, as shown in Figure 2. Researchers then integrated and coupled these subsystems using a modeling language that incorporates the energy conversion mechanism. This innovative approach offers a unified modeling and simulation environment, generating a comprehensive DT model. The accurate mathematical expressions of the attributes that effectively reflect the physical entity’s response are essential for the subsystem to construct the DT model. Moreover, the dynamic model works as the core foundation for the extruder gear reducer’s DT model.
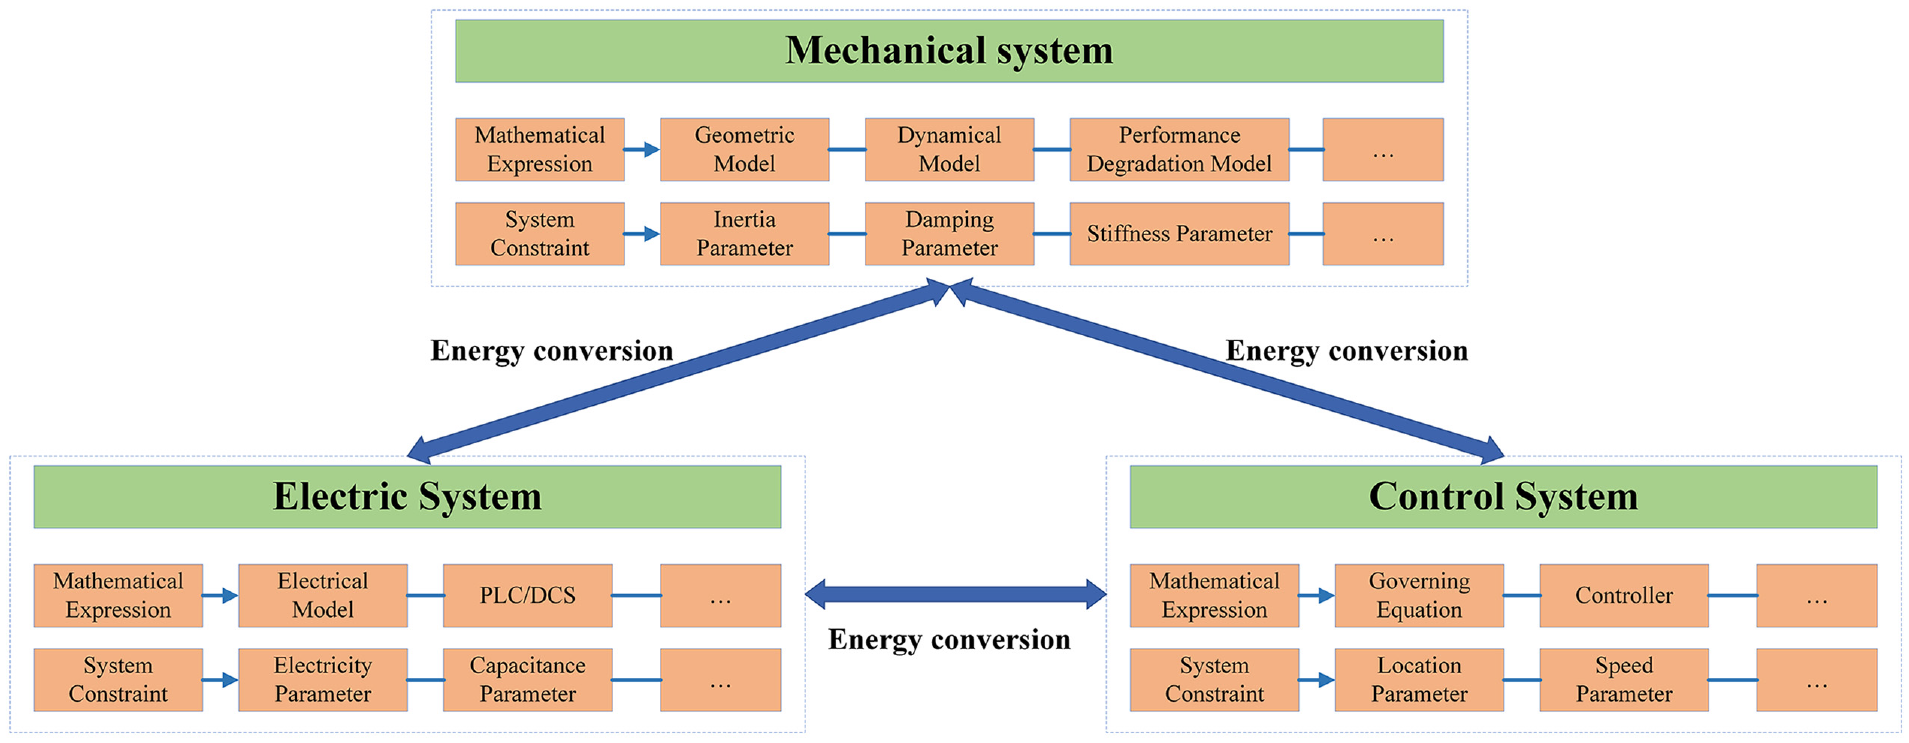
The modular modeling approach of extruder gear reducer’s DT model.
Gear transmission dynamic model
A gearbox known as the extruder gear reducer has been specifically designed to cater to heavy-duty applications that require a low-speed operation. In this particular study, an all-encompassing dynamic model of the physical gearbox is formulated, as illustrated in Figure 3. Various components including the motor, coupling, gear, bearing, shaft, and shell are all incorporated into the dynamic model. The dynamic equation that describes the gear transmission system is as follows:

where
The process of dynamic correction of model parameters.
Dynamic model parameters are usually established upon empirical formulas. The virtual model and the physical entity must be crafted to resemble each other in both form and core attributes. Nevertheless, discrepancies may arise between the DT model and the physical entity due to assembly errors that occur during installation and modifications in working conditions throughout production. Such errors have the potential to induce variations in parameter values. Furthermore, the manual refinement of model parameters is a laborious endeavor with no assurance of precision.
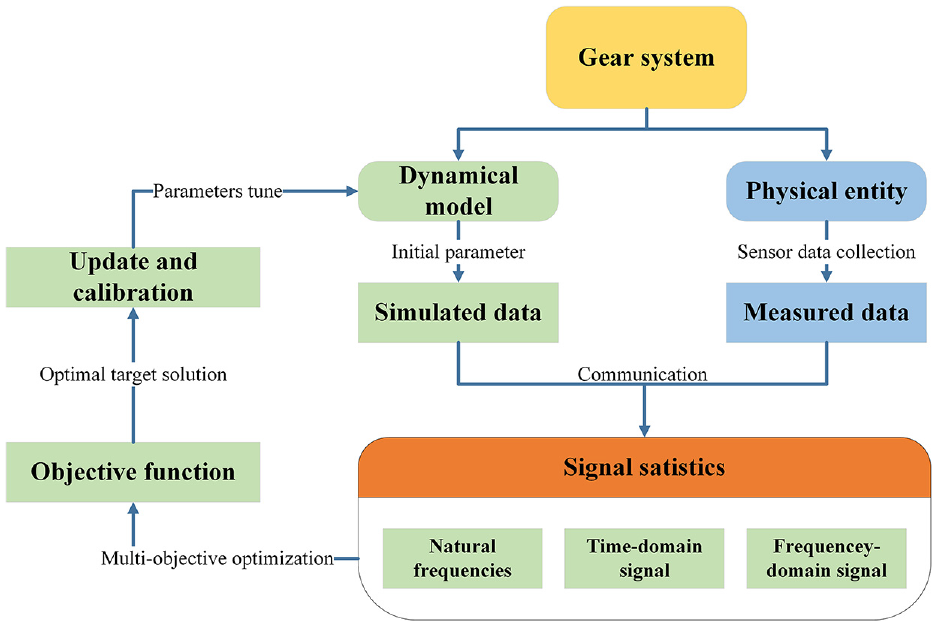
To guarantee the accurate reflection of the gear transmission response and provide precise model support for developing the DT model, a dynamic correction method for model parameters utilizing a multi-objective optimization algorithm embedded in the DT framework has been proposed in this study. Through intelligent identification and correction of model parameters, real-time mapping and dynamic correction of the DT model can be accomplished. This method includes establishing an objective function and agreeing on a multi-objective optimization algorithm. The process of dynamic correction of model parameters is illustrated in Figure 3.
The establishment of the objective function
The measurement point data of the gear transmission system have been analyzed based on the gear dynamic mechanism. The simulation data of the normal state was labeled and defined as the model reference data. On the other hand, the real-time monitoring data from the same measurement point was used as the model input data to calculate the correlation coefficient between the input data and reference data. In order to enhance the accuracy of model parameter updates, multiple sources such as time domain eigenvalues and frequency domain eigenvalues were taken into account.
After denoising the collected monitoring signals using wavelet, the fast Fourier transform (FFT) signal processing method was employed to extract their time domain and frequency domain characteristics and assign them numerical values. However, the presence of noise in the time domain waveforms means that certain feature values may not be sufficiently sensitive to detect early faults or performance degradation trends. Additionally, some features may exhibit poor monotonicity and relative effectiveness in reflecting the performance degradation process. Therefore, the necessity to screen the feature set and identify high-correlation characteristic indicators arises. Subsequently, an objective function can be established based on these selected indicators.
Several parameters must be identified and updated when determining and updating parameters for the calibration and adjustment of the dynamic model. It is crucial to match the simulated response with the measured response. The objective function formulated for this purpose is listed as follows:
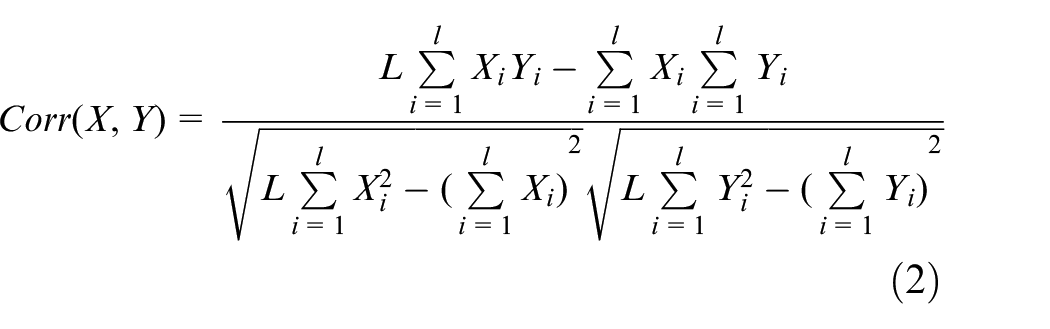
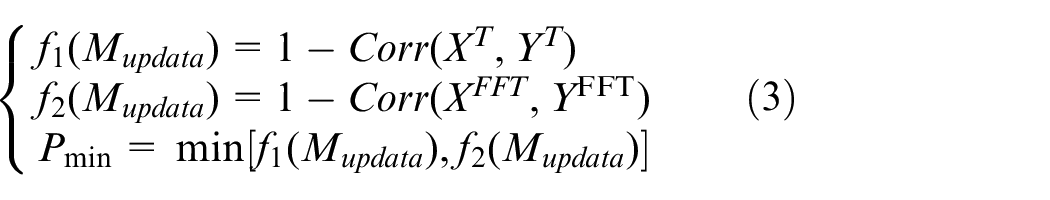
where X represents the feature set of the model response output, Y represents the feature set of the actual measured data, l denotes the data length,
Agreed multi-objective optimization algorithm
To deliver the optimal solution of the dynamic model parameters and ensure a good match between the reference data and the input data, a multi-objective optimization algorithm was utilized for calibrating and updating the dynamic model parameters. In this study, MOSSA, an extension of the sparrow search algorithm (SSA), known for its high search ability and fast convergence speed, was employed to solve the optimal solution of multi-objective functions. SSA refers to a bionic optimization algorithm that mimics the hunting behavior of sparrows, comprising three types of sparrows: foragers, followers, and guarders. Sparrows need to establish a detection and early warning mechanism to protect themselves from natural enemies for survival. Within the sparrow population, foragers with higher fitness values were given priority in accessing food in that foragers are responsible for hunting food and leading the entire population, enabling them to acquire food more efficiently than other sparrows. The position update formula for the forager is as follows:
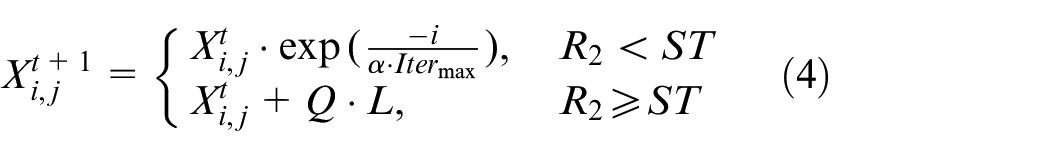
where t indicates the current iteration,
When
In order to compete for better food, followers frequently monitor foragers and promptly leave their current location once they discover that foragers have found superior food. The follower’s location is then updated accordingly. The formula for a follower’s updated location is as follows:
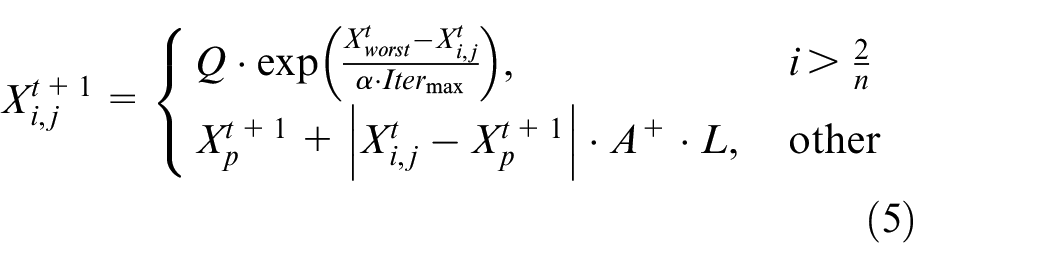

where
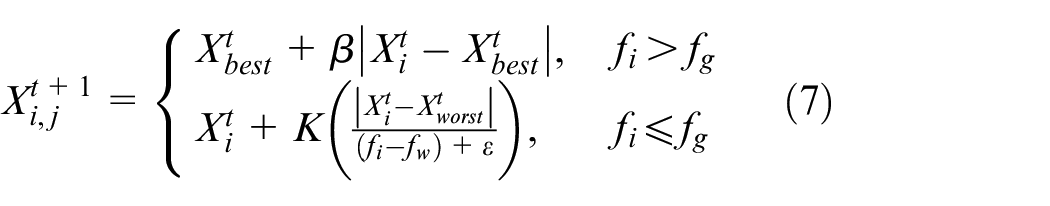
where
However, relying solely on the above model may result in a lack of diversity in population locations, which can produce local extreme values and forestall obtaining the global optimal solution.
In the initial phase, the speed at which the SSA algorithm converged was comparatively sluggish, but it exhibited a noticeable improvement in the intermediate phase. To augment the variety of particles during the early stage, it is advisable to integrate certain chaotic mapping methods. Nevertheless, the optimization rate declined again during the subsequent period. To tackle this issue, the introduction of the golden sine algorithm and the Cauchy perturbation strategy could expand the search range of the SSA algorithm, 46 thereby reinforcing its ability to evade entrapment in local optima.
In this study, the algorithm has been further applied to the global optimization of the dynamic model parameters of the gear transmission system and its practical applications in engineering problem-solving have been explored.
The calculation formula for chaotic mapping is presented as follows:

where
The calculation formula for generating random numbers through chaotic mapping is listed below:
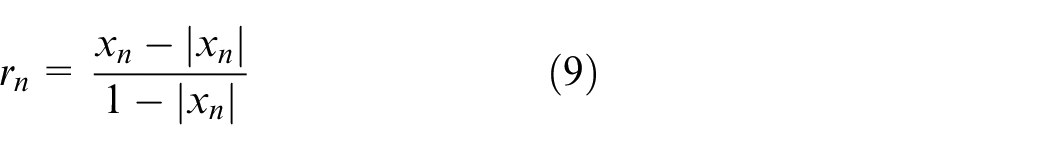
where
The location update method for foragers upon introducing the chaotic mapping and the golden sine is as follows:
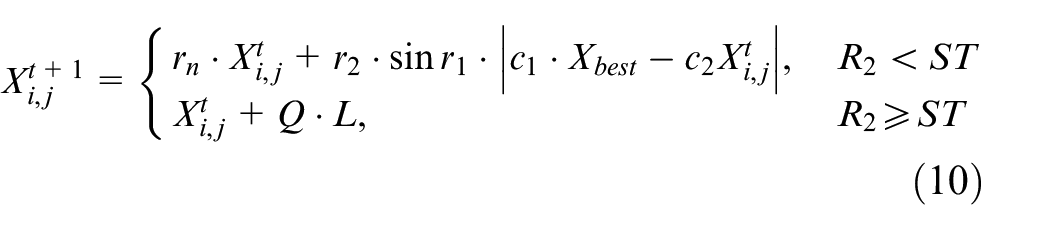
where
The improved follower’s position update formula is as follows:
where
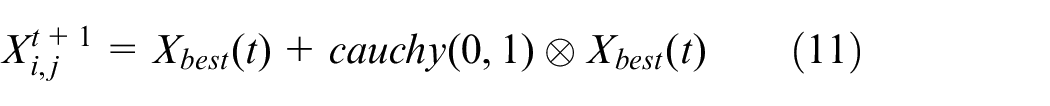
The one-dimensional origin-centered Cauchy variation function centered is shown below:
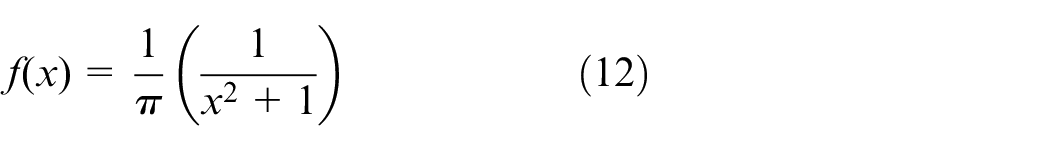
The MOSSA process is depicted in Figure 4.
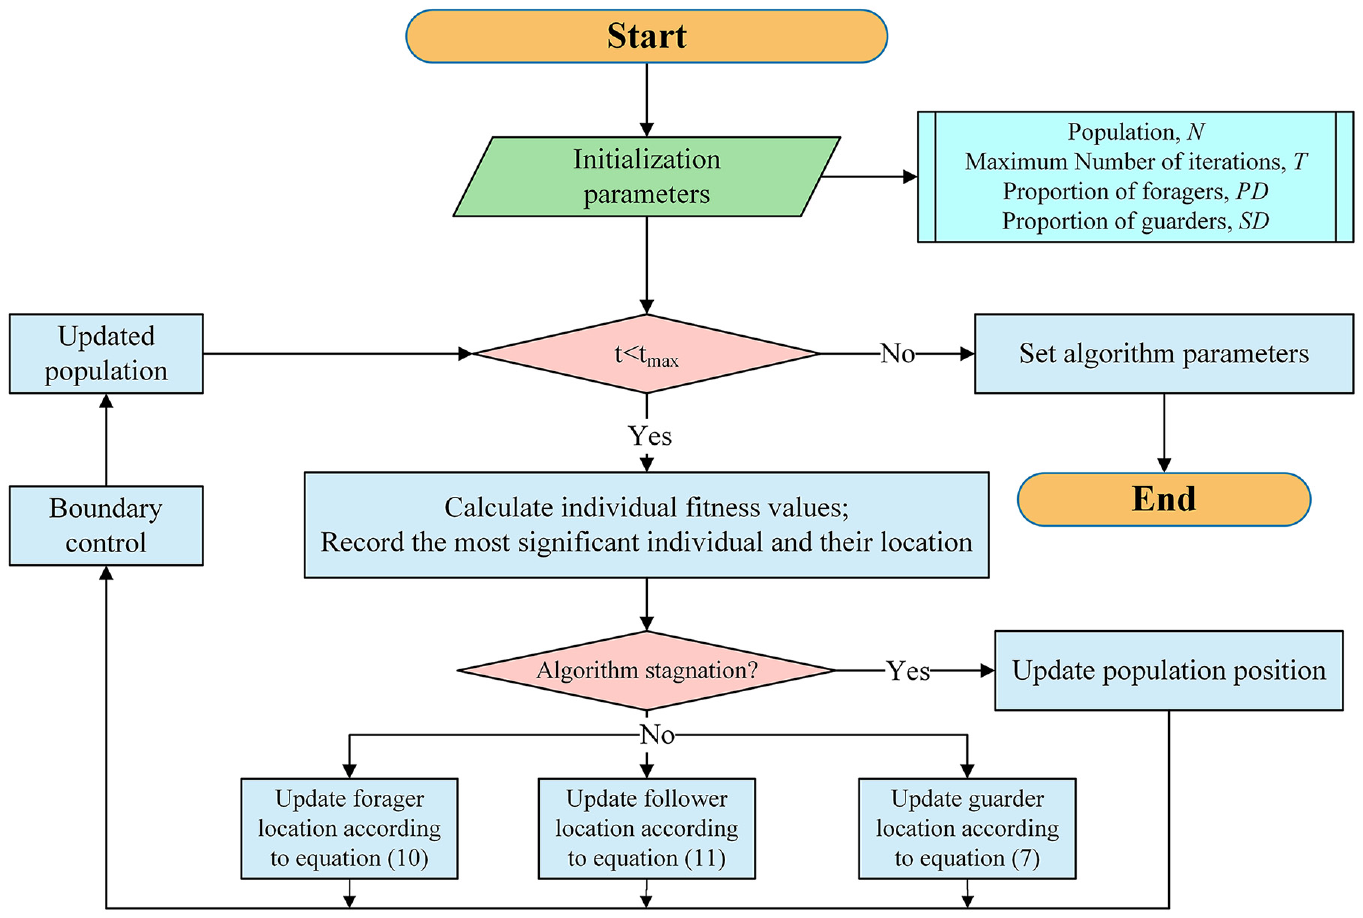
The process of MOSSA.
The aforementioned procedure was employed to ascertain the ideal variables of the dynamic model for the gear transmission system. This entails employing data from multiple sources, encompassing signals characterized by both the time domain and frequency domain. The method of dynamically updating the model parameters guarantees the dependable establishment of the dynamic model. Additionally, the dynamic model could facilitate instantaneous interactions between tangible entities and virtual models by furnishing real-time dynamic data.
The proactive updates of the DT model can be accomplished until the discrepancy between the simulation outcomes and the genuine operational data is adequately reduced. The findings imply that the DT model exhibits negligible discrepancies, and it can be deemed a high-fidelity representation that precisely mirrors the reaction of the tangible entity.
The extruder gear reducer typically operates under normal working conditions. In order to minimize equipment maintenance costs and prevent unplanned shutdowns, developing maintenance plans and putting spare parts in place before the gears or bearings undergo notable degradation or failure is important. However, a lack of actual measurement data prevents it from assessing various levels of fault compared with data obtained under healthy operational conditions. It is both costly and time-consuming to conduct destructive experiments to generate degradation data and it also disrupts normal production.
When introducing degradation models or failure mechanism models, distinctive dissimilarities will inevitably occur in the response observed in the DT model. Utilizing the transfer learning algorithm serves as an applicable solution to this issue in engineering practices. The outline of establishing the adversarial domain adaptation model for comprehensive feature fusion is discussed below in detail.
Adversarial domain adaptation model for full-scale feature-fusion
To transfer the model parameters, features, instances in the database, and knowledge associated with the actual environment which gets trained with DT simulation data to the actual application environment, ADAM-FF has been proposed in this paper for full-scale feature alignment of the target domain data and source domain data in two stages.
GANs comprise a generator and a discriminator. 47 The generator, also known as the feature extractor, captures the underlying distribution of real data samples and generates new data samples. The discriminator acted as a binary classifier to distinguish between real data and generated samples. 48 The key idea is to take both the generator and discriminator as participants in a game. 49 Through ongoing optimization, both entities improve their generation and discrimination abilities, eventually reaching Nash equilibrium.
In ADAM-FF, the simulation data are marked as the source domain data and expressed as
The average of C categories is expressed as:
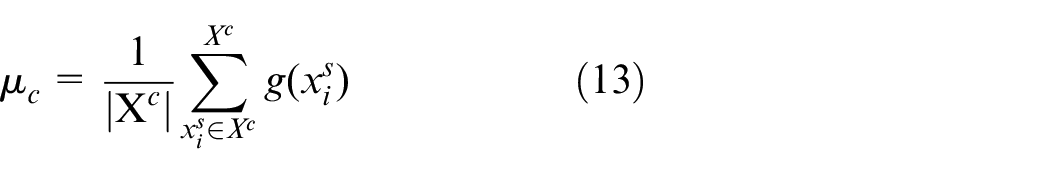
where
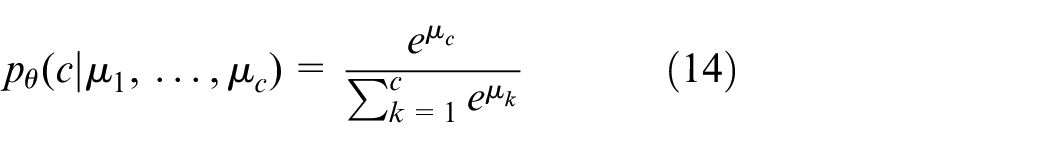
Applying softmax to interpret the output of the network as class conditional probability, the following formula is obtained:
The architecture of ADAM-FF is shown in Figure 5, which is divided into data reconstruction, domain adaptation, and validation stages. The first stage involves training a classifier
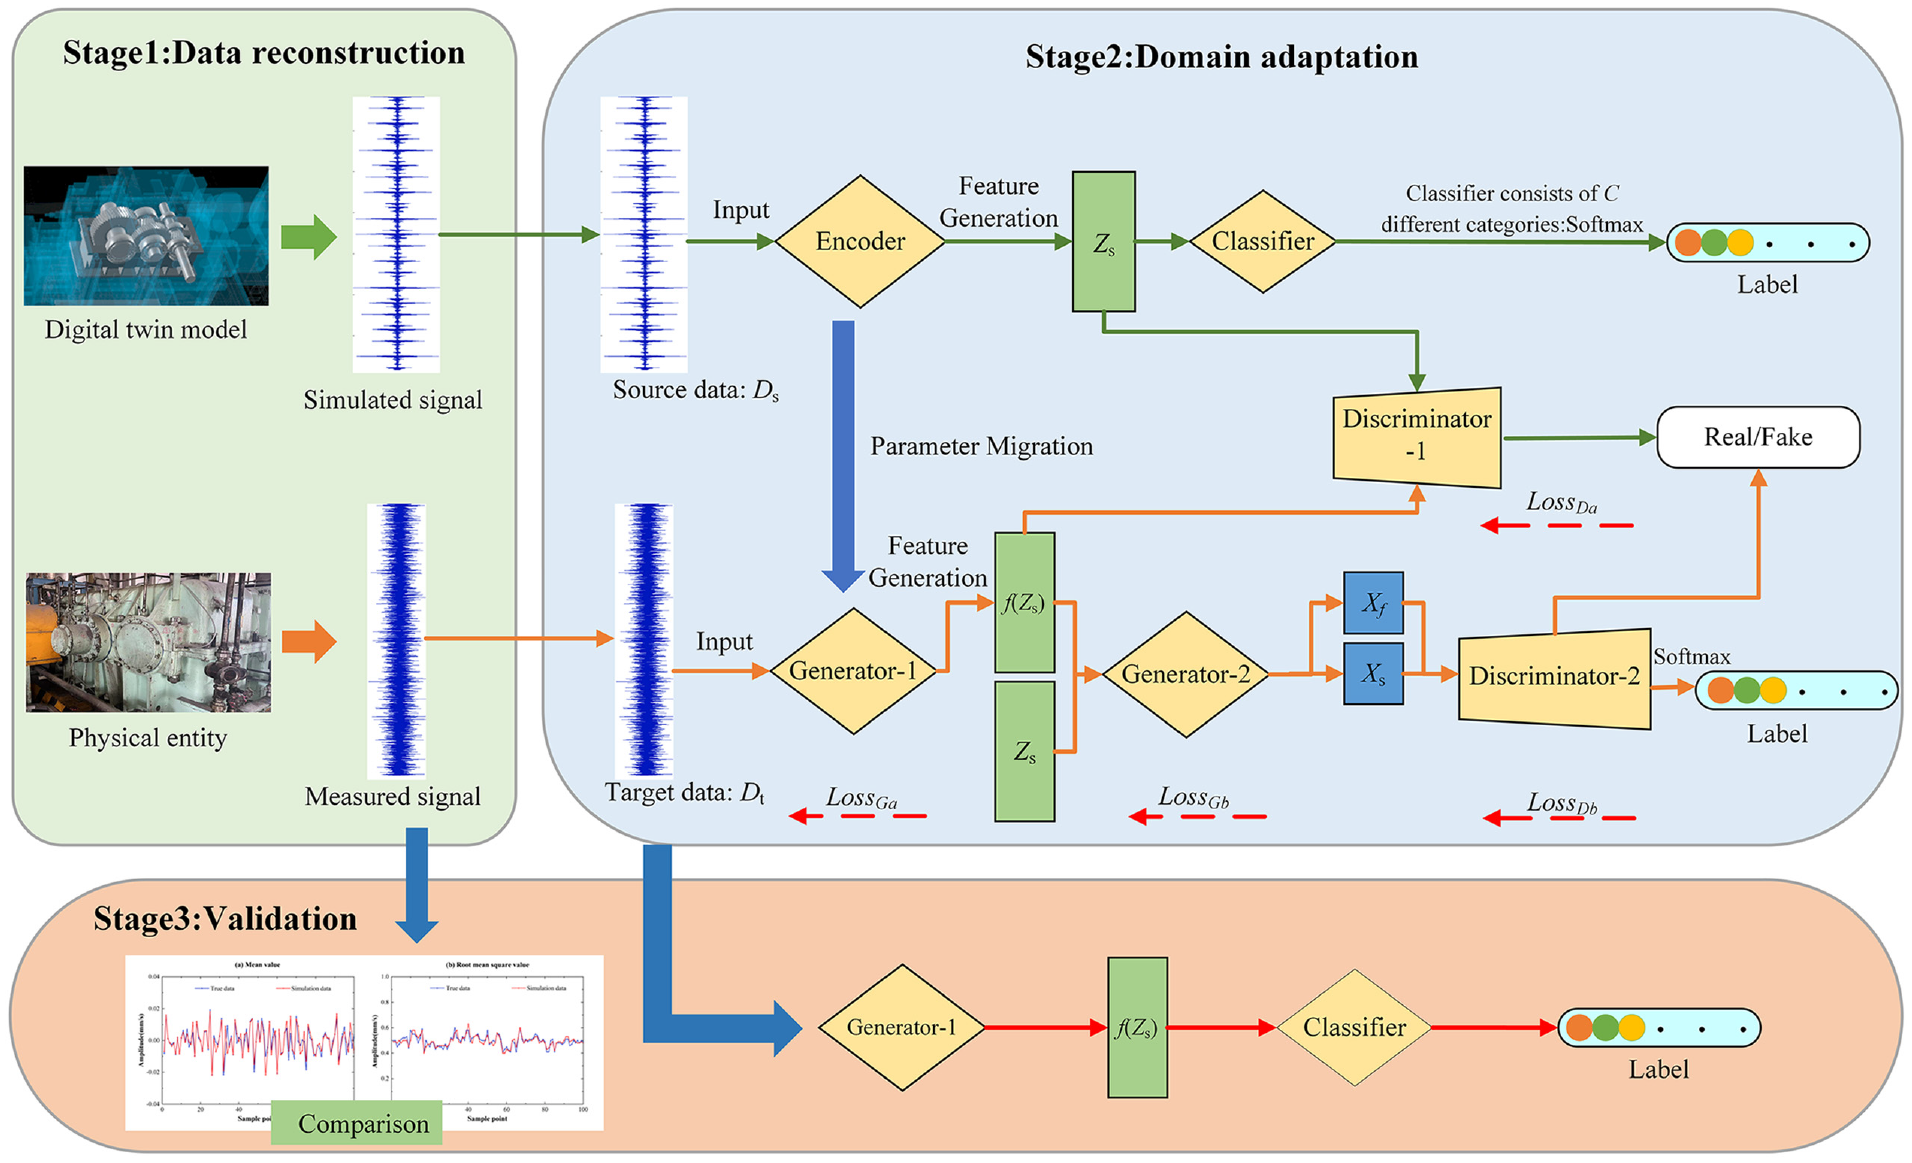
The architecture of ADAM-FF.
The configuration of the network during training is as follows: the optimizer is Adam, the learning rate is set to 0.0002, the batch size is 32, and the loss function used is the cross-entropy loss function. The fully connected layer consists of 100 neurons with ReLU activation function and BN normalization. In order to optimize the network, GAN introduces a normalization layer and a dropout layer. The purpose of normalization is to prevent the gradient from vanishing during the training process. This network utilizes a combination of Sigmoid activation function and maximum and minimum normalization.
In order to obtain accurate predictive maintenance results, four key parameters are introduced into the domain model.
(1) Optimization function that reflects the overall performance of the model (min-max game):
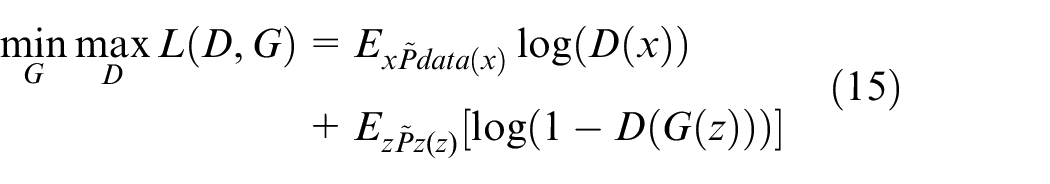
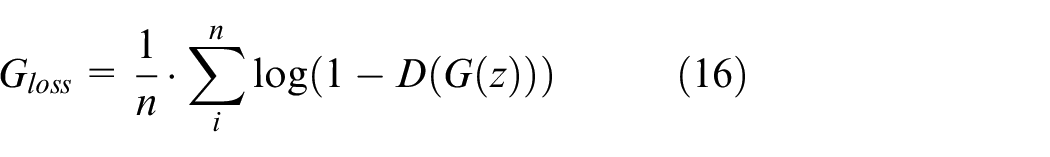
(2) The loss function of the generator:
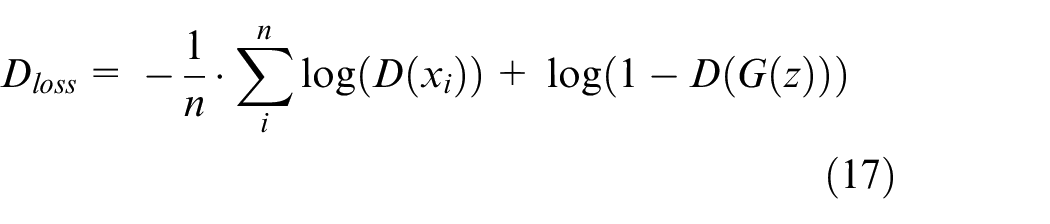
(3) The loss function of the discriminator:
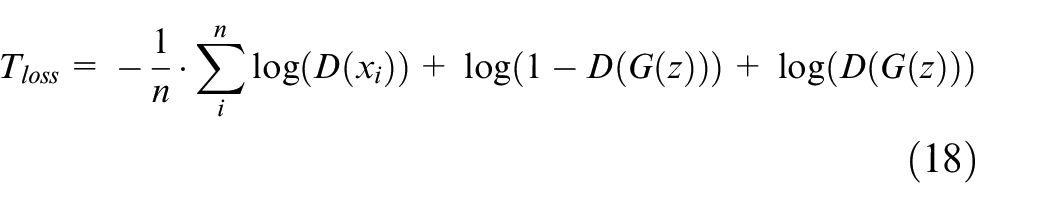
(4) Objective function (total loss):
Equipment health index assessment model
The method for assessing the health index of equipment relies on the original monitoring data of the equipment. This piece of data is used as a reference to establish a health index evaluation model and record the obtained degradation data. The constructed health index assessment model can indicate the extent of performance degradation and serve as a maintenance decision-making indicator. Upon completion of feature signal extraction and model algorithm, a quantitative number with a value range of
The construction of the health index assessment model is shown in the figure, and the specific process is as follows:
Model reference data: Mark DT model response signals as reference data for the health index model, including normal health data and alarm fault data.
Actual input data: Use real-time monitoring data from the same measurement point as the actual data input for the health index model (status data to be evaluated).
To calculate the health index model of the model input data and model reference data of the measurement point, the power spectral coherence function is employed. The power spectral coherence function can be defined by the following formula:
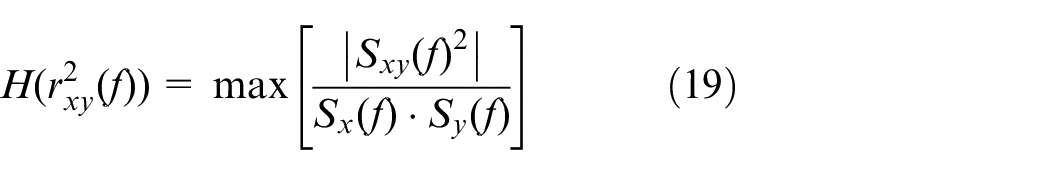
where x represents the DT model response signal, y represents the state signal to be evaluated,
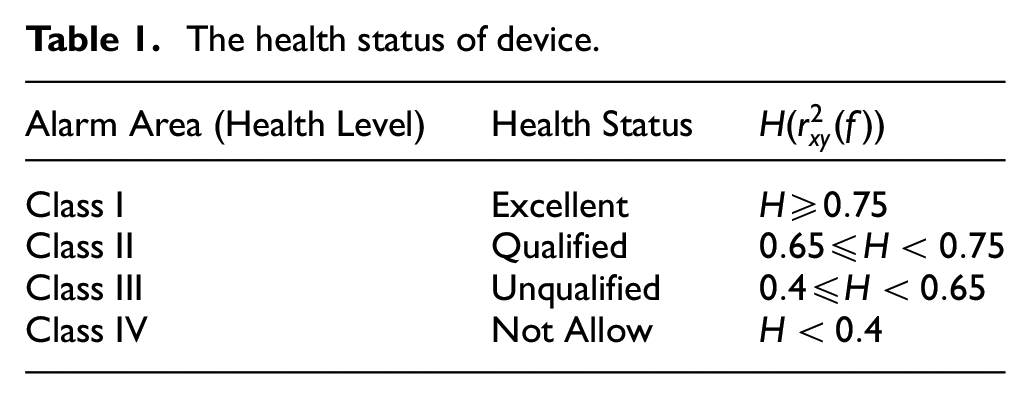
(1) According to DIN ISO 10816-1-1997, equipment is categorized into Class I, Class II, Class III, and Class IV based on the vibration assessment level of the chassis surface. The alarm area is further divided into Areas A, B, C, and D. Area A represents the state of newly delivered equipment or excellent conditions. Area B denotes equipment able to be operated for a long time or qualified equipment. Area C refers to equipment that can still be operated in the short term but requires corresponding remedial measures or unqualified equipment. Area D indicates the unqualified state that is not allowed.
(2) The health status of the device is divided into four health levels, as shown in Table 1.
(3) Evaluate the health status level of the equipment represented by the measurement point based on the calculation results.
(4) Formulate maintenance strategies based on specialized expertise and extensive maintenance experience.
The health status of device.
The following section presents the details of setting up the health index assessment model and showcases its performance in evaluating the health level of the device using historical alarm data, processing measures, and real-time collected data of the extruder gear reducer.
Results and discussions
Experimental platform and data collection
To validate the effectiveness of the proposed method, it is necessary to conduct experiments for verification. The experiments were carried out on the gear reducer of an extruder gear reducer in a petrochemical enterprise under actual operating conditions by following operation and maintenance procedures. The experimental platform, depicted in Figure 6, consists of the gear reducer, motor, and load system. The key parameters of the experimental gearbox are as follows: the main motor operates at a power of 8000 kW and a speed of 1500 r/min. The gear reducer is a secondary gear transmission with a rated power of 8000 kW, an input speed of 1500 r/min, an output speed of 247.6 r/min, and a reduction ratio of 1:6.057. The primary pinion module is 12, with 26 teeth, while the primary large gear module is 12, with 63 teeth. The secondary pinion module is 16, with 24 teeth, and the secondary large gear module is 16, with 60 teeth. The lubricating oil in use has a grade of ISO VG 320, and the oil supply system has a flow rate of 270 L/min.
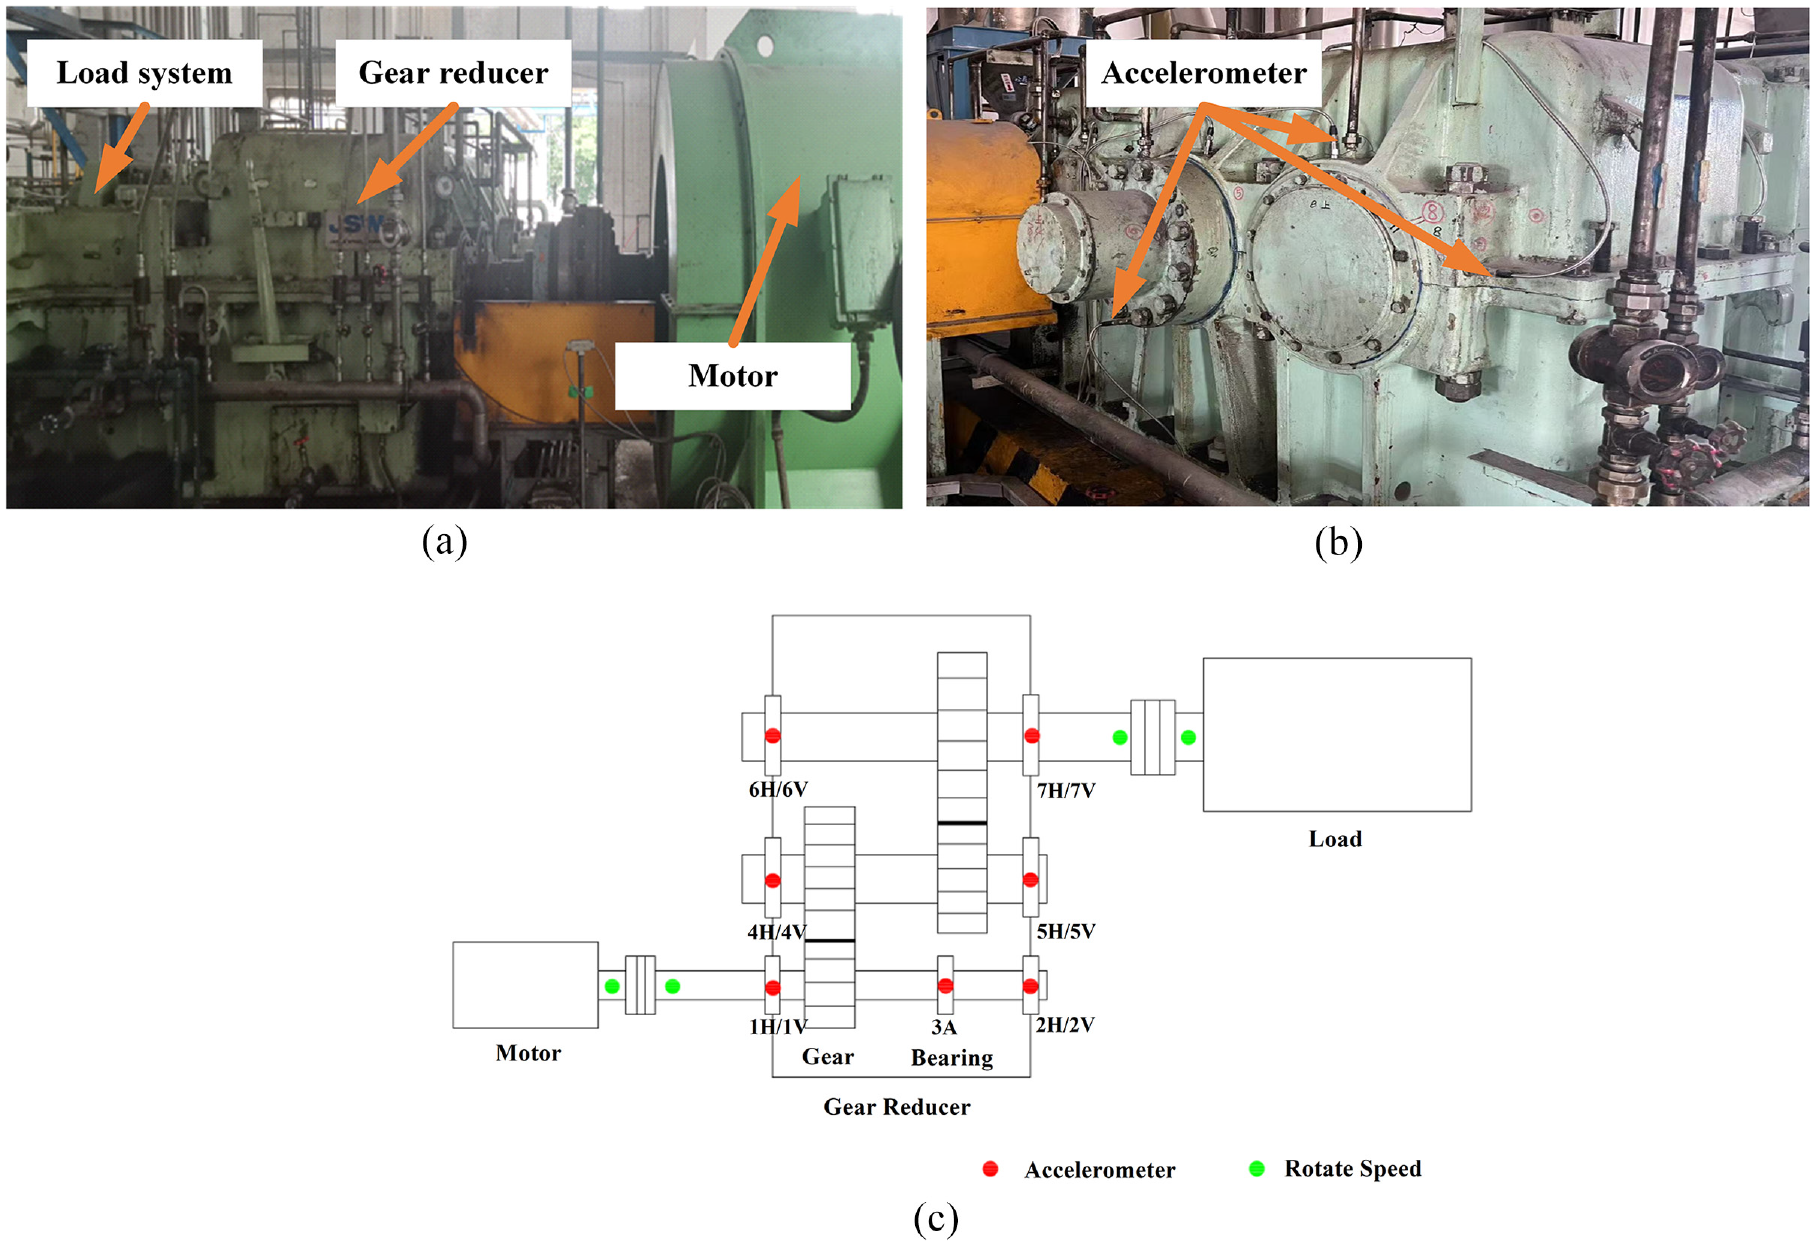
The experimental platform of extruder gear reducer: (a) a real picture of the gear reducer, (b) a real picture of the sensor deployment, and (c) a sketch map.
This study focuses on the extruder gear reducer by specifically examining its performance. The main motor operates at a power rating of 8000 kW. The support system falls under Class III equipment and offers rigid support in the measurement dimension. A longitudinal acceleration sensor (RH104) has been installed at the bearing position (3A) in the middle section of the primary shaft of the gear reducer. This sensor measures the axial vibration of the primary shaft. Additionally, sensors have been installed in the vertical and horizontal directions at corresponding shell positions of other bearings in the gearbox to measure vertical and horizontal vibrations. The data collected every 2 h during the test are vibration acceleration values. The sampling frequency is 5120 Hz with 4096 sampling points being identified. The sensor deployment is visualized in Figure 7.
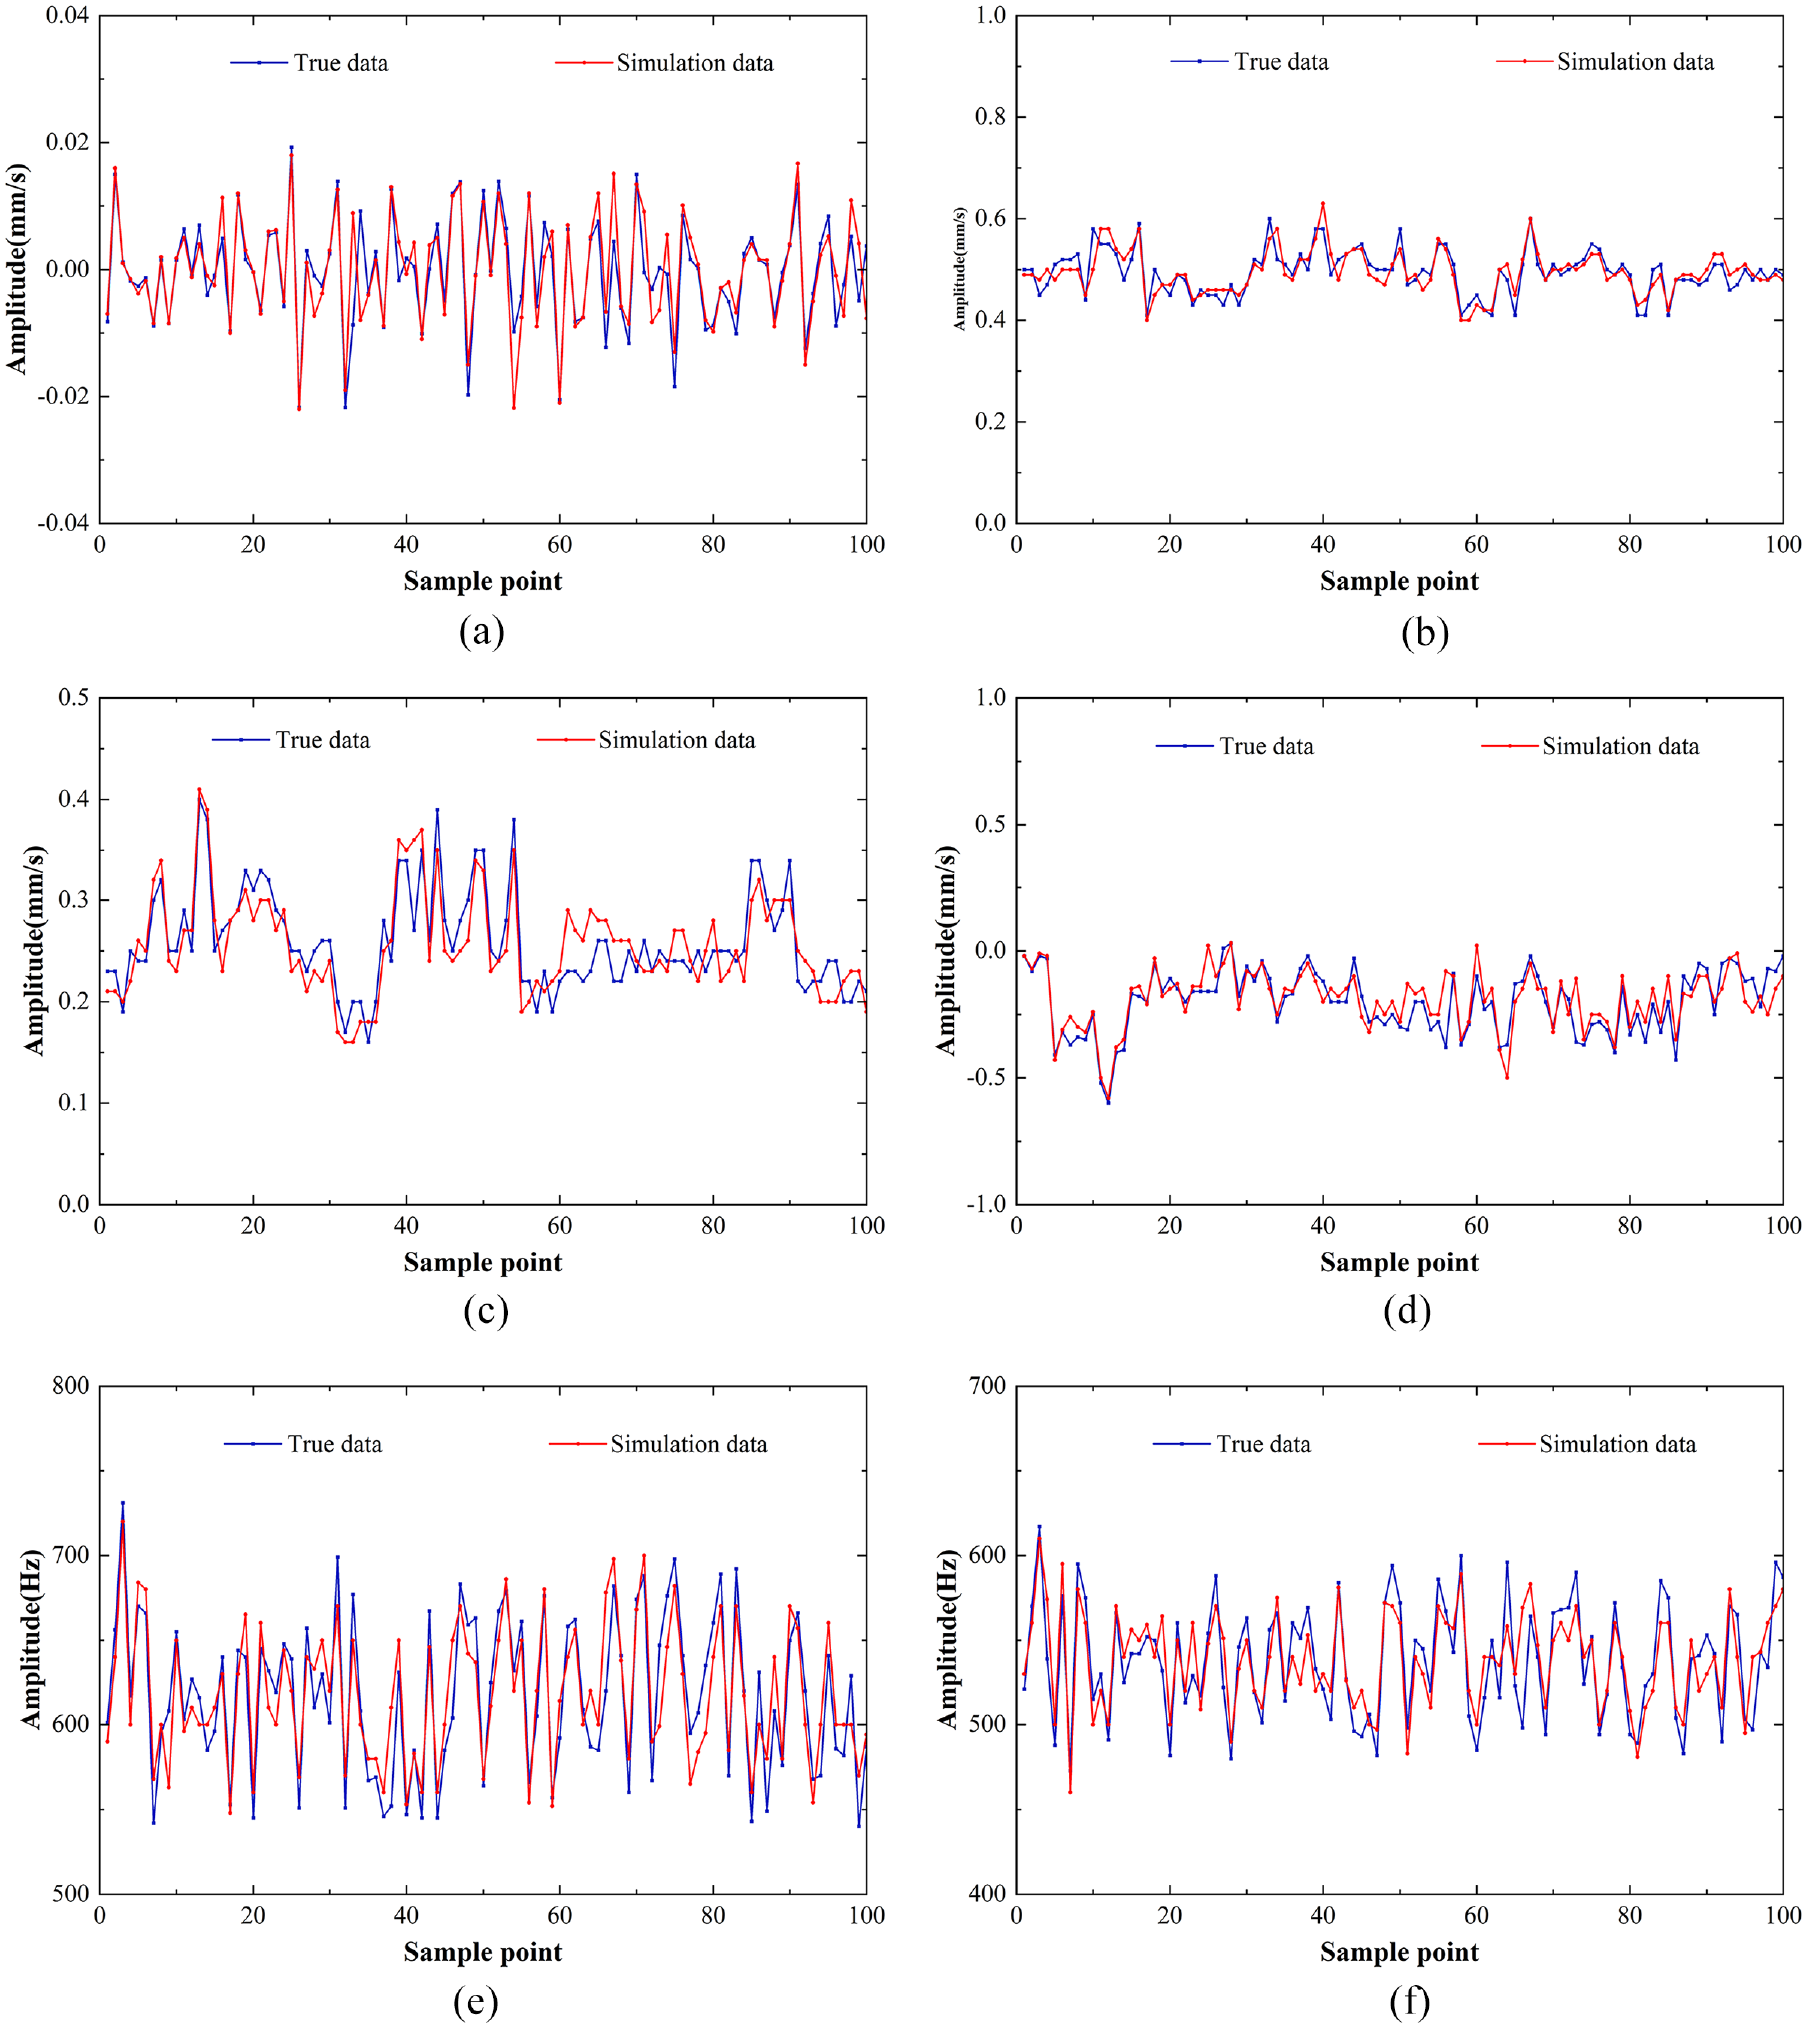
Comparison between the response characteristics of calibrated DT model and physical entity: (a) mean value, (b) root mean square value, (c) variance, (d) skewness, (e) frequency root mean square value, and (f) frequency variance.
The signals collected by the sensors are transmitted to the online monitoring station via signal cables. The online monitoring station then transmits the collected data to the data storage server through 5G for storage and remote data transmission, enabling real-time access to the data.
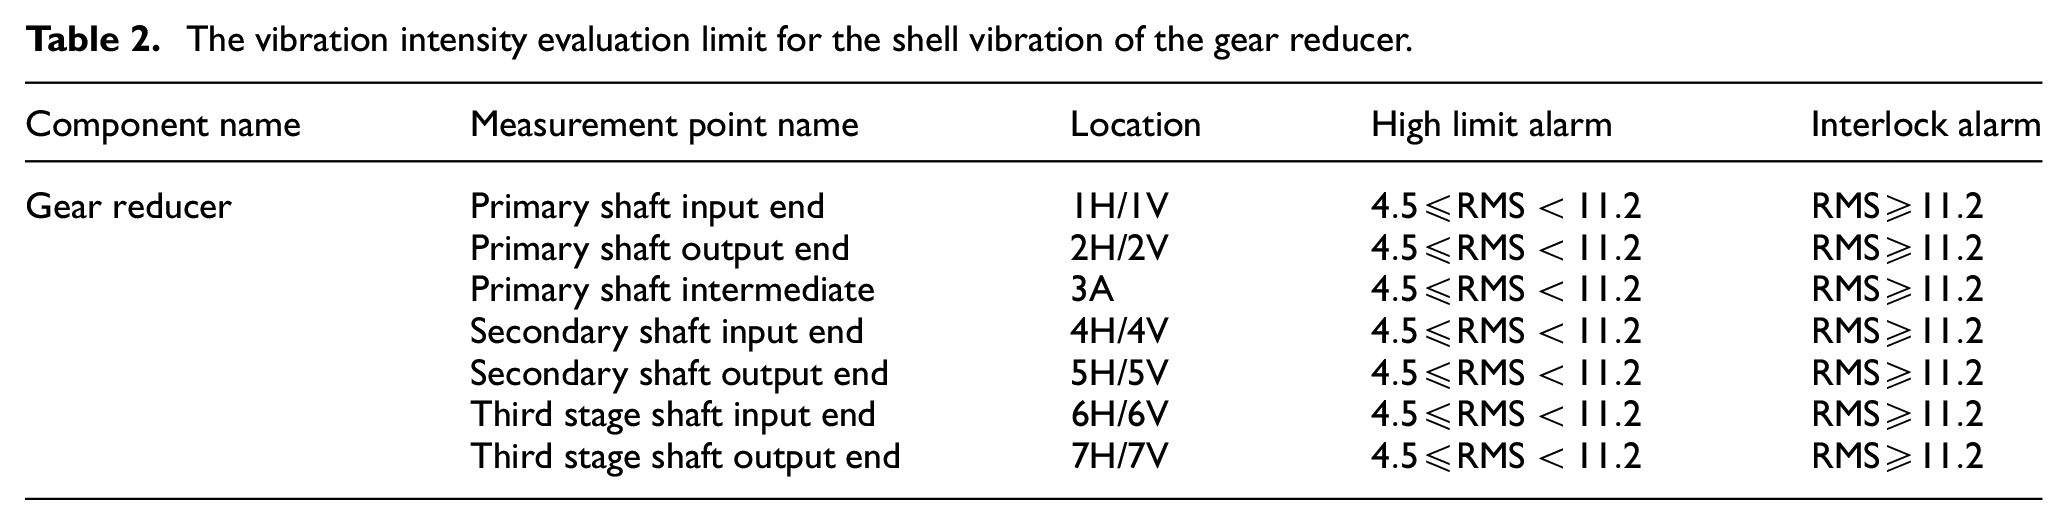
In accordance with the diagnostic criteria for rotating machinery in the petrochemical industry, the vibration velocity’s root mean square (RMS) is employed as a measuring parameter to depict the mechanical vibration condition. This parameter is determined by measuring the vibration velocity on the casing surface of equipment categorized as Class III, including the bearing cover.
Thus, the fixed alarm limits for shell vibration of the gear reducer are as follows:
(1) The alarm value in Area C is 4.5 mm/s, marked as a yellow light, indicating a high-limit alarm.
(2) The alarm value in Area D is 11.2 mm/s, marked as a red light, indicating an interlock alarm.
(3) The vibration intensity evaluation limit for the shell vibration of the gear reducer is shown in Table 2.
The vibration intensity evaluation limit for the shell vibration of the gear reducer.
Engineering application verification
A Python-based extruder gear reducer dynamic model has been developed. The model’s response time on a PC with an NVIDIA A100-40G GPU is approximately 2 min. The output of the dynamic model includes both time domain signals and frequency domain signals. As mentioned in section 2.2.1, the time domain characteristic signals and frequency domain characteristic signals in the healthy state are used to update and calibrate the dynamic model. In the experiments of this study, four time domain features are selected for normal operation analysis, namely average value, variance, RMS value, and skewness. Additionally, frequency variance and frequency RMS as two frequency domain features are extracted. The original waveform data is acquired through sensors, processed, and calculated to obtain the waveform data. The FFT can be used to obtain the spectrum.
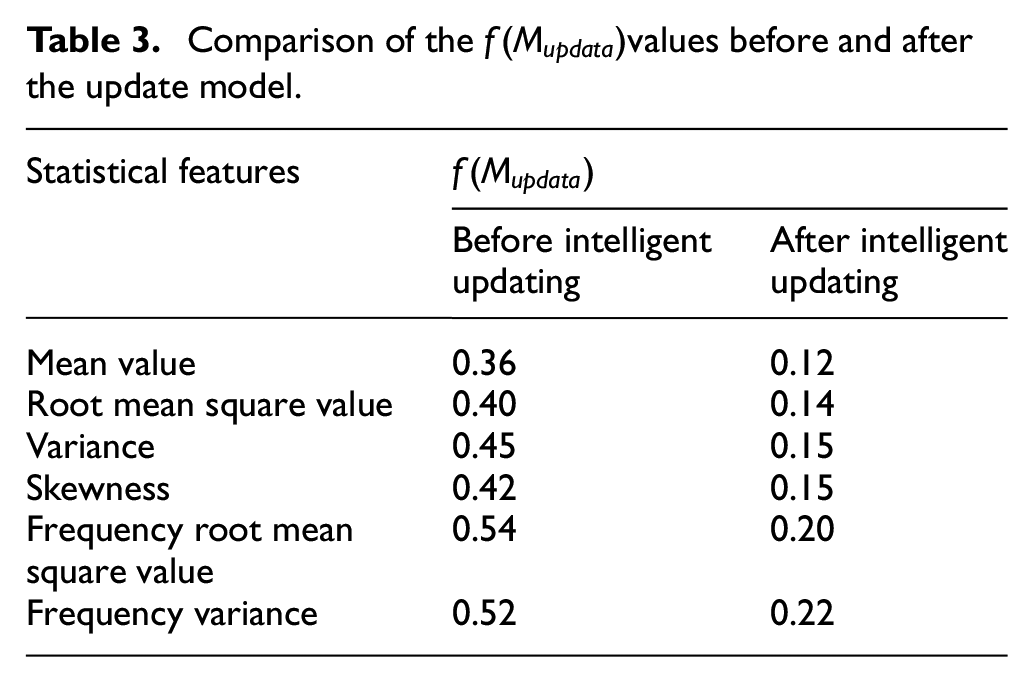
When updating the dynamic model, adjustments are made to the DT model of the extruder gear reducer to accurately reflect the changes in parameters. Through the utilization of equations (2) to (10), the optimal parameters for the model are determined. Figure 7 showcases a comparison between the response characteristics of the calibrated DT model and the physical entity. This visual illustration intuitively depicts several key factors including time domain average, variance, RMS value, skewness, frequency variance, and frequency of the simulation output from the updated DT model. The comparison between the data of the DT model and the actual collected data strongly resembles the real-life scenario. Additionally, Table 3 presents a detailed comparison of the
Comparison of the
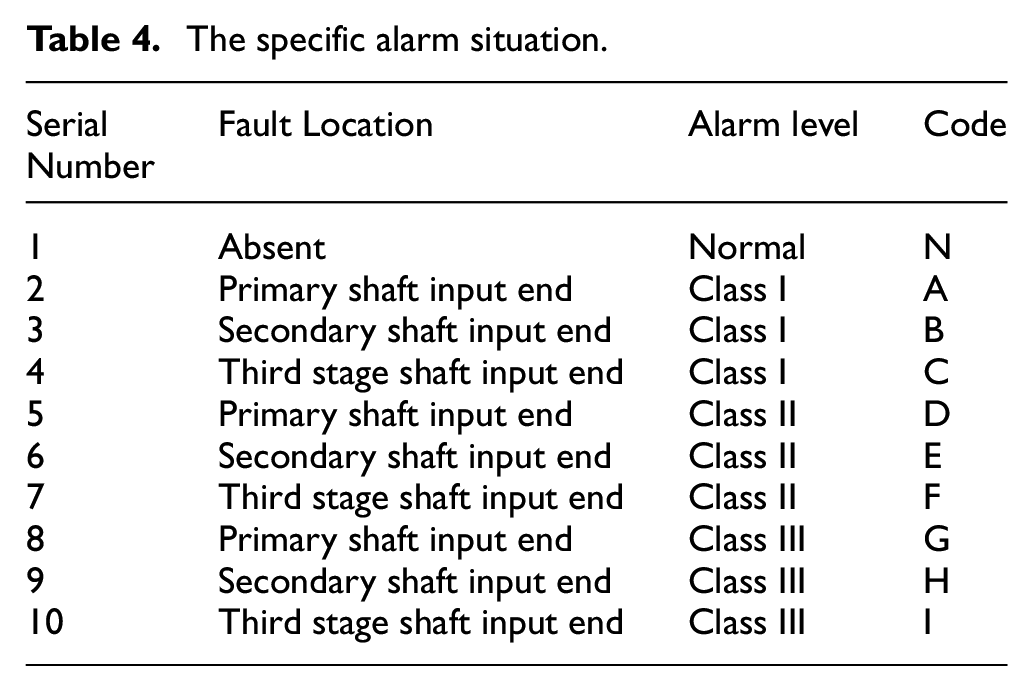
In order to transfer the model parameters, features, and instances in the database with DT simulation data to the actual application environment, researchers collected data from nine alarms that occurred during the operation of the gear reducer of the extrusion machine in this experiment. These nine alarms resulted in the equipment shutdown, and the specific alarm situation is shown in Table 4. After inspection, it was discovered that the gears exhibited varying degrees of fatigue damage. To migrate alarm conditions, the ADAM-FF method was employed. The simulated vibration signal served as the source data, while the actual measured vibration signal was taken as the target domain data. The objective was to identify the dynamic responses of the nine alarms. Table 4 shows a total of 10 state datasets, in which the normal operational status label is specified as N, and the 10 alarm labels are denoted as A, B, C, D, E, F, G, H, and I. Researchers have obtained datasets in 10 different states that were alternately used as target domain datasets, and a total of 10 migration scenarios could be established. In correspondence to the characteristics of each alarm state, the data samples simulated by the DT model were divided into 10 states, namely DTN, DTA, DTB, DTC, DTD, DTE, DTF, DTG, DTH, and DTI. The data generated by DT simulation was used as the source domain data sample, while the actual collected data was used as the target domain sample, resulting in a total of 10 migration scenarios, namely
The specific alarm situation.
The experimental data set consists of 200 samples for each type of state, with each sample containing 4096 data points, resulting in a total of 2000 samples. One hundred sixty samples were randomly selected as the training set for each type of state, while the remaining 40 samples were used as the test set. This created a training set of 1600 samples and a test set of 400 samples. The selection and division of these samples were performed to verify the feasibility of the proposed method. The conventional deep learning method CNN and four typical domain adaptation networks (namely MMD, MCD, DAN, and DANN) were selected for comparative analyses for a comprehensive evaluation. Stochastic gradient descent was used for training, with a batch size of 64 and all methods being trained for 100 iterations. The comparison results of the diagnosis accuracy for 10 different migration tasks can be found in Table 5.
The comparison results of the diagnosis accuracy (%).
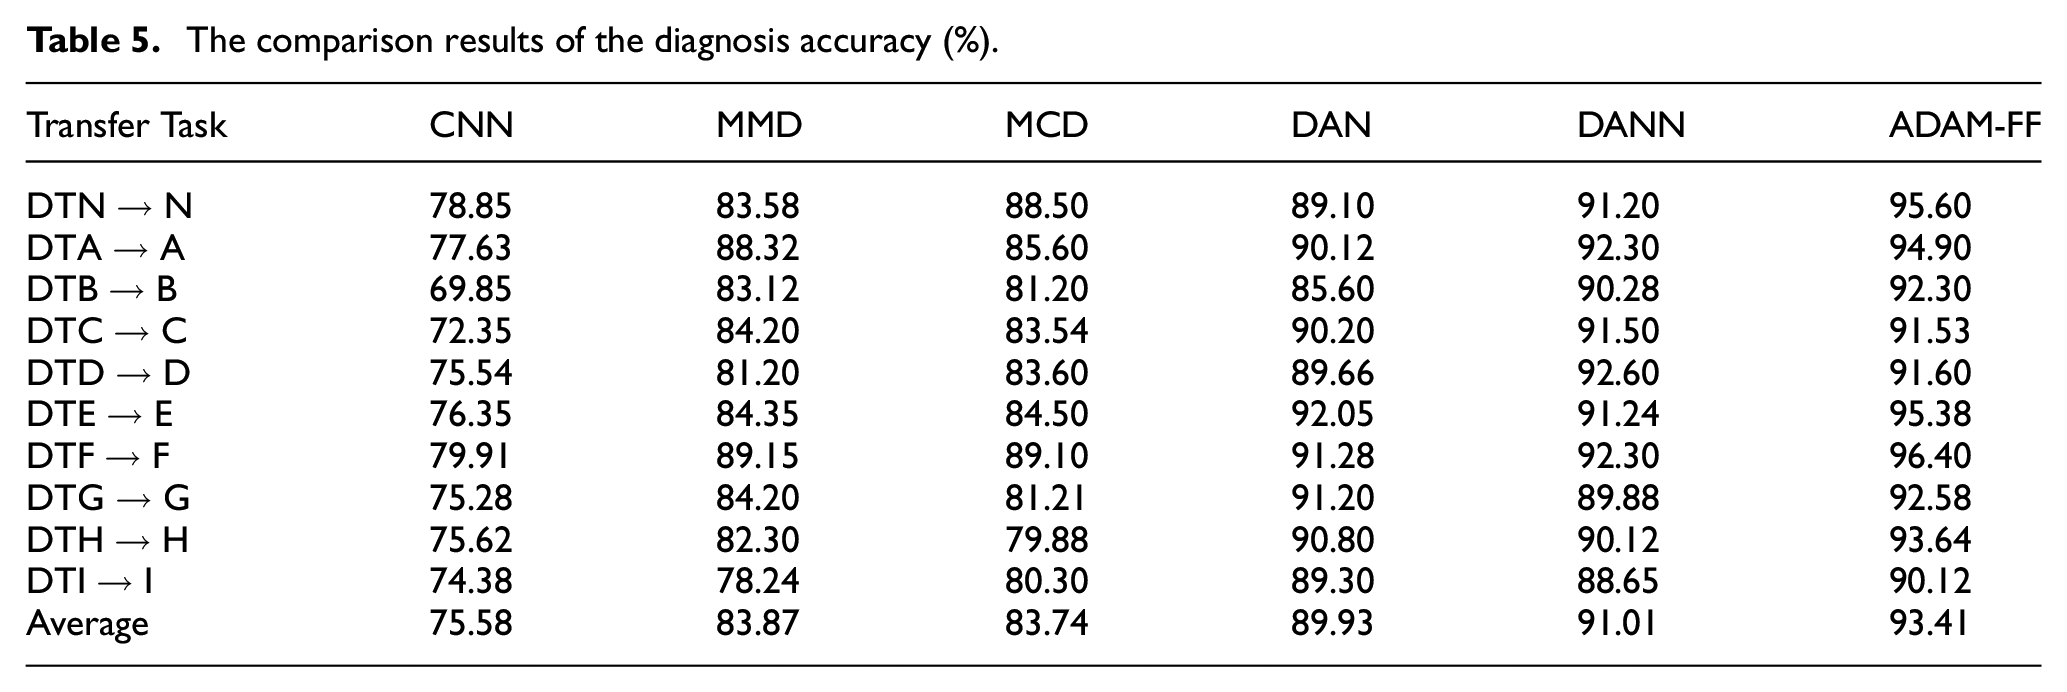
According to Table 5, among five methods, the ADAM-FF model demonstrated remarkable advantages in experimental data samples. CNN without the transfer learning method achieved an average recognition accuracy of only 75.58%, indicating that a model trained solely on data set samples of the source domain cannot be directly applied to status recognition of the target domain data set. Additionally, the ADAM-FF model delivered an average accuracy of 93.41% in this sample set. Therefore, this experiment confirms the effectiveness and superiority of the ADAM-FF method.
To further analyze the classification performance of ADAM-FF, a confusion matrix, as shown in Figure 8, is utilized in this study. The x-axis represents the labels predicted by the DT model, while the y-axis represents the actual labels. Each row in the confusion matrix corresponds to the true class, while each column corresponds to the predicted class. The numbers on the diagonal indicate the prediction accuracy for each instance. Upon comparing the diagnostic accuracy of different methods in Figure 8, it is evident that the proposed ADAM-FF achieved superior accuracy among all alarm scenarios, while the other five methods exhibited misjudgments in certain states. CNN, for instance, made classification errors in diagnosing each state, DANN merely reached an accuracy rate of 30%, and G was mistakenly identified as E or F. In short, the ADAM-FF method outperformed both the domain-free adaptation method and the conventional method.
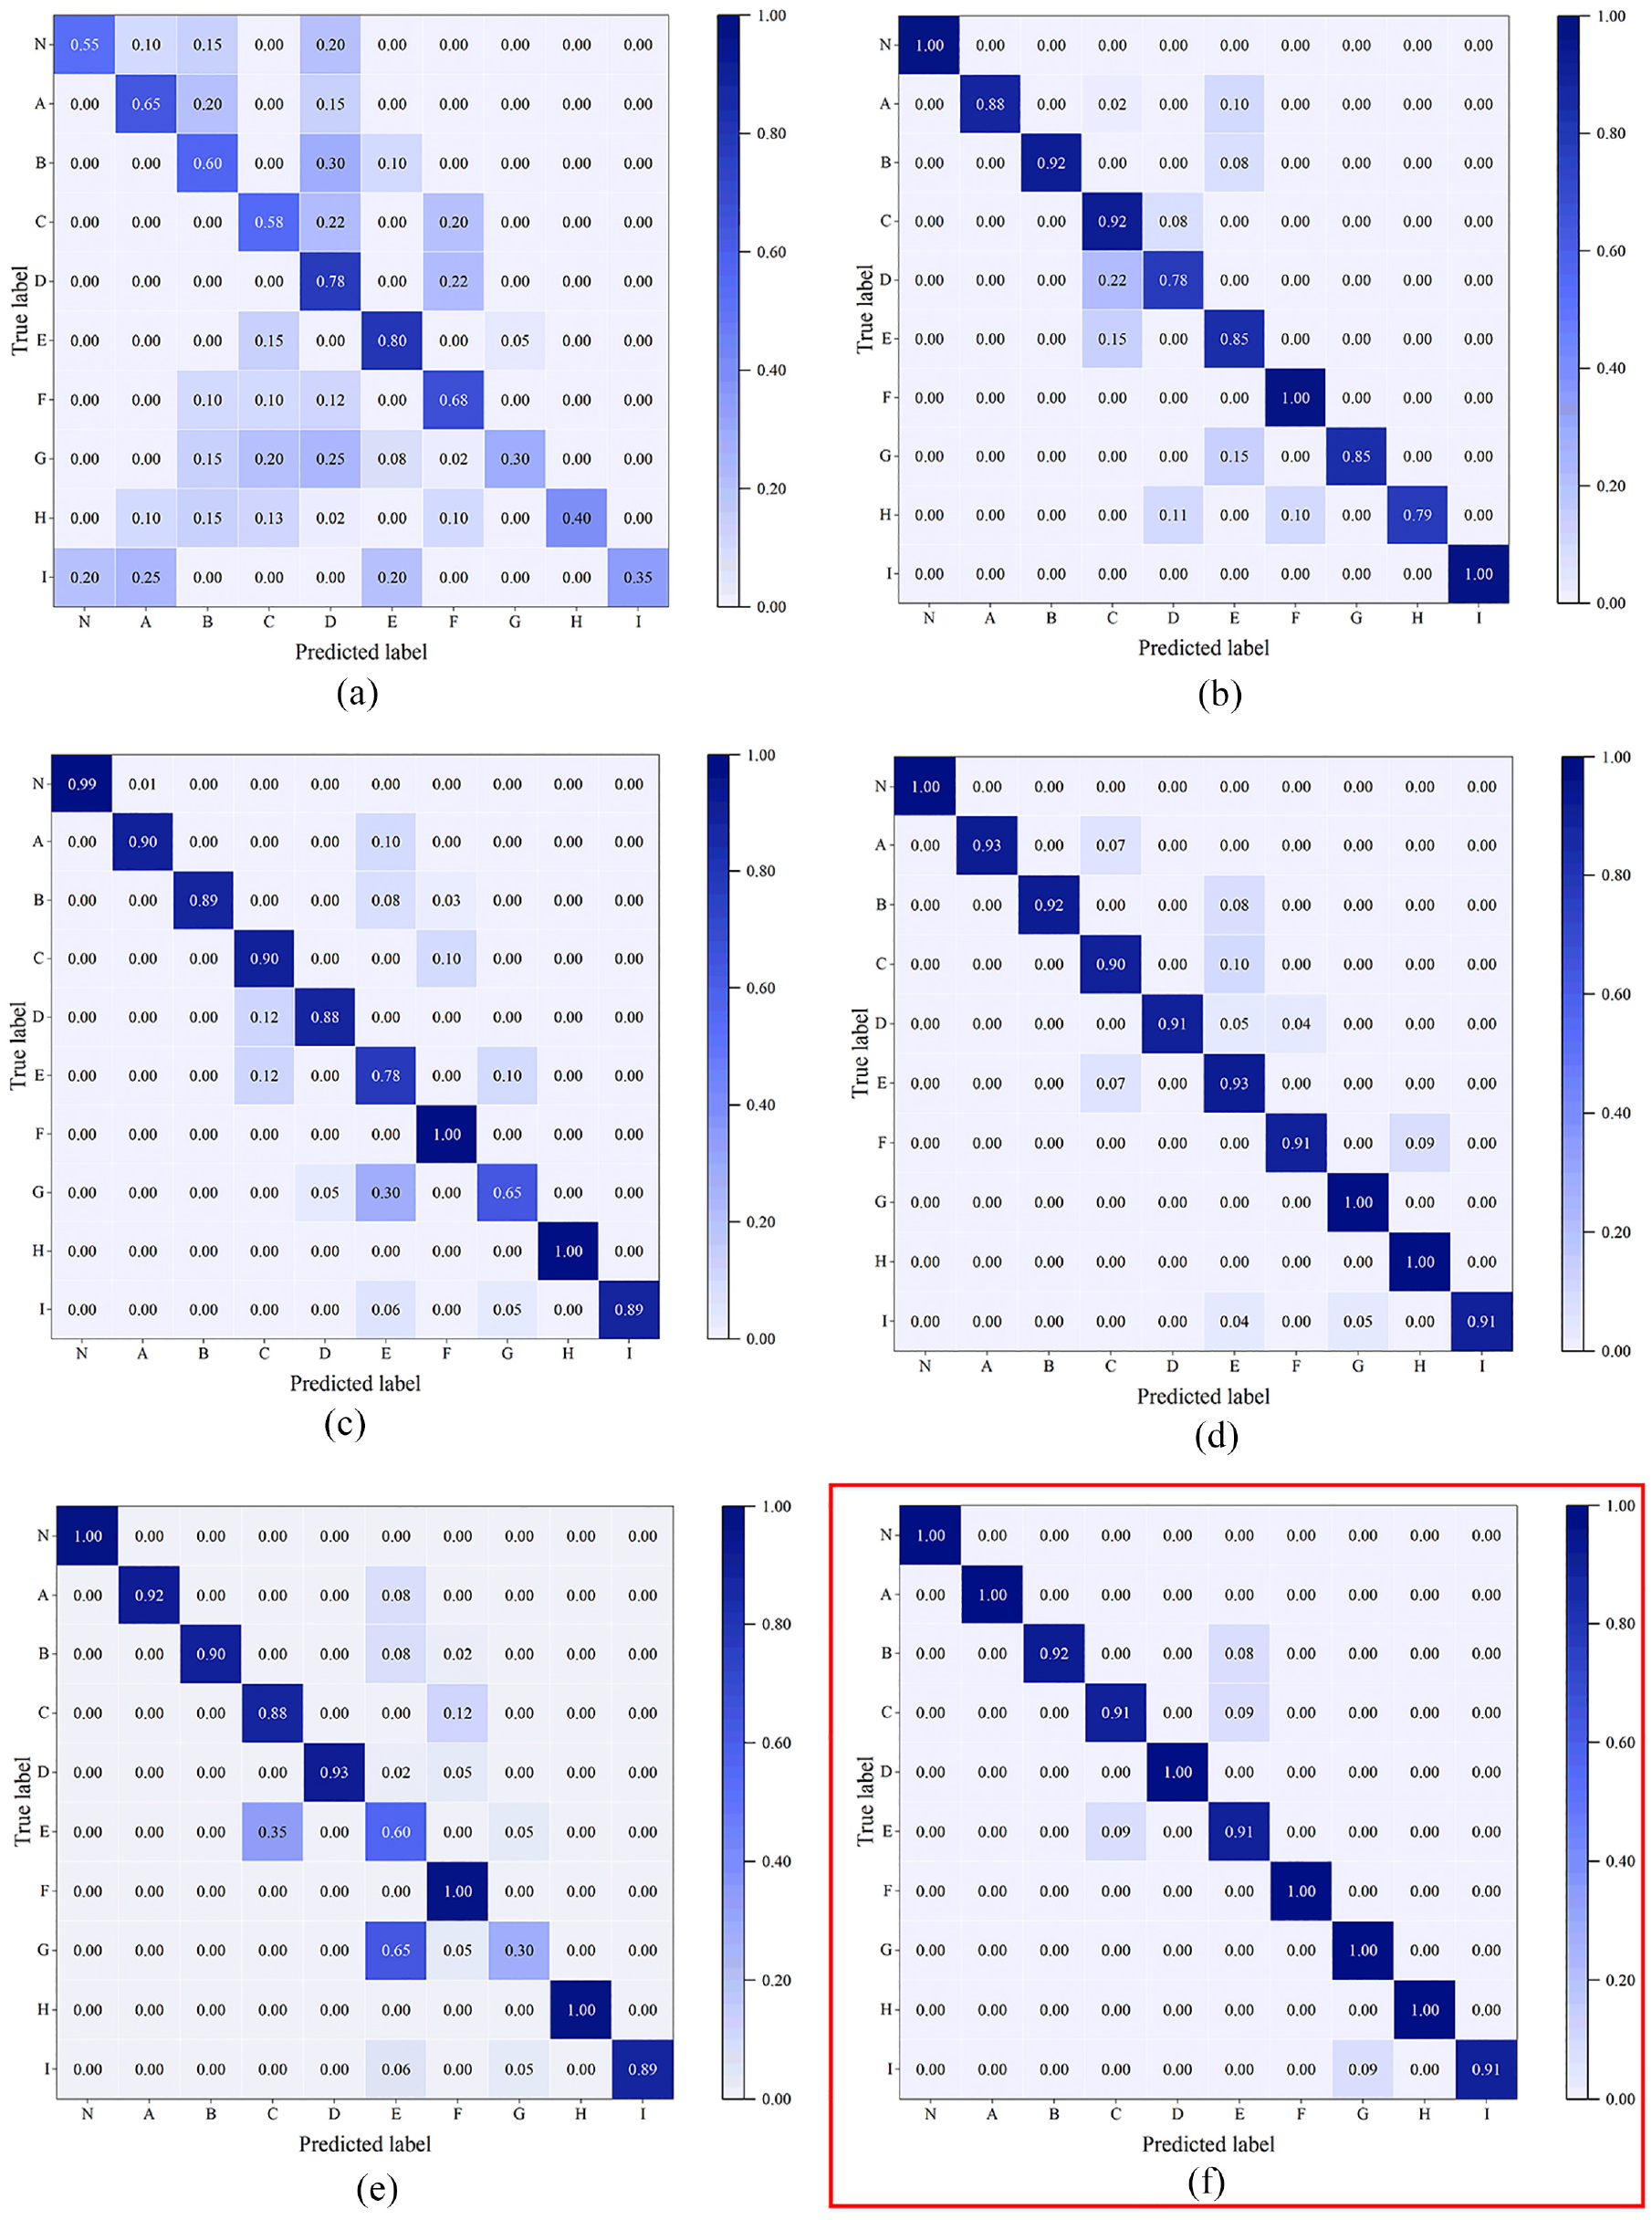
Comparison of confusion matrix: (a) CNN, (b) MMD, (c) MCD, (d) DAN, (e) DANN, and (f) ADAM-FF.
To further demonstrate the performance of ADAM-FF, t-SNE technology is adopted to visualize the feature extraction and classification generated by ADAM-FF. The visualization results are shown in Figure 9.
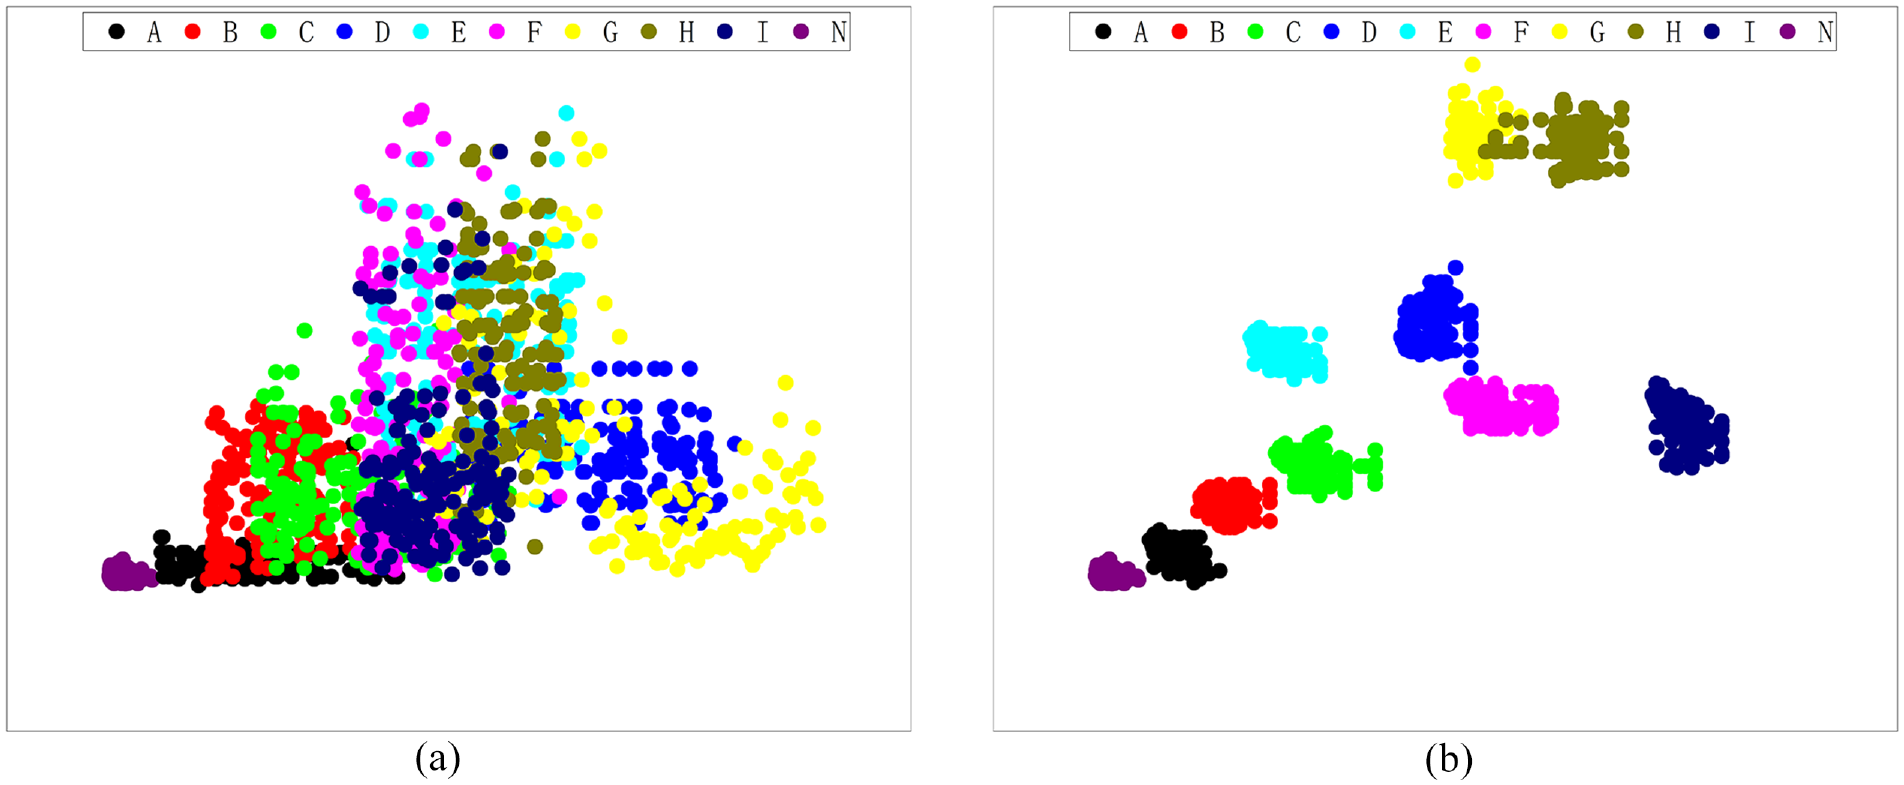
The visualization results: (a) classification of data samples before migration and (b) classification of data samples after migration.
Figure 9(a) and (b) show the original data of the training set and the feature data extracted from the training set, respectively. It can be seen that ADAM-FF exhibits excellent feature extraction ability, and the features of various fault states in space show an obvious separability. As a result, directly using the source data to evaluate the characteristics of measured data couldn’t yield satisfactory outcomes. Figure 9 showcases that by introducing an adversarial-based domain adaptation model, the evaluation accuracy is greatly enhanced compared with traditional methods. Nonetheless, instances where feature overlaps between alarms A and B and between alarms B and C are identified still exist. In contrast, by leveraging the adversarial domain adaptation models, both domain alignment and class alignment can be effectively achieved, thus facilitating the accurate assessment of degradations.
Results of the health index assessment model
The constructed equipment health index assessment model is verified through engineering by employing alarm case data of the extruder gear reducer. The parameters of the extruder gear reducer from a petrochemical enterprise are introduced in section 3.1. Table 2 shows the upper limit standards for vibration at each measurement point. A total of 1600 sets of gearbox signal data are collected before and after the alarm occurs during operation, which includes normal status signals and fault signals. This data segment is divided into four groups, as shown in Table 6.
The grouping details of the four groups data.
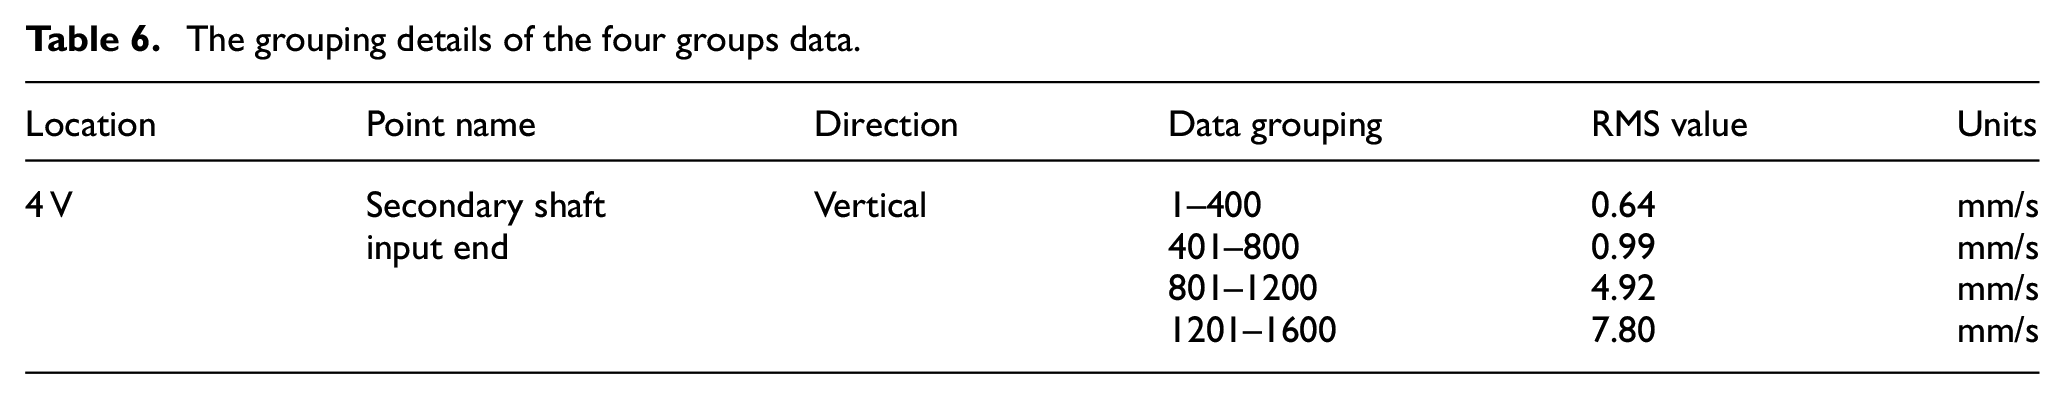
The equipment health index assessment model proposed in section 2.3 was utilized in this study. The actual operation reference is determined by calculating the RMS value of the vibration speed before and after the alarm occurs, including the normal state and the characteristic value after the alarm occurs. To simulate the gear transmission system, the DT model is employed to obtain the benchmark data of the vibration velocity RMS. Using the simulated real-time vibration velocity RMS, health degree as the correlation coefficient is calculated by the constructed health index assessment model. Additionally, the mapping relationship between gear health representation and operational status is verified using prior knowledge.
Figure 10 presents the RMS data of the vibration speed for 1600 sets of operations before and after the gear reducer alarm, where the curve trend reveals that the 851st set of data recorded a value of 4.58 mm/s, triggering a “high limit alarm” at that point. Similarly, the 1539th set of data measured 11.2 mm/s, resulting in the activation of an “interlock alarm.”
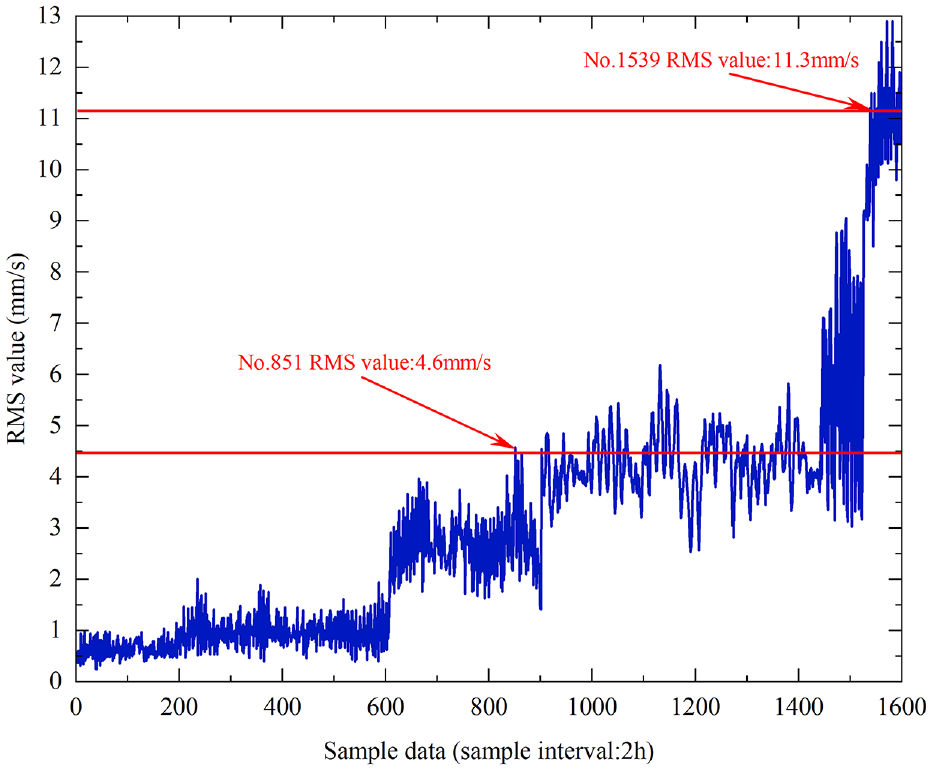
The RMS data of the vibration speed for 1600 sets of operations before and after the gear reducer alarm.
Figure 11 illustrates the comparison of the health state representation between RMS and the health index. As anticipated, the health index was derived from the equipment health index evaluation model. At the 741st data moment, the health index was found to be lower than 0.65, triggering the first “Alarm.” Similarly, when the 1300th set of data fell below 0.4, a second “alarm” was issued.
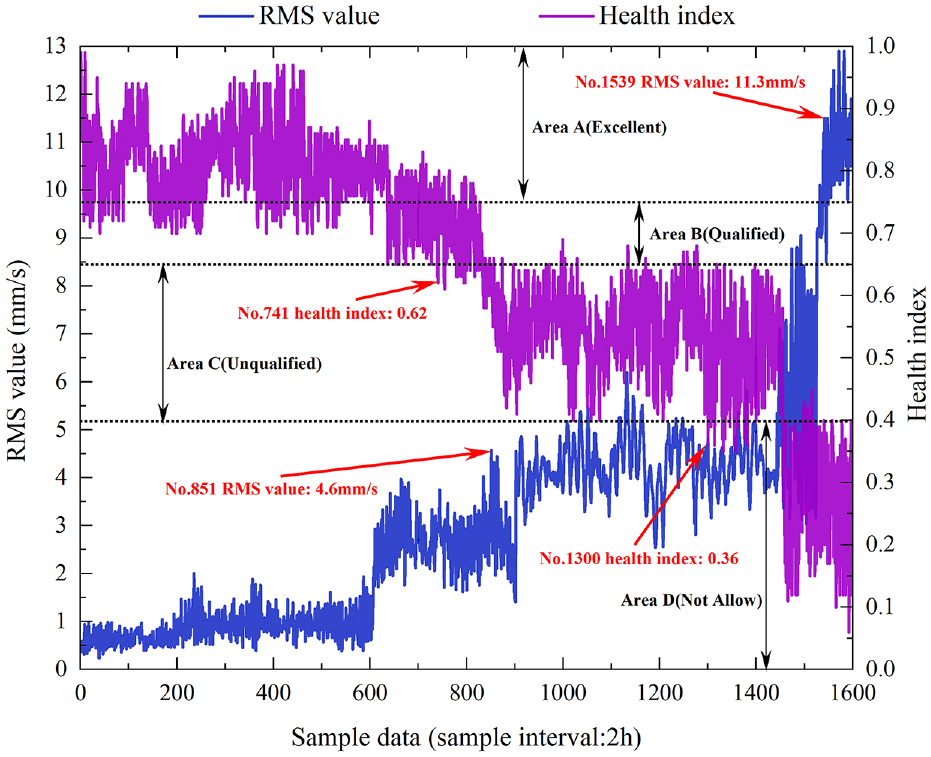
Comparison of health state representation between RMS and health index.
The equipment health index assessment model provided 110 sets of data earlier than the actual conclusion of the recommended shutdown. Each set of data shows a sampling interval of 2 h, allowing for a predictive time advantage of 220 h. This holds practical implications for achieving predictive maintenance and preventing unplanned downtime. Thus, the experiment has verified the use of simulation data to directly evaluate the equipment health level based on the model results.
Conclusion
Simulation-driven fault detection based on the novel adversarial domain adaptation model is presented in this paper. The method, by constructing the extruder gear reducer’s DT model based on MOSSA, effectively addresses the issue of insufficient real gear transmission system fault samples. The ADAM-FF model aligns the features of simulation samples and generated samples to obtain complete fusion samples. In this study, these fusion samples were used for model training and testing and were classified using n softmax classifiers. The introduction of an equipment health index assessment model driven by the simulation model allowed for accurate and non-destructive evaluation of the fault generation process, quantitative characterization of equipment degradation, and prediction of fault occurrences in advance. In this study, we utilized the fault datasets from the extruder gear reducer of a petrochemical company to conduct the migration tasks. We compared the average classification accuracy of ADAM-FF with other methods such as CNN, MMD, MCD, DAN, and DANN. The results showed that ADAM-FF achieved an accuracy of 93.41%. Experimental results have demonstrated that the proposed fault detection method outperforms conventional machine learning fault detection methods by the accuracy criterion. Furthermore, the generated fusion samples can be seamlessly applied to real-world engineering applications, providing practical implications in the detection of unknown faults and prevention of unplanned shutdowns.
However, this method still poses certain limitations and requires further improvement. The modeling of mechanical systems in major equipment involves multiple disciplines related to mechanics, electrics, and control. Moreover, it’s time-consuming to model and simulate complex machinery. Therefore, it is crucial to explore cross-domain modeling methods and develop lightweight models to reduce simulation time. Additionally, ensuring the similarity of fault characteristics between simulation samples and actual measurement samples remains challenging. This calls for further research into model optimization and feature extraction techniques. Overall, the integration of model simulation and deep learning algorithms for fault detection, rather than utilizing them independently, is considered to hold much promise for development.
Footnotes
Declaration of conflicting interests
The author(s) declared no potential conflicts of interest with respect to the research, authorship, and/or publication of this article.
Funding
The author(s) disclosed receipt of the following financial support for the research, authorship, and/or publication of this article: This work was supported by the China Academy of Machinery Science and Technology Group Co., Ltd. for the “Major Equipment Gear Transmission Device Health Management and Control System and Intelligent Cloud Platform” (Grant: 242109Y).
Data sharing agreement
The datasets used and/or analyzed during the current study are available from the corresponding author on reasonable request.