
Abstract
The issue of quality-related fault detection in the industrial process has attracted much attention in recent years. The partial least squares (PLS) is considered an efficient tool for predicting and monitoring. The modified partial least squares (MPLS) is an extended algorithm for solving the oblique decomposition of PLS, however, the study indicated that the loss of quality variable information may affect the prediction of quality information in the decomposition process of the MPLS algorithm. Furthermore, the detection rate of traditional statistics and static control limit is low, and the existing dynamic control limit has certain limitations. Therefore, a new PLS space-decomposition algorithm called advanced partial least squares (APLS) is proposed. APLS avoids the loss of quality information by orthogonal decomposition of process variables according to their relationship with quality. APLS has a more accurate prediction of quality when process variables contain more noise; the fault false alarm rates (FAR) of quality-related faults are reduced by using the new statistics and thresholds combined with local information increment technology in the process variable principal component subspace. Finally, the effectiveness of the proposed approach is verified by a numerical example and an industrial benchmark problem.
Keywords
Introduction
The issue of quality-related fault detection1,2 has attracted much attention in recent years. The partial least squares3,4 (PLS) is a popular method of multivariate statistical process monitoring.5,6 Thanks to its efficiency in processing huge amounts of highly correlated plant data, PLS is recognized as a powerful tool for data-driven7–10 model establishment, fault detection and diagnosis. 11 Since the final quality of the product receives more attention from technicians, PLS is suitable for monitoring and predicting critical performance indicators in industrial production. PLS can decompose the process variable into spaces that are related to the product quality and unrelated to the product quality. By monitoring the former, it is convenient to detect the faults of the production process and understand the quality change of the product indirectly. Because the quality-unrelated spaces have no impact on the product quality, no monitoring is required. Therefore, PLS is an efficient method as a whole for improving product quality and production efficiency by reducing FAR and increasing the fault effective alarm rates (EAR) 12 in quality-related fault detection. The quality-unrelated faults, while having a minimal impact on the product’s quality, hold significant importance for the overall health monitoring of the system. Doostmohammadian et al.13,14 discuss fault detection and isolation via networked estimation in their study for both full-rank and rank-deficient dynamical systems. These scenarios are accompanied by the presence of system and measurement noise. These studies provide crucial guidance for monitoring quality-unrelated faults and hold significant research value in observing the system’s health status.
In the classic PLS algorithm, a model with normal data is first developed, and then the model parameters are obtained to perform spatial decomposition on the testing data. Finally, the corresponding statistics and thresholds are calculated in the decomposed space to use the fault criterion for fault detection. However, Li et al. 15 shows the classic PLS performed an oblique decomposition on process space, which resulted in the significant process variable information remaining in the residual subspace directly. To achieve complete monitoring of quality-related information, Zhou et al. 16 proposed a preprocessing approach called total projection to latent structures (T-PLS) by further decomposing the score and load matrices of the classic PLS. However, T-PLS unnecessarily decomposes process variables into four spaces, which makes the algorithm model even more complicated. Therefore, Yin et al. 17 proposed a modified PLS (MPLS) to solve the orthogonal problem. The MPLS algorithm decomposes the quality variable into two orthogonal parts directly according to the relationship between the quality variable and the process variable, followed by using the relational matrix obtained to decompose the process variables. Soon later, Wang and Yin 18 develop an enhanced method to solve the same problem effectively by combining orthogonal signal correction with the MPLS. To improve the fault detection rate of the algorithm in practical applications, a new spatial decomposition algorithm should be designed. Besides, the fault detection rate can be improved by designing new statistics and thresholds in the corresponding subspace, and the local information increment technology19,20 is an effective method to achieve this goal. The local information increment technology mainly calculates the local information increment mean and local dynamic threshold by defining a local covariance matrix, and reduces the data when updating the covariance matrix with a fixed threshold window. The statistics obtained by APLS are calculated based on the data close to the current time, which can eliminate the influence of correlation between two adjacent samples. The statistics of APLS can better reflect the actual changing characteristics of the data.
Note that the space decomposition of MPLS may cause the loss of output information and cannot orthogonally decompose the input according to the relationship between the input and the output correctly. Besides, the aforementioned methods generally use the traditional statistical and threshold design methods, which may result in high FAR and low EAR as a whole. To tackle these problems, the key contributions of this work are summarized as follows: (1) A new multi-space class algorithm called advanced partial least squares (APLS) is proposed to solve the problem of quality information loss, where the desired process variable decomposition form is first given. The process variable is orthogonally decomposed into two parts: one is only related to the quality (called principal subspace, PS), and the other is unrelated to the quality (called residual subspace, RS). (2) To solve the problem of low quality-related fault detection rate, the new statistics and thresholds are calculated in PS combined with local information increment technology in APLS, and the detection performance of the algorithm is improved. (3) To remove the noise variation interference from process variables and improve the prediction accuracy of the quality-related information. Then, the quality variables are orthogonally decomposed into predictable quality information subspace and unpredictable quality information subspace according to the coefficient matrix between the quality variables and PS.
The rest part of this paper is organized as follows. In section “Related work,” the MPLS-based fault-detection method is reviewed and the problem is formulated. Section “Proposed fault detection approach” describes the proposed approach in detail. In Section “Numerical example and case study,” a numerical example and a case study are carried out respectively to test the performance of the proposed approach. Finally, the conclusion is presented in Section “Conclusion.”
Related work
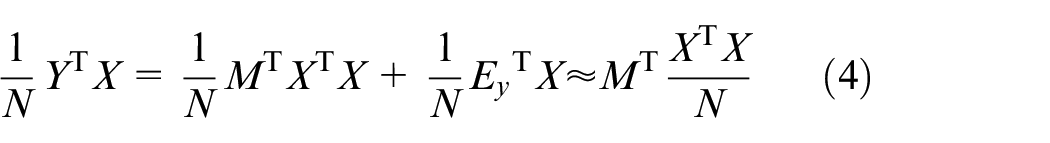
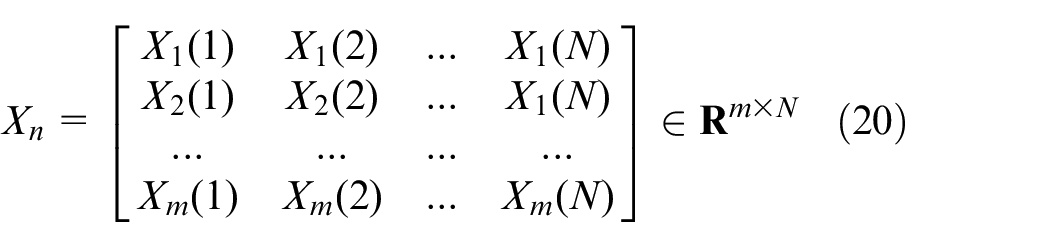
The MPLS algorithm is an extended algorithm to address the oblique decomposition problem of the classic PLS. It first gives the input matrix and the output matrix as follows:


where N represents the number of samples, m and l represent the number of variables of input

where
Therefore, the relationship information matrix

As can be seen from formula (5),
Proposed fault detection approach
In this section, a new spatial decomposition algorithm APLS is proposed to deal with the shortcomings of MPLS. It is mainly involved in the spatial decomposition principle of the APLS algorithm, the statistical and threshold design method based on local information increment technology, and the detailed steps of the algorithm.
Complete space decomposition
The PLS algorithm aims to completely decompose the process variable

It should be emphasized that

where
According to (7), in the case of
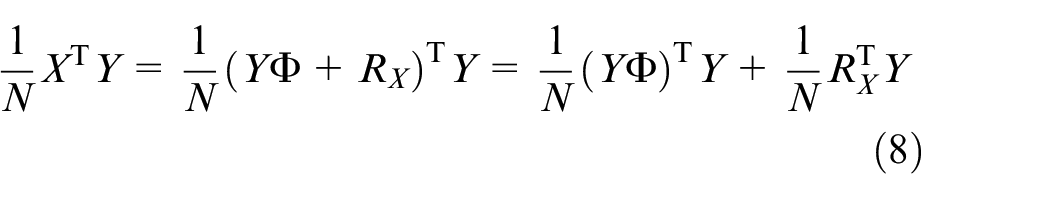
Since

Formula (9) can be equivalently transformed to the following expression:
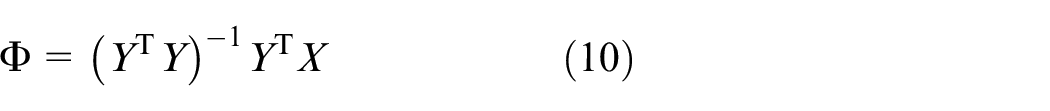
So far, the relation matrix
Perform SVD on matrix
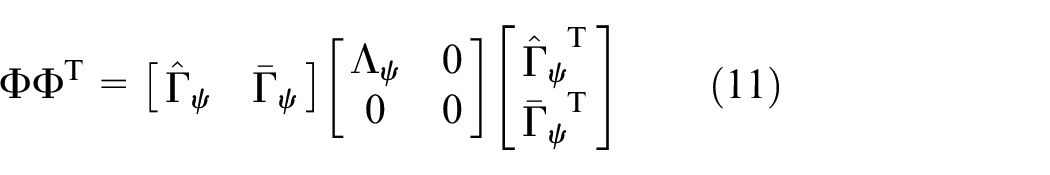
where
Construct orthogonal projection operator

Decompose


To achieve the above decomposition, perform SVD again on matrix

where

Decompose


The final APLS model is given as follows:

Note that
Local information increment
The local information increment technology is mainly used to calculate the local data covariance matrix, local information increment matrix, and local information increment mean of the data matrix. The problem that the thresholds are static can be solved by using the local information increment technology. The specific steps are as follows:
Give a set of observation data:
Preprocess the sampled data and calculate the mean vector
where

Choose the sampled data with a fixed window length L from normal data as the local data matrix:

where

It can be seen from formula (23) and (24) that the local data matrix formed by the common part of the two is

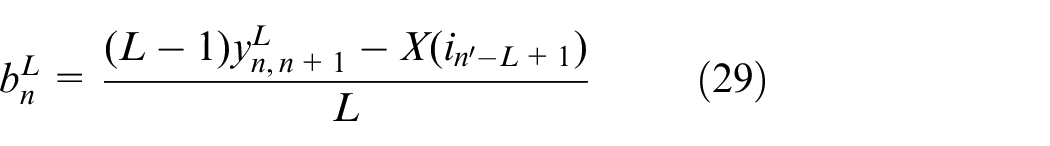
From (25), the mean vector defined by each sampling data can be obtained by
where
Then, the local covariance matrix of the
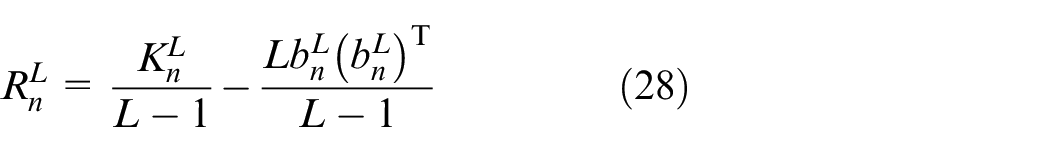
where
Similarly, the following relationships exist on the
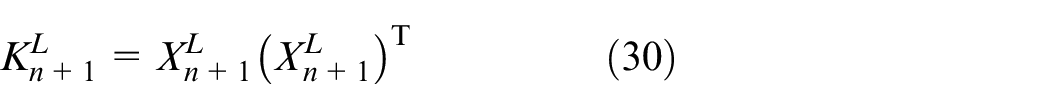
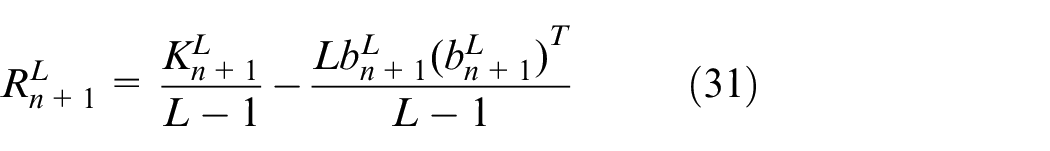
From (28) and (31), the local information increment matrix

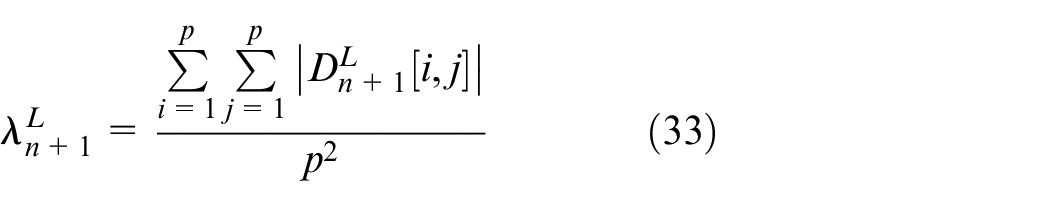
The average local information increment of the
Calculate the local dynamic threshold as follows:
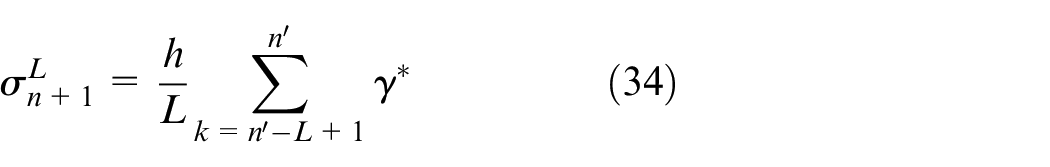
where
Proposed APLS approach
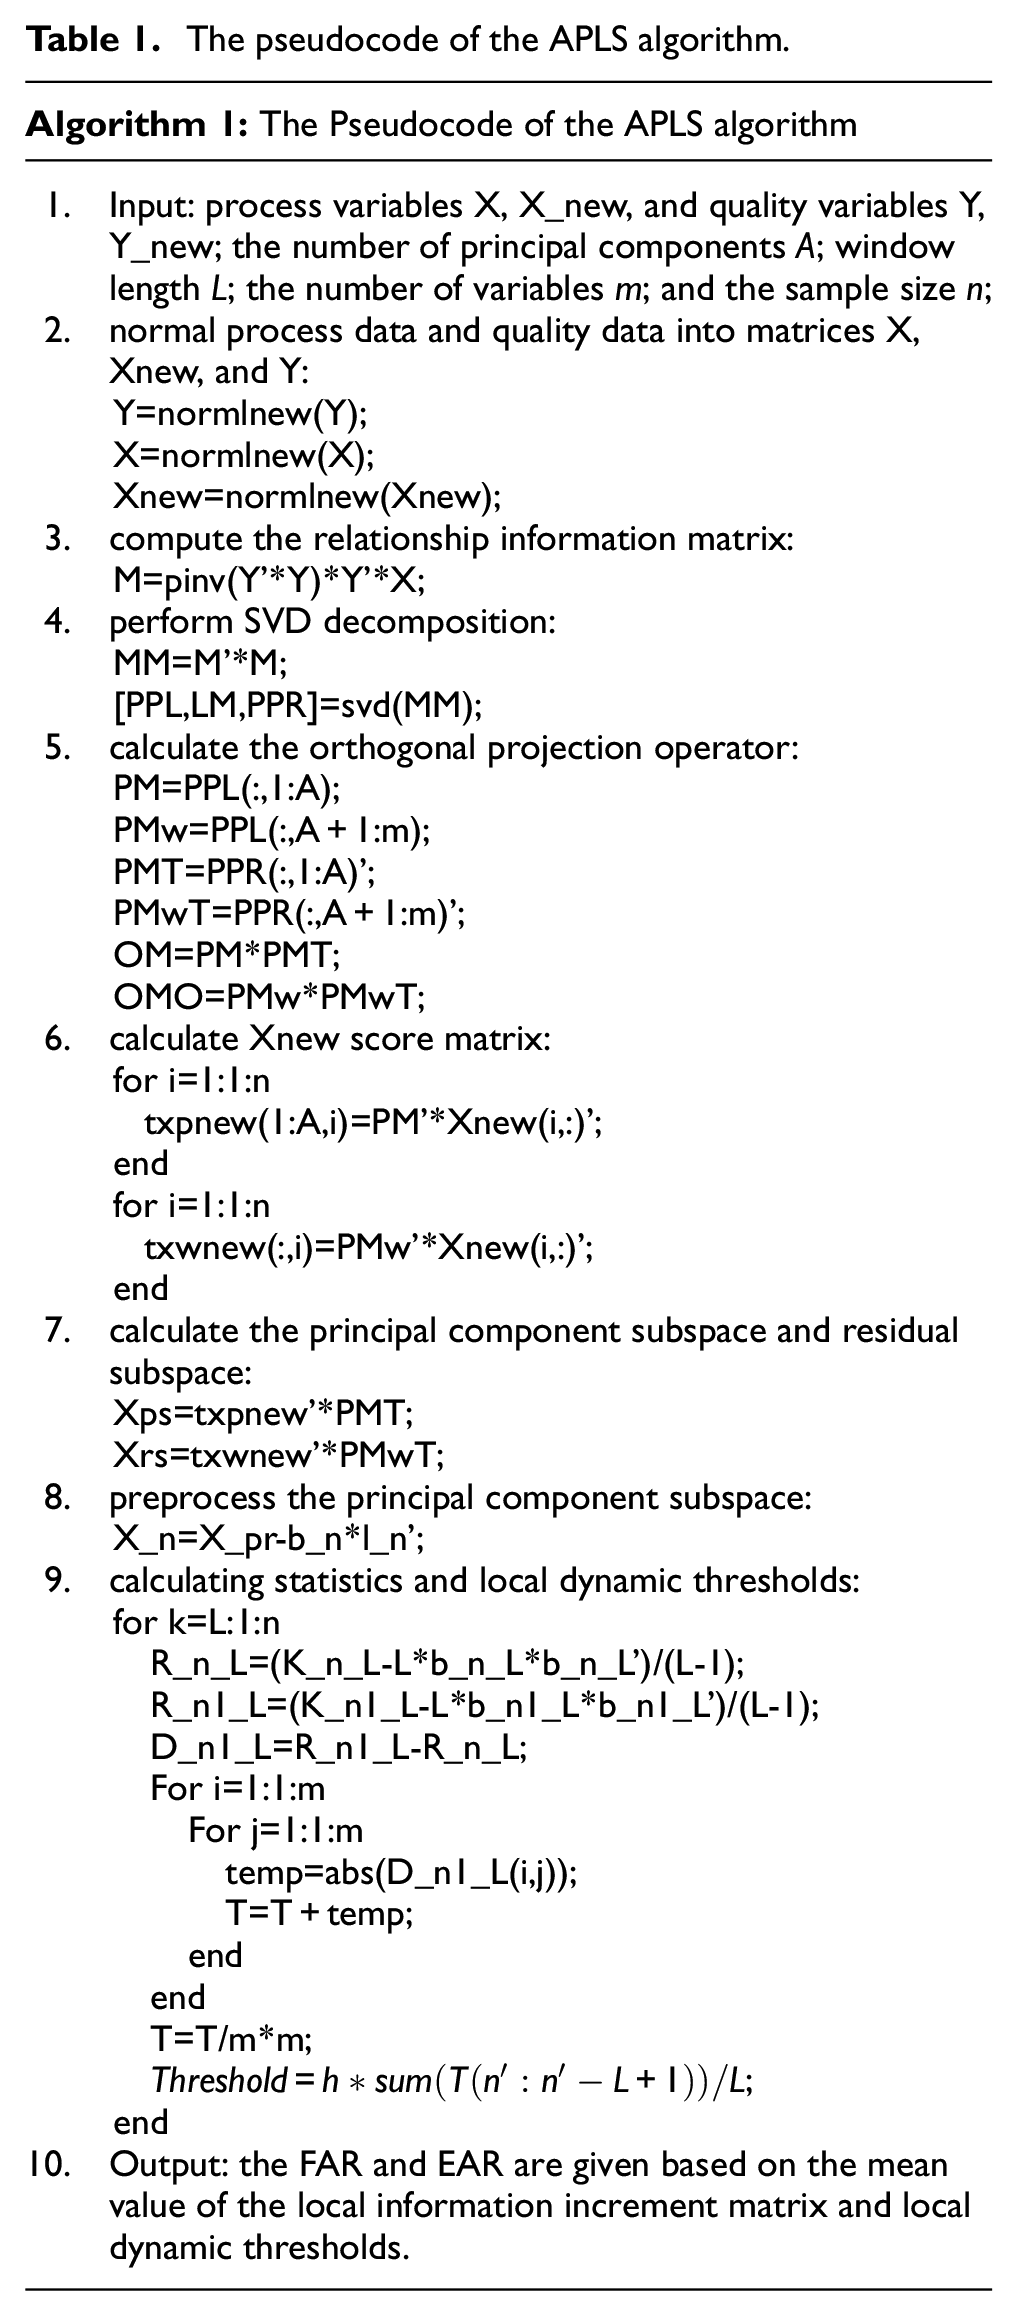
Based on the above analysis, the main steps of APLS are summarized as follows.
(a) if
(b) if
According to the design of the pseudocode above, the computational complexity of Algorithm 1 is denoted as
The pseudocode of the APLS algorithm.
The determination process of whether a fault has occurred is as follows:
(1) If the system’s dynamic threshold is denoted as
The dynamic threshold for local normal sampling data of length L based on a fixed window is represented as:
(2) If T equals
Numerical example and case study
In this section, a numerical simulation is first performed to illustrate the implementation process of the proposed APLS algorithm. Then, the effectiveness of APLS is verified by comparing the quality-related fault detection performance of the MPLS, and OSC-MPLS in the TE process simulation examples. Two indices EAR and FAR,12,24 are employed for performance, shown as follows:


From the perspective of industrial applications, a superior quality-related fault detection scheme should possess the following capability.
(a) The higher the EAR is, the stronger the performance of the algorithm in detecting quality-related faults is;
(b) The lower the FAR is, the more accurate the monitoring performance of the algorithm on normal data is.
Numerical example
Consider the following example in which the input is dynamic while the output is static 12 :
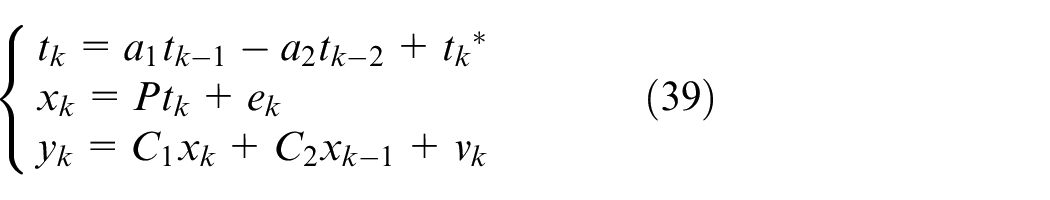
Where
A fault is added into the samples using (38):

where
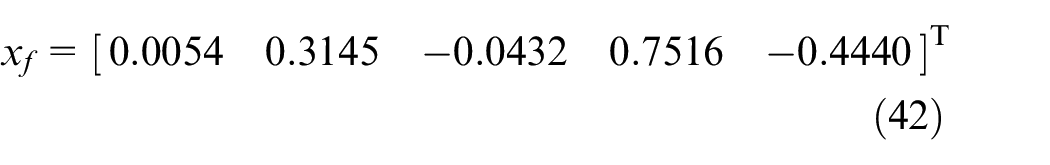
Figure 1 shows the prediction picture of the proposed APLS algorithm for the quality variable
(a) The quality-related fault values are added as follows:
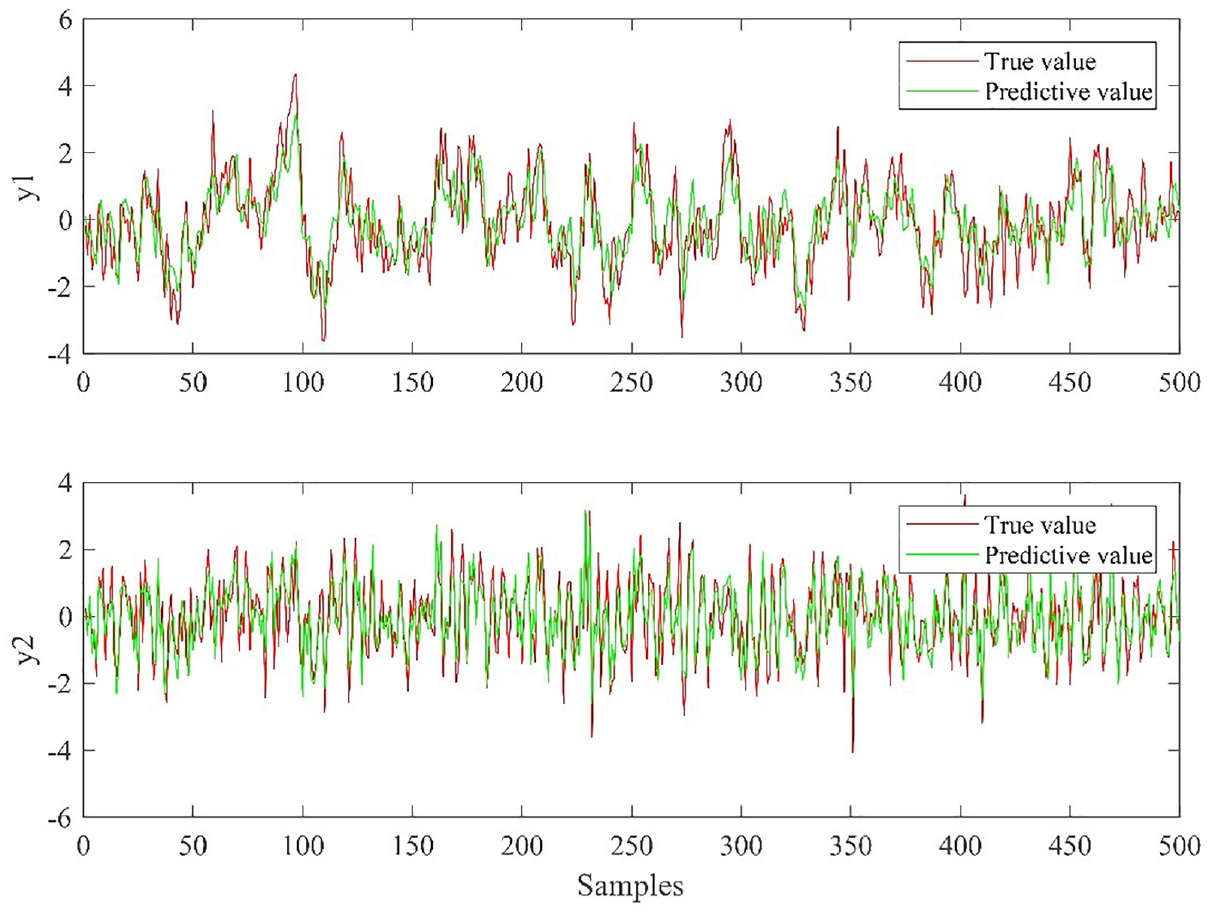
Predicted values and the true values under fault-free.
Figure 2 shows the algorithm detection results after adding quality-related faults. It is revealed that after the quality-related fault is added, the fault is accurately detected when the fault is introduced and the effectiveness of the proposed APLS algorithm for quality-related fault detection is proved.
(b) The quality-unrelated fault values are added as follows:
Detection results of the proposed approach under quality-related.
Figure 3 is the detection result of the algorithm after adding quality-unrelated faults. It can be seen that after adding quality-unrelated faults, the APLS algorithm can accurately detect faults when the fault samples are introduced. The effectiveness of the proposed APLS algorithm for quality-unrelated fault detection is proved.
Detection results of the proposed approach under the quality-unrelated.
Tennessee Eastman Process
Tennessee Eastman Process (TEP)26,27 is a simulation example based on actual industrial processes proposed by the process control department of the Tennessee Eastman Chemical Company in the United States in 1993. The coupling among various parts of the TEP system is severe, highly nonlinear, and open-loop unstable, which is one of the several challenging control problems in the field of process control. As the process is based on actual industrial processes, it is widely used to evaluate the performance of process monitoring and has achieved good practical results. The TEP system has 12 manipulated variables and 41 measured variables, where 41 measured variables contain 22 continuous variables and 19 component variables. In addition, the process also includes 21 kinds of disturbances, among which 15 kinds of disturbances are known faults. Among these 15 known faults, there are two types of faults: one is quality-related faults such as IDV(1), IDV(2), IDV(5)–IDV(8), IDV(10), IDV(12)–(13), the other is quality-unrelated faults such as IDV(3)–(4), IDV(9), IDV(11), IDV(15). The collected samples include two types of normal data sets and fault data sets. The normal data set contains 480 samples, and each fault data set contains 960 samples. These data should be standardized before modeling, then normal data is used to build regression models, and faulty data sets are used as the testing data for detection. Moreover, the final product component XMEAS (35) is selected as the quality variable
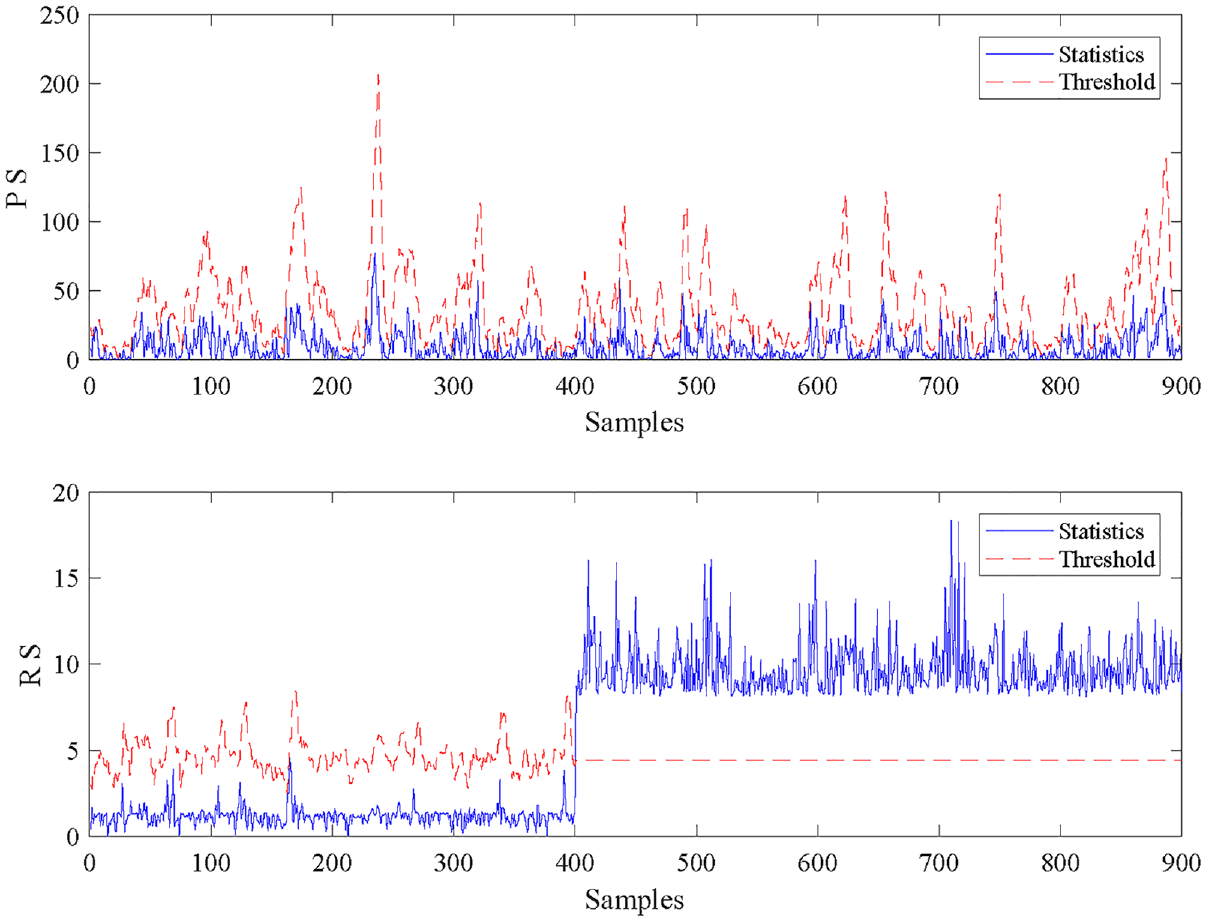
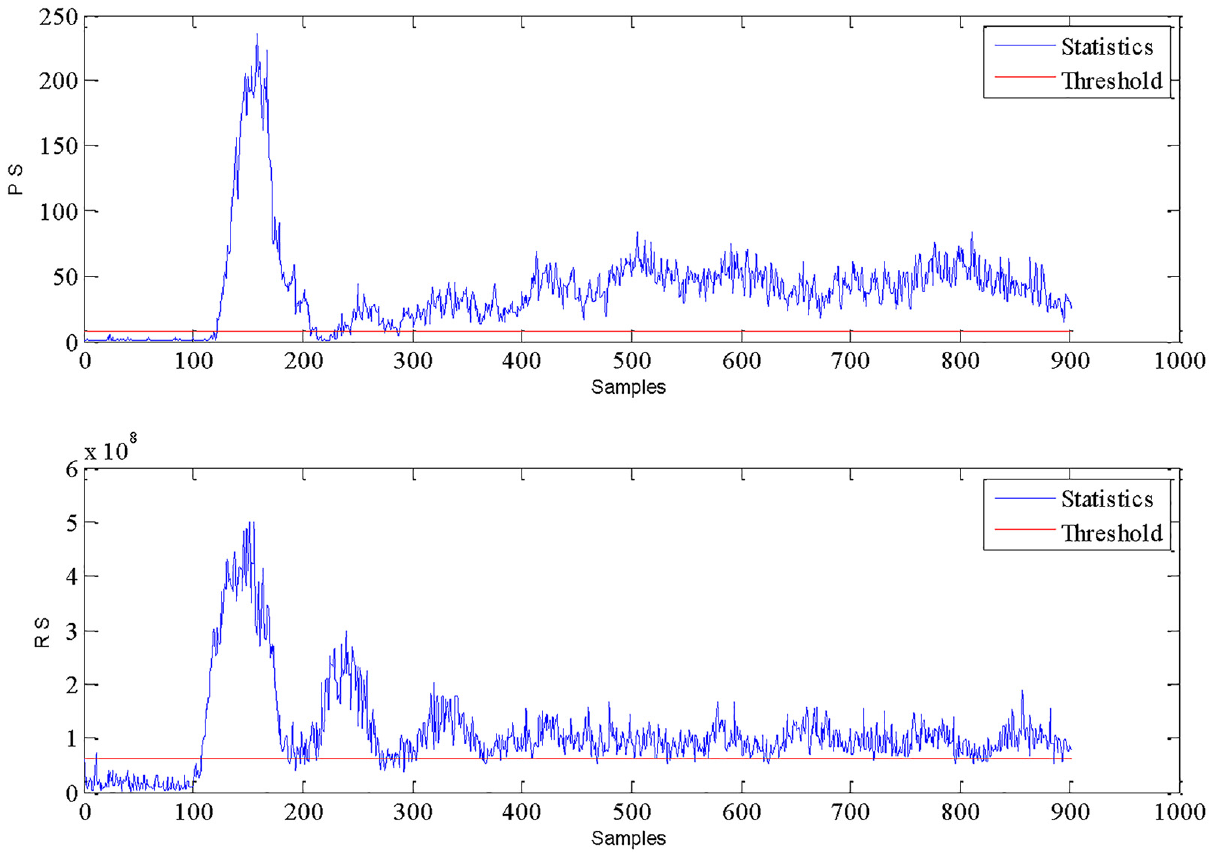
Using the MPLS, OSC-MPLS, and the proposed approach to detect IDV(1), Figure 4 shows the detection results of IDV(1) by the MPLS algorithm. It can be seen that some statistics of the MPLS algorithm are below the threshold at the time of fault sampling, which indicates that the MPLS algorithm has a lower EAR. Figure 5 is the detection result of the OSC-MPLS algorithm for IDV(1). It is shown that after orthogonal signal correction is performed on the data, the EAR of the OSC-MPLS algorithm is significantly improved, but there are still some fault data that are not effectively detected by the algorithm.
Detection results of the MPLS approach under IDV(1).
Detection results of the proposed approach under quality-related fault.
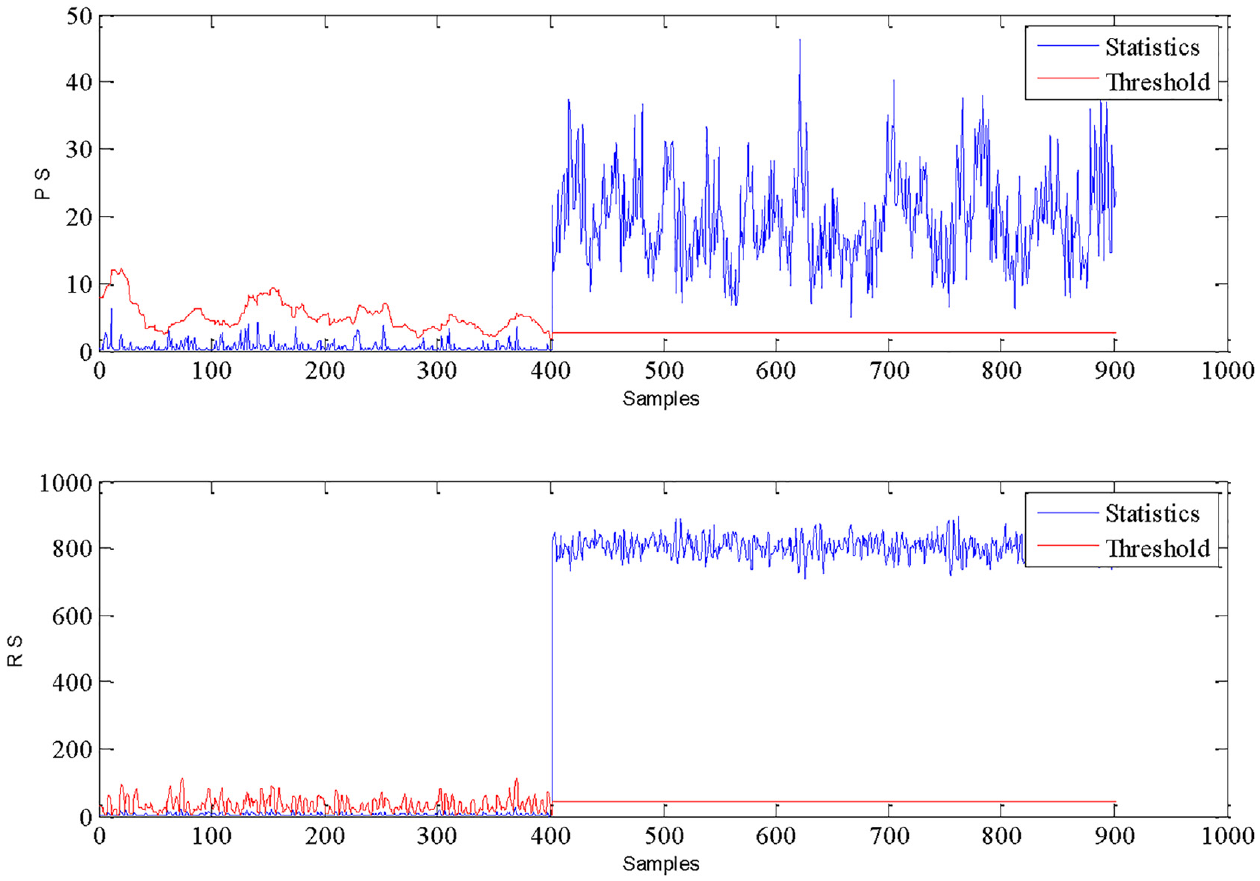
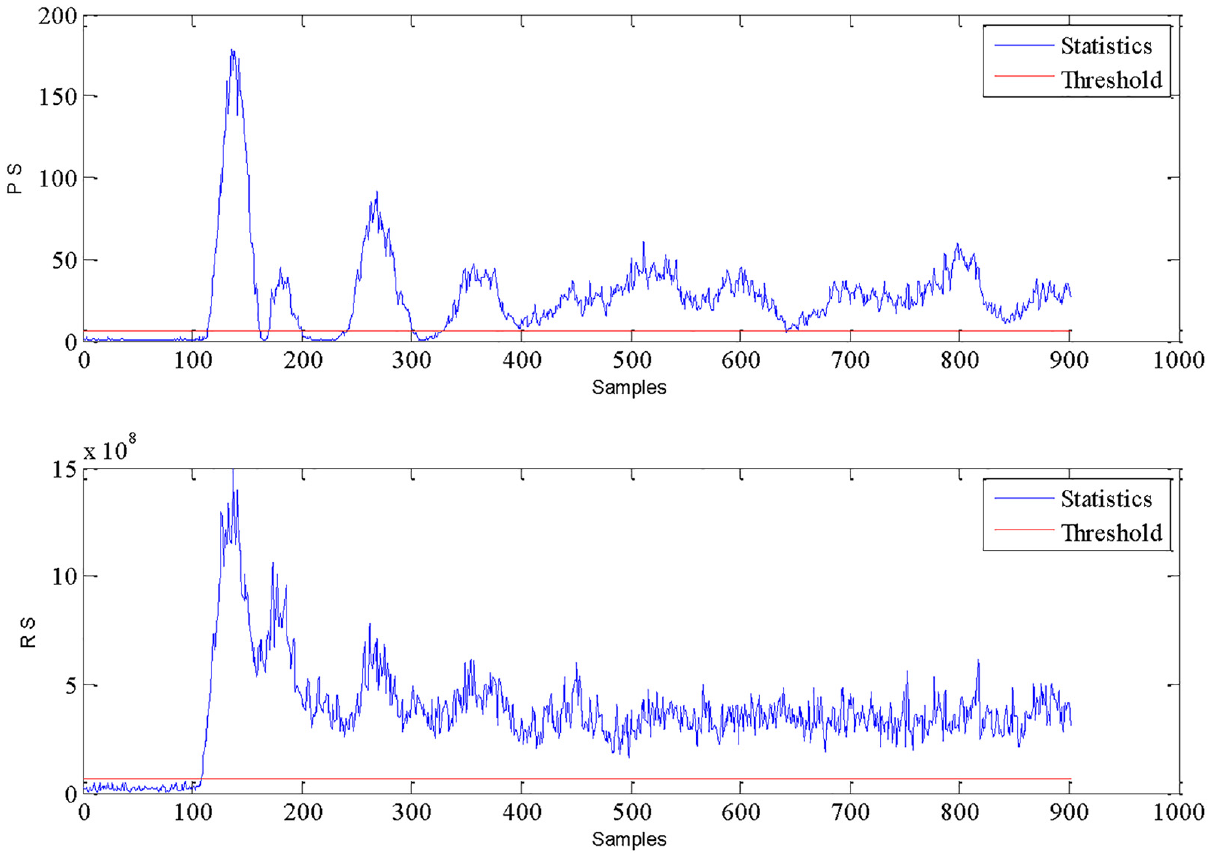
Figure 6 shows the detection results of the proposed algorithm APLS on IDV(1). It can be found that when the fault data are added, they are effectively detected by the APLS algorithm. Compared with MPLS and OSC-MPLS, the FAR of APLS is significantly decreased, which indicates that the proposed algorithm performs well in quality-related faults detection.
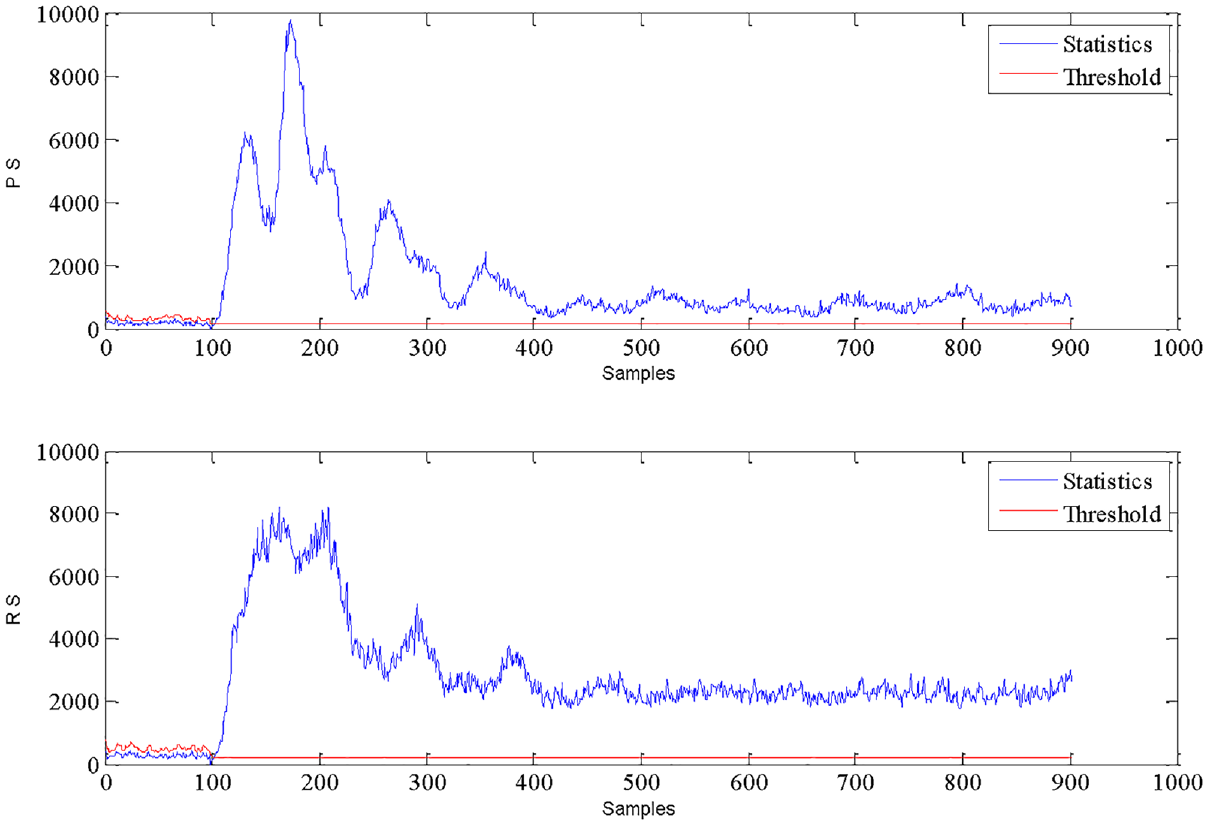
Detection results of the proposed approach under quality-related fault.
Table 2 gives the detection rates of the quality-related fault of MPLS, OSC-MPLS, and APLS, respectively. The bold part shows the group with the highest EAR among the three groups of algorithms, which reflects that the EAR of the proposed APLS algorithm is significantly improved. In Table 2, the EAR of OSC-MPLS is generally higher than that of MPLS. Since OSC-MPLS performs orthogonal signal correction processing on the data based on MPLS, which removes the information orthogonal to
EAR of three algorithms for the quality-related faults of the TEP.
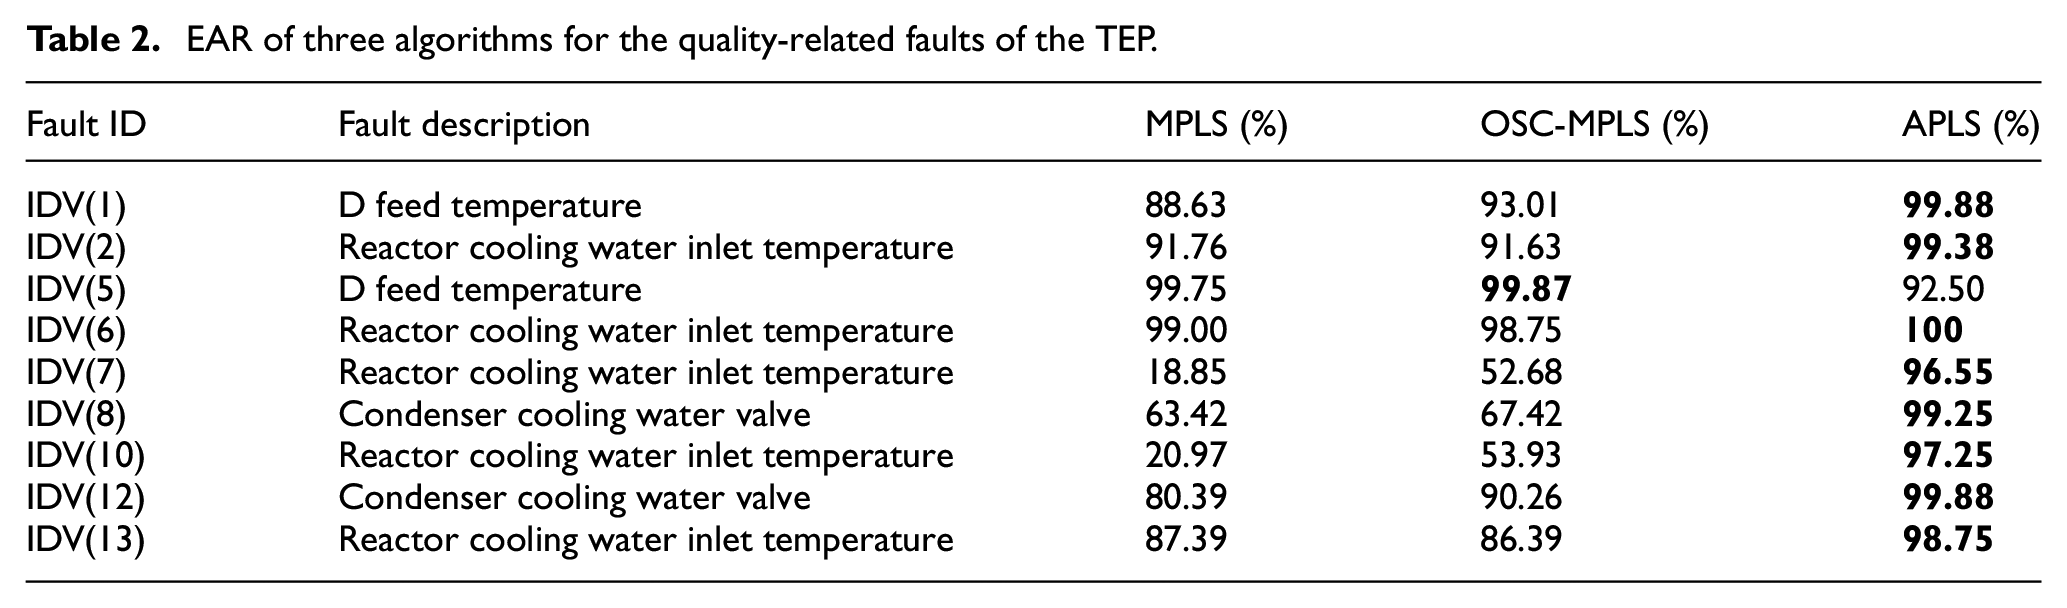
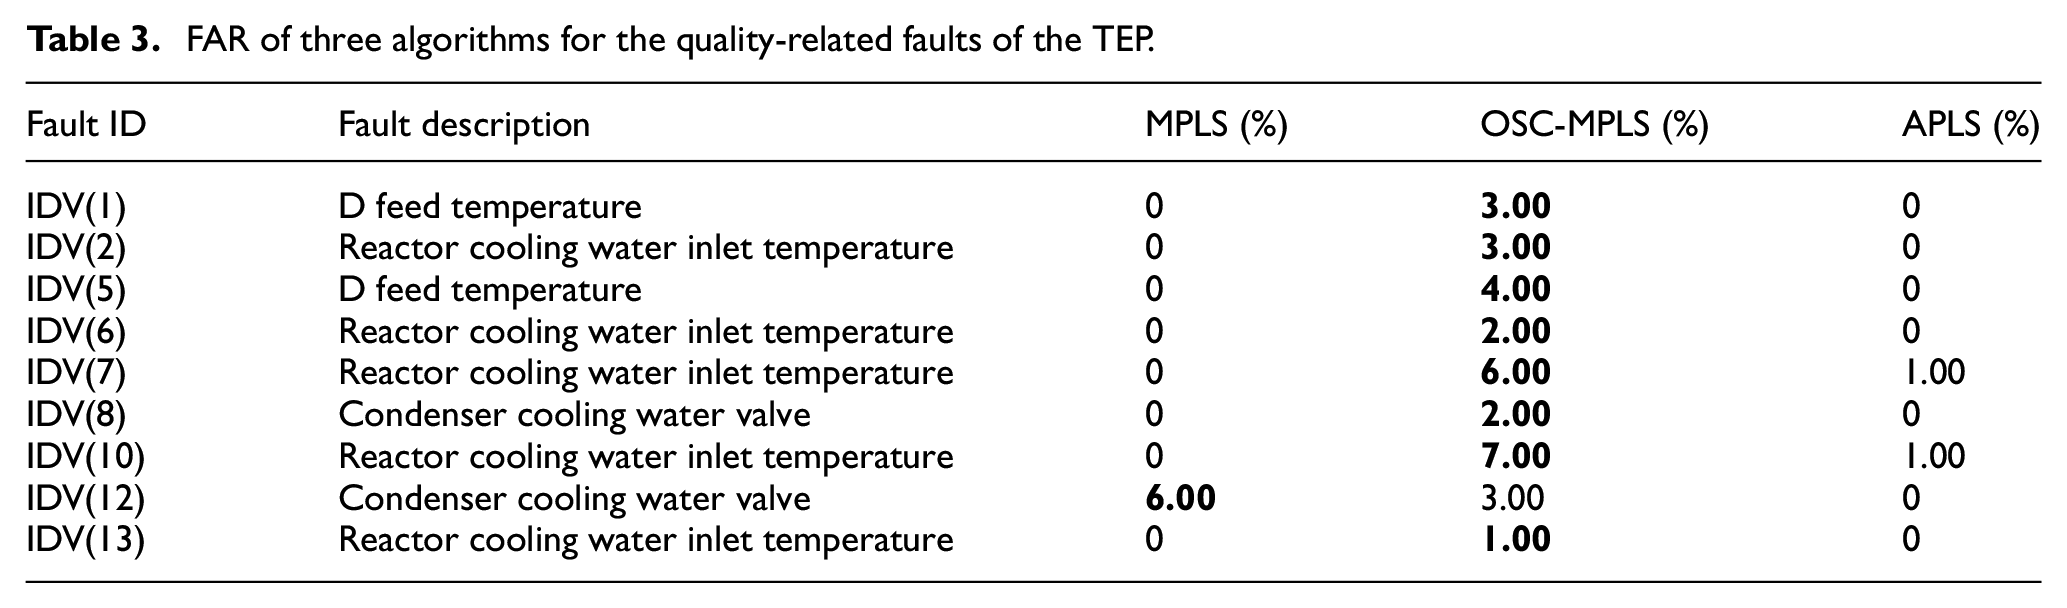
Table 3 shows the FAR of the quality-related faults of MPLS, OSC-MPLS, and APLS. The bold part is the group with the highest quality-related fault false alarm rate among the three algorithms. Among them, the FAR of MPLS is lower, and only the FAR of IDV(12) is 6%. The FAR of OSC-MPLS quality-related faults is higher, and the group IDV(10) with the highest FAR is 7%. The APLS algorithm except for IDV(7) and IDV(10) has a lower FAR, and the FAR of other quality-related faults is 0%. A comparative analysis of FAR and EAR obtained from multiple experiments of the three algorithms shows that the proposed algorithm has the best detection performance for quality-related faults.
FAR of three algorithms for the quality-related faults of the TEP.
Gearbox fault detection experiment
The application scope of gearboxes is extensive, with typical applications including wind turbines, automobiles, aerospace, and more. In practical engineering, their roles encompass speed variation, altering transmission directions, torque rotation, power distribution, and more. To validate the efficacy of the algorithm proposed in this article for real engineering applications, experimental tests were conducted using gearbox fault data. This data was sourced from the QPZZ-II Rotating Machinery Vibration Analysis and Fault Diagnosis Test Platform System, capable of conducting comparative analyses and diagnostics for various fault states, particularly simulating misalignment of gear shafts. It has been widely applied in universities, industrial and mining sectors, and research institutes, for research, teaching, product development, and personnel training. The Japan International Cooperation Agency (JICA) has consistently employed similar platforms to train international equipment diagnostic engineers, yielding favorable results.
The gearbox data was collected using nine sets of sensors: Channel 1-TACH1 (optical sensor measuring rotational speed); Channel 2-CH1 (measuring directional displacement); Channel 3-CH2 (measuring directional displacement); Channel 4-CH3 (measuring acceleration); Channel 5-CH4 (measuring acceleration); Channel 6-CH5 (measuring acceleration); Channel 7-CH6 (measuring acceleration); Channel 8-CH7 (measuring acceleration); Channel 9-CH8 (measuring magnetic-electric speed), with a sampling frequency of 2000 × 2.56 Hz. There exists a certain degree of correlation among the variables obtained from the nine channels, indicating inter-variable coupling, dynamic characteristics, and time-varying properties. Additionally, the data collected from the gearbox was not acquired under ideal conditions. Therefore, due to issues such as structural vibrations and external interferences, the data also contains a certain level of disturbance and noise. The collected data can be broadly classified into two types: the first type comprises data obtained under normal operating conditions. These data are typically utilized as training data and can also be integrated with fault data to form test datasets, simulating sudden faults during regular operation. The second type encompasses data acquired under fault conditions, primarily used as test data for diagnostic testing. Additionally, fault data can be utilized for fault reconstruction. Detailed information regarding data collection conditions and fault types is provided in Table 4.
Fault types of gearbox data.
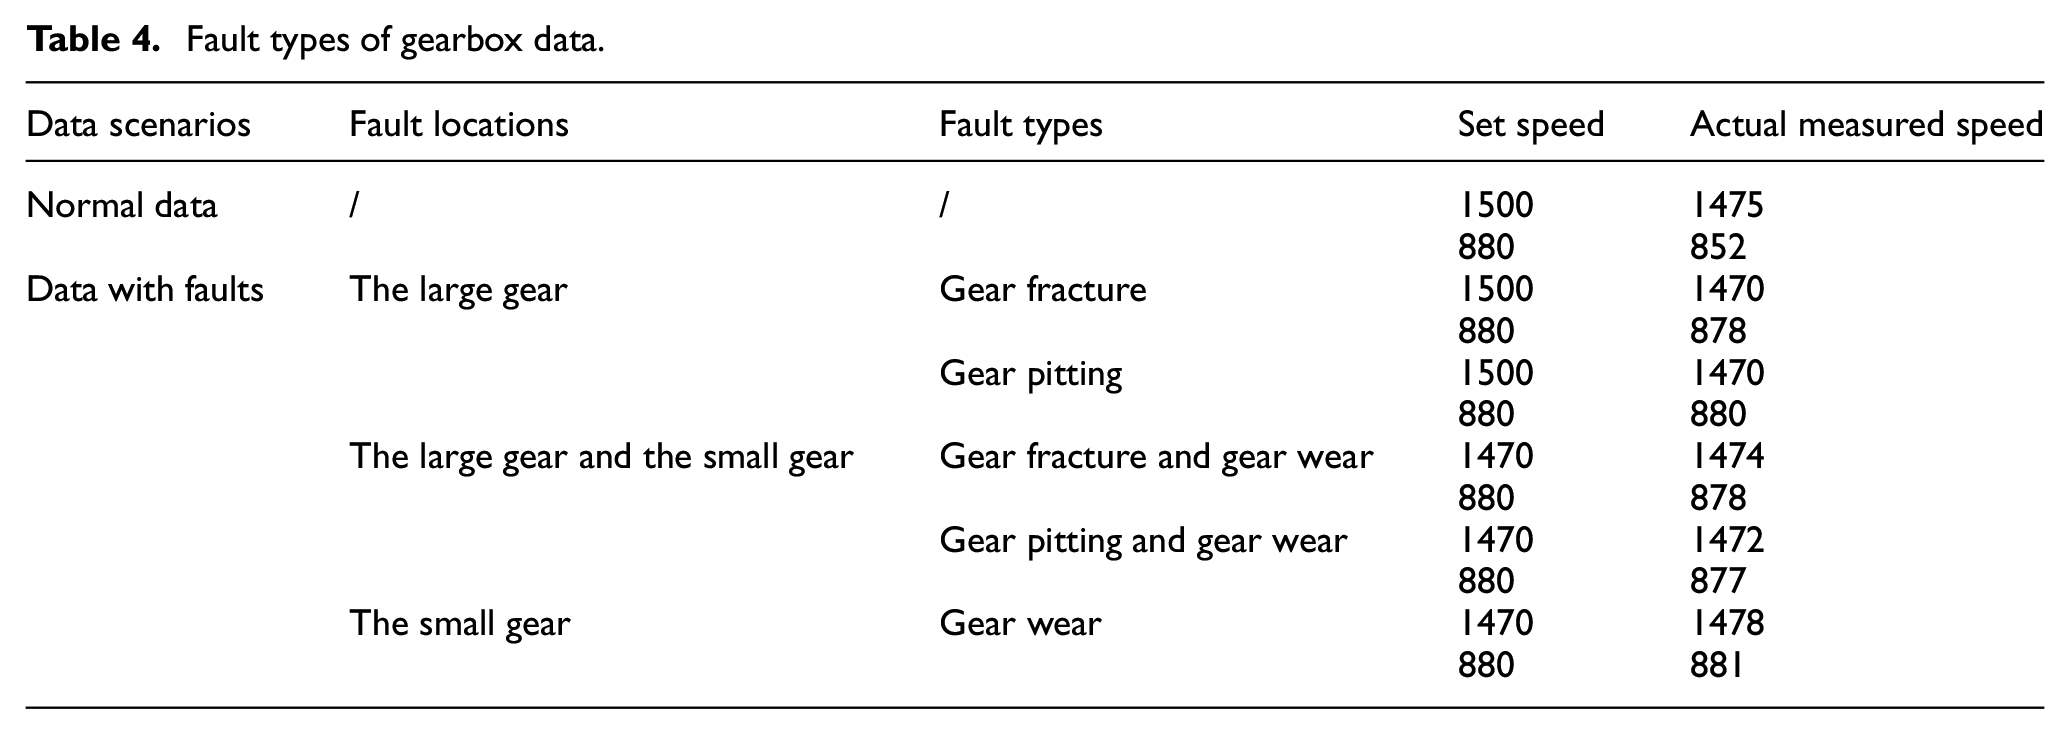
Initializing the model parameters before conducting fault detection on the gearbox. The gearbox dataset comprises five sets of normal operating condition data and 26 sets of fault data. Before experimentation, 1000 samples under normal conditions were chosen as the modeling data to train the APLS model for parameter acquisition. Subsequently, a test dataset was formed by selecting 1000 samples from normal operational data and 1000 samples from fault conditions, simulating the occurrence of a fault at time step 1001. Channel 1 was chosen as the response variable in both the training and test datasets, while channels 2 through 9, labeled as CH1–CH8, were utilized as the process variables. The number of principal elements, A, was determined as 5 through cross-validation, and the window length, L, was set to 6, achieved through the PSO algorithm.
Figure 7 illustrates the fault detection results of the APLS algorithm for different types of faults in the gearbox, including gear wear, gear fracture, gear pitting, and combined faults. The detection results in the figure indicate that, during the 1–1000 sampling instants when no faults occurred, the APLS algorithm’s local dynamic threshold effectively adjusts the threshold dynamically based on adjacent sampling instants, thereby reducing the system’s FAR. During the occurrence of faults in the 1001–2000 range, it is evident from the figure that the APLS algorithm accurately detected faults within the system. Furthermore, to evaluate the performance of the APLS algorithm’s design of local dynamic control limits, a performance comparison was conducted with the concurrent projection to latent structures (CPLS) 27 algorithm and MPLS algorithm that uses static control limits. Figure 8 depicts the fault detection results of the APLS algorithm, CPLS algorithm, and MPLS algorithm simultaneously detecting faults occurring in the condition of gear pitting and gear wear at 880 RPM. From the fault detection results of the three algorithms, it is evident that all three accurately detected the occurrence of faults, demonstrating a relatively high fault detection rate. Figure 8 also presents data from sampling instants 1–900. It is observed from Figure 8 that the CPLS and MPLS algorithms employing static control limits exhibit a higher FAR. Conversely, due to the utilization of local dynamic thresholds, the APLS algorithm demonstrates a lower FAR compared to the CPLS and MPLS algorithms during normal operating conditions.
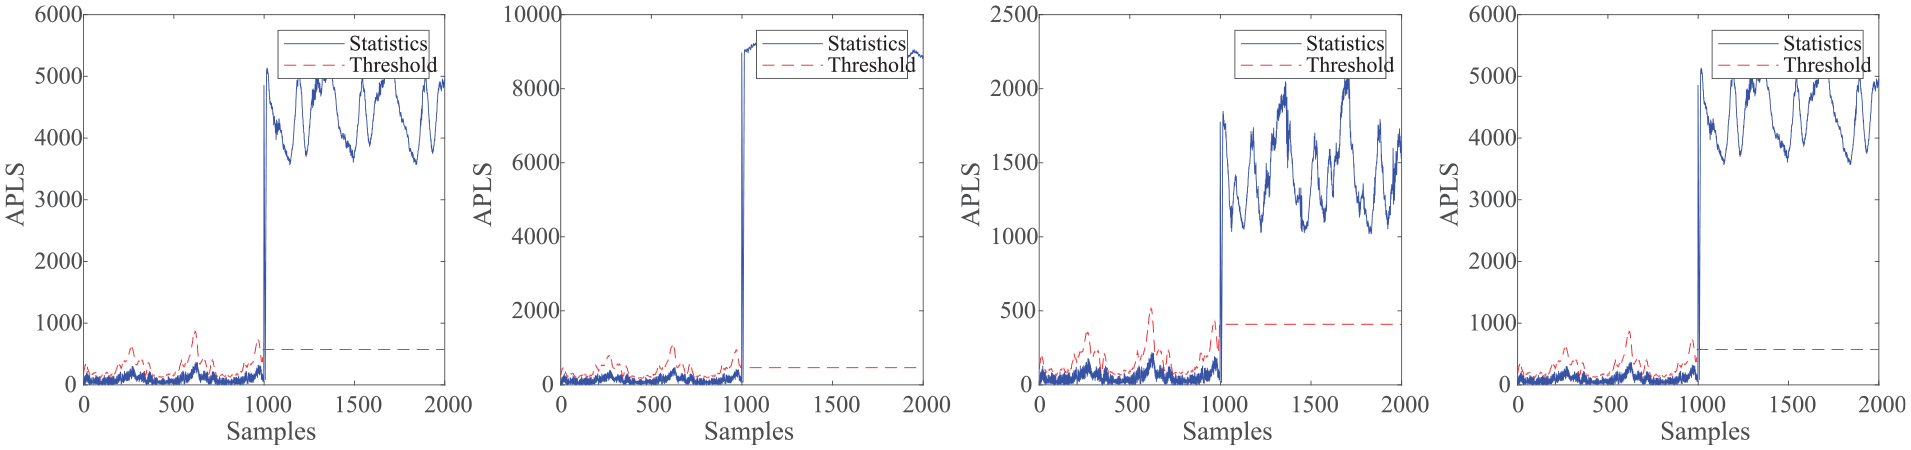
The detection results of APLS algorithm for different fault types at 880 RPM.
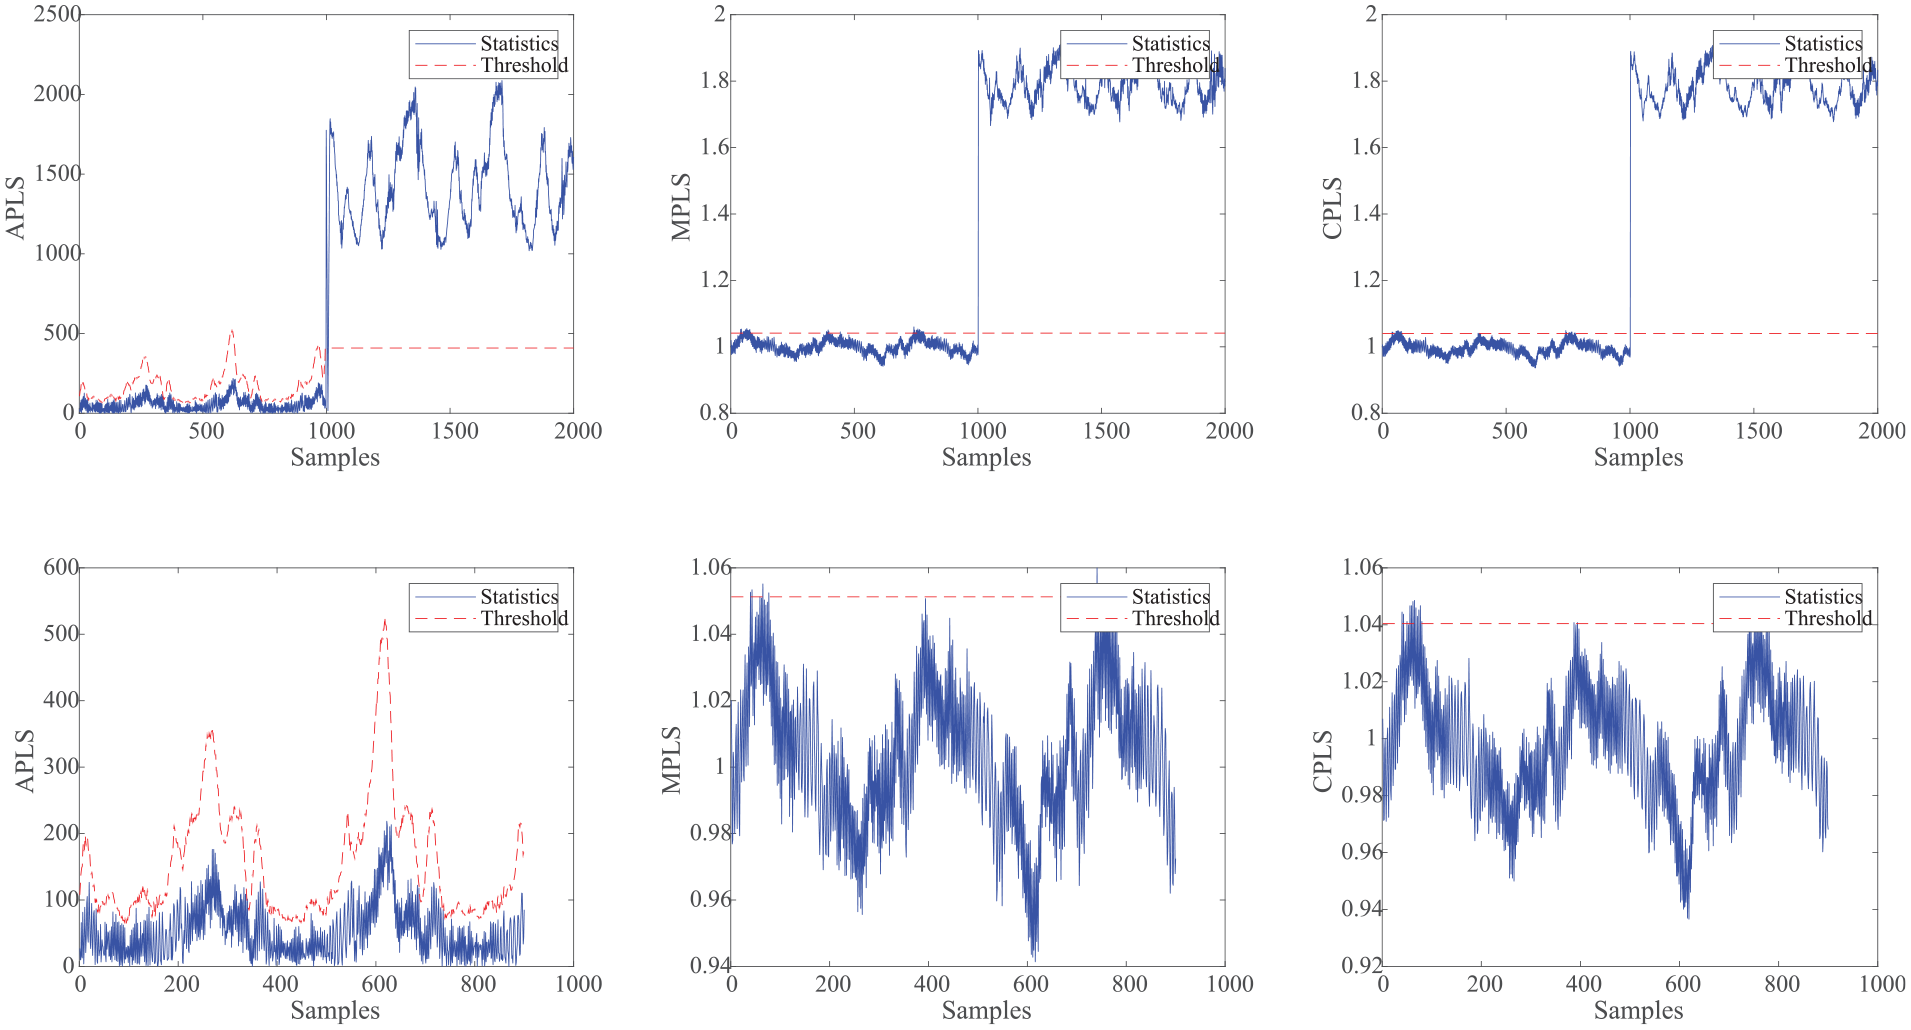
Comparison of three algorithms for detecting gear pitting and gear wear combination fault conditions at 880 RPM.
The application results of the APLS algorithm in gearbox fault data indicate a notably low FAR and high EAR rate in the gearbox fault detection. This algorithm demonstrates promising applicability in detecting gearbox faults in various industries such as wind turbine generators and aerospace, showcasing its performance in fault detection within gearbox systems.
Conclusion
This paper proposes a novel multi-space quality-related fault detection method based on Advanced PLS. The proposed algorithm directly orthogonally decomposes the process variables according to the relationship between the quality variables and avoids the loss of quality information during the decomposition process. Then, the quality variable is decomposed into predictable and unpredictable parts according to the principal component subspace relationship with the process variable, and the interference of the system variation in the process variable on the quality prediction is removed. Finally, a new statistic and threshold calculation method is designed in the quality-related space combined with local information increment technology, which significantly improves the EAR of quality-related faults. Since the algorithm only monitors the quality-related space, there is no monitoring of the quality-unrelated subspace. Although this quality-unrelated fault information has no impact on the final quality of the product, a good detection of it may provide a more comprehensive fault status, which is an interesting topic for future research.
Footnotes
Declaration of conflicting interests
The author(s) declared no potential conflicts of interest with respect to the research, authorship, and/or publication of this article.
Funding
The author(s) disclosed receipt of the following financial support for the research, authorship, and/or publication of this article: The work in this article was supported in part by the 2023 School level Education and Teaching Reform Research Project (No. 2023xjjy57), the Key Projects of Humanity and Social Science Research Project of Anhui Educational Committee (No. SK2020A0213), National Natural Science Foundation of China (No. 52004008), Independent Research fund of The State Key Laboratory of Mining Response and Disaster Prevention and Control in Deep Coal Mines (Anhui University of Science and Technology) (No. SKLMRDPC20ZZ12). Research Project of Xi Jinping New Era Socialism with Chinese Characteristics Thought Research Center (sxzx2021-13).
Ethics approval
We declare that this manuscript has complied with all the ethical requirements of the journal.
Consent to participate
All authors of this manuscript have agreed to participate in the writing of the manuscript.
Consent for publication
All the authors of this manuscript consented to its publication.
Data availability
Data used in this manuscript is available from corresponding author.