
Abstract
The precision of process monitoring often encounters challenges in determining the exact shift size. Therefore, combined control charts have gained considerable attention because of their excellent speed to detect simultaneously small-to-moderate and large-size shifts. The effectiveness of the applied quality control methods strongly depends on the performance of the measurement system. Measurement error presence contributes significantly negatively toward the performance of the usual control charting schemes. This article proposes novel two-sided combined Shewhart-Cumulative EWMA-sum (Shewhart-CUESUM) control charts designed to efficiently monitor the mean of normally distributed processes. In addition, to address measurement errors, the M-Shewhart-CUESUM chart is proposed, incorporating an additive measurement error model. Evaluation of the charts through Monte-Carlo simulations, considering metrics such as average run length (ARL), extra quadratic loss, relative ARL, and performance comparison index. It is found that the combined Shewhart-CUESUM outperforms than CUESUM chart. The results show that the presence of measurement errors can significantly diminish the charts’ performance, which can be mitigated by utilizing a multiple measurements scheme. Among the different well-established combined charts examined, the M-Shewhart-CUESUM chart shows considerably more sensitive to detecting simultaneously detect small and large size shifts. To employ simulated datasets to illustrate the impact of measurement errors and demonstrate the implications of the proposed charts on process mean shifts.
Keywords
Introduction
The Statistical Process Control (SPC) toolkit encompasses a wide range of tools that are widely employed in contemporary industrial settings to effectively monitor and control manufacturing as well as service processes. It represents a robust assortment of analytical techniques aimed at attaining process stability and enhancing capability through the reduction of variability. 1 Among the vital components of SPC, the univariate control chart was originally devised by Dr. Walter A. Shewhart 2 in 1924, standing as an indispensable tool in this domain.
In general, control charts can be classified into two categories: memoryless and memory-type control charts. Memoryless charts, such as Shewhart-type charts, excel at quickly detecting large shifts. However, they exhibit less sensitivity toward small and moderate shifts in the process parameters, such as location and dispersion. To address this limitation, memory-type charts were introduced as enhancements to the memoryless monitoring chart. The Cumulative Sum (CUSUM) chart and the Exponentially Weighted Moving Average (EWMA) chart were developed to improve the detection capability for small shifts.3,4 These memory-type charts utilize in cooperation with previous and recent realizations, resulting in an increased sensitivity toward small and moderate shifts in the process parameters. Subsequently, further enhancements were proposed for these two charts. Crosier’s CUSUM (or CCUSUM) chart, introduced by Crosier, 5 and the Generally Weighted Moving Average (GWMA) chart, presented by Sheu and Lin, 6 are notable examples. Furthermore, Haq 7 recently suggested the Cumulative EWMA-SUM (CUESUM) chart for monitoring the mean of normally distributed processes. Through detailed comparisons, it has been observed that the CUESUM chart exhibits greater sensitivity to small-size shifts compared to the CUSUM, EWMA, CCUSUM, double EWMA, and mixed EWMA-CUSUM charts.
To overcome the limitations of memory-less and memory-type control charts, Lucas 8 proposed a combined chart called the Shewhart-CUSUM chart. This chart was developed with the aim of monitoring both small-to-moderate and large shifts in process parameter(s). He found that the Shewhart-CUSUM chart exhibited superior performance in terms of average run length (ARL) compared to both the standard CUSUM and Shewhart chart. Specifically, Lucas observed that the CUSUM chart worked greatly for controlling the tiny and small shifts, but its efficiency decreased when faced with moderate-to-large shifts. On the other hand, the Shewhart chart demonstrated better efficiency than the Shewhart-CUSUM chart when the shift size was substantial.
Building upon a similar methodology, Lucas 9 introduced the Shewhart-EWMA chart as an enhancement to the detection capability of the EWMA chart. Their study demonstrated that the Shewhart-EWMA chart achieved higher sensitivity compared to using the EWMA chart independently. Additionally, they recommended employing Shewhart limits that are larger than those utilized in a standard Shewhart chart to avoid a substantial decrease in the ARL under in-control conditions. Furthermore, it is essential to be cautious while employing the Shewhart-EWMA chart when dealing with processes that produce occasional outliers. To enhance the detection capability for large shifts, Sheu and Lin 6 proposed the Shewhart-GWMA chart in more recent times. They suggested that if detecting small shifts in the process mean takes precedence over minimizing false alarms and associated time and cost, choosing the Shewhart-GWMA chart might be a more favorable choice. On the similar lines, for monitoring the process variation, Abujiya et al. 10 proposes new combined Shewhart–CUSUM S charts based on the extreme variations of the ranked set sampling technique.
Furthermore, Munir et al. 11 constructed the Shewhart-CCUSUM chart, building upon the work of Lucas. 8 Their study demonstrated that the Shewhart-CCUSUM chart showed slight efficiency in detecting small shifts compared to the Shewhart-CUSUM chart while maintaining similar properties to the latter. Accurately predicting the precise magnitude of shifts from the target value in practical process settings can be challenging. Consequently, combined charts are recognized as powerful SPC tools that excel in monitoring both small-to-moderate and moderate-to-large process shifts effectively.
These charts offer the advantage of simplicity in implementation by incorporating additional Shewhart limits into memory-type charts, without requiring complex charting structures. Considering the benefits of combined charts, our objective is to propose the Combined Shewhart-CUESUM chart. This chart aims to provide efficient monitoring of both small-to-moderate and large-size shifts in the mean of a normally distributed process. By leveraging the strengths of Shewhart and CUESUM techniques, this proposed chart offers an effective solution for process control in practical industrial scenarios.
In SPC, a foundational assumption is that observations from the underlying process are ideally recorded through a flawless measurement system. However, in practical SPC applications, this assumption is routinely challenged by various factors influencing the characteristics of interest during measurement. These factors, including environmental conditions (e.g. temperature and light), human elements (e.g. improper operation and error collection), and nuances within the measurement system itself, are inherent in measurement processes and introduce errors into true observations (cf., Maleki et al. 12 ; Bennett 13 ).
Measurement error, defined as the disparity between a characteristic’s recorded and true value, is omnipresent. For instance, precise measurement of the exact volume of liquid in bottles on a production line is unattainable, and errors often arise during the generation and measurement of peak areas in mass-spectrometry analyses within analytical laboratories. Analogously, analog blood pressure machines in medical settings may not consistently provide accurate readings (Riaz 14 ). Such variations contribute to an increased observed process variability, potentially leading to misguided deductions and decisions. Consequently, the need for an accurate measuring system, characterized by an observed mean close to the true value and high precision, is emphasized (International Organization for Standardization 15 ).
Concerning control charts, their statistical performance is compromised with heightened measurement variation for a given process variation (Linna and Woodall 16 ). Inaccurate measurements elevate the occurrence of false alarms in in-control situations and significantly diminish the charts’ ability to detect out-of-control (OC) situations.
In practical SPC applications, variations stemming from the measurement system can result in erroneous deductions and decisions. Therefore, a capable measurement system – precise, accurate, and stable – is essential to facilitate process improvements. Nevertheless, acknowledging the inherent errors in all measurements is crucial, as many of these errors can be substantial enough to lead to misleading conclusions about the measured phenomenon. The impact of imprecise measurements on different control charts in SPC is notable, introducing additional process variability and elevating the occurrence of false alarms in in-control situations. Moreover, inaccurate measurements significantly impede control chart performance during out-of-control situations. As the variance of measurement errors increases, so does the uncertainty related to observed process variability, ultimately deteriorating the statistical performance of control charts, especially when the variability due to measurement errors surpasses the inherent process variability. Addressing and minimizing measurement errors are therefore crucial for preserving the integrity and effectiveness of SPC methodologies.
Research interest in the impact of measurement errors on control chart performance has been examined by Abraham.
17
Kanazuka
18
specifically studied the power of control charts when measurement errors are present, focusing on the process average and variance. Linna and Woodall
16
investigated the effect of measurement errors on
The Shewhart median chart and the adaptive EWMA
Nguyen et al.
23
examined the impact of measurement error on the performance of EWMA control charts specifically designed for monitoring the ratio of two variables that follow a normal distribution. Thanwane et al.
24
assessed the performance of the homogenously weighted moving average
Nevertheless, there have been no prior investigations conducted to establish the Combined Shewhart-CEUSUM chart. It is evident that the impact of measurement errors on this chart has not been examined. The objective of this paper is to address this research gap by concentrating on the development of a more effective combined chart while considering the decision risks arising from measurement errors for the mean of processes that follow a normal distribution. Furthermore, investigate the utilization of a multiple measurement strategy as a means to mitigate the introduced variability caused by measurement errors.
The subsequent sections of this paper are organized as follows: Section 2 offers a concise review of existing CUSUM and combined control charts. Section 3 introduces the new combined Shewhart-CUESUM and investigates the performance of this chart in the presence of measurement error. The results of Monte Carlo simulations of different control charts are presented in Section 4. Section 5 presents an illustrative example utilizing simulated datasets, while Section 6 concludes the paper with final remarks.
A review of the existing quality control charts
This section offers a concise overview of existing control charts known for their effectiveness in quickly identifying both small and large size shifts in the mean of a process that follows a normal distribution.
Let
Suppose the process to be in control when the process mean
The CUESUM chart
In a recent study, Haq 7 introduced a novel control chart called the Cumulative EWMA-sum (CUESUM) chart, designed to efficiently monitor small-size shifts in the process mean of normally distributed processes. Haq explored the concept of an EWMA statistic based on the unshrunk CUSUM and utilized it to develop a new Crosier CUSUM chart for process mean monitoring. By incorporating additional memory through the EWMA statistic, the CUESUM chart demonstrated superior performance compared to other competitive counterparts, particularly for small to moderate-sized shifts.
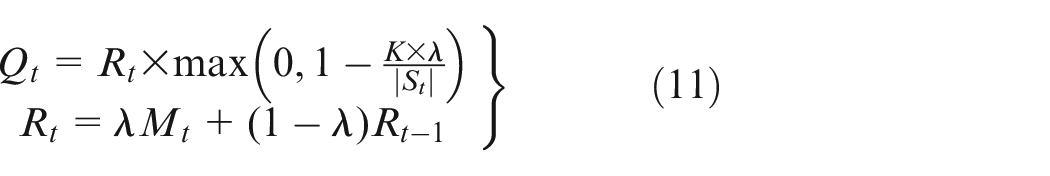
Like the CCUSUM chart, the CUESUM chart follows a control charting structure defined by the following equations:
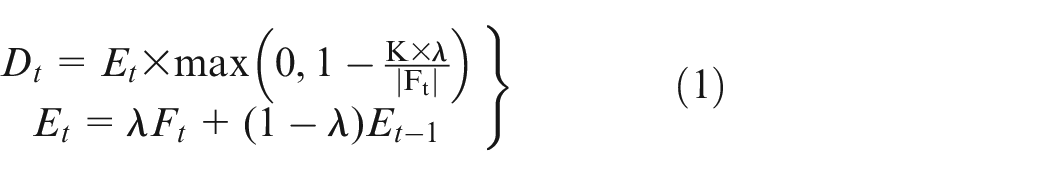
Where
The Shewhart-CUSUM chart
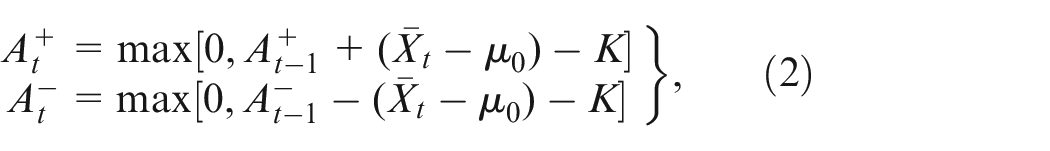
Lucas 8 combined the features of Shewhart and CUSUM charts and proposed the combined Shewhart-CUSUM chart for efficiently detecting a shift in the process mean. This chart’s functions similar to the classical Shewhart (large shifts) and CUSUM (small and moderate shifts) charts.
By using the order of
The Shewhart’s chart upper control limit (UCL) and lower control limit (LCL) of the Shewhart chart can be determined as follows:

The two-sided Shewhart-CUSUM chart determines an out-of-control process if the sample mean
The Shewhart-Crosier CUSUM chart
Munir et al. 11 devised a novel two-sided Shewhart-CCUSUM chart capable of effectively monitoring irregular changes in the process mean, accounting for scenarios with and without measurement error. The construction of this chart relies on the utilization of the following statistical measures.
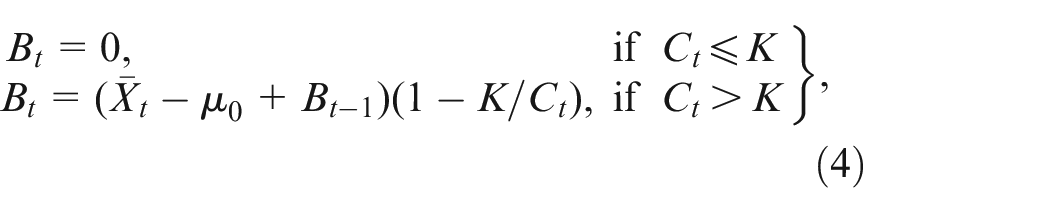
Where the term
Proposed combined control charts
In this section, at first hand, the new Combined Shewhart-CUESUM for efficiently detecting the irregular changes in process mean, is developed. The Combined Shewhart-CUESUM, referred to Shewhart-CUESUM, also proposed in the presence of measurement error.
The Shewhart-CUESUM chart
The Combined Shewhart-CUESUM control chart amalgamates the strengths of the Shewhart chart, which is particularly effective in targeting large size shifts, with the sensitivity of CUESUM in detecting small-to-moderate size shifts in the process mean. The overarching objective is to integrate these dual strengths into a single chart, thereby empowering it with a comprehensive capability to handle both large and small-to-moderate size shifts in the process mean. Building upon Lucas 8 concept of enhancing detection capabilities for small-sized shifts using the CUESUM chart, further advanced the methodology by integrating the Shewhart chart with the CUESUM chart. As a result, proposed a new combined control chart called the Shewhart-CUESUM chart. This innovative approach enables efficient and simultaneous monitoring of process mean shifts, encompassing both small-to-moderate shifts as well as large shifts in normally distributed processes.
Using the order of
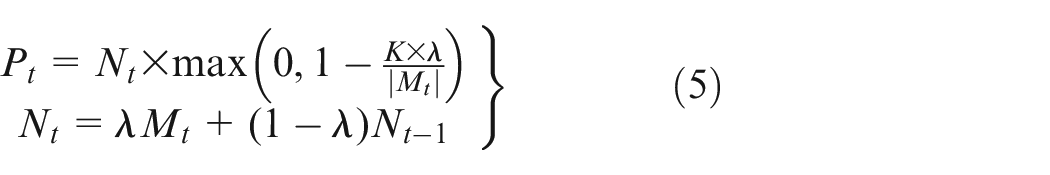
Where
Measurement error-based combined Shewhart-CUESUM chart
In this subsection, development of the combined Shewhart-CUESUM chart to effectively monitor the process mean when measurement errors are present, called the M-Shewhart-CUESUM chart.
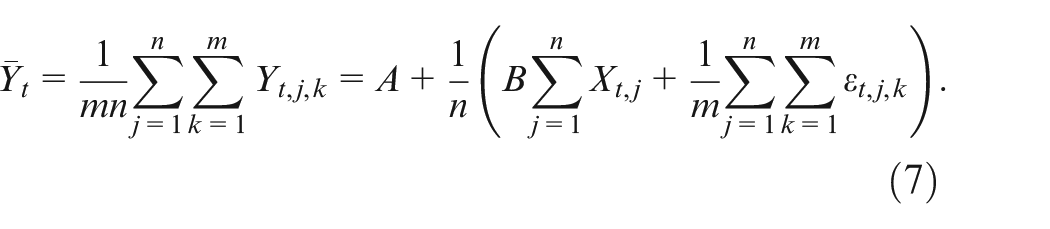
Let us consider an ongoing manufacturing process where successive observations of the quality characteristic of interest,

In the given model, A and B represent known constants, while
Given that the variable
At each time point
It can be demonstrated that mean

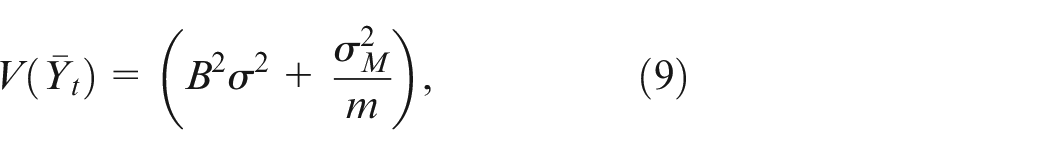
or equivalently
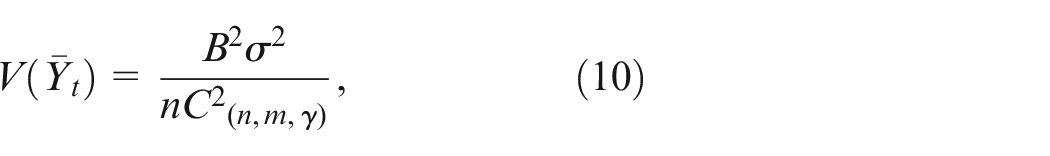
where
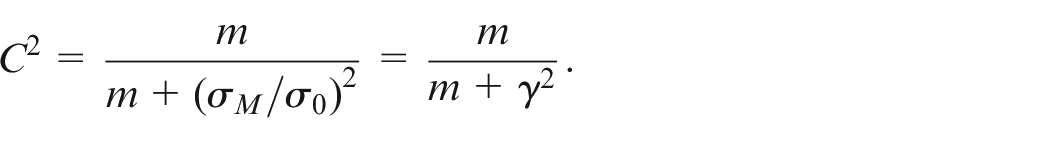
The ratio γ, where γ=
Using the order of
The control limits for the Shewhart chart can be calculated as follows:

Where
Run-length profiles and performance comparison
There are various performance measures to evaluate the control chart’s sensitivity which is based on run length distributions. These measures include Average Run Length (ARL), Standard Deviation of Run Length (SDRL), Extra Quadratic Loss (EQL), Relative Average Run Length (RARL), and Performance Comparison Index (PCI).
The performance analysis of a control chart is typically based on its ARL. A run refers to a consecutive sequence of samples in which the process remains under control. The ARL is defined as the reciprocal of the probability that the statistic value, used for monitoring the process, exceeds the control limits. It represents the number of samples needed to detect a shift, whether the process is in control or out of control. The ARL calculation assumes that the process is initially in control. For a control chart, a higher ARL indicates better performance when the process is in control, while a lower ARL is desirable when the process is out of control. ARL serves as a comparative measure among different charts for a specific shift size. The ARL can be determined using either the Markov Chain approach or Monte Carlo simulation. In this study, the Monte Carlo simulation method is employed. Further insights and details on ARL analysis can be found in the works of Lucas 8 and Lucas and Saccucci. 9
In SPC, performance measures like ARL and SDRL are commonly employed to assess the performance profiles of control charts. They are used to evaluate the sensitivity of a control chart in detecting a specific size of shift. However, when the shift magnitude is unknown and can reasonably be assumed to fall within a certain range, it is more appropriate to consider measures that provide an overall assessment of performance across the range. In the SPC literature, three well-established performance measures are used for this purpose: EQL, RARL, and PCI. The mathematical expressions for these measures are as follows:
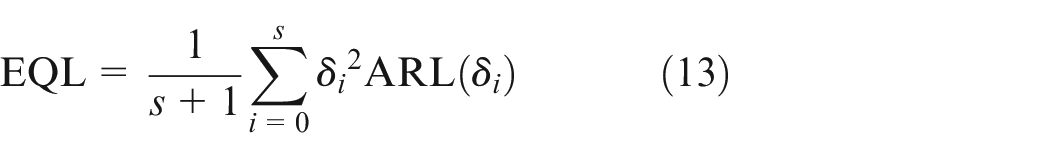


Here, define
The performance evaluation of the two-sided Shewhart-CUESUM and CUESUM charts is carried out when the in-control ARL is set at 370. For both charts, here considered the commonly used value of the reference parameter as
The performance of the combined Shewhart-CUESUM, Shewhart-CUSUM, and Shewhart-CCUSUM charts under the presence of measurement error are investigated. Then evaluated their performance in terms of ARL and SDRL. To conduct the investigation, by using different values for the number of measurement replications
CUESUM versus Shewhart-CUESUM chart
By analyzing the performance presented in Table 1 and Figure 1, a comparison was made between the Shewhart-CUESUM and CUESUM charts in terms of their IRARL, EQL, and PCI. The results indicate that the Shewhart-CUSUM chart reveals greater sensitivity than the CUESUM chart in detecting shifts of different magnitudes in the process mean, thereby demonstrating its overall effectiveness. For instance, the CUESUM chart, at λ = 0.5, the values of (IRARL, EQL, PCI) were observed to be (1.67, 27.02, 1.79), while for the Shewhart-CUESUM chart, they were (1.27, 18.79, 1.25) respectively. Moreover, it is noteworthy that as the value of λ increases, the sensitivity of the Shewhart-CUESUM chart also increases, as evident from the pairs (λ, IRARL) with values (0.1, 1.52), (0.5, 1.27), and (0.9, 1.20).
Run-length performance comparisons of two-sided Combined Shewhart-CUESUM and CUESUM charts when ARL0=500.
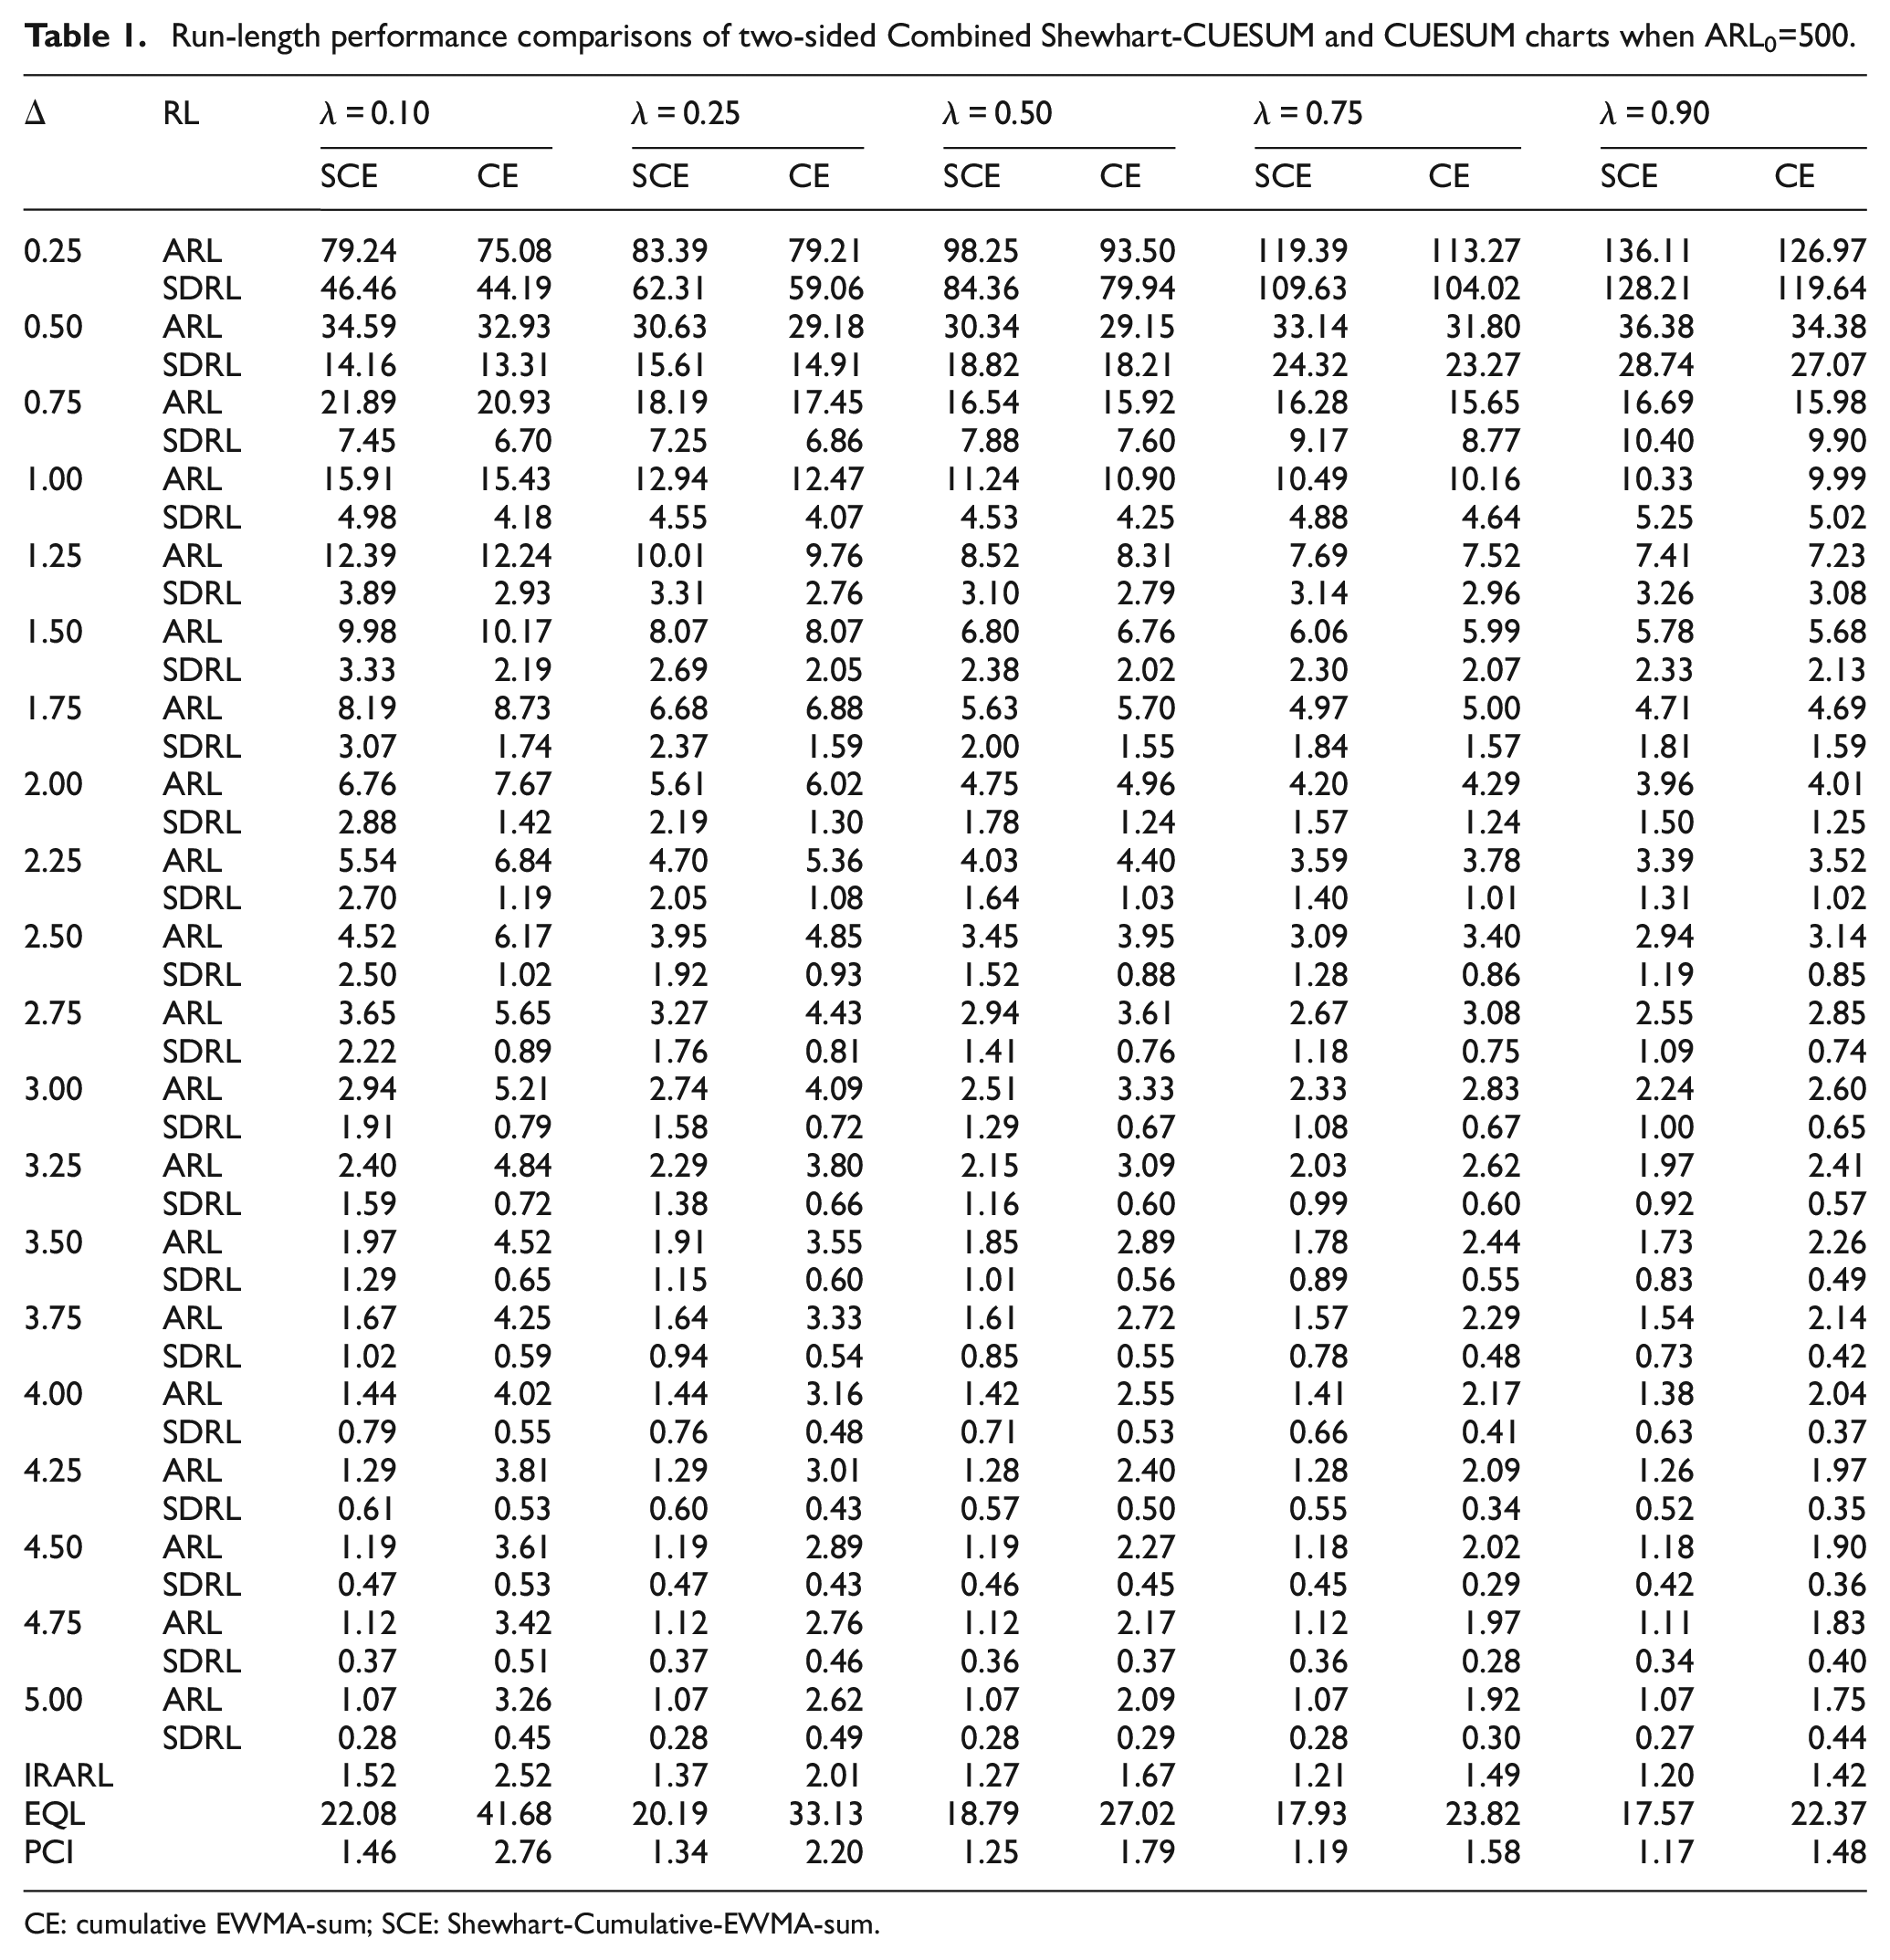
CE: cumulative EWMA-sum; SCE: Shewhart-Cumulative-EWMA-sum.
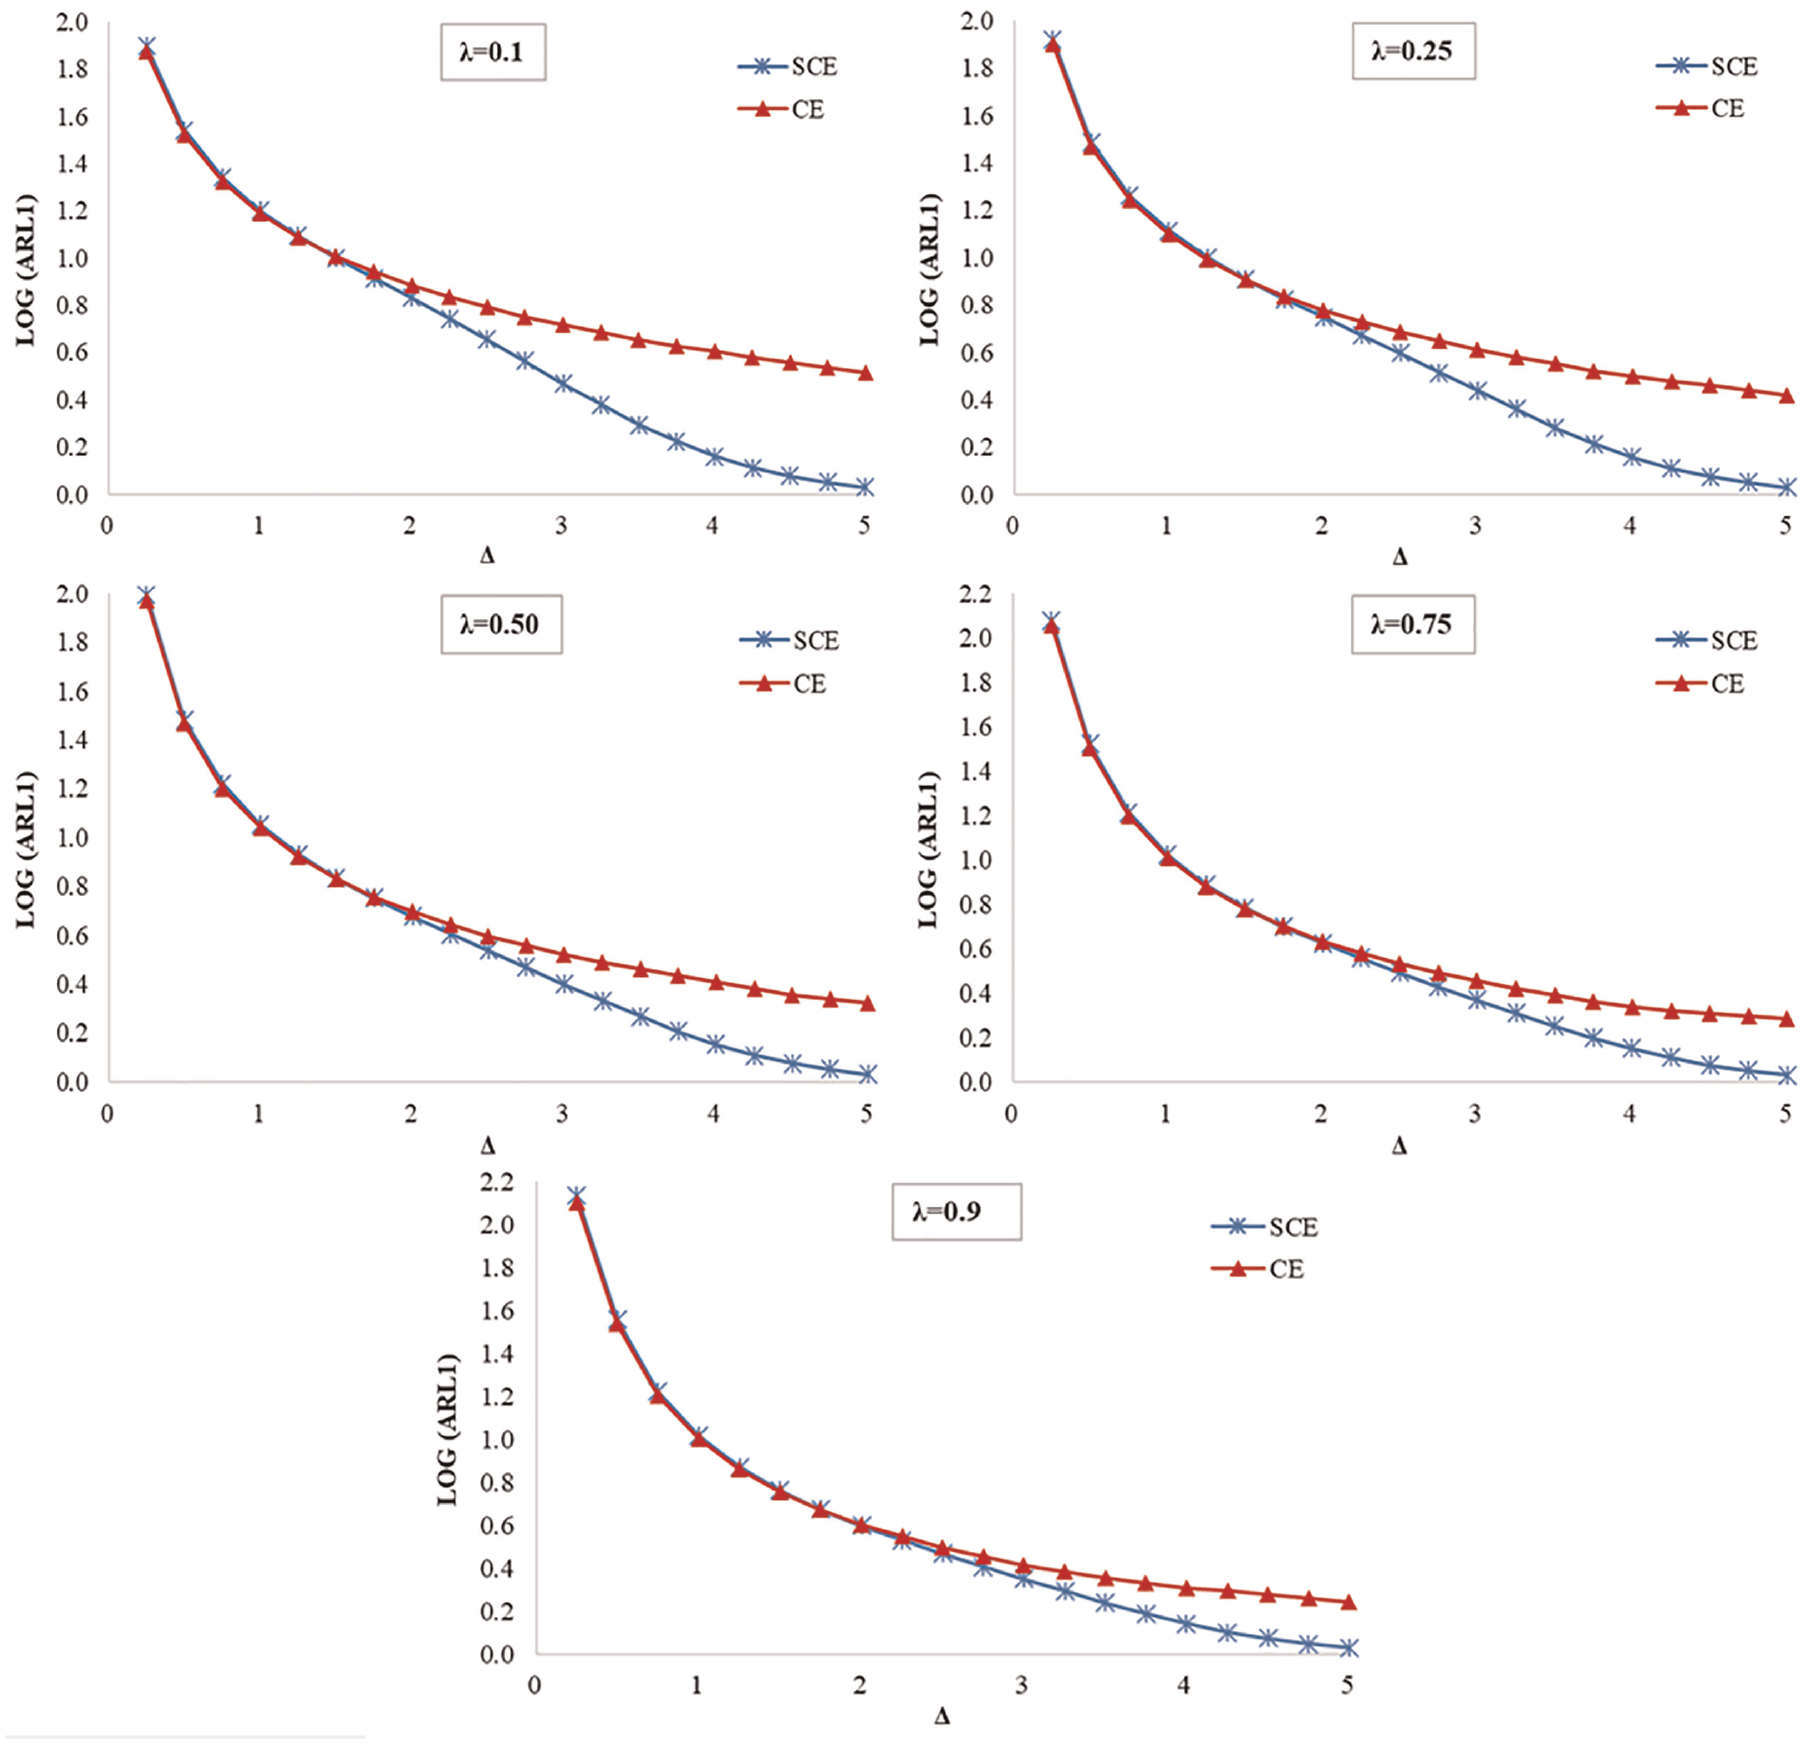
Comparisons of the ARL curves of the two-sided Shewhart-CUESUM (SCE) and CUESUM (CE) chart when
By examining Figure 1, it becomes evident that for shift sizes
Shewhart-CUESUM versus Shewhart-CUSUM and Shewhart-CCUSUM charts
Table 2 presents a comparison between Shewhart-CUSUM, Shewhart-CCUSUM, and Shewhart-CUESUM charts as to ARL and SDRL. Evaluation of the detection sensitivity performance of the Shewhart-CUESUM chart by examining it under varying magnitudes of λ. Results indicate that irrespective of whether λ is small or large, the Shewhart-CUESUM chart consistently demonstrated greater sensitivity compared to the existing Shewhart-CUSUM and Shewhart-CCUSUM charts in detecting small-to-moderate shift sizes (δ ≤ 2). For example, when considering a shift size (δ) of 0.50, the out-of-control ARL values for the Shewhart-CUSUM, Shewhart-CCUSUM, and Shewhart-CUESUM charts with λ = 0.10 are observed to be 80.87, 79.86, and 30.97, respectively. It is important to note that when the target is to detect small shifts, selecting smaller values of λ (less than 0.2) is advisable, while larger values of λ are more suitable for detecting large shifts. In the case of larger values of λ, the Shewhart-CUESUM chart maintains its superior sensitivity in detecting small-to-moderate size shifts compared to the Shewhart-CUSUM and Shewhart-CCUSUM charts, while still performing similarly to them. It is important to highlight that the Shewhart-CUESUM chart represents a specific instance of the Shewhart-CCUSUM chart, occurring when λ = 1, consistent with Haq’s 7 explanation of how the CUESUM control chart transforms into the CCUSUM chart under these conditions.
Run-length performance comparisons of two-sided Combined control charts.
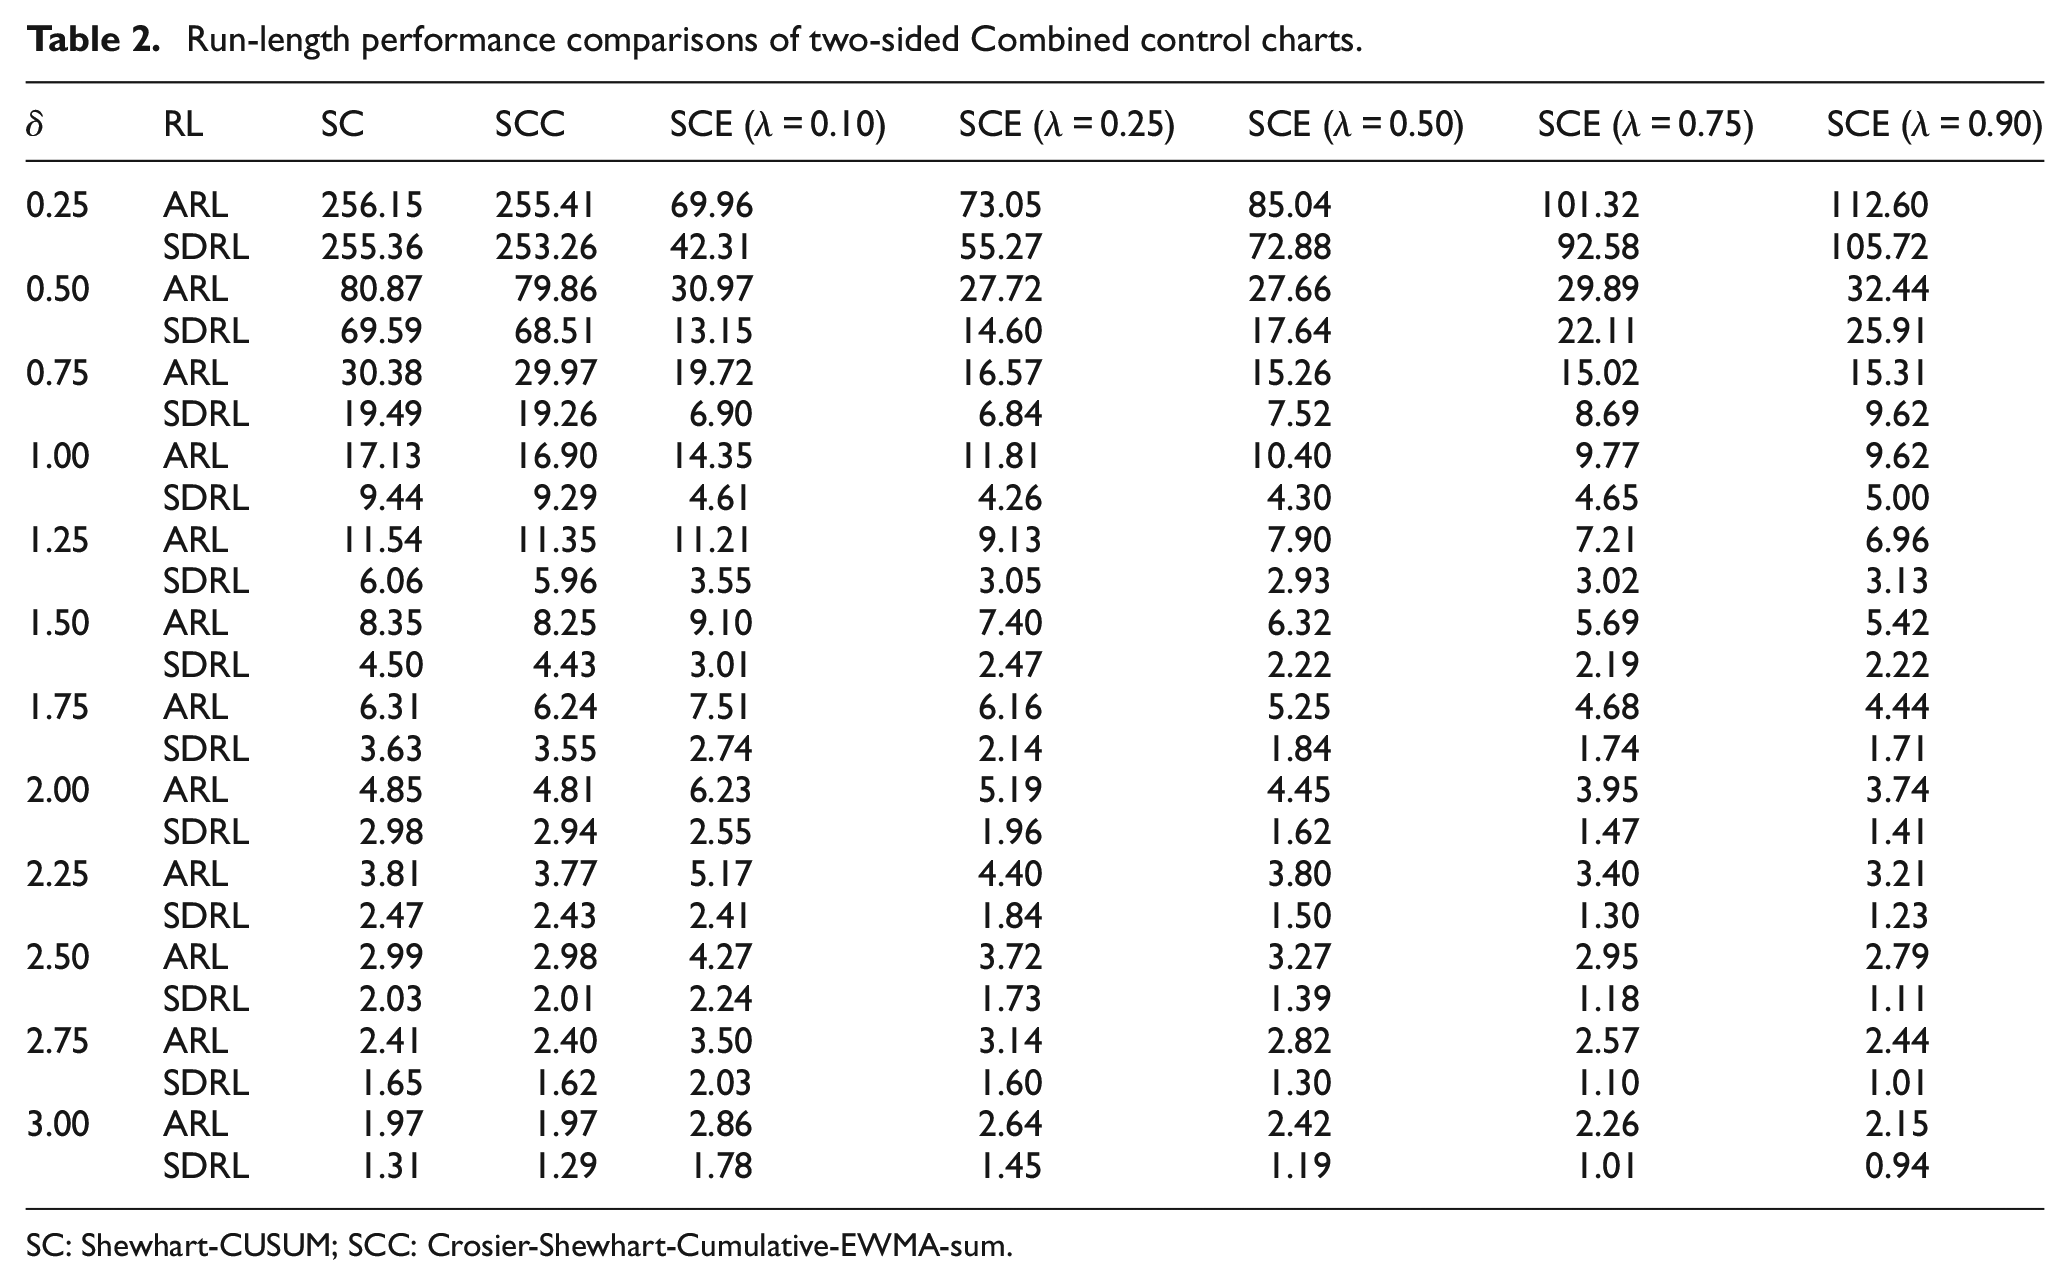
SC: Shewhart-CUSUM; SCC: Crosier-Shewhart-Cumulative-EWMA-sum.
By utilizing the computed ARL values, overall performance was evaluated of the existing and proposed charts in terms of IRARL, EQL, and PCI. These results are presented in Figure 2. It is evident from the figure that the Shewhart-CUESUM chart outperforms the existing counterparts in terms of efficiency for monitoring the process mean. Additionally, when considering different values of λ, the Shewhart-CUESUM chart exhibits higher sensitivity, particularly at larger values of λ.
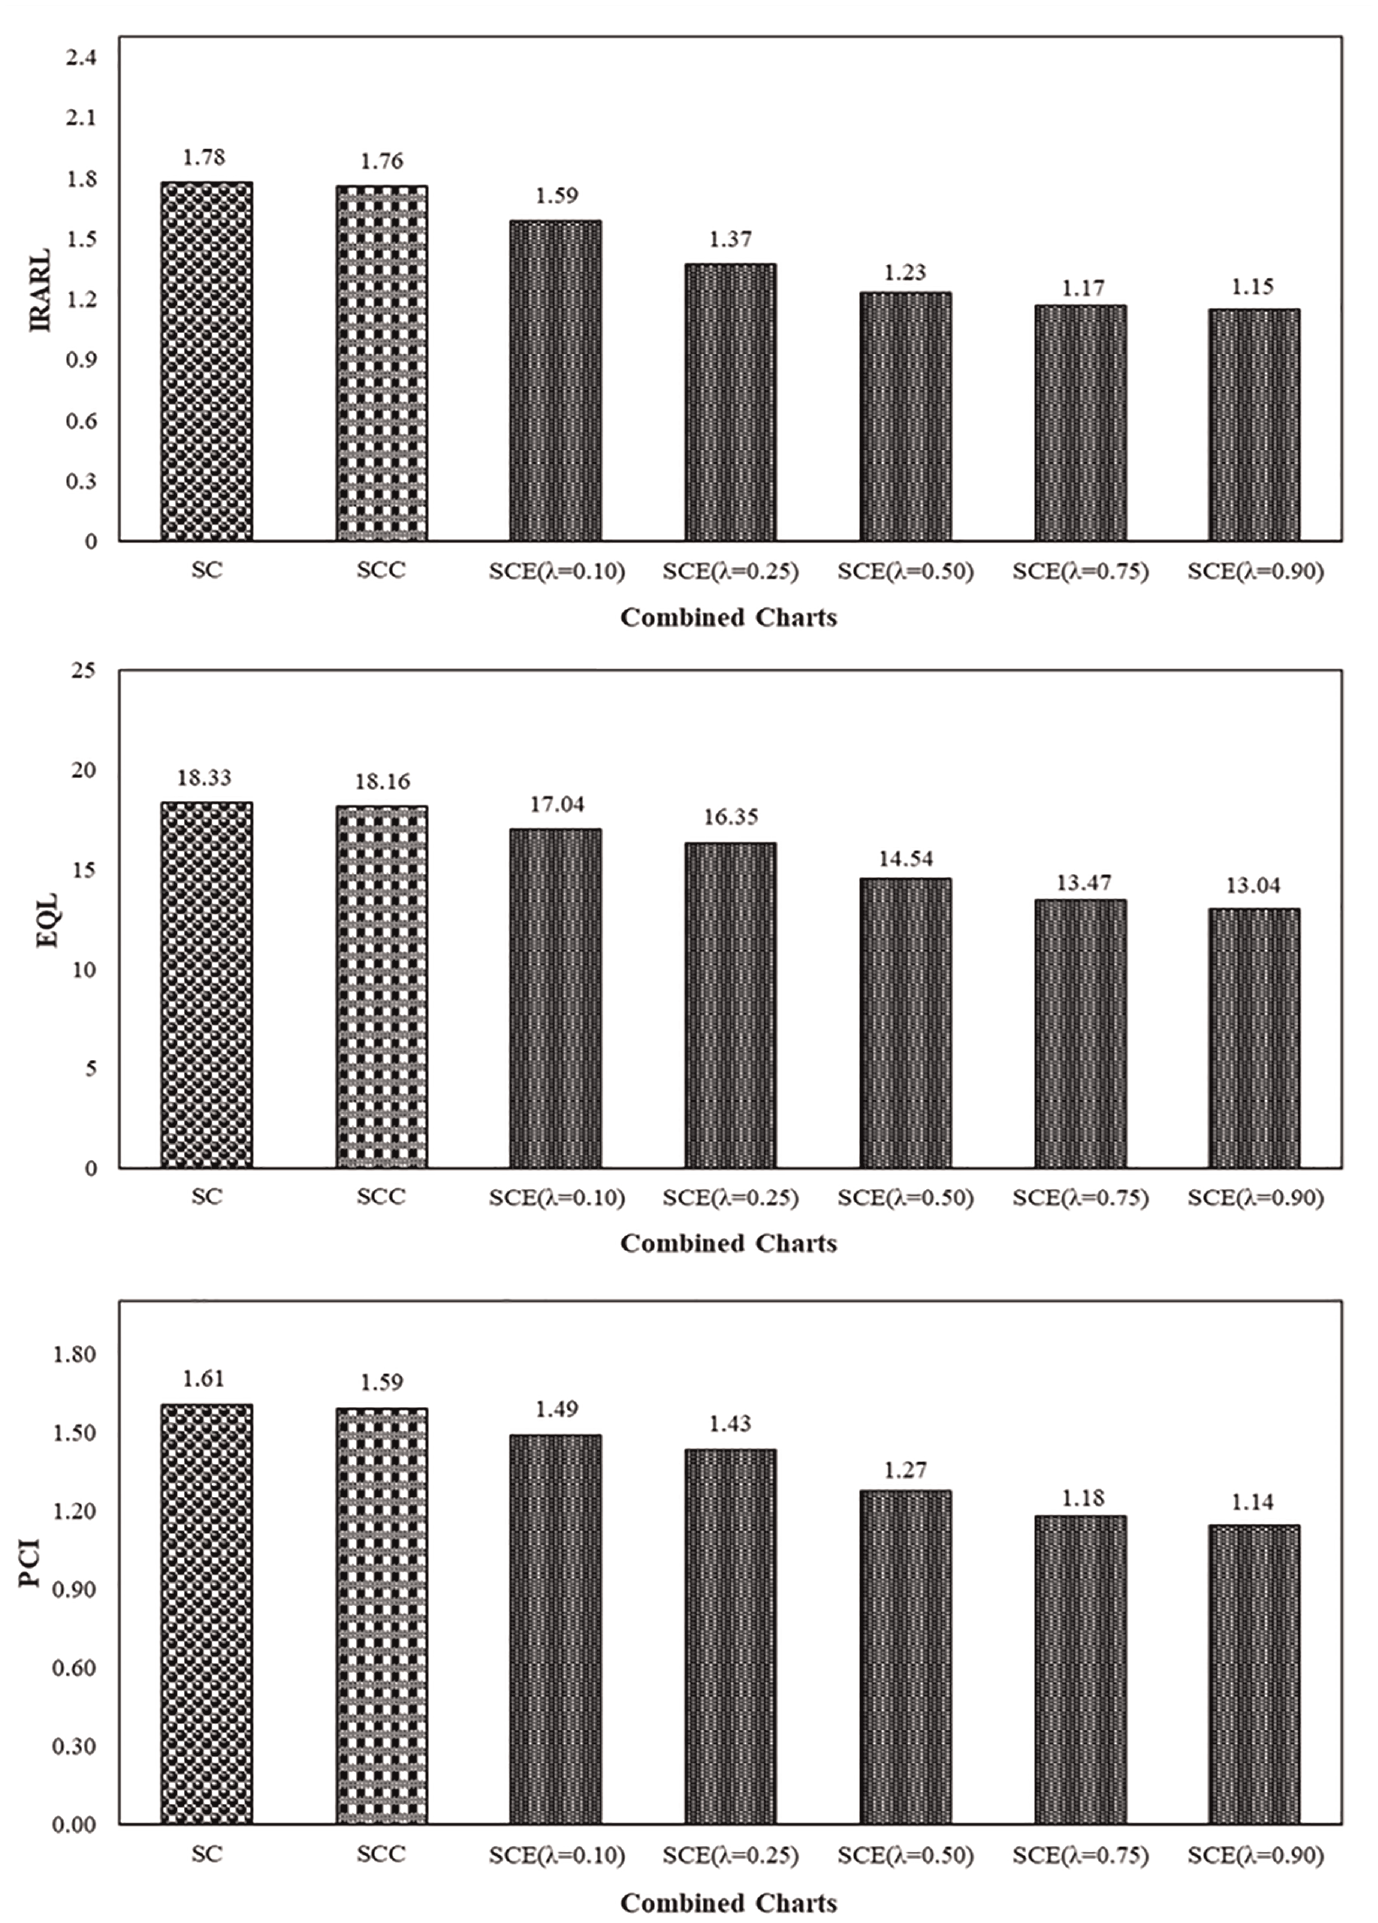
IRARL, EQL, and PCI performance of the combined charts.
Effect of measurement error on combined chart
Tables 3 to 6 demonstrate that as the magnitude of measurement error (γ) increases from 0 (representing a scenario without any measurement error, i.e. perfect measurement) up to 1 (representing the worst-case scenario with significant measurement error), the ARL1 values of the Combined Shewhart-CUSUM, Shewhart-CCUSUM, and M-Shewhart-CUESUM charts (for different values of
ARL1 profile of the Two-sided combined charts, with ARLo = 370 and m = 1.
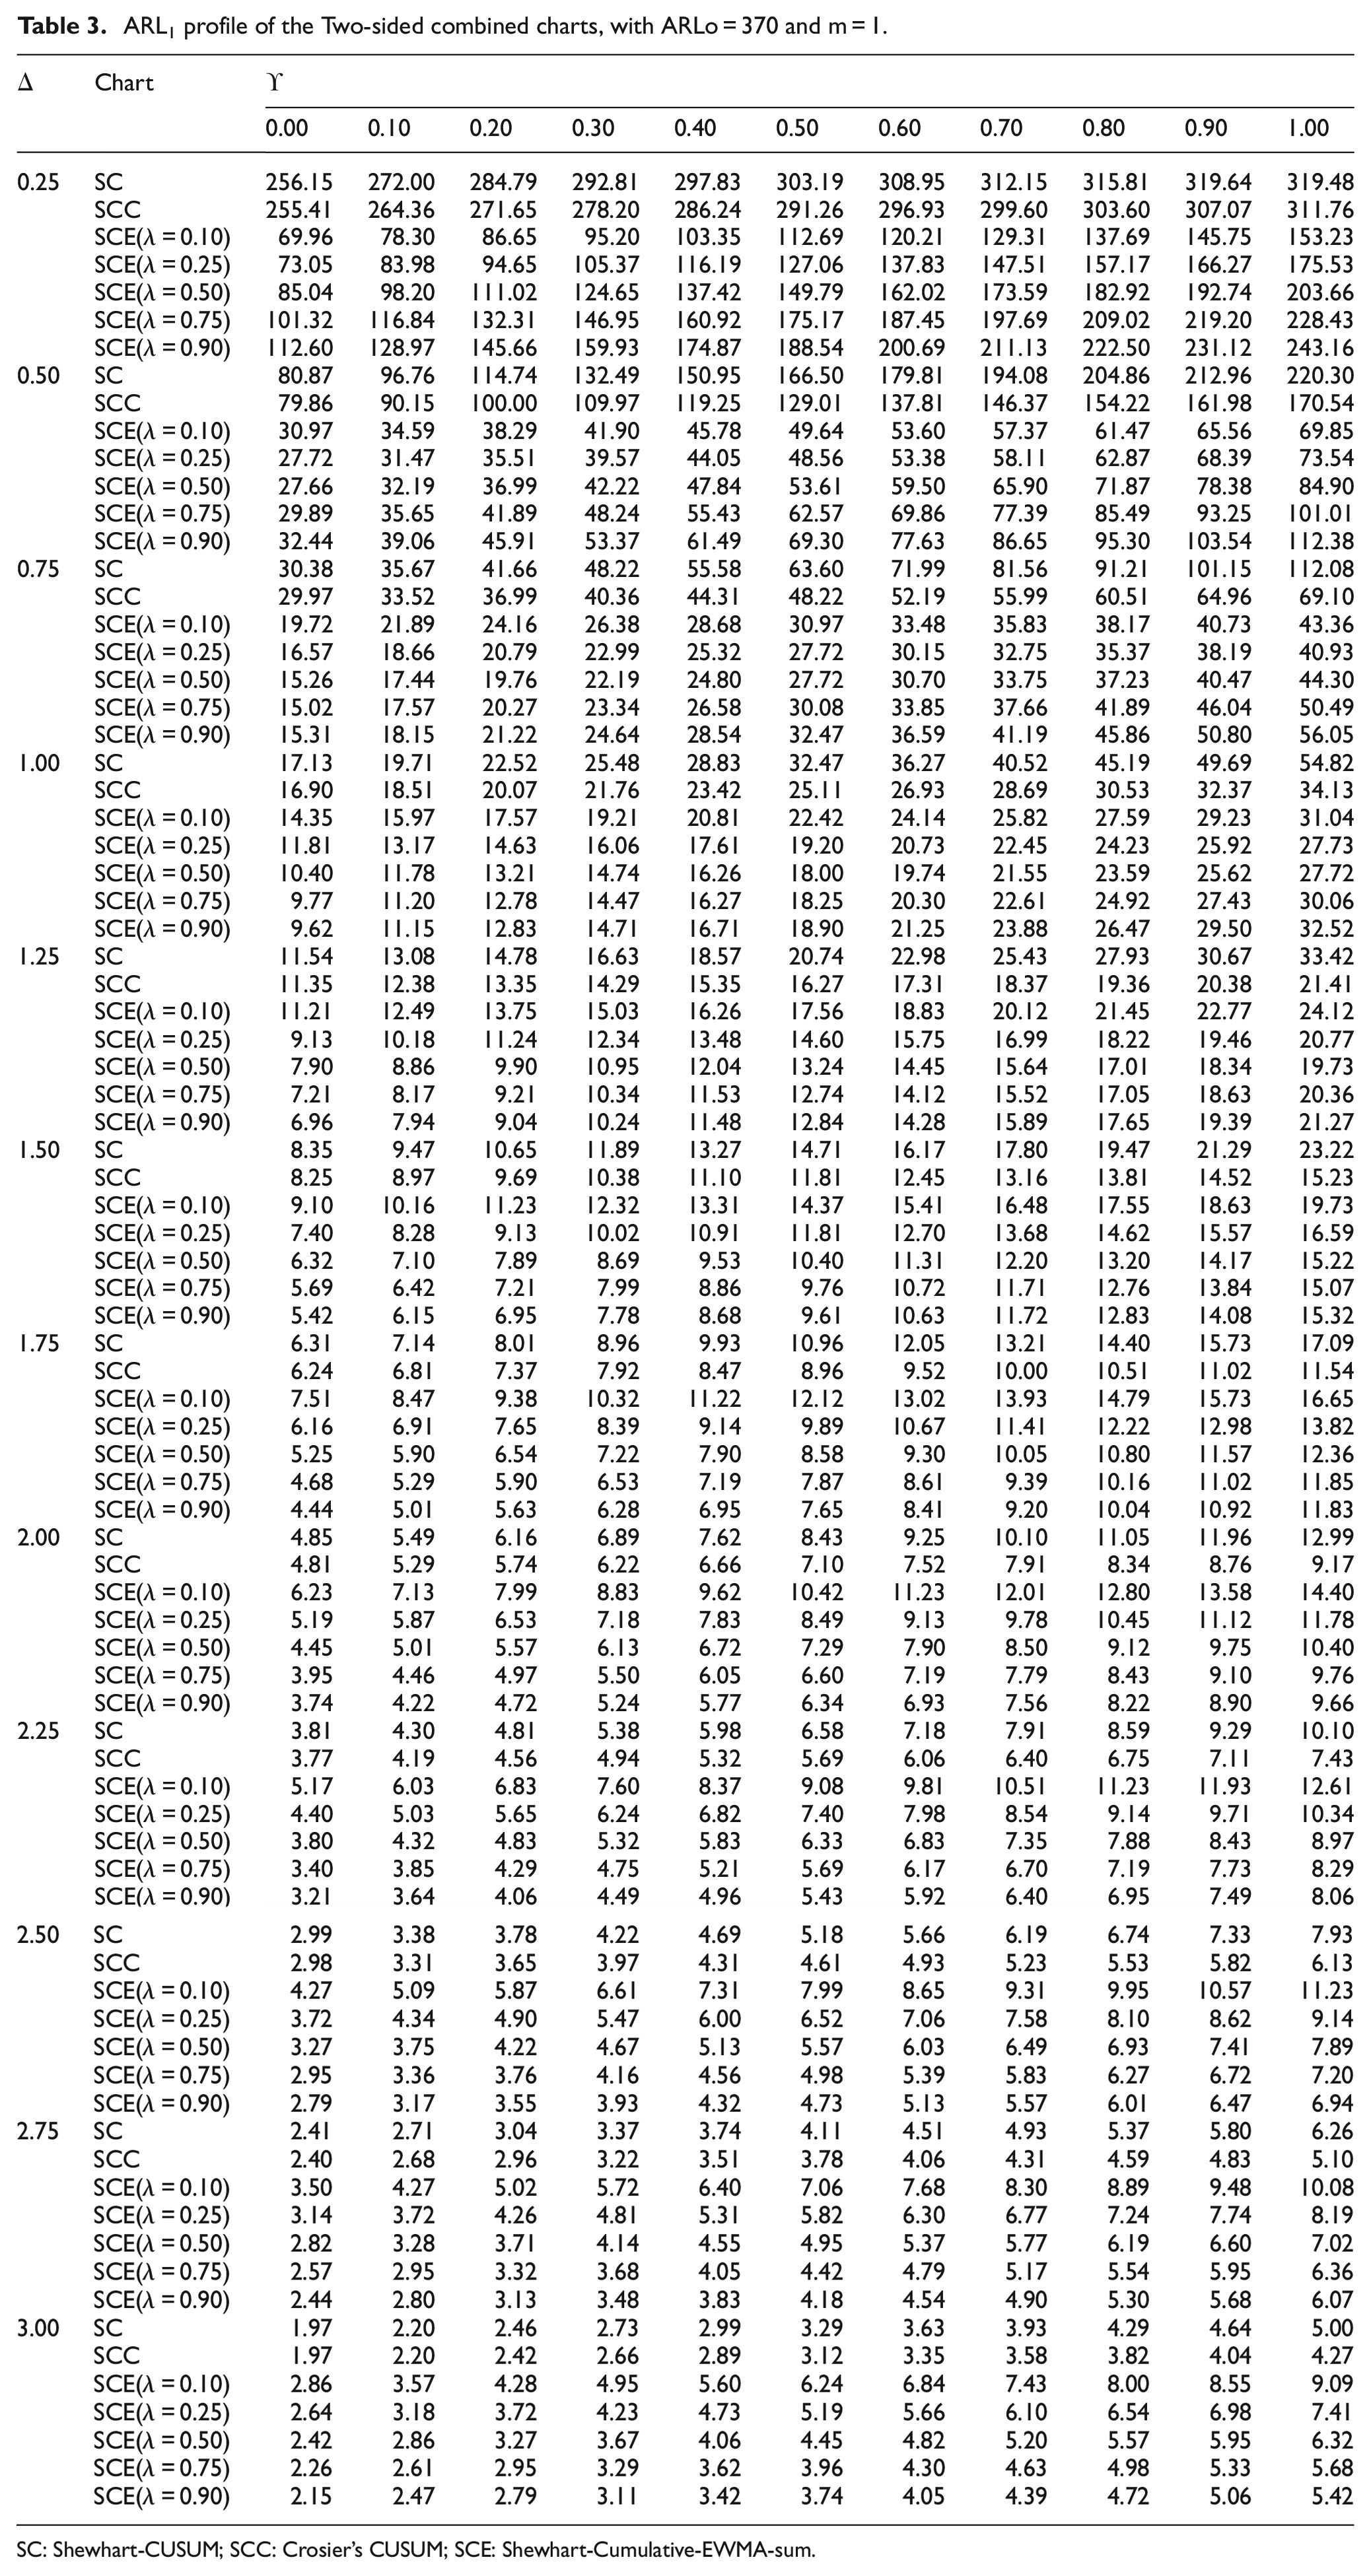
SC: Shewhart-CUSUM; SCC: Crosier’s CUSUM; SCE: Shewhart-Cumulative-EWMA-sum.
ARL1 profile of the Two-sided combined charts, with ARLo = 370 and m = 2.
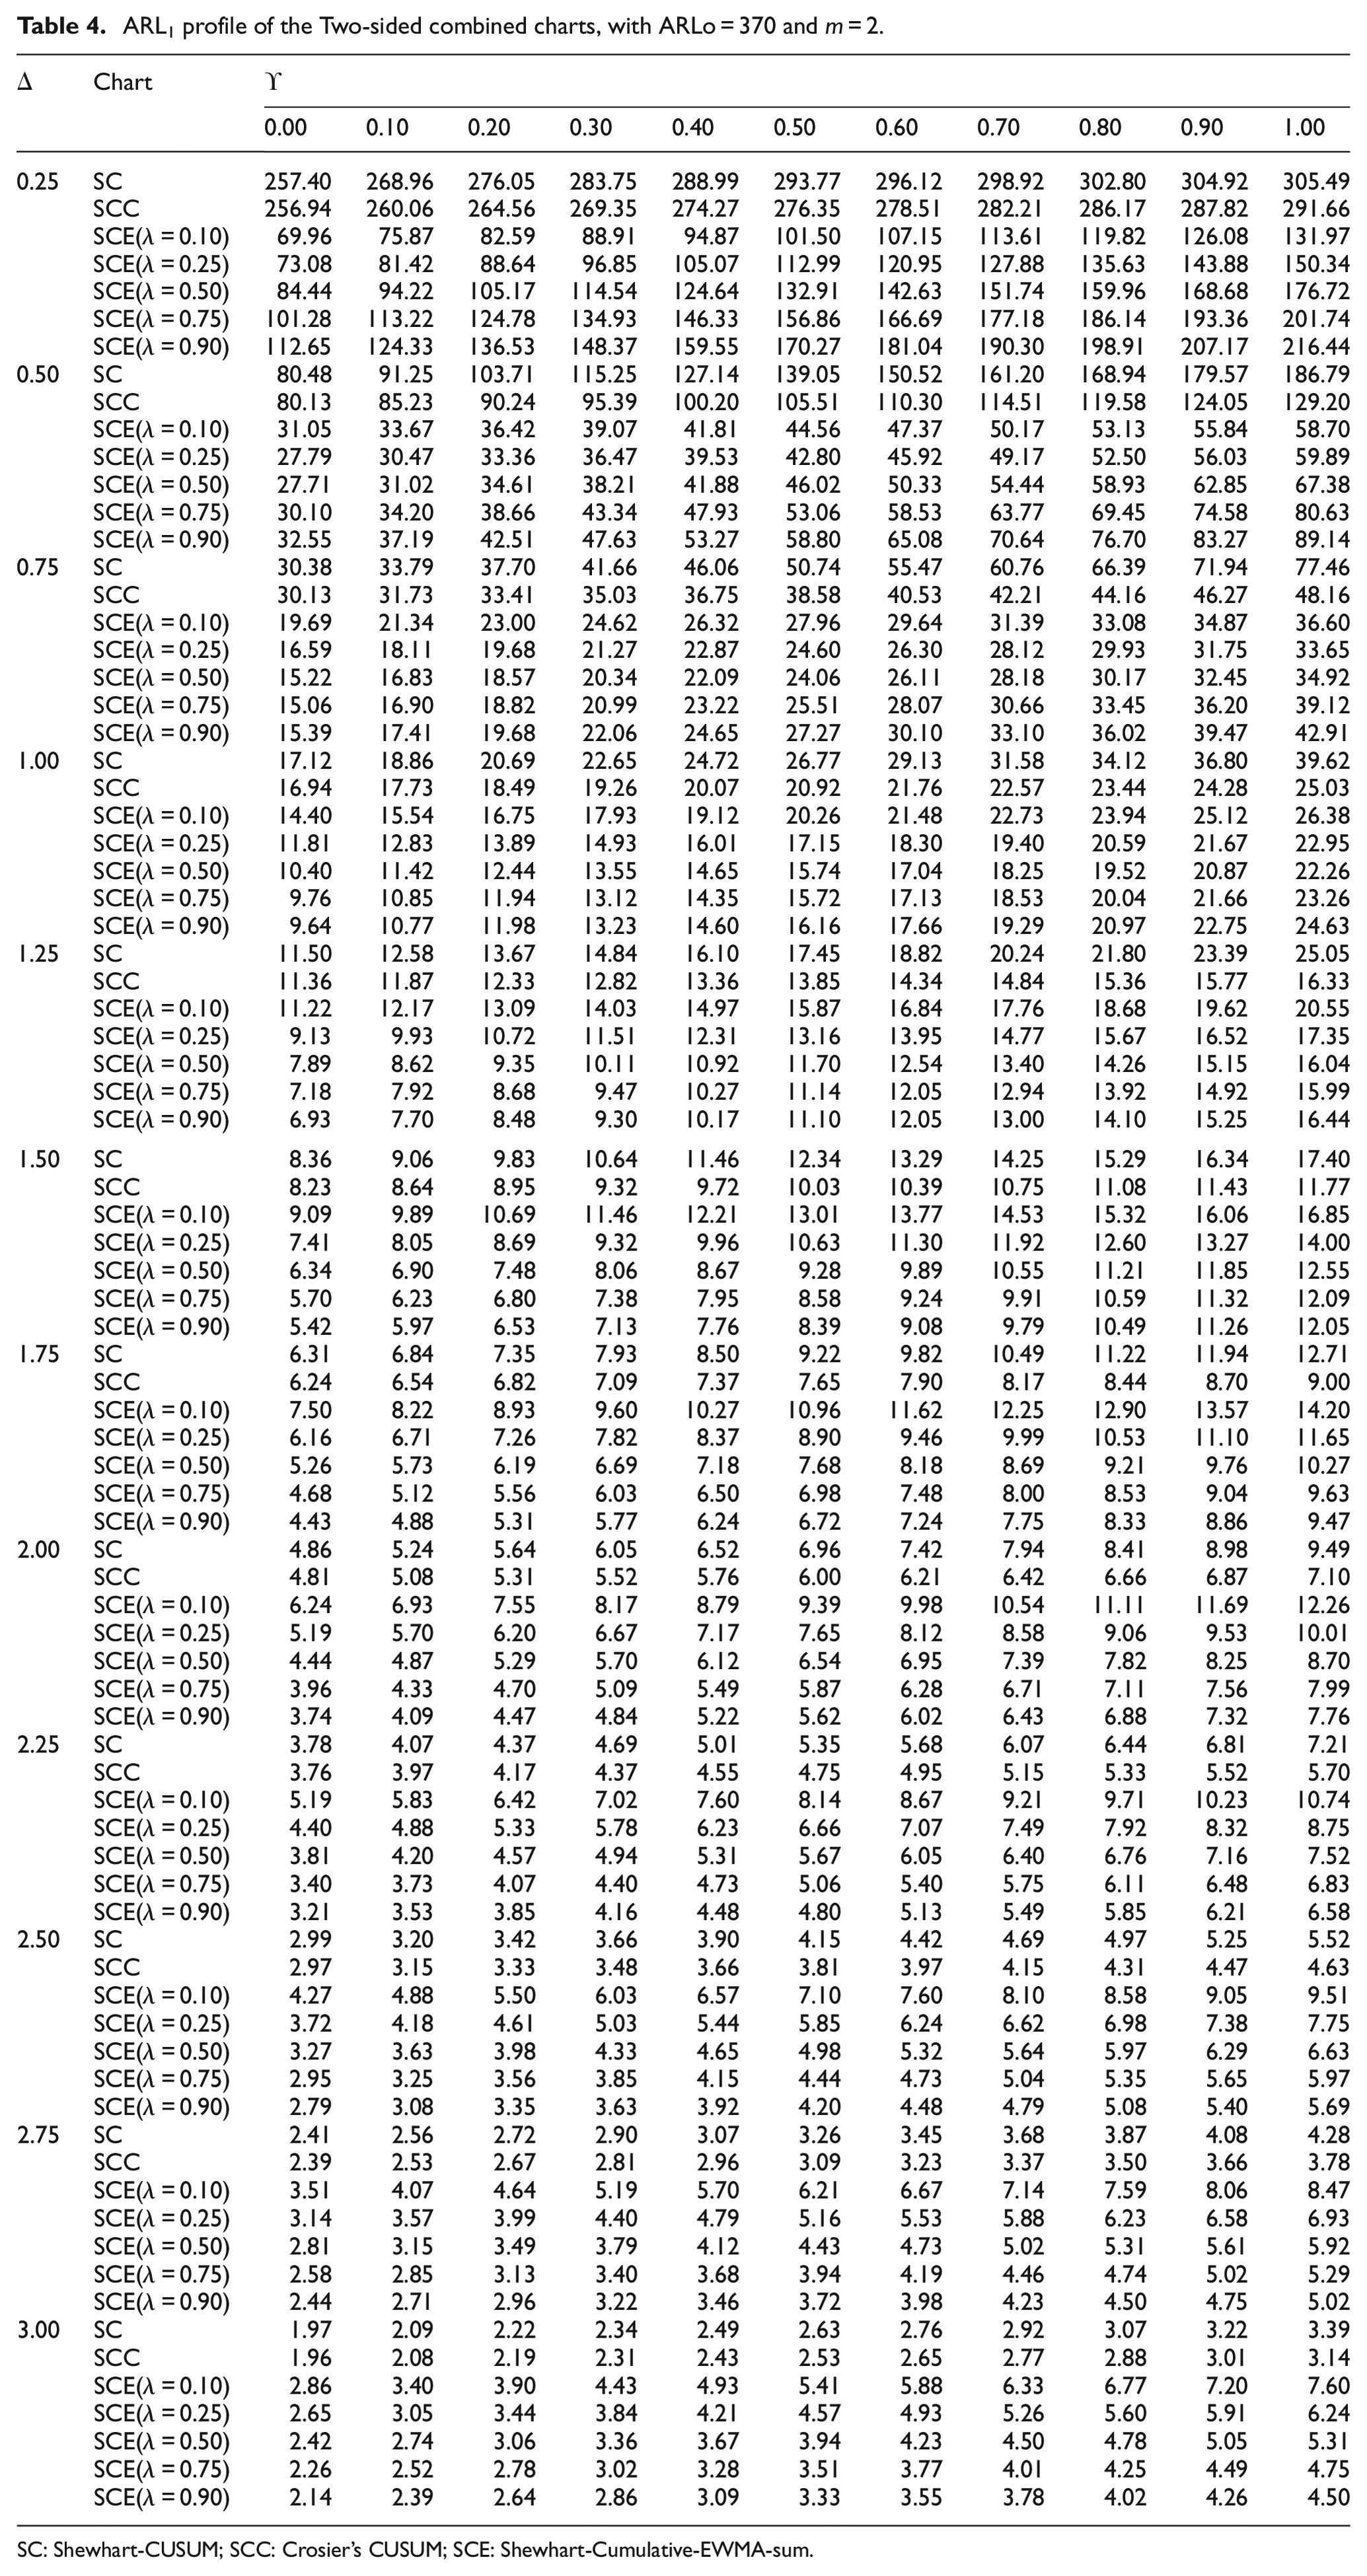
SC: Shewhart-CUSUM; SCC: Crosier’s CUSUM; SCE: Shewhart-Cumulative-EWMA-sum.
ARL1 profile of the Two-sided combined charts, with ARLo = 370 and m = 3.
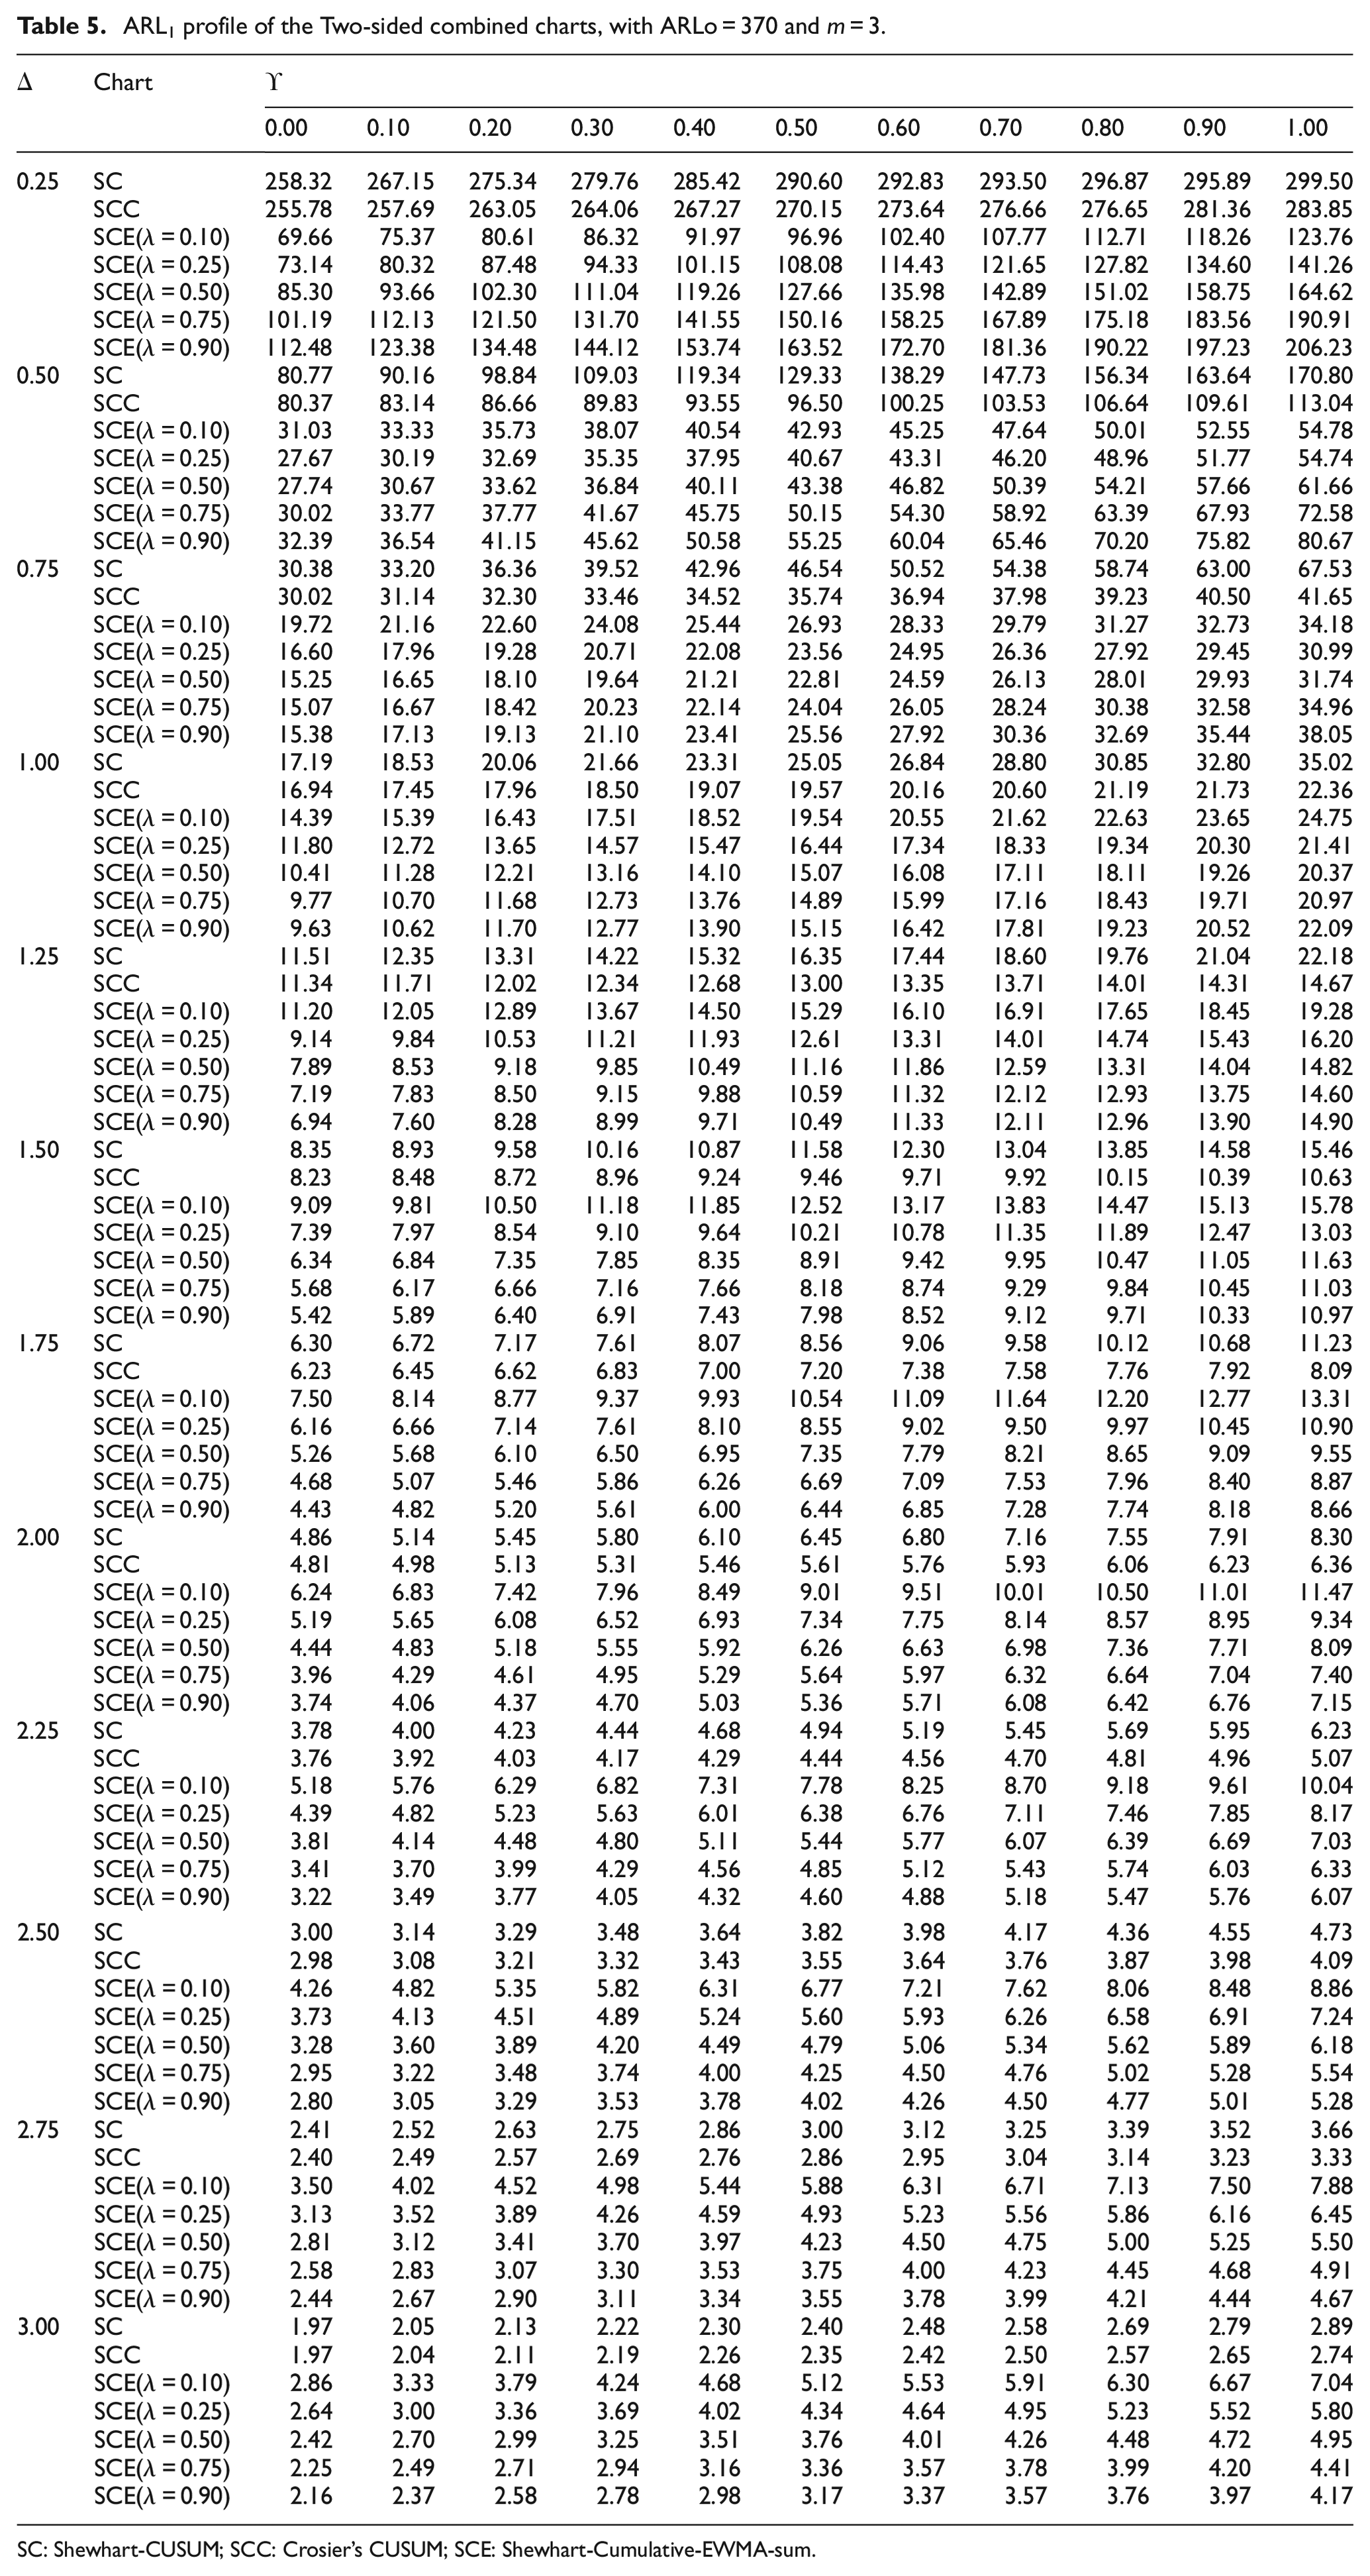
SC: Shewhart-CUSUM; SCC: Crosier’s CUSUM; SCE: Shewhart-Cumulative-EWMA-sum.
ARL1 profile of the Two-sided combined charts, with ARLo = 370 and m = 4.
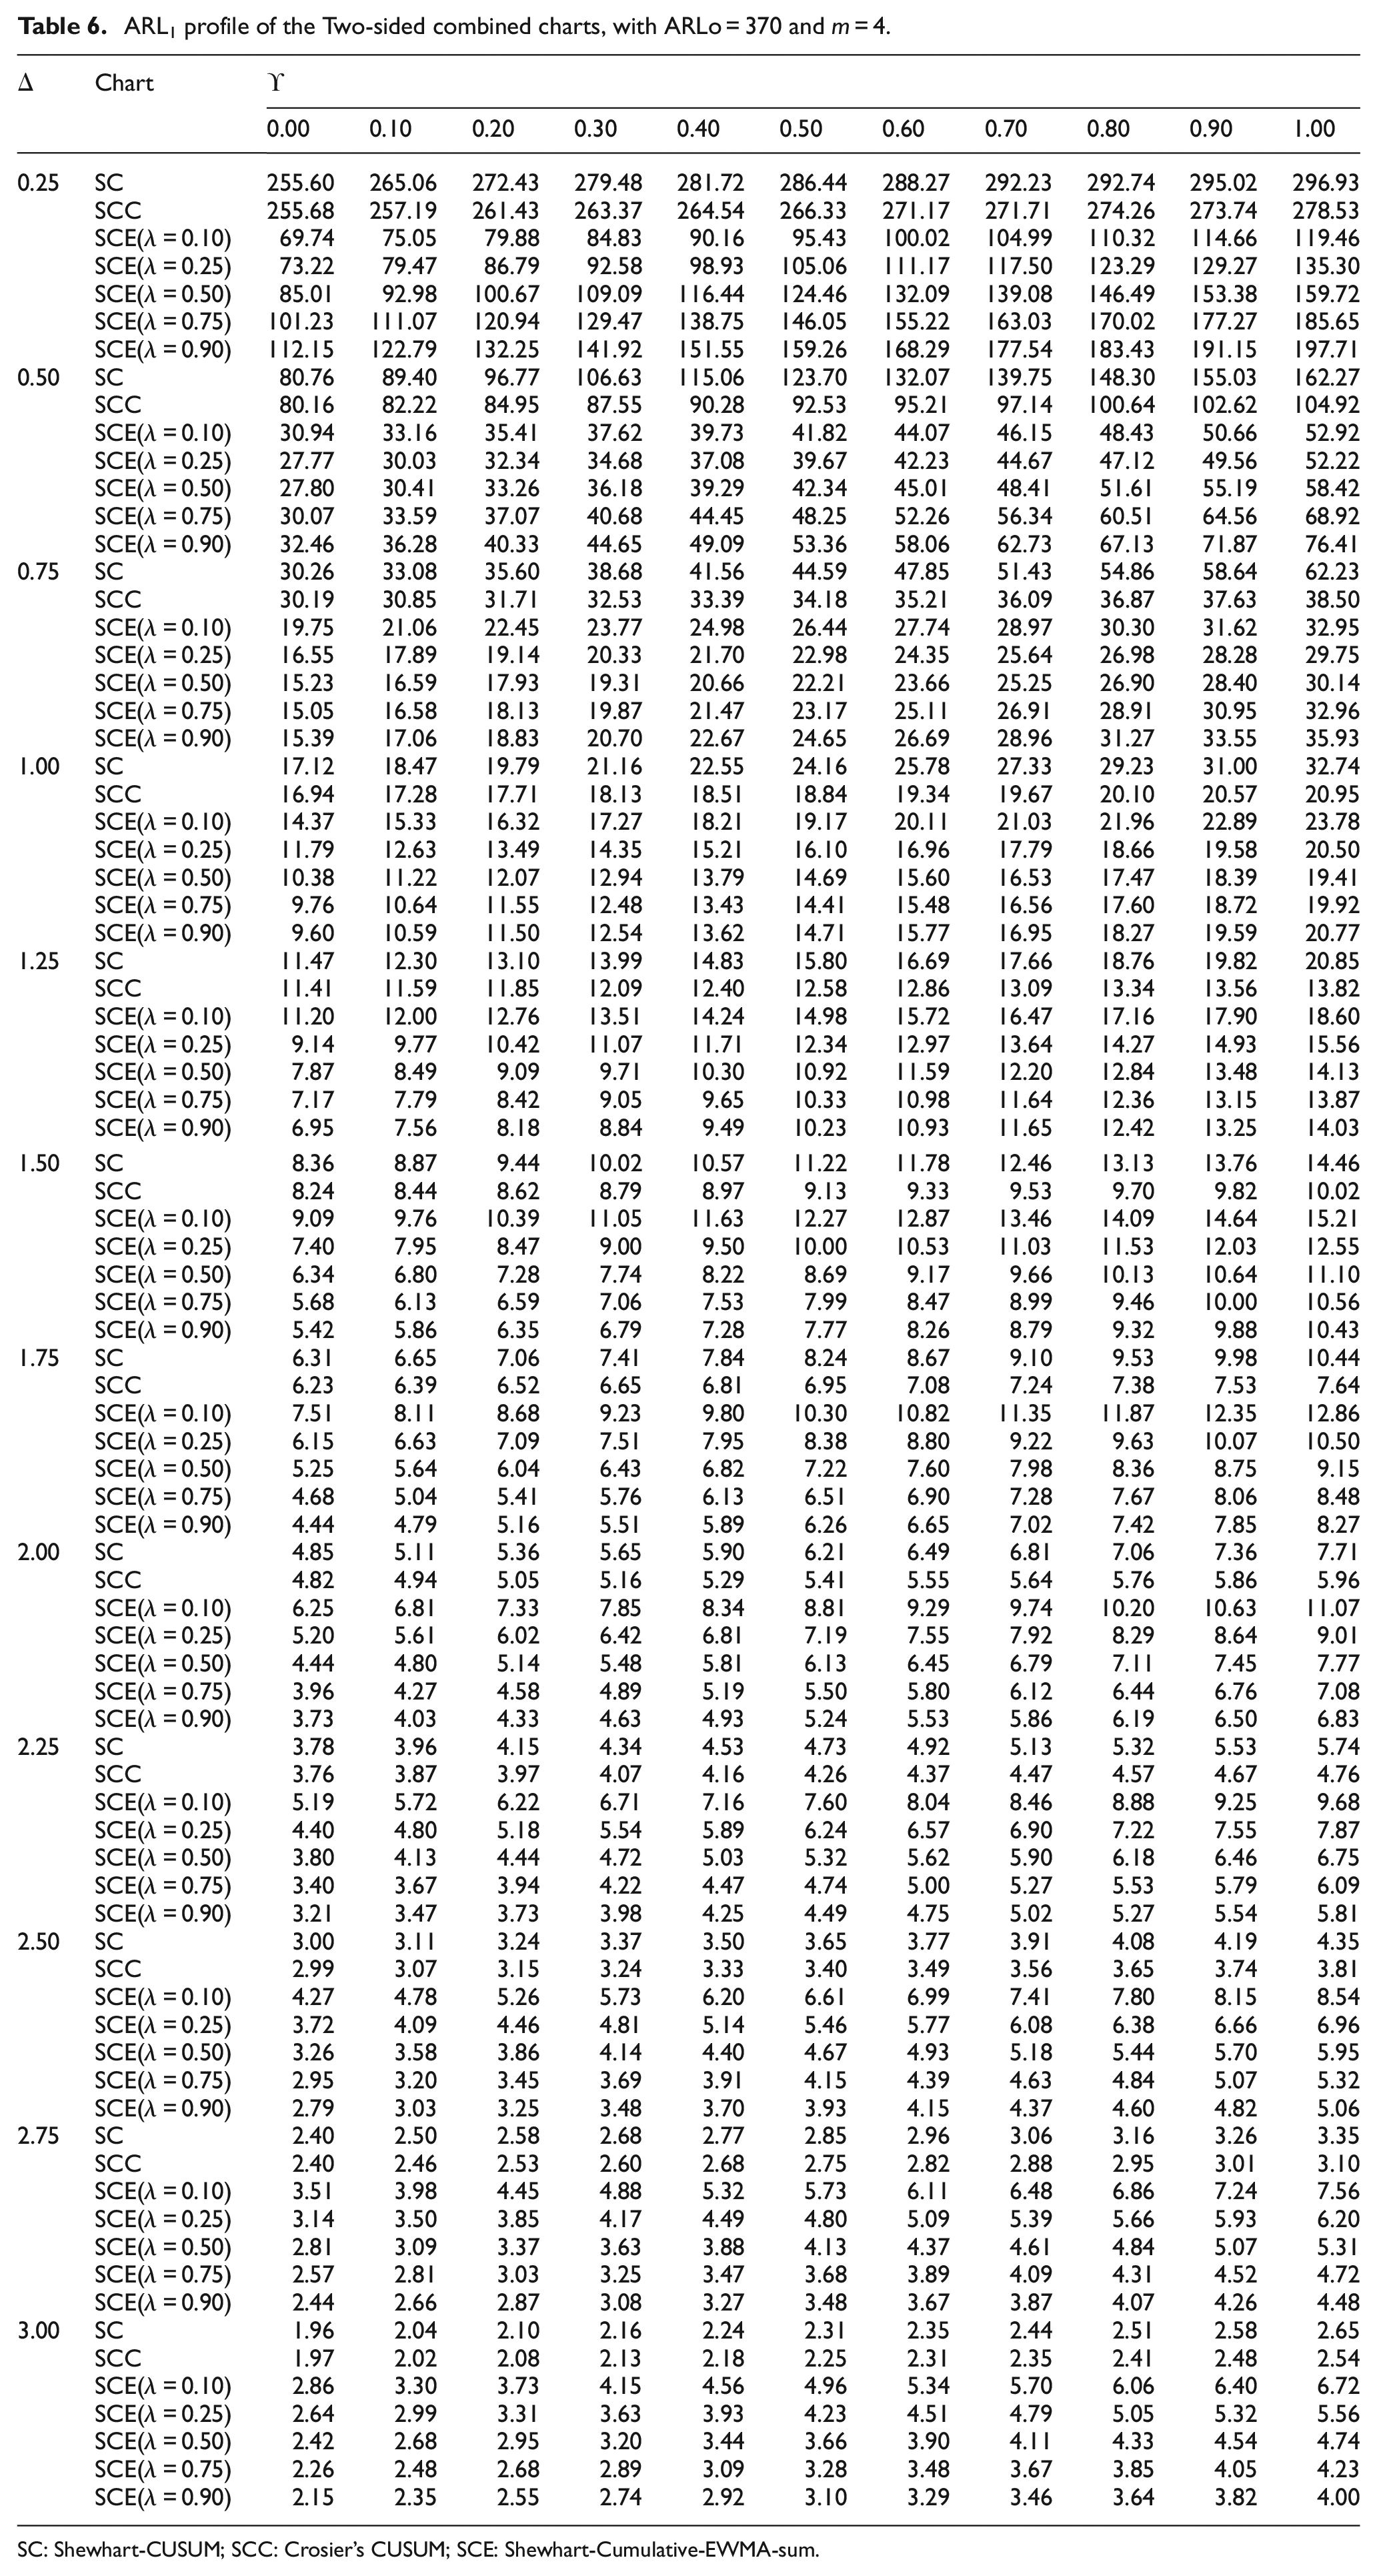
SC: Shewhart-CUSUM; SCC: Crosier’s CUSUM; SCE: Shewhart-Cumulative-EWMA-sum.
On the similar lines of Linna and Woodall,
16
Munir et al.,
11
Nguyen et al.
23
to follow their suggestions and utilization of the multiple measurement scheme was employed as a means to mitigate the impact of measurement error and consequently reduce the ARL1 values for both the proposed and existing charts. This effect can be observed in Tables 3 to 6. Specifically, considering the M-Shewhart-CUESUM chart with
When evaluating the effectiveness of the combined control charts under the influence of measurement error, the M-Shewhart-CUESUM chart demonstrates significantly superior performance compared to the Shewhart-CUSUM and Shewhart-CCUSUM charts. For instance, when considering a shift size (δ) of 0.50 with a measurement replication of
Illustrative examples (applications of study)
In this section, it utilized simulated datasets to illustrate the implementation of both the combined charts without measurement errors and the ones that incorporate measurement errors in the detection of shifts in the process mean.
The Shewhart-CUESUM and CUESUM chart applied to simulated dataset
Assuming a normally distributed underlying process {
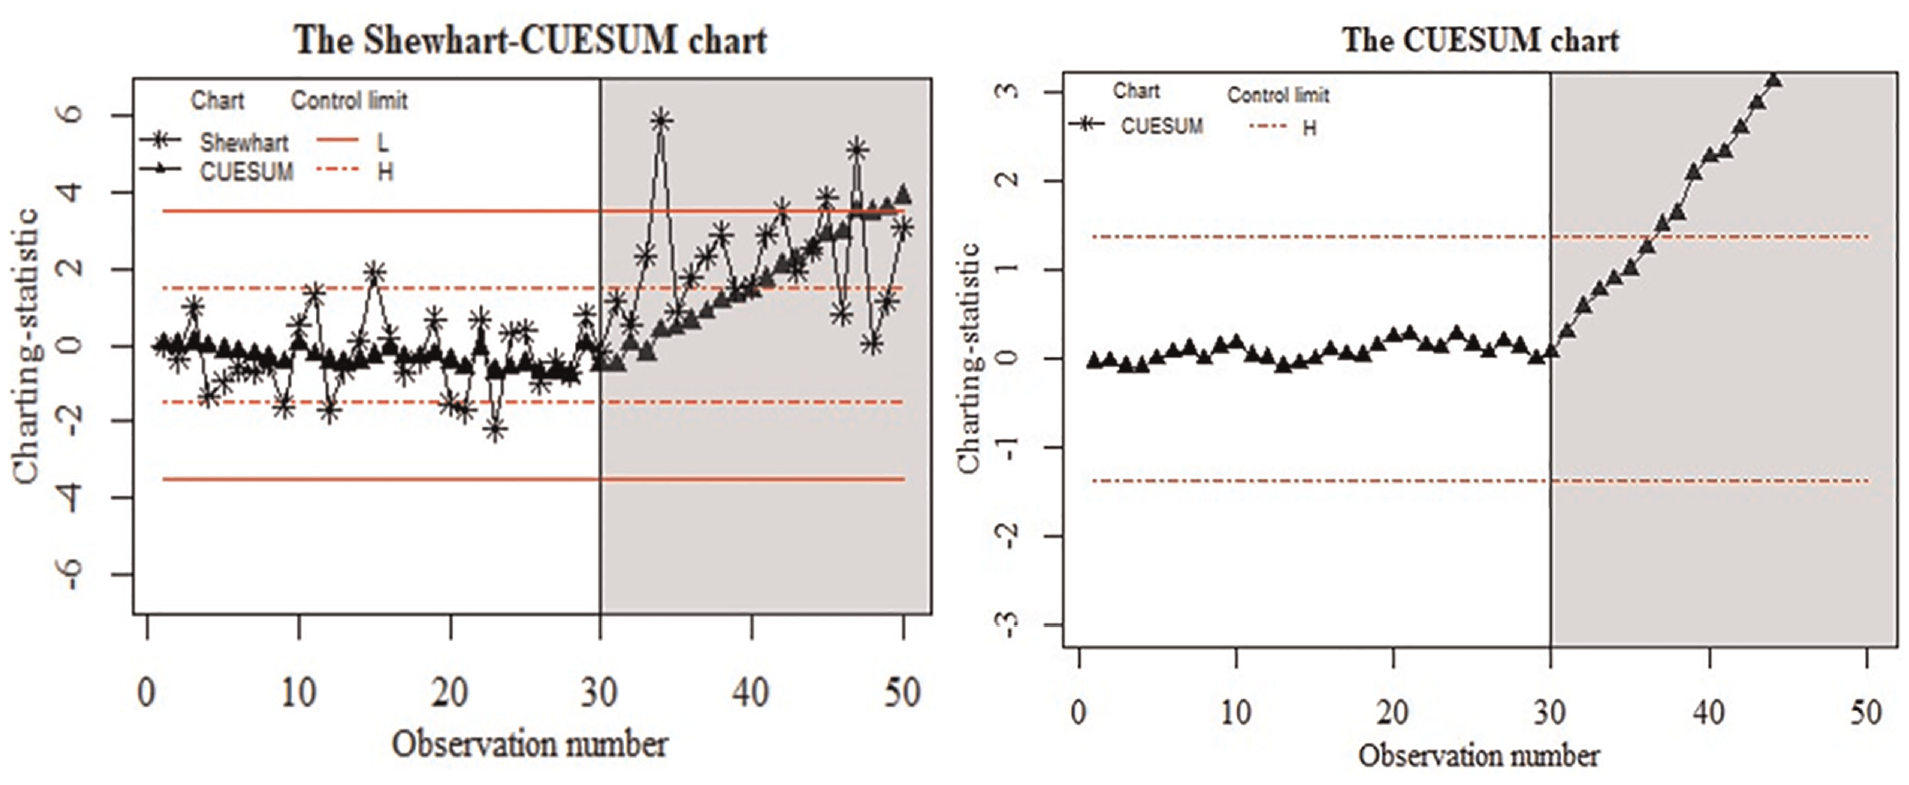
The existing and proposed charts for the simulated dataset.
The observed control charts clearly indicate that the underlying process remains in the in-control state for the initial 30 samples. However, in the last 20 samples, the process becomes out-of-control, as evidenced by the occurrence of out-of-control signals on these control charts. The Shewhart-CUESUM chart and the CUESUM chart both first detect out-of-control signals at the 35th and 37th samples, respectively. It is worth noting that the Shewhart-CUESUM chart exhibits earlier signal detection compared to the CUESUM chart, suggesting that the former is more sensitive than the latter.
The combined charts applied to measurement error-based simulated data
Assuming a normal distribution for the underlying process
To examine different scenarios of measurement errors, we consider three situations: no errors (γ = 0), error variation accounting for 40% of the process variation (γ = 0.4), and error variation accounting for 80% of the process variation (γ = 0.8). The charts’ parameters of the Shewhart-CUSUM, Shewhart-CCUSUM, and M-Shewhart-CUESUM charts are as follows:
These parameters of the studied charts are to achieve the ARL0 of 370 at the process is in-control state. Figures 4 to 6 display the control charts for the aforementioned scenarios.
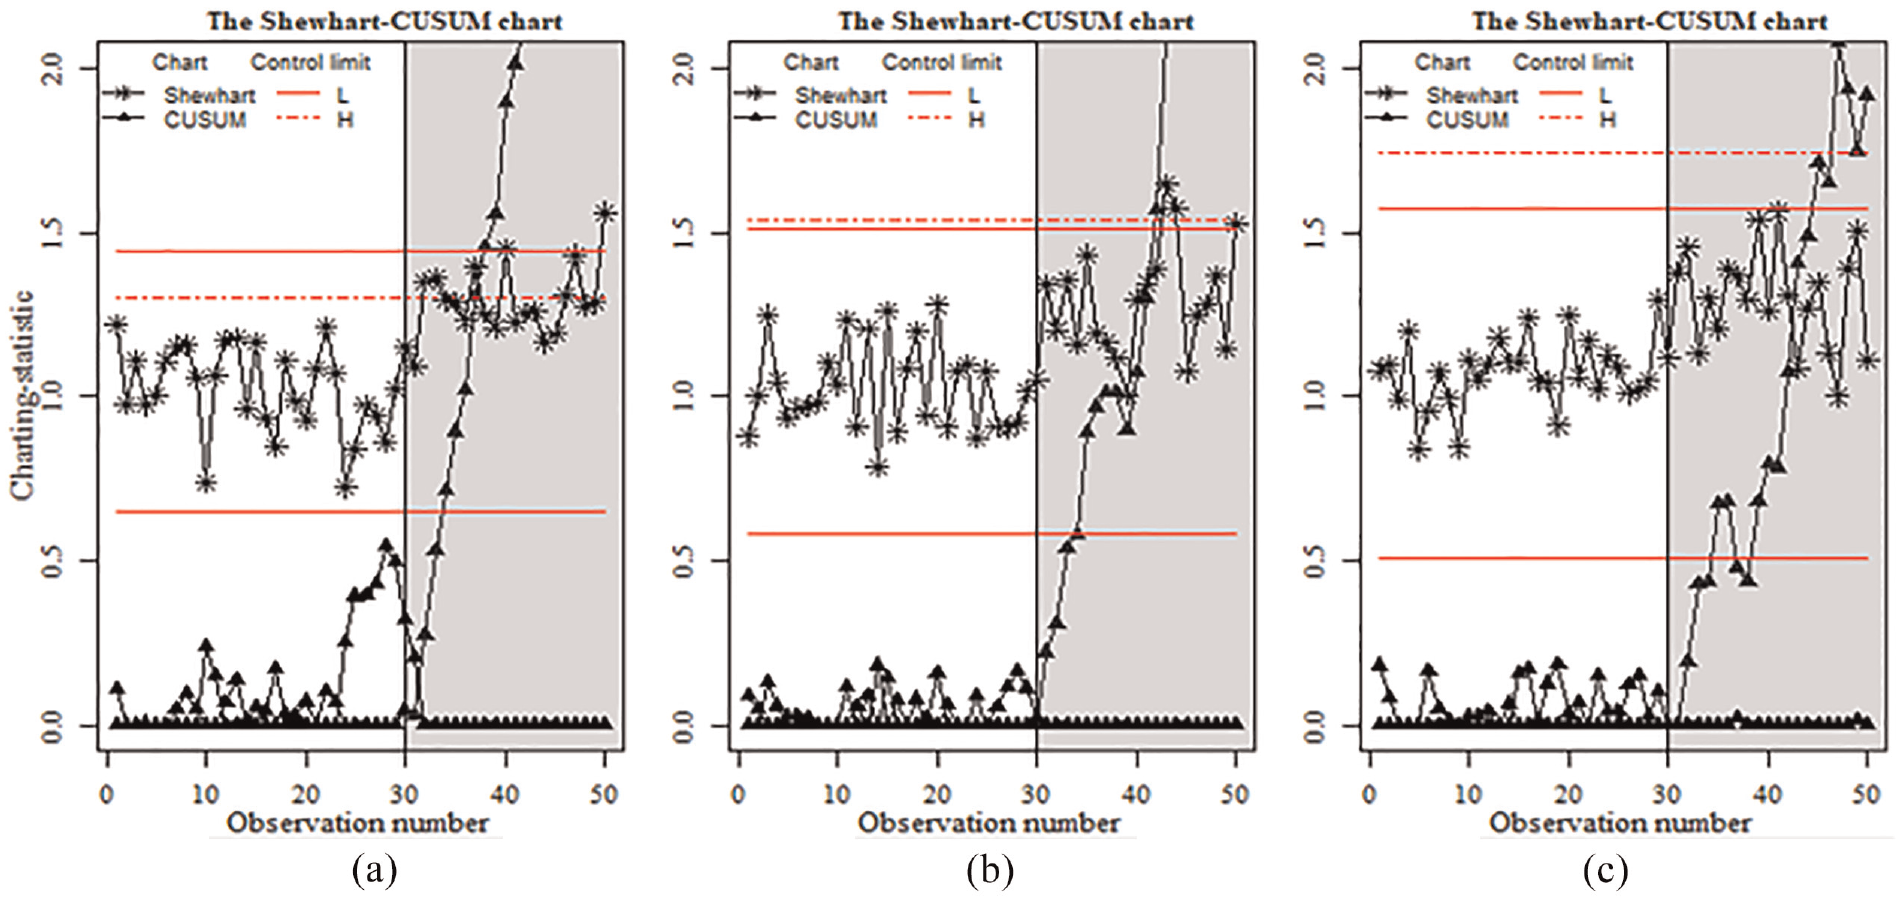
The Shewhart-CUSUM control chart applied to the simulated dataset when ϒ = 0.0 (a), ϒ = 0.4 (b), and ϒ = 0.8 (c).
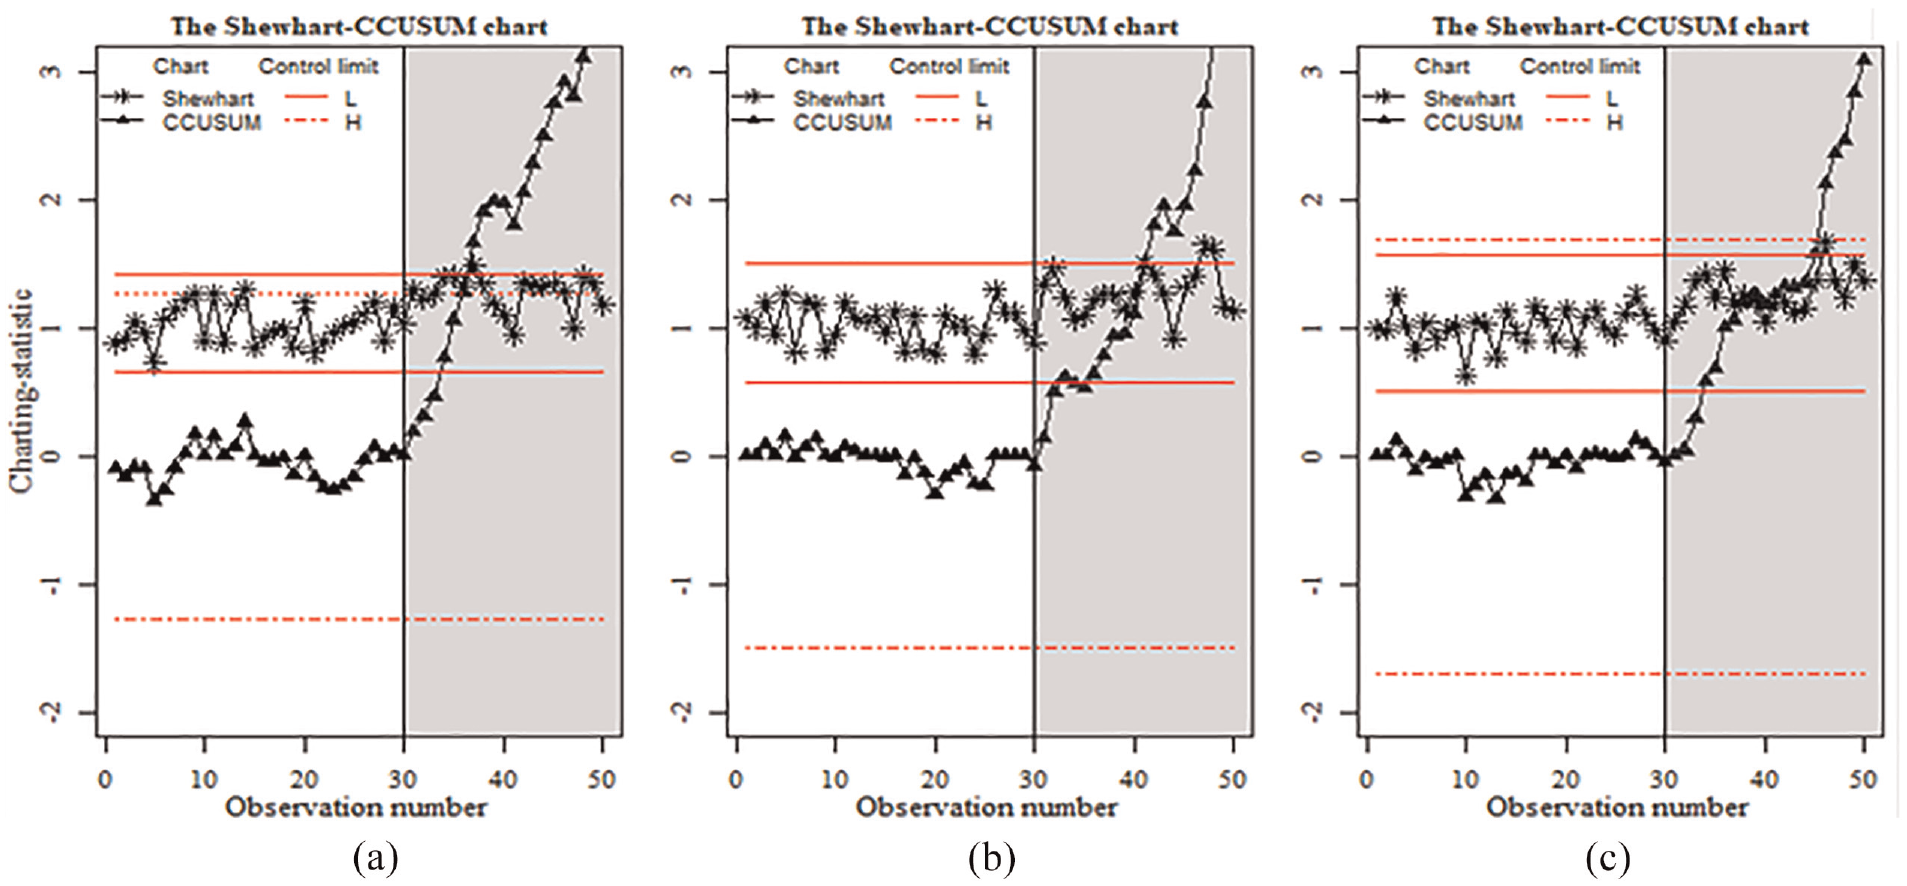
The Shewhart-CCUSUM control chart applied to the simulated dataset when ϒ = 0.0 (a), ϒ = 0.4 (b), and ϒ = 0.8 (c).
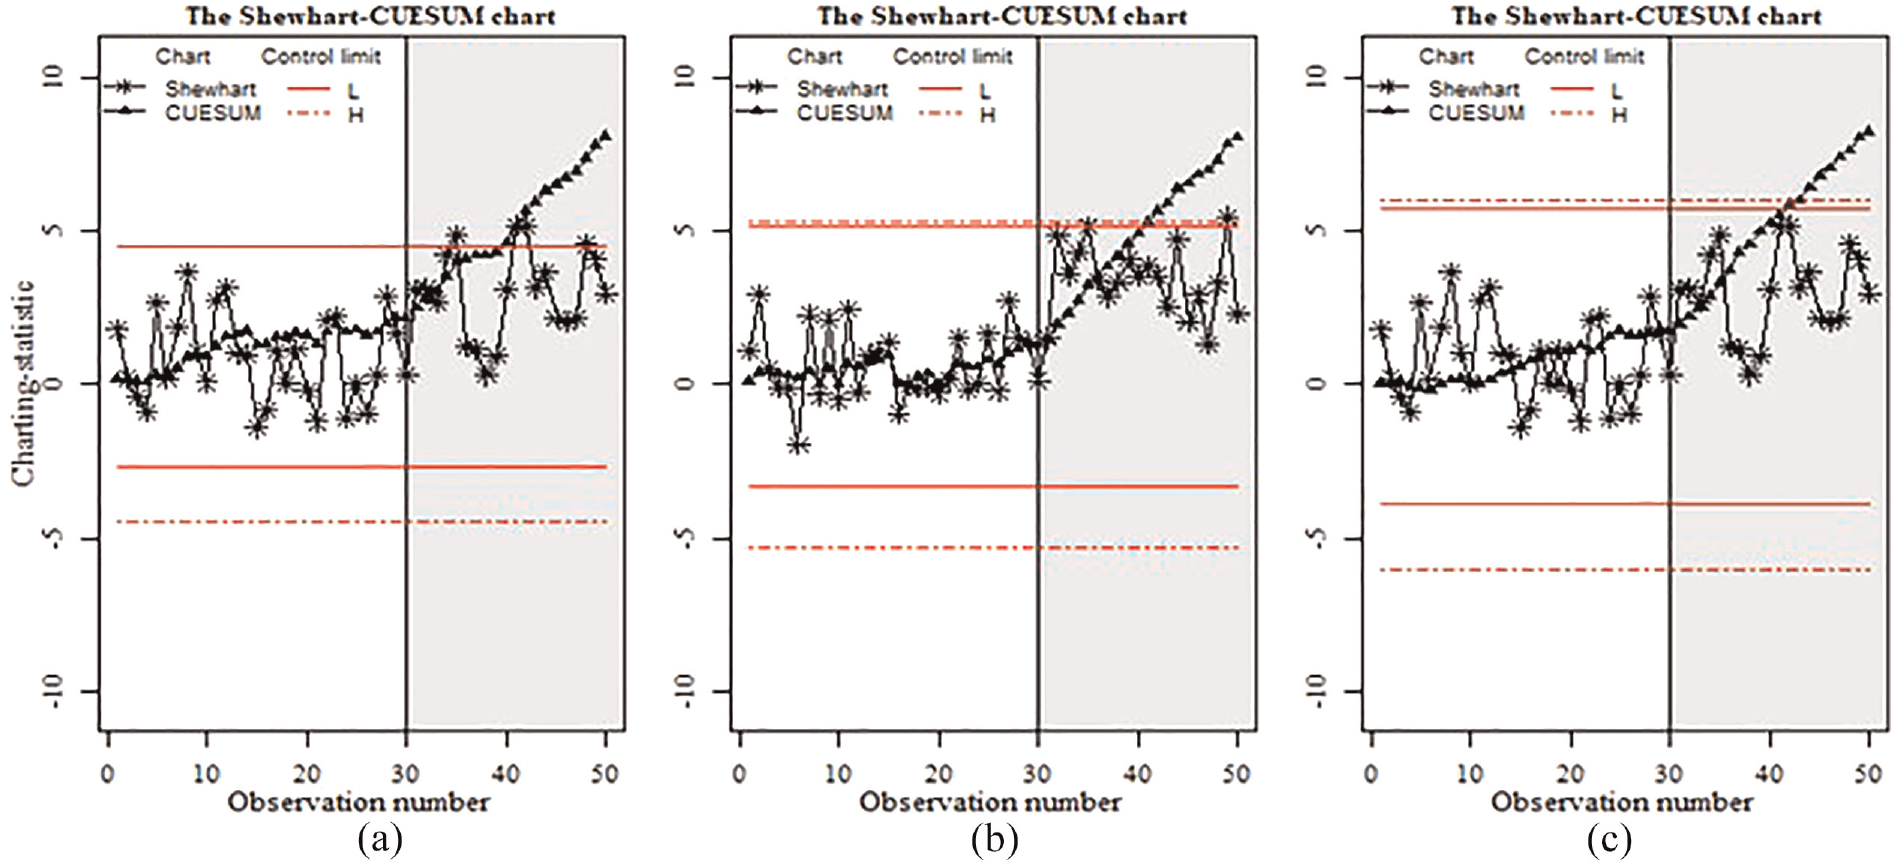
The Shewhart-CUESUM control chart applied to the simulated dataset when ϒ = 0.0 (a), ϒ = 0.4 (b), and ϒ = 0.8 (c).
The figures demonstrate the decline in statistical power for the three charts as the magnitude of measurement errors increases.
In the absence of measurement error denoted by (A) in Figures 4 to 6, the Shewhart-CUSUM, Shewhart-CCUSUM, and M-Shewhart-CUESUM charts detect the first out-of-control signal at sample numbers 37, 36, and 33, respectively. However, by (B) with 40% variation in measurement errors, the out-of-control signals appear at sample numbers 42, 42, and 35, respectively. Similarly, by (C) with 80% variation in measurement errors, the out-of-control signals appear at sample numbers 47, 46, and 37 respectively. These results support the conclusions drawn in Section 4.2, emphasizing the substantial influence of measurement errors on the effectiveness of combined control charts.
Conclusion
This paper proposed the novel Combined Shewhart-Cumulative EWMA-sum (Shewhart-CUESUM) chart for efficient detecting different kind of shifts in mean of a normally distributed process. The performance of the Shewhart-CUESUM chart in the presence of measurement errors is investigated. Through Monte-Carlo simulations, comprehensive run length profiles were computed, including ARL, SDRL, EQL, IRARL, and PCI. Findings indicate that the Shewhart-CUESUM chart outperforms the CUESUM, Combined Shewhart-CUSUM, and Shewhart-CCUSUM charts overall. Despite being influenced by measurement errors, the M-Shewhart-CUESUM chart remains significantly more sensitive than other charts. Utilizing multiple measurements per item helps mitigate the impact of measurement inaccuracy. However, when measurement errors are unavoidable, we recommend using the measurement error-based Shewhart-CUESUM chart as a preferred approach.
For recommendation research work, a Shewhart-CUSUM chart can be designed to simultaneously address violations of the normality and perfect measurement data assumptions. This can be done following the work of Rahlm. 29 Additionally, this study could be extended to consider the combined effects of measurement error and autocorrelation, as done by Costa and Castagliola. 30
Footnotes
Acknowledgements
The authors extend their appreciation to King Saud University for funding this work through the Researchers Supporting Project number (RSPD2024 R803), King Saud University, Riyadh, Saudi Arabia.
Author’s contribution
Tahir Munir: conceptualization, methodology, software, writing - original draft preparation. Fahad M. Alqahtani: conceptualization; methodology, reviewing, and editing, revision. Afaf Alrashidi: Formal analysis, writing - review & editing. Abdu R Rahman: visualization, reviewing, and editing. Salman Arif Cheema: writing - original draft, idea-building discussion. Yi Li: supervision, validation, finalizing.
Funding
This research was supported by Researchers Supporting Project number (RSPD2024 R803), King Saud University, Riyadh, Saudi Arabia.
Declaration of conflicting interests
The author(s) declared no potential conflicts of interest with respect to the research, authorship, and/or publication of this article.
Data availability statement
The data that support the findings of this study are available from the corresponding author upon reasonable request.