
Abstract
Fieldbus transmitters are commonly used in modern industrial productions, particularly in Safety Instrumented Systems (SIS). Safety and security are critical considerations in the design and operation of these transmitters. Previous research has tended to address safety issues and security issues separately, but with the increasing complexity of network technology, it is important to analyze them simultaneously. In this paper, a systematic framework for comprehensively analyzing random failures and cyber-attack failures is proposed. The framework adopts the FMEA-IMEA method, which combines Failure Modes and Effects Analysis (FMEA) and Intrusion Modes and Effects Analysis (IMEA), to analyze failure modes and effects of fieldbus transmitters. In addition, by extending Reliability Block Diagrams (RBD), the impact of random failures and cyber-attack failures on fieldbus transmitters is quantitatively determined. At the same time, calculation approach of the residual error rate (RER), Component counting method, and Monte Carlo are used to determine random failure rate and cyber-attack failure rate. Using fieldbus pressure transmitter and fieldbus temperature transmitter as examples, the results demonstrate that security issues can significantly impact the safety integrity level. In fact, the safety integrity level is reduced from SIL3 to SIL1 when cyber-attacks are considered. Compared to existing FMEA, the proposed approach offers a more comprehensive analysis of random failures and cyber-attack failures in fieldbus transmitters.
Introduction
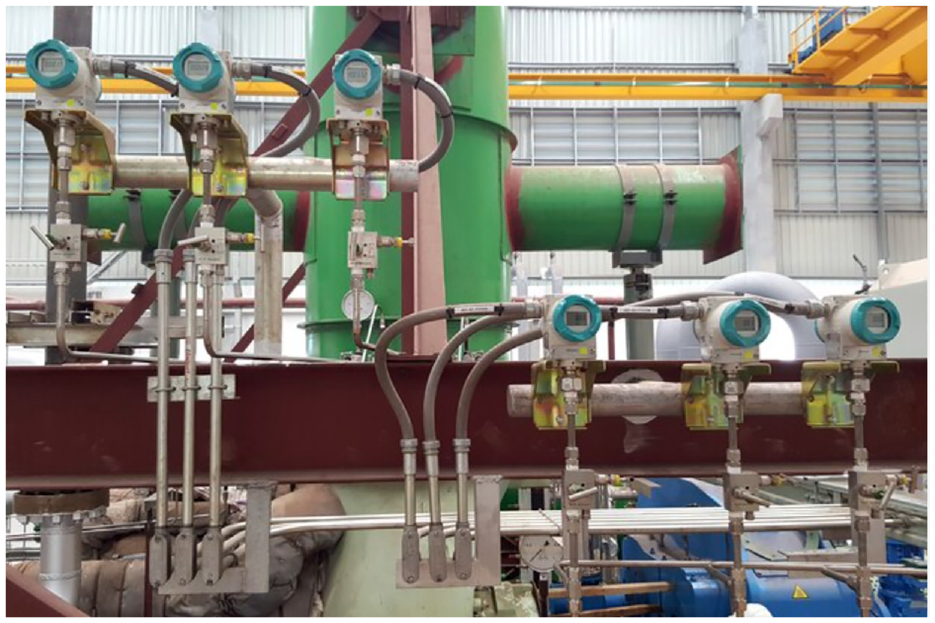
Industrial control systems (ICS) are critical to modern industrial processes, and safety instrumented systems (SIS) are essential for ensuring their safety and reliability. SIS have a wide range of applications in various industrial areas, including intelligent manufacturing, 1 chemical production, 2 and power grids (Figure 1). 3 SIS consist of complex information communicators and embedded devices that are interconnected with the network/physical world through sensors and actuators. 4 These sensors collect real-time data from the physical environment, while actuators perform specific operations based on the information processed by SIS, ensuring the safe and reliable operation of industrial processes. Unlike traditional production methods, equipment in SIS no longer work independently but form a cooperative group through wired or wireless networks. 5 The network between equipment also brings both potential threats such as malware attacks or manipulation. SIS are typically divided into three main sub-systems: input components (such as transmitters or sensors), logic solvers, (usually implemented by programmable electronic controllers (PLC)), and actuation components (such as safety valves or circuit breakers), 6 as shown in Figure 2. In fieldbus transmitters, 7 safety and security are now considered separately, rather than separately. 5
SIS in power plant steam turbine.
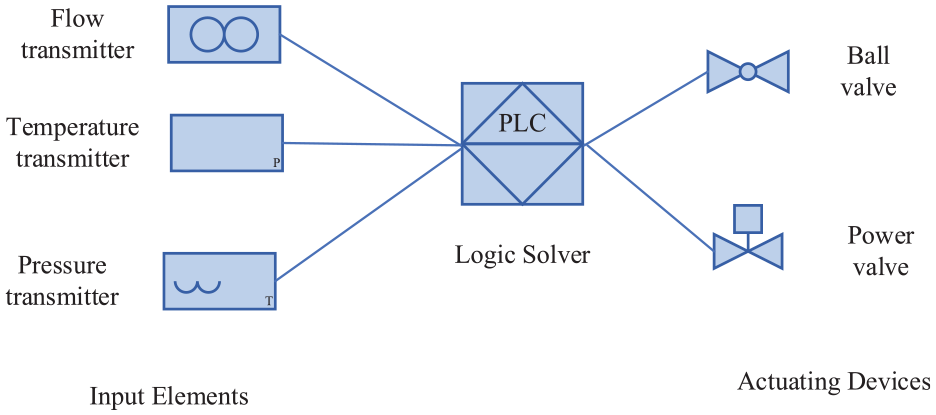
SIS components.
Risk is a combination of probability and severity of a hazard occurring, which is influenced by environment, equipment, and human factors. The probability of a hazard occurring is related to equipment failures. Therefore, it is necessary to comprehensively analyze equipment failures. 8
Previous research on the analysis of safety and security in fieldbus safety transmitters has primarily focused on assessing functional safety. Traditional methods, such as Fault Trees, have been used to identify causal factors, 9 but the complex logic may pose challenges in calculating the probability of top-level events. 10 Similarly, Hazard and Operability (HAZOP) analysis identifies potential hazards through analyzing failure modes and their related effects, with results presented in the form of guiding words. 11 Layers of Protection Analysis (LOPA) provides a semi-quantitative approach to assess hazard scenarios and describe related risks. 4 Unfortunately, these approaches ignore the security vulnerabilities of fieldbus safety transmitters and the potential consequences they may cause, potentially resulting in system failures. In addition, existing analysis methods for cyber-attack threats, including Analytic Hierarchy Process (AHP), 12 Event Trees, 13 steady-state vulnerability assessment (SSVA), 14 and Attack Trees, 15 mainly focus on assessing network attack threats. These methods are not sufficient to comprehensively addressing the critical research trend of integration analysis random failure and cyber-attack failure.
In order to address this knowledge gap, researchers have explored innovative approaches to integrate safety and security analysis. Sulaman et al. used STPA to address risk issues. 16 Unlike traditional risk analysis methods, STPA is not limited to potential attacks, it focuses on identifying and controlling system vulnerabilities. 17 Young and Leveson proposed the STPA-Sec method, utilizing STPA to analyze cybersecurity loss scenarios. 18 Friedberg et al. proposed the STPA-SafeSec method to analyze the integration of safety and security. 19 This method is only used for qualitative analysis of systems. Fovino et al. proposed a method that combines Fault Trees and Attack Trees (FT&AT) to simulate risks in systems, 20 with the goal of the attack trees being the event of the fault tree. In 2013, Steiner and Liggesmeyer proposed Component Fault Trees and Attack Trees, which are more suitable for simulating large-scale systems. 21 FT&AT provides a lucid and easily comprehensible logic for both qualitative and quantitative analysis, without a numerical case study. Terje Aven et al. proposed a unified analysis framework for analyzing risks and vulnerabilities in safety and security, particularly suitable for the early stages of systems engineering such as concept and requirement determination. 22 While this method can reduce analysis time and cost, it may be prone to incomplete analysis and the omission of key elements. 23 This poses challenges in comprehensively assessing the integration level of functional safety and security of equipment. Currently, there is no comprehensive framework for analyzing random failures and cyber-attack failures, which includes qualitative analysis and quantitative analysis.
Traditional failure analysis for SIS only considered random failure and system failure.1,24 Safety instrumented systems are currently subjected to various failure modes. Most studies focused on random failure analysis. 25 Research on the integration analysis approach of functional safety and security is still in its early stages, with most studies focused on conceptual stage. 3 However, the impact of cyber-attacks on systems or equipment with functional safety has received relatively little attention. 26
The contributions of this paper are described as follows:
• A novel qualitative and quantitative analysis framework for the integration of random failures and cyber-attack failures and their impacts on fieldbus transmitters is proposed.
• The FMEA-IMEA method is used to address the issue of incomplete dimensions in failure mode analysis.
• The extended RBD is presented to address the challenging task of quantitatively analyzing both random failures and cyber-attack failures, providing a solution to a complex analytical problem.
• Through comparative analysis with FMEA, the study clearly reveals the advantages of the FMEA-IMEA method in failure modes and impact analysis, providing a more comprehensive and integrated analysis framework for safety and security assessment in transmitters.
This paper is organized as follows. The proposed framework includes qualitative and quantitative analysis is described in Section 2. The case study of fieldbus pressure transmitter and temperature transmitter is described in Section 3. Finally, the concluding remark is presented in Section 4.
Integrated failure analysis of safety and security of fieldbus transmitters
This paper presents a unified assessment framework which combines both qualitative and quantitative methods. The combination of FMEA and IMEA is used to qualitatively analyze failure modes and their effects in this framework. For quantitative analysis, an extended RBD is employed to establish the relationship between these failure modes. Monte Carlo, RER, and component counting methods are integrated to derive the failure rate of each part. Specifically, the Component Counting method is used to determine the random hardware failure rate, while RER is used to calculate the random communication failure rate. The cyber-attack failure rate is obtained by Monte Carlo simulation. Finally, the integrated failure rate is determined. The assessment framework is illustrated in Figure 3.
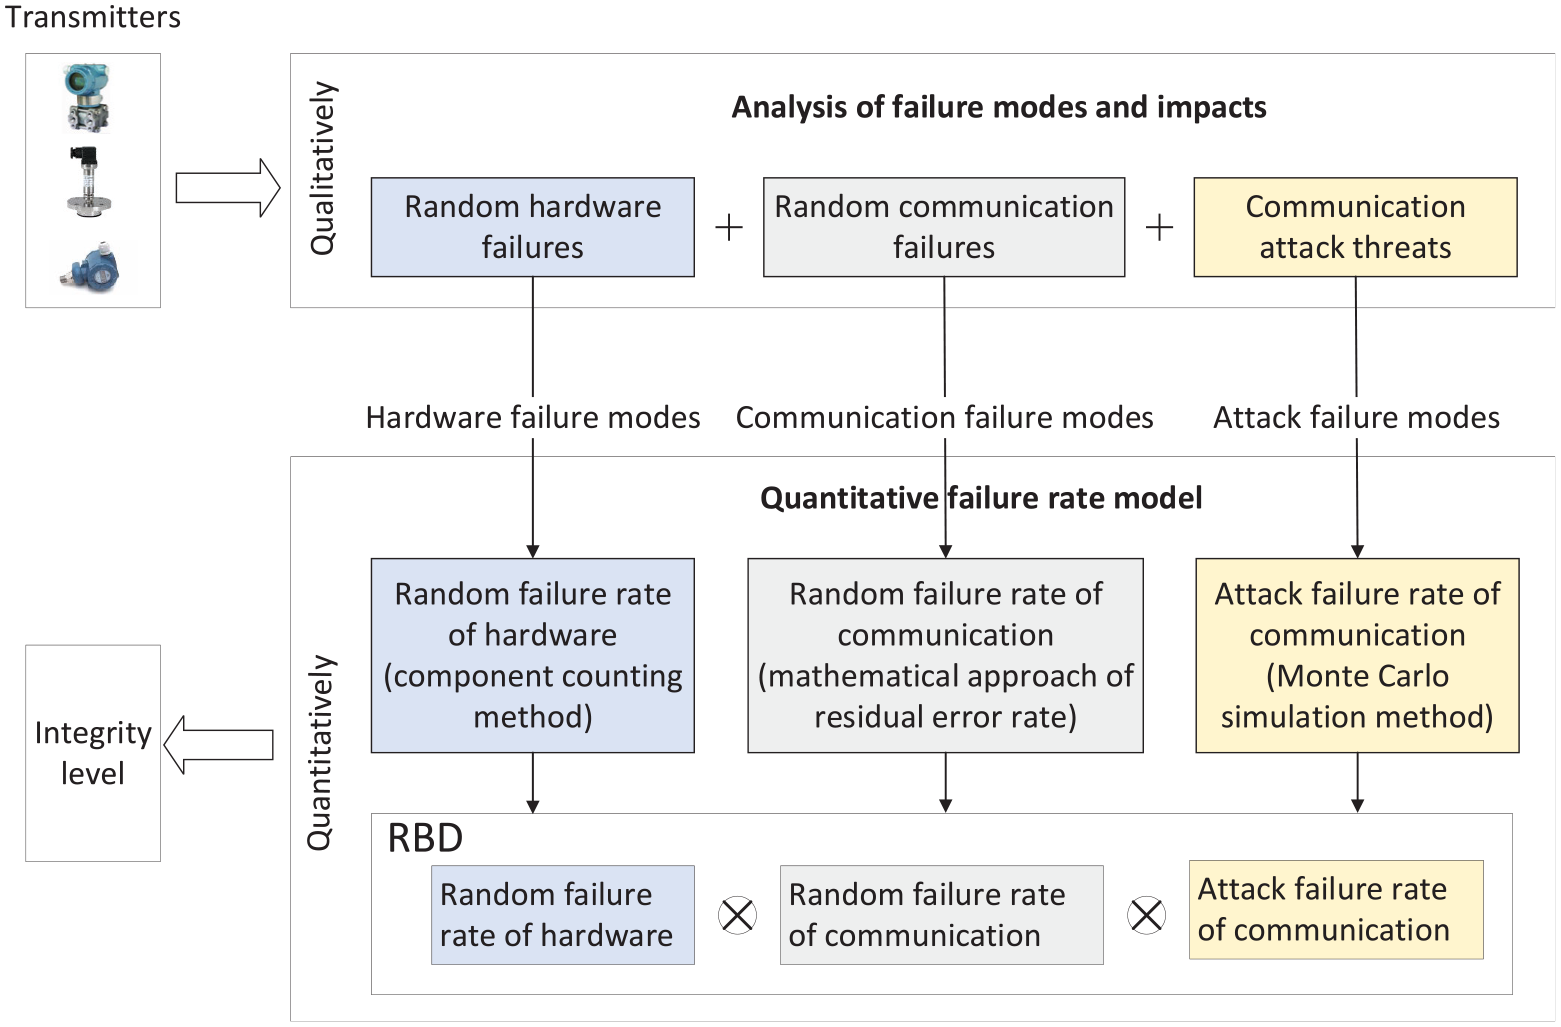
Integrated failure assessment framework for safety and security of fieldbus transmitters.
Qualitative analysis of integration of random failures and cyber-attack failures
FMEA 16 is used to identify both existing and potential failure modes, causes, and consequences of a system or its users. 27 IMEA is used to identify potential intrusion modes and their impacts. IMEA focuses on possible behaviors, goals, and intentions of attackers to identify the threats. 28
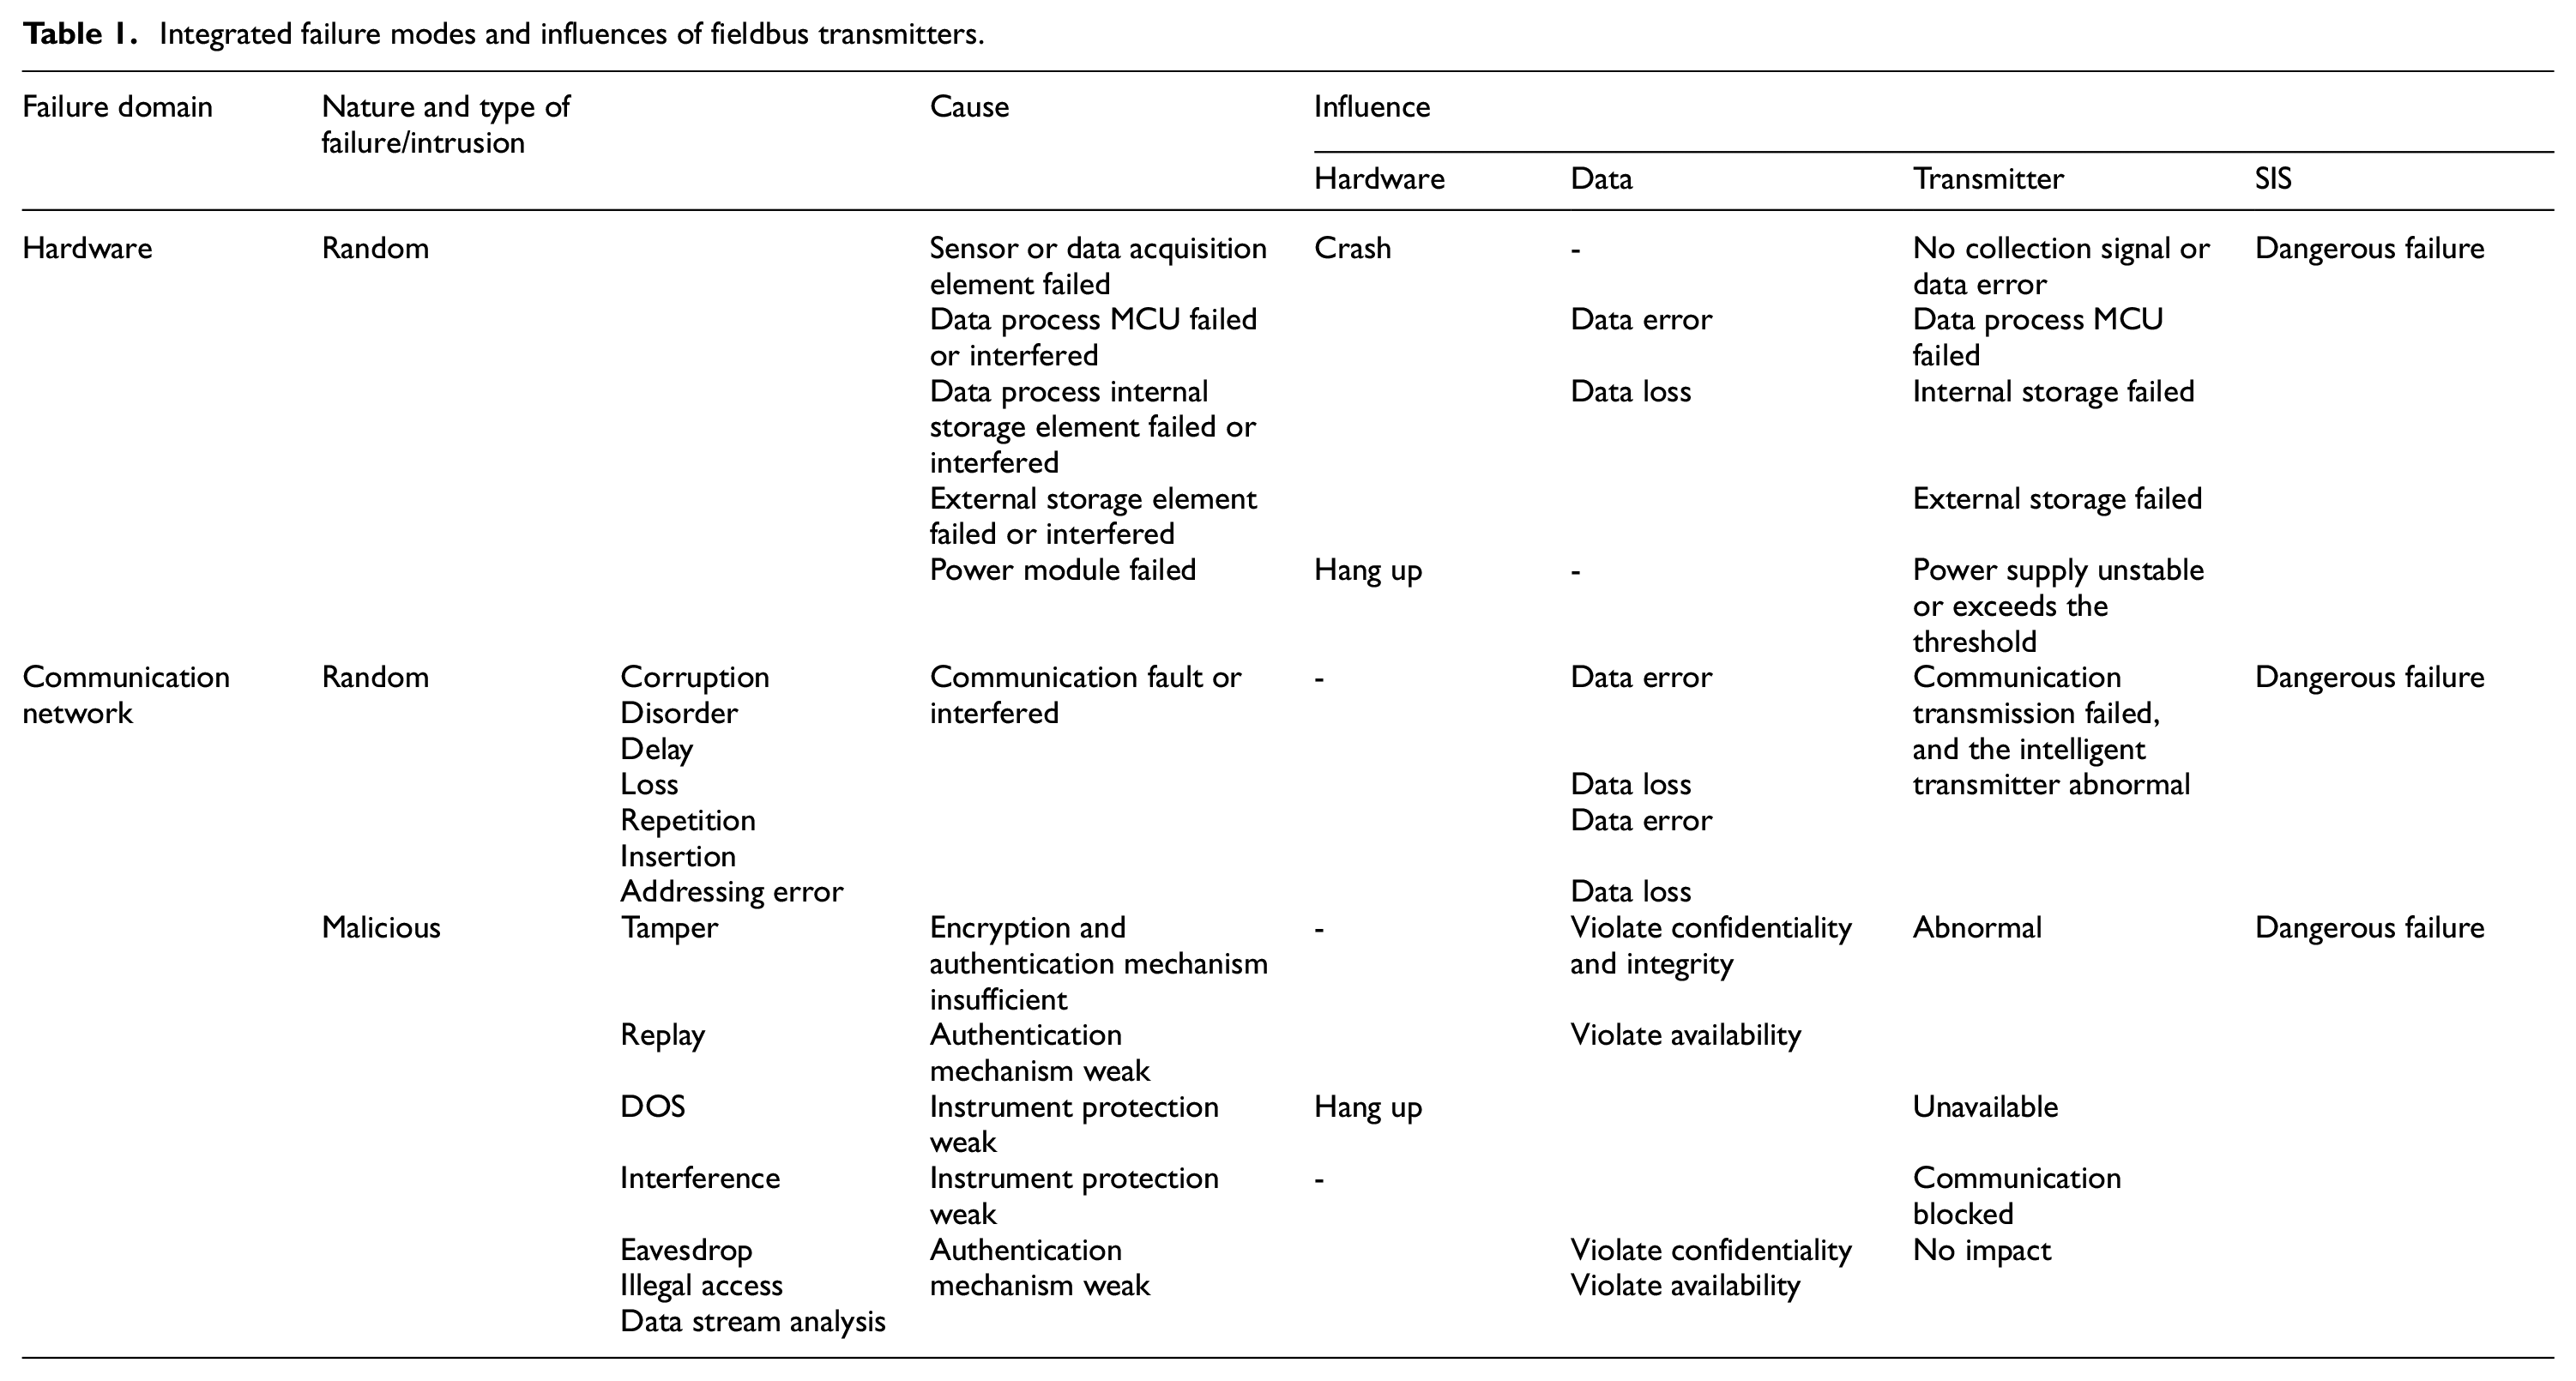
In this study, FMEA is utilized to analyze the impact of random failures of transmitter and fieldbus. The results are summarized in Table 1. The use of fieldbus of transmitters will introduce the vulnerabilities of malicious attack, encompassing active attack mode such as tampering attack, denial of service attack, replay attack, and jamming attack, as well as passive attack mode including eavesdropping attack, Illegal access, and data flow analysis. IMEA is applied to analyze malicious attacks, intrusion modes, and harm, as illustrated in Table 1.16,29 By combining FMEA and IMEA, the FMEA-IMEA method is proposed to address the problem of incomplete failure mode analysis. Compared with methods such as FMEA and HAZOP, this method can provide a more comprehensive analysis of failure modes and effects.
Integrated failure modes and influences of fieldbus transmitters.
Integrated quantitative analysis of safety and security
Reliability Block Diagram is an effective tool for analyzing the integration of random failures and cyber-attack failures of fieldbus transmitters. This approach has the characteristics of clear logical relationships, simple models, comprehensibility, and portability. Fieldbus safety transmitter includes two essential parts: transmitter and fieldbus, as shown in Figure 4.
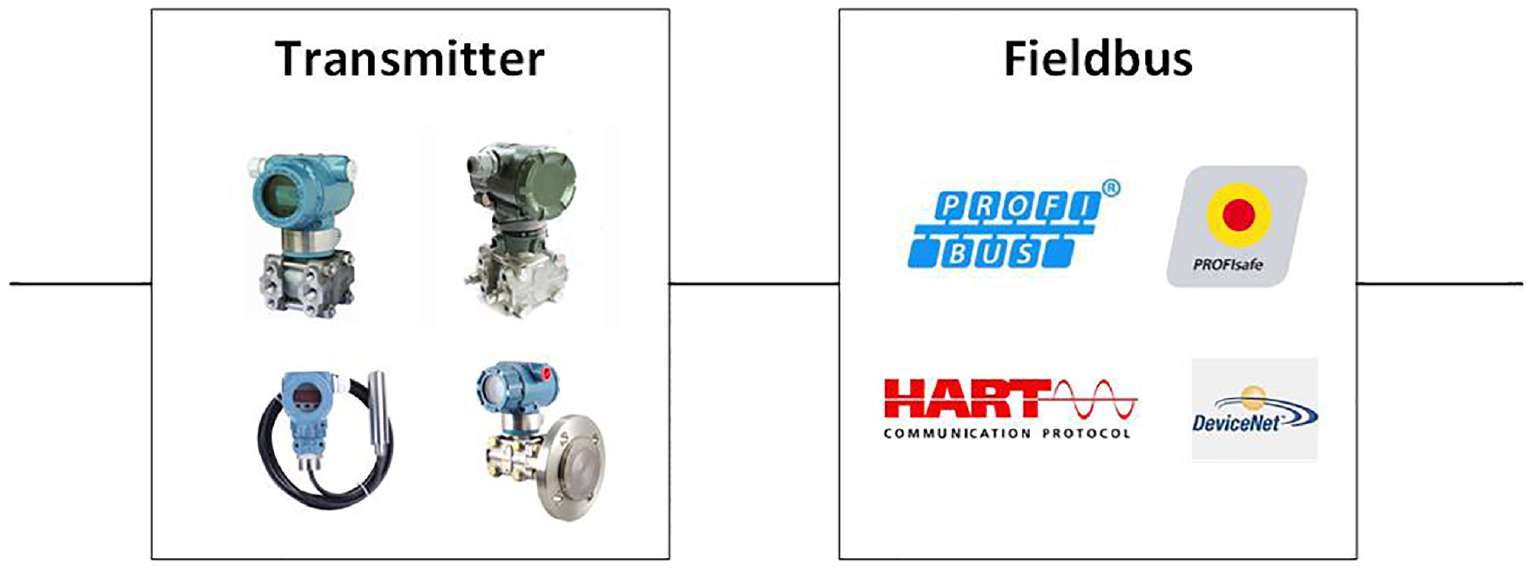
Composition diagram of the fieldbus transmitter.
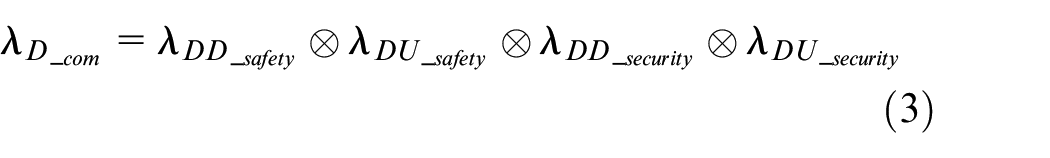
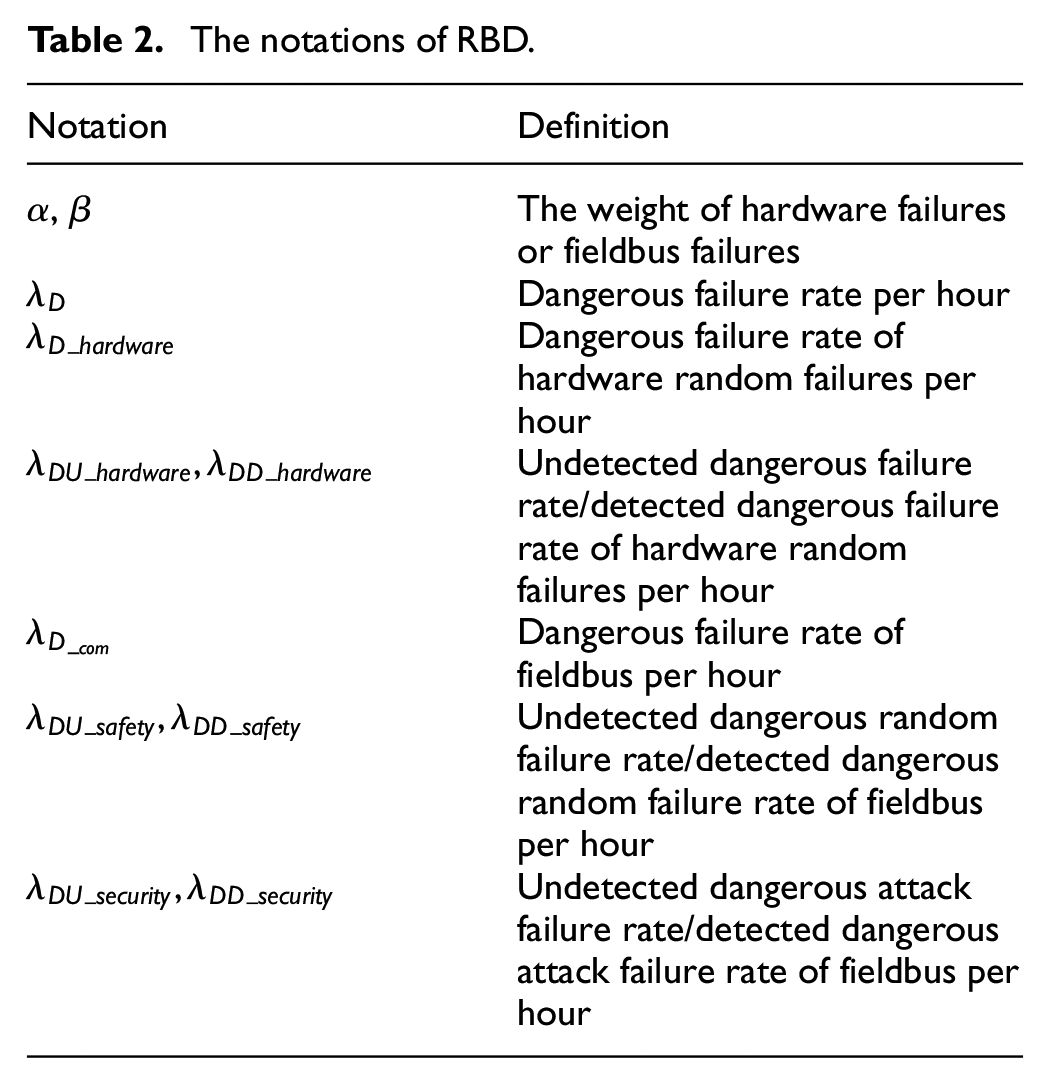
Fieldbus failures include potential failures of communication and cyber-attacks, as illustrated in Figure 5. These failures can be classified into safe failures and dangerous failures, as described in Reference. 24 Safe failures can’t endanger or disable safety-related systems. Conversely, dangerous failures put these systems in a potentially hazardous state or a state of loss of function. In high demand or continuous mode, dangerous failures of the fieldbus safety transmitter need to be taken into account. Dangerous failures include detected dangerous failure (λDD) and undetected dangerous failure (λDU). The relationship between these two types of failure is presented in formulas (1)–(5) and the notations are shown in Table 2.


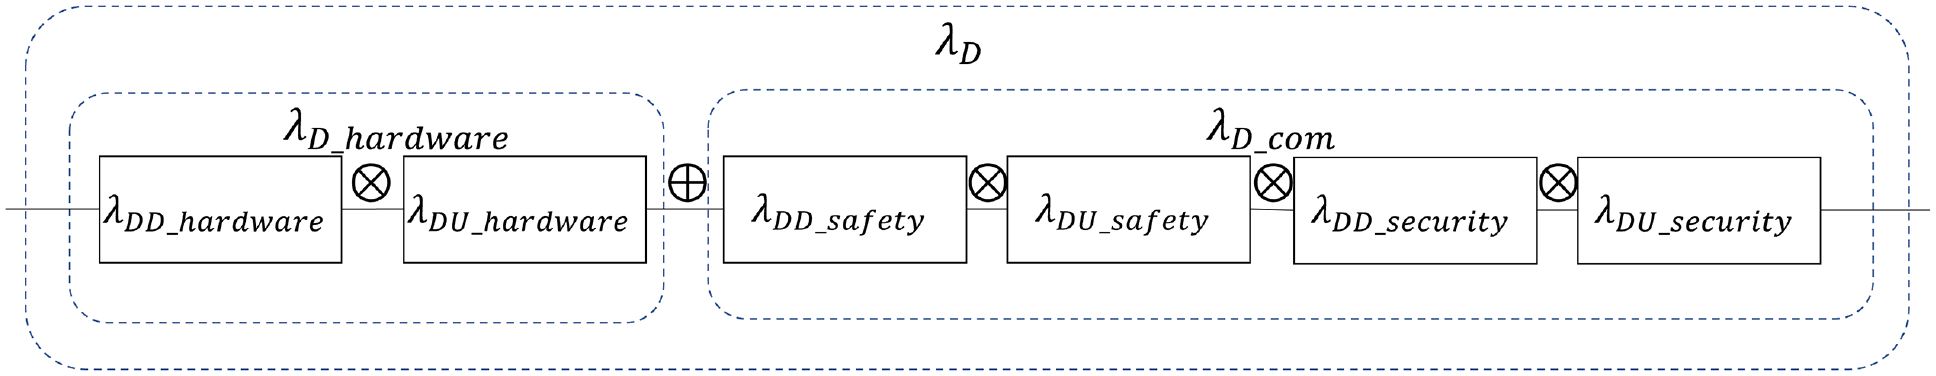
Reliability block diagram of the fieldbus transmitter.
The notations of RBD.
Analysis of random hardware failures
Transmitter hardware typically comprises power supply unit, data acquisition unit (or input part), data processing unit (logic operation), and output unit. The random hardware failure rate of the transmitter is determined by the failure rate of each part, which is made up of various electronic components. In this paper, the Component Counting method is used to derive the random failure rate of the transmitter. 30 According to this approach, the random failure rate is the sum of the failure rates of all individual components.
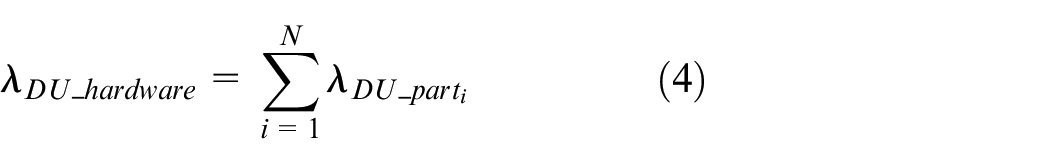
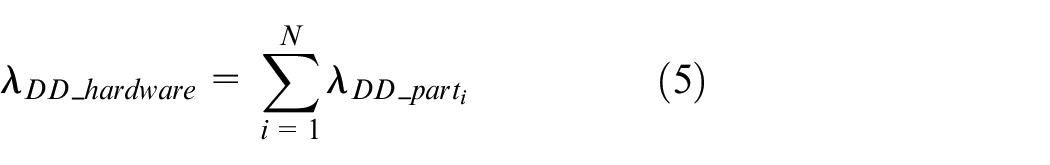
N is the number of parts of the transmitter.
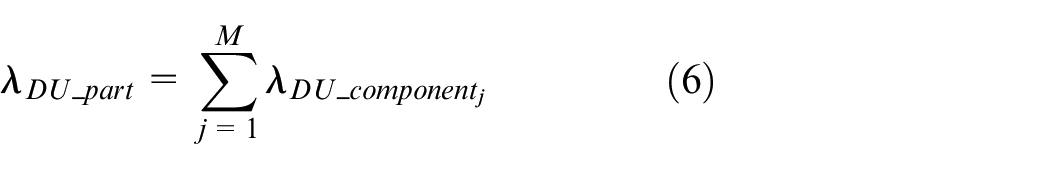
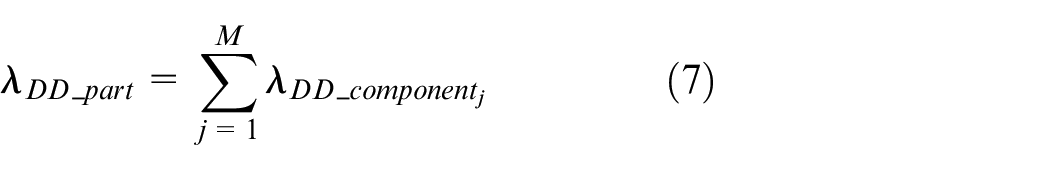
M is the number of components of the part in a transmitter.
Failure analysis of fieldbus
Failures analysis of communication
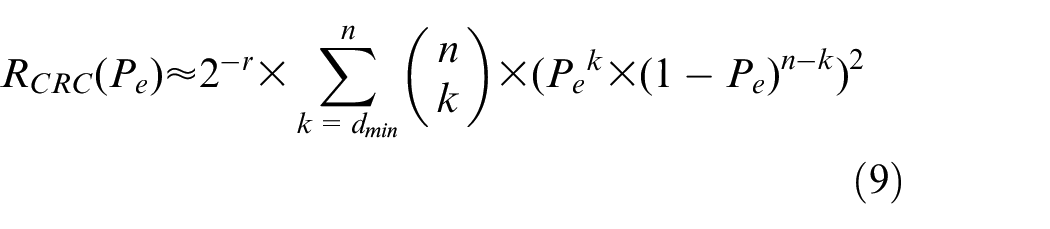
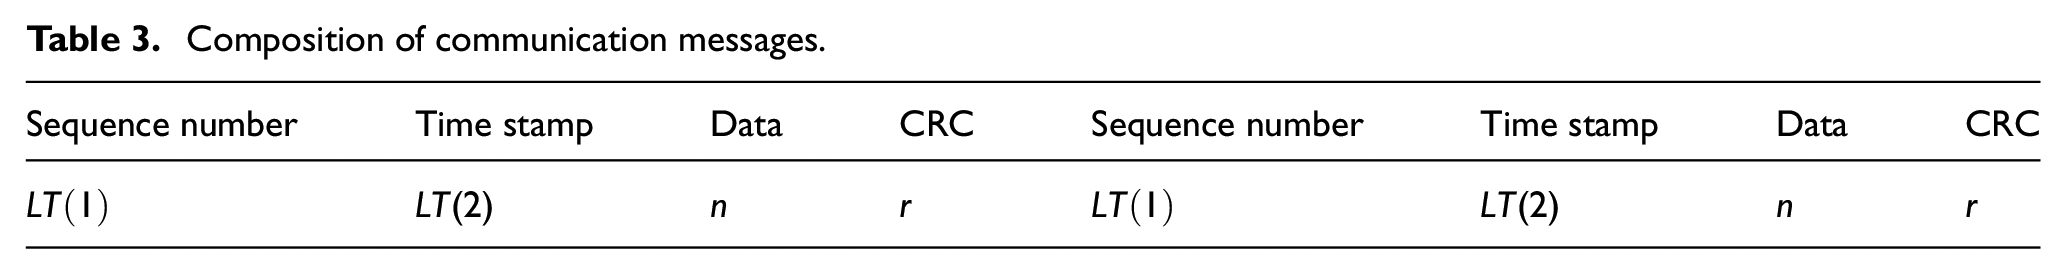
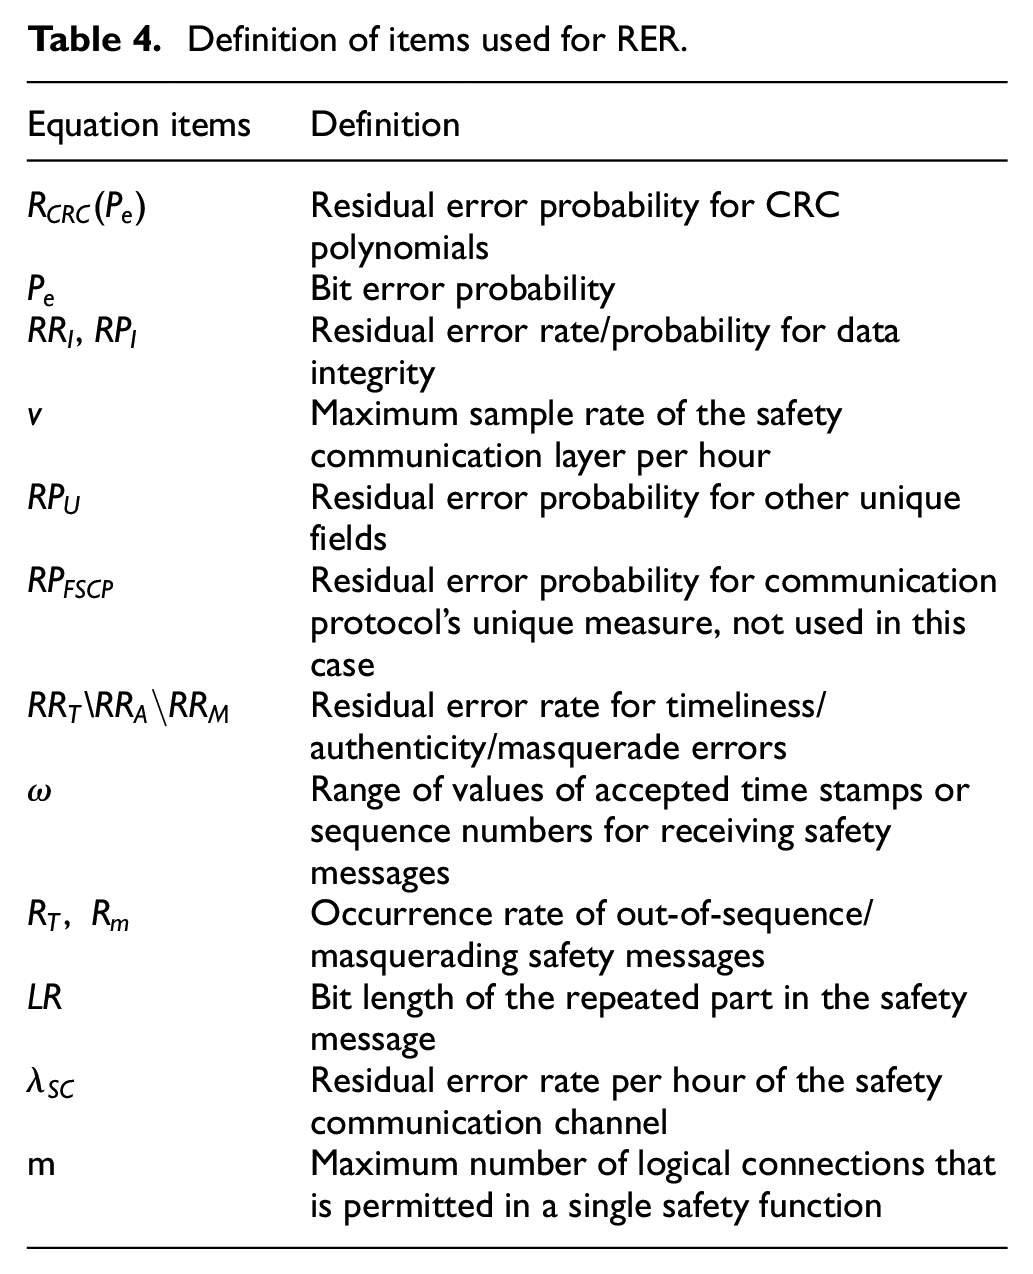
RER is used to derive the failure rate of communication. 31 This approach relies on the communication message structure, as illustrated in Table 3). In order to guarantee functional safety of communication, a lot of measures are used, such as redundancy, time stamp, sequence number, and CRC. 31 This method starts from four perspectives: integrity errors, timeliness errors, authenticity errors, and masquerade errors. This process consists of formula (8)–(15), with parameters listed in Table 4.


Composition of communication messages.
Definition of items used for RER.
The residual error rate is obtained.

The residual error rate of communication is the undetected dangerous failure rate.

Failure analysis of cyber-attack
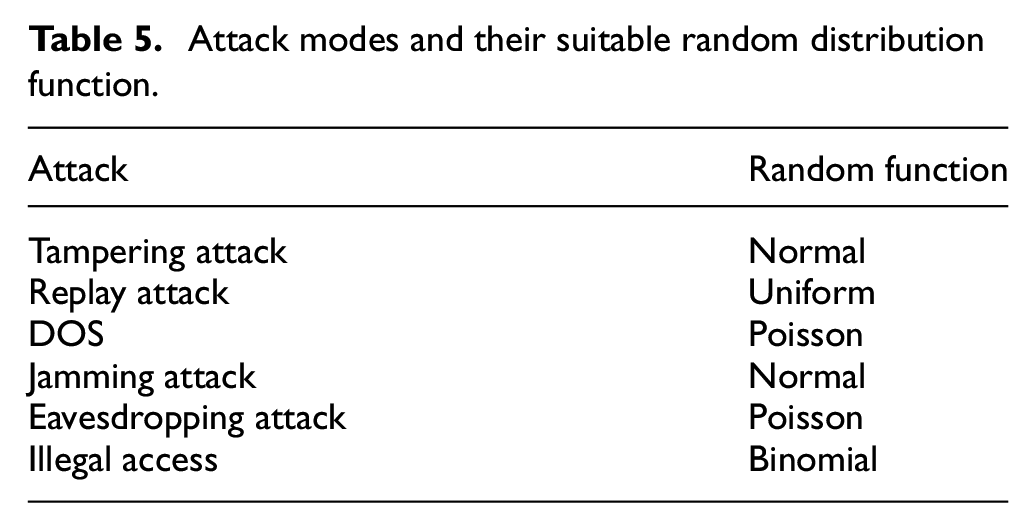
In this study, Monte Carlo simulation 32 is used to quantitatively analyze the failure rate of cyber-attacks. This method is less susceptible to human factors and provides a more accurate depiction of the actual situation. Monte Carlo simulation predicts the behavior or outcome of complex systems through random sampling. 13 In this paper, the probability of cyber-attack events occurrence is estimated using random sampling. Commonly used random distribution functions include binomial distribution, Poisson distribution, normal distribution, and uniform distribution. Random distribution function of cyber-attack modes, as listed in Table 1, are shown in Table 5.
Attack modes and their suitable random distribution function.
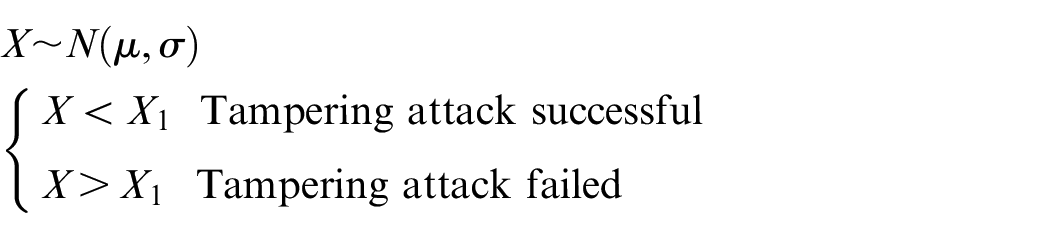
Tampering attacks can change the transmitted message, leading to changes in the transmission outcome.
33
Protective measures like CRC can be used to detect some errors caused by tampering attacks. It is assumed that more than
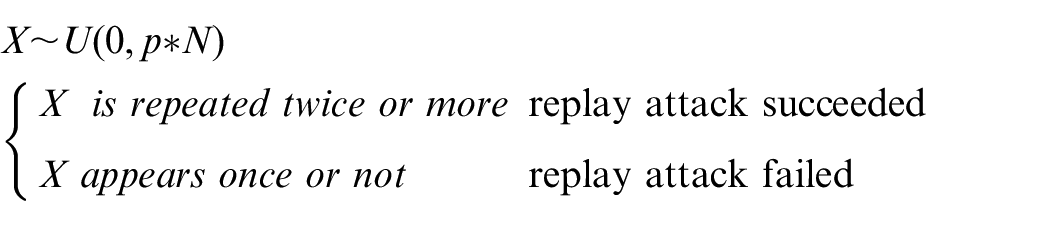
A replay attack is a form of malicious activity in which the attacker repeatedly transmits the same message to deceive the network system. 13 Uniform distribution ensures that each packet has an equal chance of being selected. The number of occurrences of a packet follows a uniform distribution, denoted by X. A replay attack is considered successful if the packet is repeated two or more times.
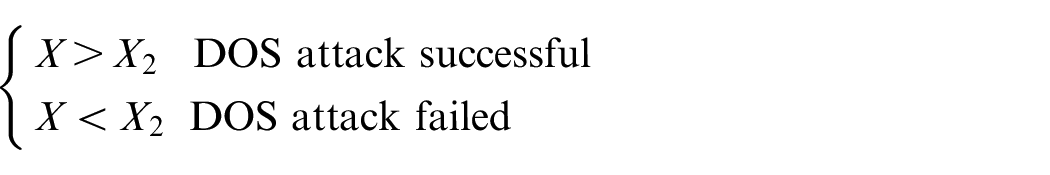
A denial-of-service (DOS) attack is a malicious action in which the attacker sends a large number of requests to the receiver of originally secure communication in a short period.
5
This attack causes communication resources exhaustion and communication interruption. The Poisson distribution is employed as a probability distribution to describe the frequency of occurrences of a random event per unit time. It can be used to simulate the number of attack requests within a unit of time. In this case, it is assumed that there is an average of 500 requests per second, with a threshold denoted as
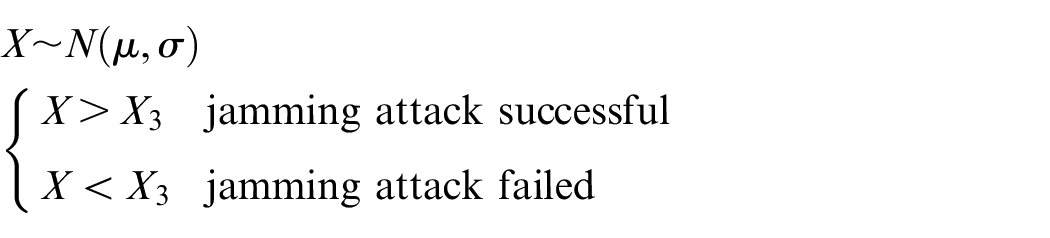
Jamming attacks typically arise from noise generated by malicious actors, leading to communication interruption.
13
The frequency of the noise follows a normal distribution with a mean of μ and a standard deviation of
An eavesdropping attack is a malicious behavior in which an attacker obtains the communication content by monitoring communication transmission lines or stealing data packets.
34
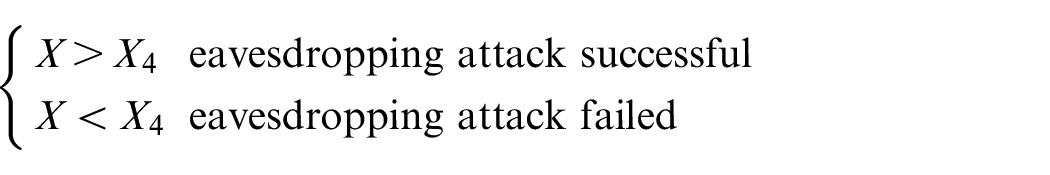
This attack will cause harm when the number of stolen data exceeds a certain value. It is appropriate to use Poisson distribution to simulate the number of stolen packets per unit time. Assuming that the average transmission rate between the two communication parties is 50 packets per second, an eavesdropping attack
35
will succeed, if more than
Illegal access has two outcomes: either it succeeds or fails. 19 Therefore, the binomial distribution is appropriate for simulating the probability of illegal access occurrence. As data flow analysis attacks 8 are founded on eavesdropping attacks, failures caused by data flow analysis attacks can be included in failures caused by eavesdropping attacks, and do not need to be simulated separately.

Case study
Taking the experimental platform of SIS as an example, the fieldbus pressure transmitter and fieldbus temperature transmitter are analyzed, as shown in Figure 6. Pressure transmitters and temperature transmitters are critical sensor devices widely used in the industry. Pressure transmitters play a crucial role in monitoring and measuring pressure changes within systems, finding applications in industrial automation, liquid level control, and power systems. Within industrial automation, pressure transmitters guarantee the maintenance of pressure within pipelines and containers at a safe range, ensuring the smooth progression of production processes. In the power system, pressure transmitters are used to monitor oil-immersed transformers and gas-insulated switchgear. 36
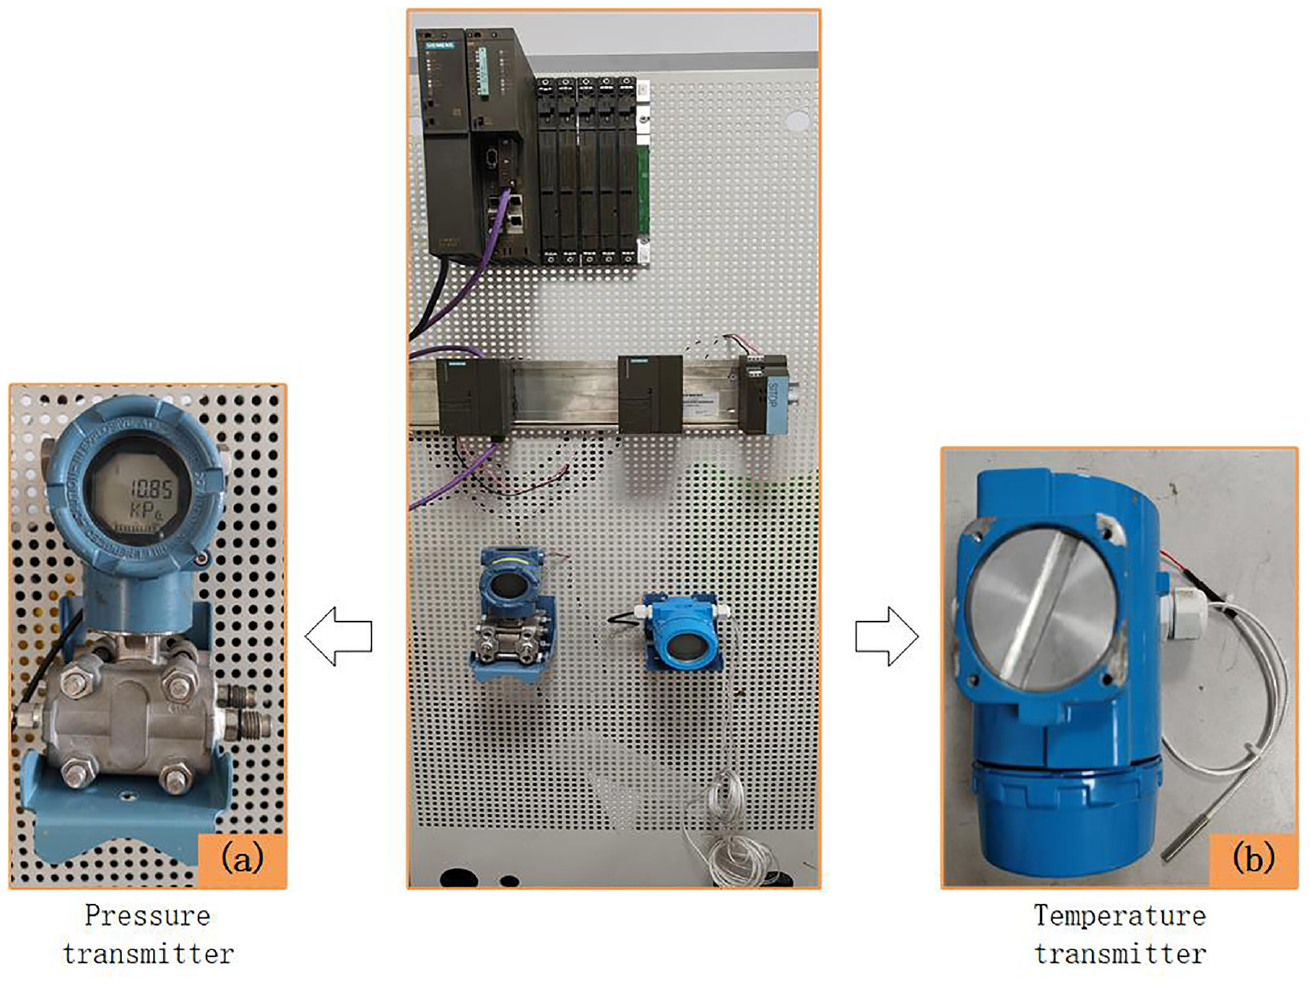
Experimental platform of SIS: (a) One of transmitters: Pressure transmitter; (b) One of transmitters: Temperature transmitter.
Temperature transmitters are used to measure and transmit temperature information within a system. During the process of industrial production, they are used to ensure precise temperature control to improve product quality and production efficiency. Within thermal systems, temperature transmitters are used to monitor the temperature of pipelines and equipment, providing accurate temperature feedback for heating and cooling systems. In power systems, 37 temperature transmitters play a crucial role in real-time temperature monitoring of generator cooling systems and high-voltage switchgear, preventing equipment overheating and malfunction. 38
Pressure transmitter
NCS-PT105H-FS PROFISafe Intelligent Pressure Transmitter (Figure 6(a)) is used as an example for analysis. The SIL target for the equipment is SIL3, considering its application in oil pipelines.
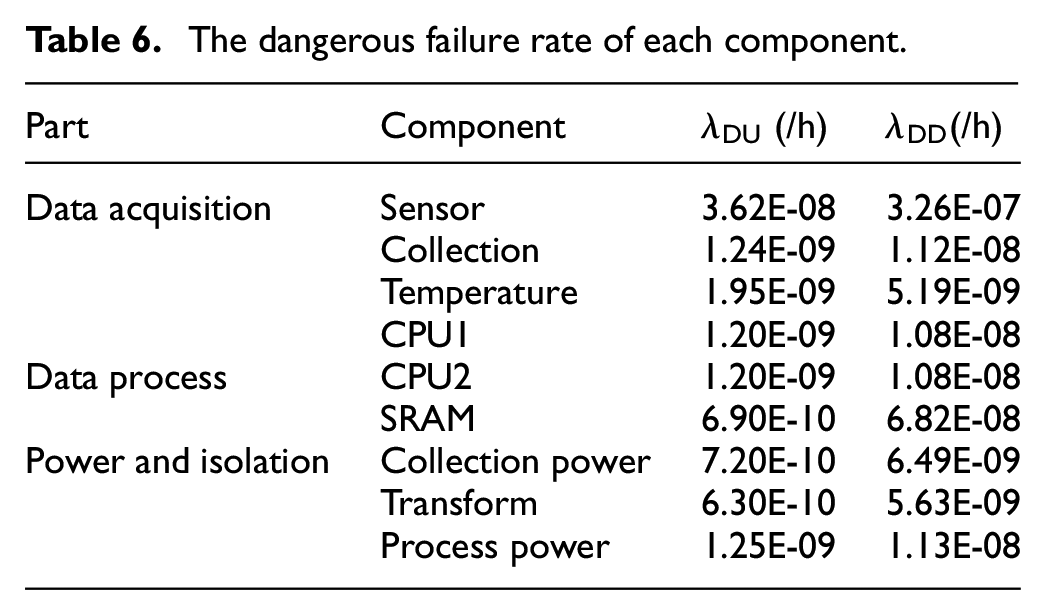
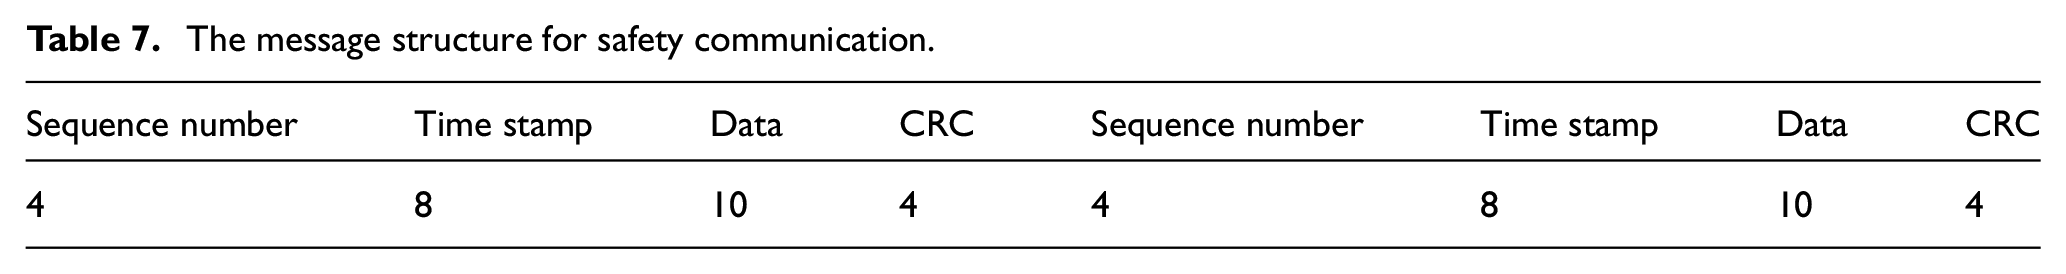
The fieldbus pressure transmitter is composed of data acquisition unit, data process unit and power supply unit. Component parameters are determined according to the actual condition in industrial production and relevant standards, 30 as shown in Table 6. Sequence number, timestamp, redundancy and CRC are used in PROFISafe. The message structure is shown in Table 7.
The dangerous failure rate of each component.
The message structure for safety communication.
According to formula (6) and formula (7), the random failure rate of all parts is obtained by the following formulas.


So,
According to the above message structure, the undetected dangerous failure rate is obtained.

In 2020, there were more than two million recorded cases of malicious cyber-attack originating from overseas. 39 The National Industrial Security Development Research Center tracked and disclosed nine domestic industrial security events. The data mentioned above is used using Monte Carlo simulation to determine the probability of occurrence for each attack mode.
MATLAB is used for Monte Carlo simulation to model the failure scenarios of fieldbus transmitters under different mode of attack. Through a review of relevant literature, parameters are defined (see details in Table 8), which serve as inputs for the Monte Carlo simulation. The initial probability for each attack mode is set at 7.5E-07/h.
Parameter settings in the Monte Carlo simulation.
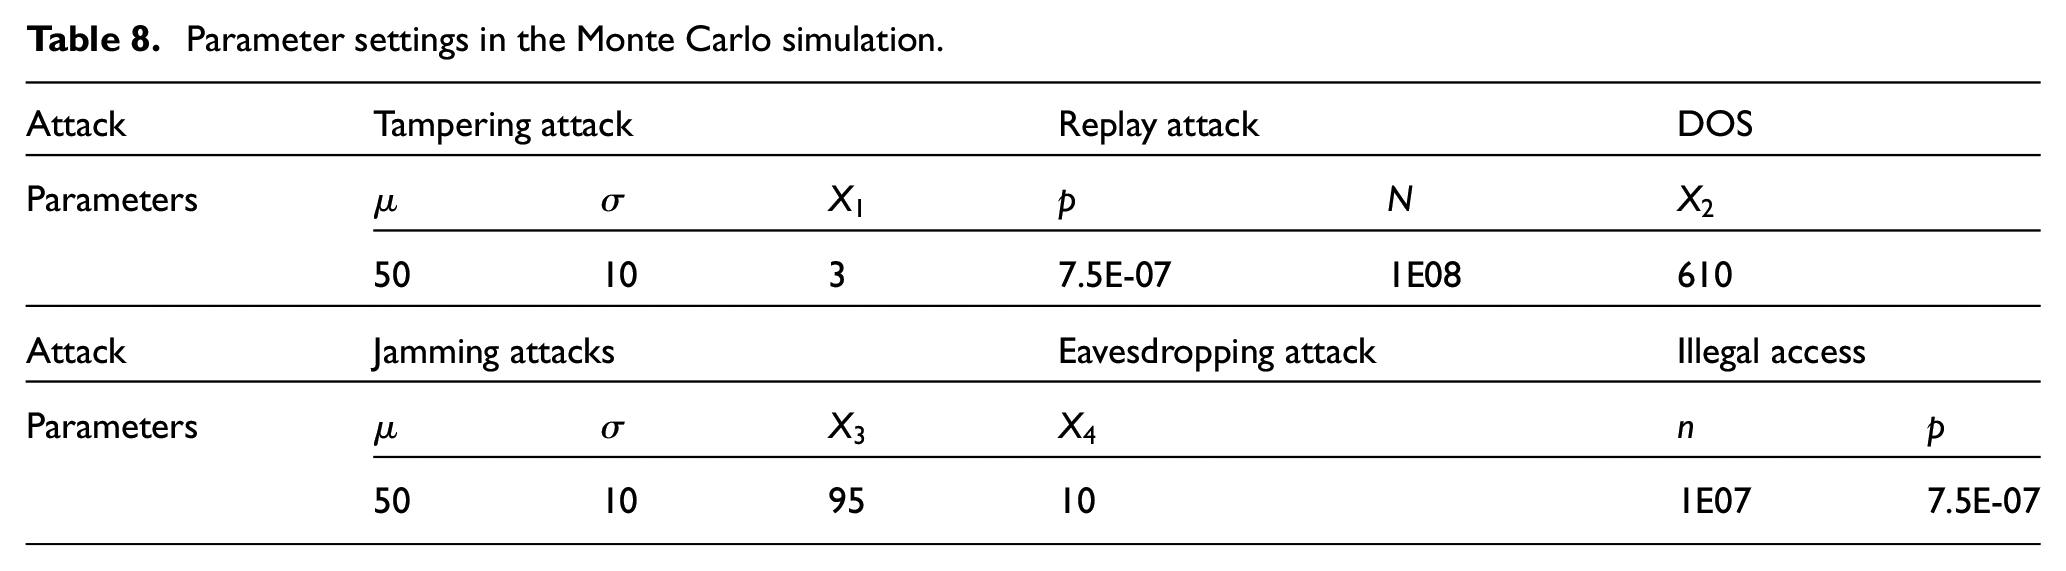
In Monte Carlo simulation, if an attacker modifies some data without detection, the tampering attack is considered successful. The failure rate of replay attack is estimated based on the initial probability of attack occurrence. For the DOS attack simulation, Poisson distribution is applied to simulate the number of attack requests. A normal distribution is used to simulate the frequency of noise in the jamming attack. The noise frequency is assumed to be an average of 50 and a standard deviation of 10. When the noise frequency exceeds 95 Hz, it will cause harm to the communication process. When an eavesdropping attack succeeds, it is assumed that more than 10 data items are monitored. In the illegal attack simulation, a binomial distribution is used to simulate the probability of successful illegal attack to obtain the probability of pressure transmitter failures caused by illegal attacks.
After five simulation experiments for each attack, the average cyber- attack failure rate is obtained, as shown in Table 9.
Experimental results from 5 Monte Carlo simulations.
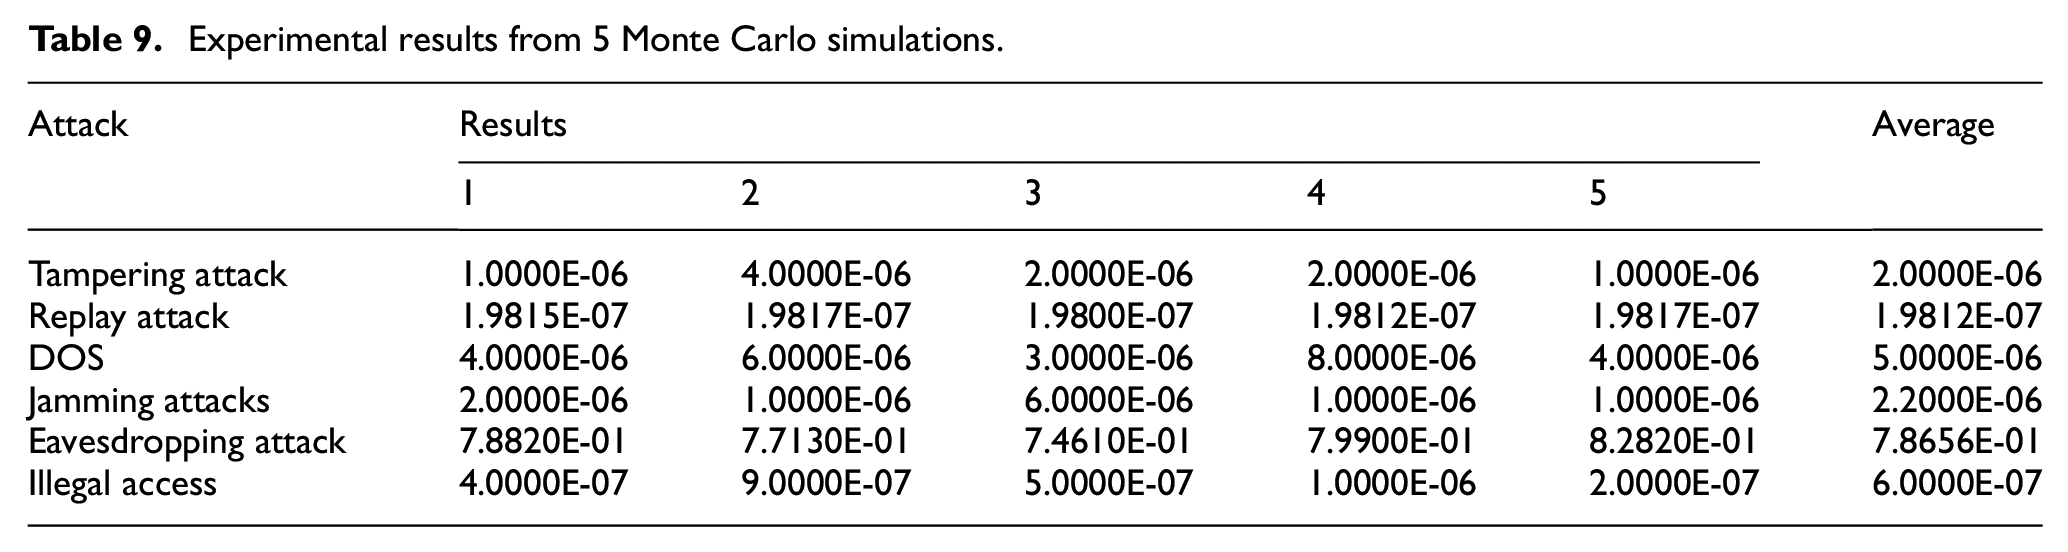
Passive attacks do not have a direct impact on fieldbus transmitters. The failure rate of undetected cyber-attacks is only from active attacks.

Following Monte Carlo simulation, the calculated failure rate exceeds the probability of fault events disclosed by the organization. It indicates that there are still many undisclosed fault events in industrial control systems. The simulation results reveal that eavesdropping attacks pose a significant threat and may lead to major accidents.
According to formula (1)–(3), the following formula is obtained.

Dangerous failure rates of fieldbus pressure transmitters are determined and presented in Table 10.

Failure rates of the fieldbus pressure transmitter.
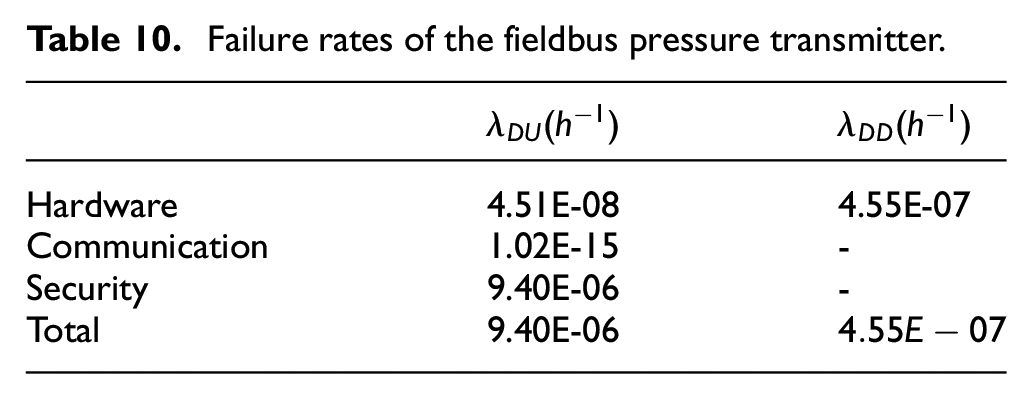
Without considering failures caused by cyber-attacks, the PFH is
Considering all kinds of failures, the PFH is
Temperature transmitter
NCS-TT105H-FS PROFISafe Intelligent Temperature Transmitter is used as an example for analysis, as shown in Figure 4(b). The target for this system is SIL3, which is determined based on the specific application field where the transmitter is deployed – oil pipelines.
Fieldbus temperature transmitters consist of three key components: an input unit, a logic operation unit, and an output unit. The parameters are determined based on the actual situation of industrial production and relevant standards, 30 as shown in Table 11.


Dangerous failure rates of each component.
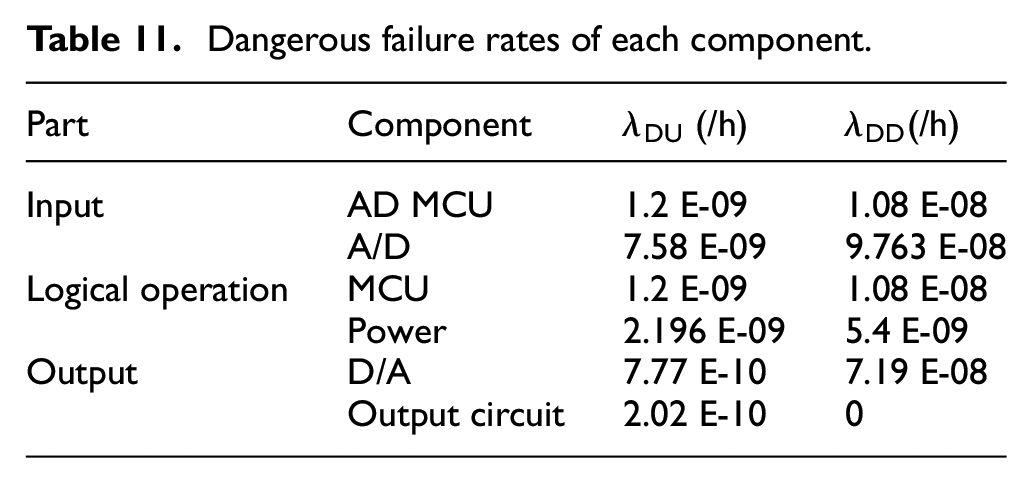
So,
The fieldbus pressure transmitter and the fieldbus temperature transmitter are located in the same safety instrumented system. In both case studies, the communication protocol is the same and the network attack situation is the same.


In the Table 12, without considering failures caused by cyber-attacks, the PFH is 1.32E-08
The failure rate of the fieldbus temperature transmitter.
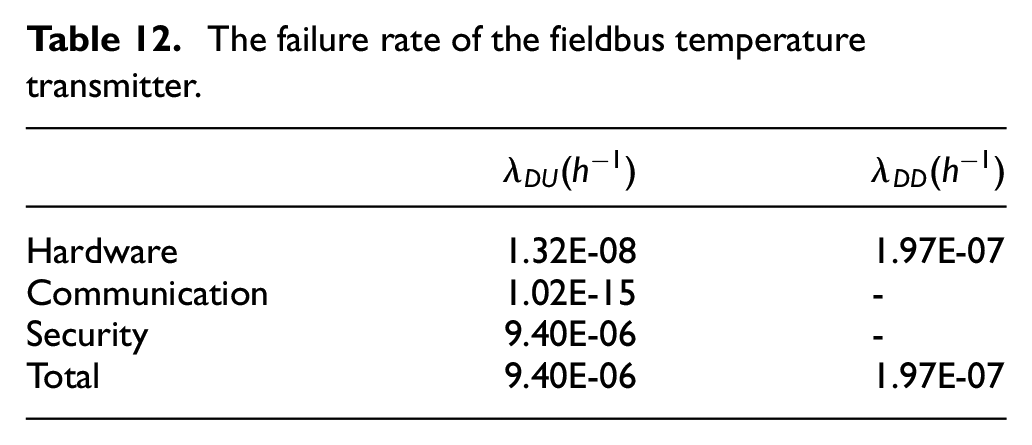
Considering random failures and cyber-attack failures, the PFH is
Comparison experiment
For the sake of proving the high-performance of the FMEA-IMEA method, an experiment is conducted for comparison. The results of comparison experimental are shown in Figure 7. The FMEA-IMEA method comprehensively analyzes the failure modes of pressure transmitters and identifies 19 types. However, the traditional FMEA method only identifies 12 types of failure modes. In Figure 8, compared to FMEA, FMEA-IMEA includes a broader range of impact types from the impact on hardware, data, pressure transmitters, and SIS. Therefore, it can be concluded that compared to FMEA, the FMEA-IMEA method provides a more comprehensive analysis of failure modes and their impacts on pressure transmitters.
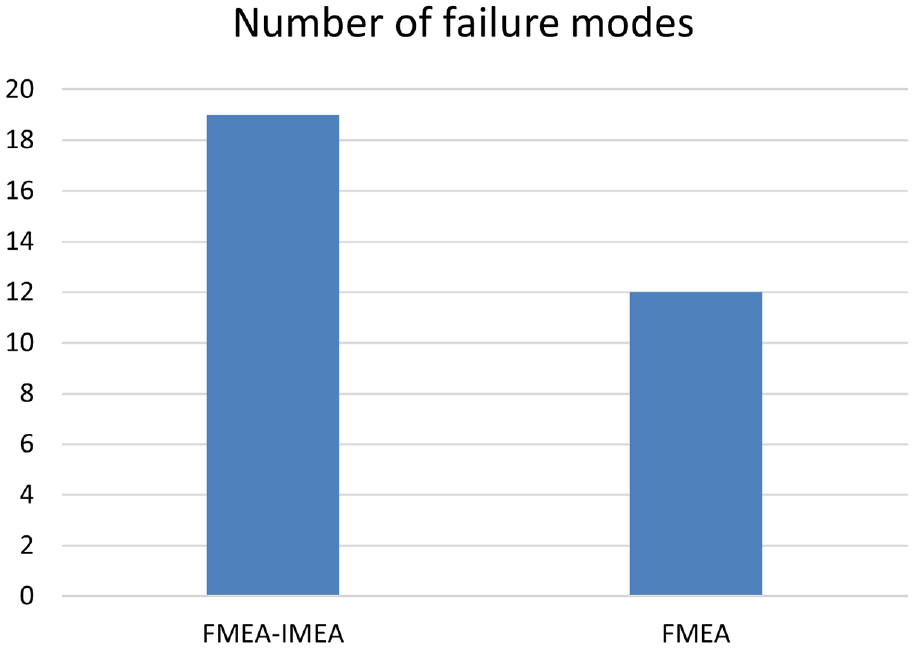
Numbers of failure modes from FMEA-IMEA and FMEA.
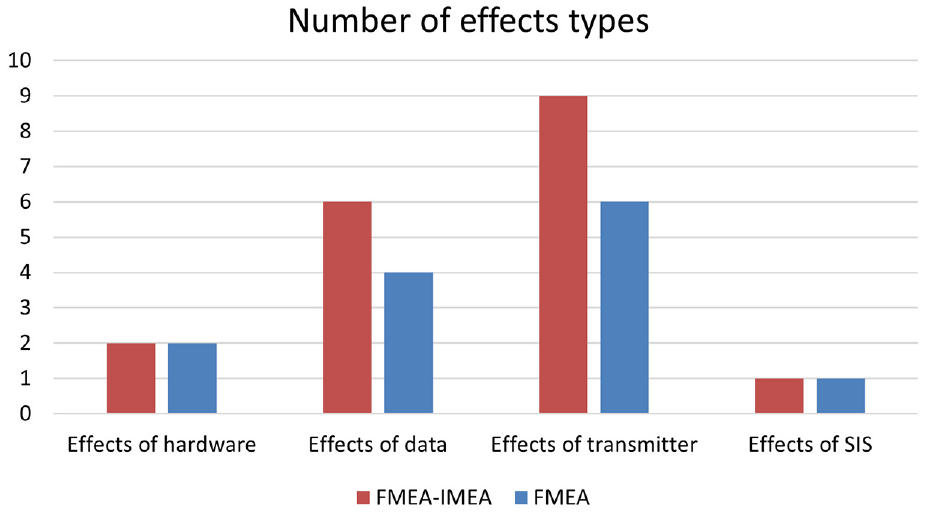
Numbers of effect types from FMEA-IMEA and FMEA.
Results and discussion
In both cases, the failure rate of the transmitter is most affected by cyber-attack failures. It can be asserted that the safety integrity level of the transmitter is completely affected by these attacks. Comparative analysis with FMEA reveals FMEA-IMEA method provides a more comprehensive analysis of the failure modes and effects of fieldbus transmitters. Cyber-attack failures have a significant impact on overall safety level. It is inaccurate to exclude cyber-attack failures from existing research.
The failure rate obtained from big data statistics is too optimistic, and the actual situation may be more serious than expected. Therefore, the overall safety level discussed in this paper may be overly idealistic. 23
In order to select an appropriate random distribution function in Monte Carlo simulation, various factors need to be considered, including the attacker’s strategy and goals. However, after considering these factors, the complexity of the simulation process will be increased. 40
Conclusion
Traditional failure analysis approaches associated with safety and security tend to be independent process. 24 However, with the development of equipment network processes, security issues can directly impact the physical safety of equipment. It is necessary to consider both functional safety and security failures in SIS. A novel and comprehensive analysis framework is proposed to study the influence of random failures and cyber-attack failures on safety transmitters. This framework includes qualitative and quantitative method for functional safety and security analysis. Considering the failure of attack, the FMEA-IMEA method is more comprehensive than traditional analysis methods, as verified through a comparison with FEMA. The RBD is extended to determine the quantitative relationship between random failures and cyber-attack failures. The feasibility of the framework is validated by analyzing the fieldbus pressure transmitter and the fieldbus temperature transmitter. Experimental results demonstrate that malicious cyber-attacks pose a significant threat to fieldbus transmitters, leading to a reduction in the safety integrity level from SIL3 to SIL1. The proposed framework provides guidance and decision support for ensuring functional safety and security in SIS.
Future exploration in this domain will focus on optimizing the configuration of functional safety barriers and security measures. Possible measures for exploration may include Trusted Platform Modules41,42 and intrusion detection system. 43 Through the rational configuration, these measures aim to mitigate the harm caused by cyber-attacks on fieldbus transmitters, ultimately improving their overall safety and security levels.
Footnotes
Declaration of conflicting interests
The author(s) declared no potential conflicts of interest with respect to the research, authorship, and/or publication of this article.
Funding
The author(s) disclosed receipt of the following financial support for the research, authorship, and/or publication of this article: This work is supported by the National Key Research and Development Program 2021YFB2012302.