
Abstract
Lost motion is utilized to characterize the transmission accuracy of gear reducers and is commonly evaluated through the hysteresis curve method. In examinations of lost motion for large and medium-sized reducers, the default practice is the application of the equal torque gradient loading method. Nonetheless, for small-sized reducers, this approach is deemed inappropriate due to the constraints of the servo motor loading resolution. This study reveals that employing a larger unit torque for equal torque gradient loading can modify the shape of the hysteresis curve and influence the assessment of lost motion. As a result, this paper introduces two innovative loading techniques, namely equal position gradient loading and uniform speed loading, to address the limitations of equal torque gradient loading and reduce the demands on testing equipment. Subsequent experiments validate the issues associated with equal torque gradient loading, confirm the effectiveness of the two new loading techniques, and yield more comprehensive hysteresis curves. It is important to note that all three loading methods are influenced by the loading rate, but the two novel methods can mitigate the effects of loading rate dependency.
Keywords
Introduction
Lost motion is a fundamental concept in the realm of reducers, extensively utilized for the assessment of transmission quality and the analysis of dynamic characteristics. It pertains to the angle observed at the output end subsequent to a change in the movement direction of the input end, with the output end subsequently adapting to this alteration. 1 The existence of lost motion can introduce nonlinearity in the relationship between input and output, thereby influencing the dynamic performance of the reducer.
Lost motion testing predominantly depends on the utilization of the hysteresis curve method. This method entails the immobilization of the input end of the reducer, followed by the application of loading and unloading forces through the output end to acquire the hysteresis curve, consequently facilitating the completion of the lost motion test.
1
The procedure to conduct this test is outlined in Figure 1: (a) The output end is loaded forward to the target torque
Test step.
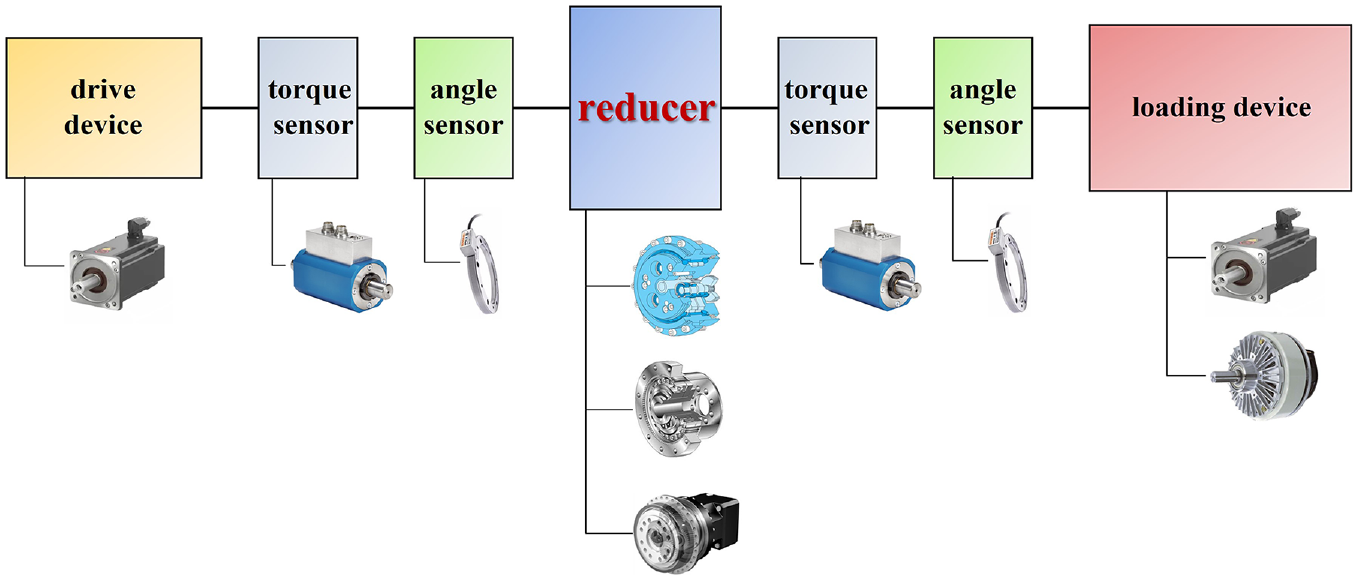
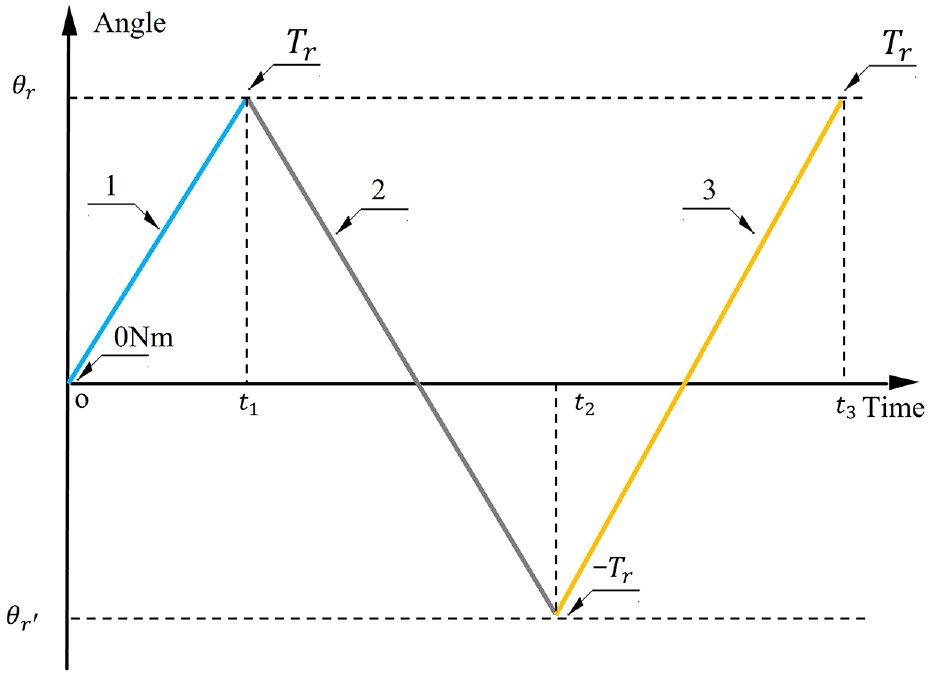
The configuration of a standard testing apparatus is visually represented in Figure 2.2,3 The drive device functions to either propel or immobilize the input end of the reducer. The torque sensor and angle sensor are employed to measure the torque and angle data, respectively, while the loading device administers the load. 4
Composition of test equipment.
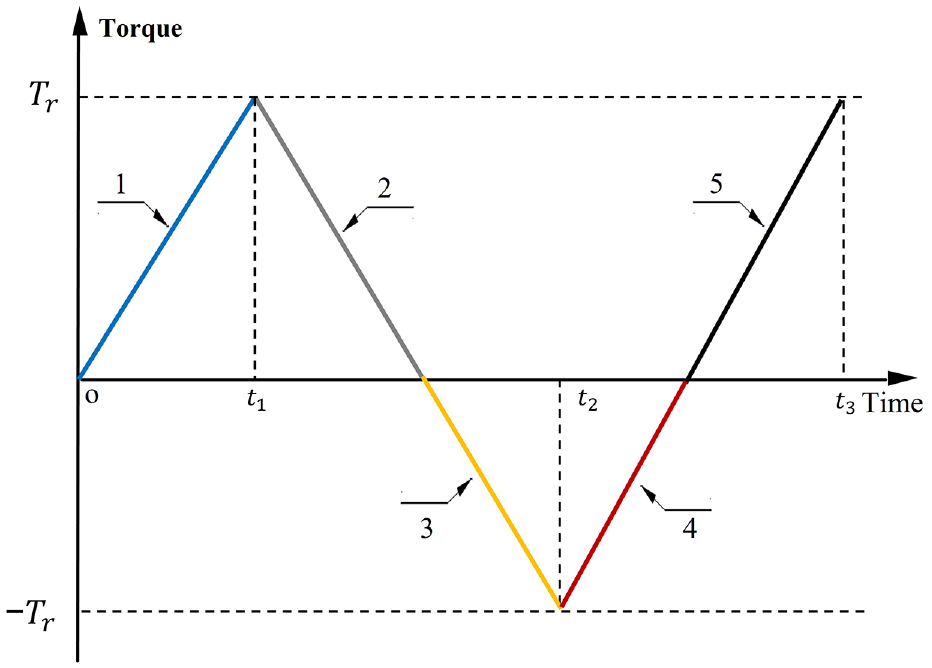
During lost motion testing of large and medium-sized reducers, such as RV reducers, harmonic gear reducers, and planetary gear reducers, the conventional loading approach employed is the equal torque gradient loading,5–8 as depicted in Figure 3. This method entails the use of a consistent unit torque for gradient loading and mimics the process of lost motion generation within the reducer during testing. It is also the default method specified in the standard procedures. However, upon examining the current state of research and application in the context of lost motion testing for small-sized reducers, 9 it becomes evident that the equal torque gradient loading method is not suitable. Various factors, including small size, limited load capacity, notable manufacturing and assembly errors, and constraints in test conditions, such as sensor accuracy and loading device resolution,10,11 can lead to issues when employing the equal torque gradient loading method. These issues include inadequate data volume and alterations in the curve’s shape, resulting in disparities between the test hysteresis curve and the actual hysteresis curve, ultimately impacting the assessment of reducer lost motion performance.
Principle of equal torque gradient loading.
In summary, as we enter the era of intelligent technologies, the extensive production and usage of small-sized reducers emphasize the growing need for testing their lost motion. However, it is evident that the existing testing methods are inadequate to meet this demand.
Hence, considering the current state of test equipment capabilities, this paper investigates the features of small reducers and introduces two loading methods: equal position gradient and uniform speed gradient loading. It examines the influence of varying loading techniques on lost motion testing for small-sized reducers and enhances the lost motion testing approach. The aim is to provide insights for the design and testing of small-sized reducers.
The lost motion of reducer
Generation of lost motion
Lost motion serves as a means to depict the hysteresis in a reducer and is traditionally assessed through a hysteresis curve. Hysteresis itself emerges from the interplay of geometric inaccuracies, friction, and elastic deformation, with lost motion representing the consequence of the interrelation of these three factors.
10
The composition of the total lost motion

Evaluation of lost motion
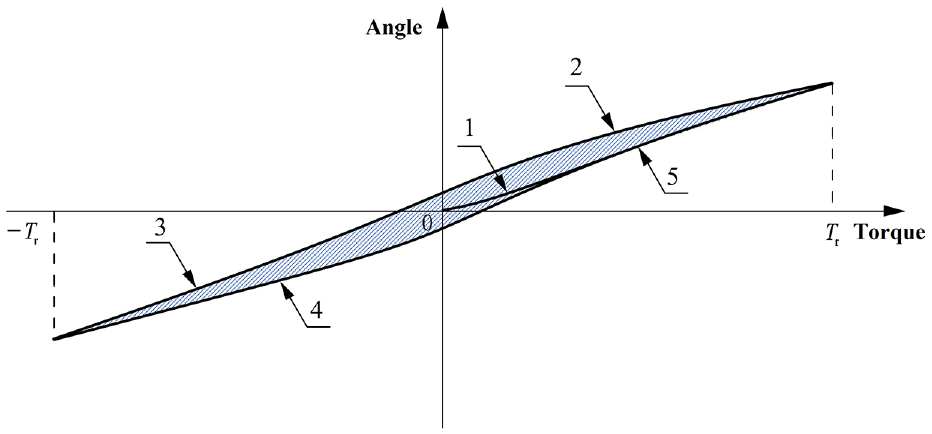
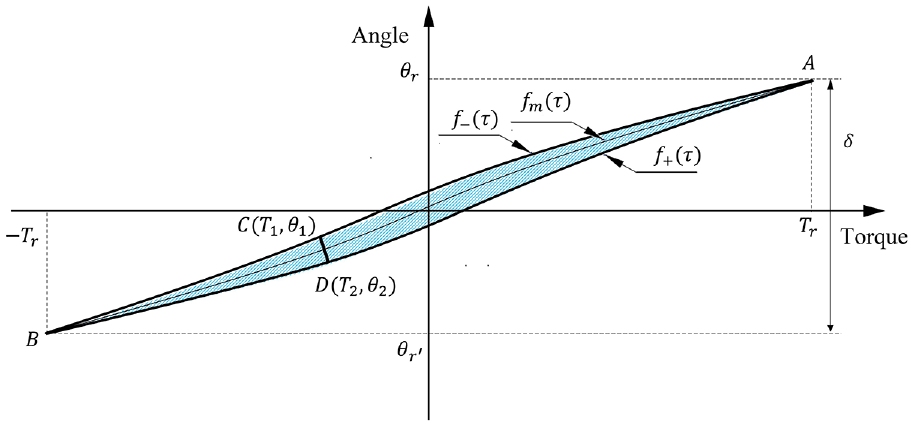
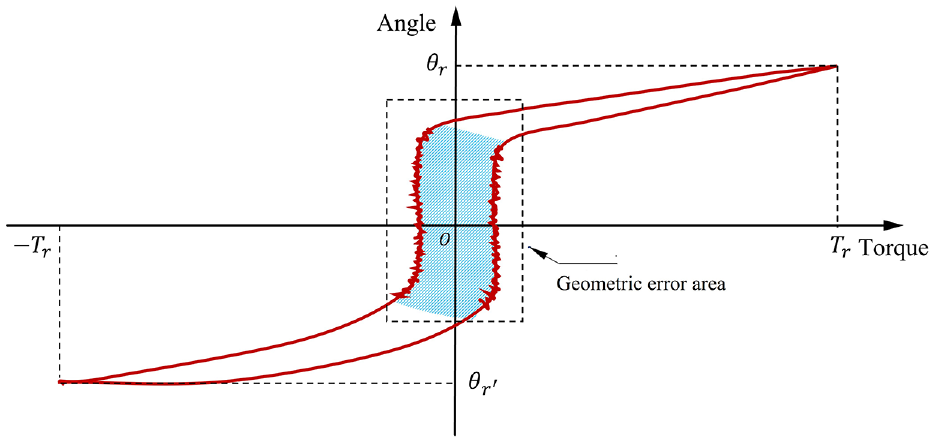
Two approaches are employed for the assessment of lost motion: one relies on the numerical alterations within the hysteresis curve, while the other hinges on changes in the hysteresis curve’s configuration. The numerical assessment is illustrated in Figure 4.

Evaluation method of lost motion.
In the context of shape evaluation, specific focus is directed toward the area S, width b, and inclination k of the hysteresis curve, as illustrated in Figure 4. The enclosed section of the hysteresis curve, denoted as area S, serves as an indicator of the reducer’s ability to dissipate energy during the occurrence of lost motion. Equation (3) delineates the methodology for calculating the area S.
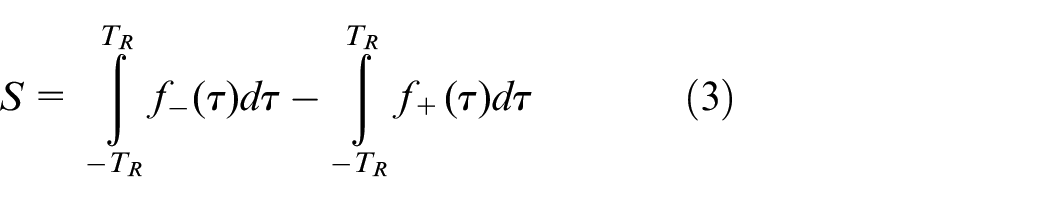
The line segment that stands perpendicular to the average curve within the hysteresis curve is designated as the width of the hysteresis curve, represented by the CD line segment in Figure 4. Equation (4) outlines the procedure for computing the width. The hysteresis curve’s width, denoted as “b,” is determined by the line segment with the maximum width. Variations in width at different positions serve to illustrate the influence of distinct hysteresis patterns on lost motion.
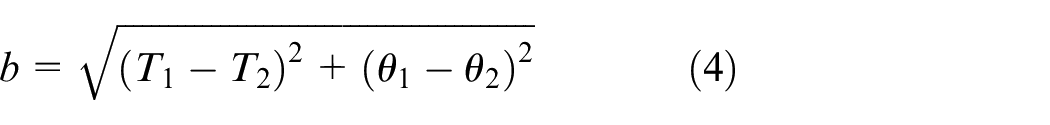
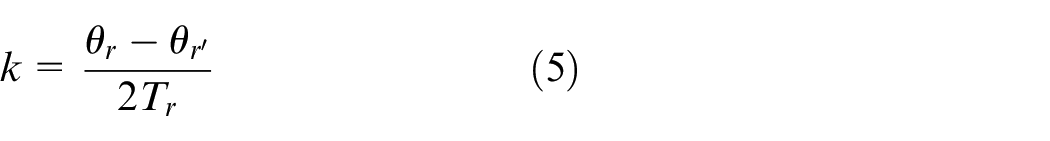
The parameter “k” signifies the stiffness of the reducer and is associated with elastic lost motion. The formula for determining the inclination is provided in equation (5).
The acquisition of the hysteresis curve plays a pivotal role in lost motion testing, as the process of drawing this curve essentially replicates the generation of lost motion. The establishment of the unit torque value in equal torque gradient loading can significantly affect the results of both forms of lost motion evaluation. A comprehensive discussion on this matter is presented in the following section.
Equal torque gradient loading
Loading principle
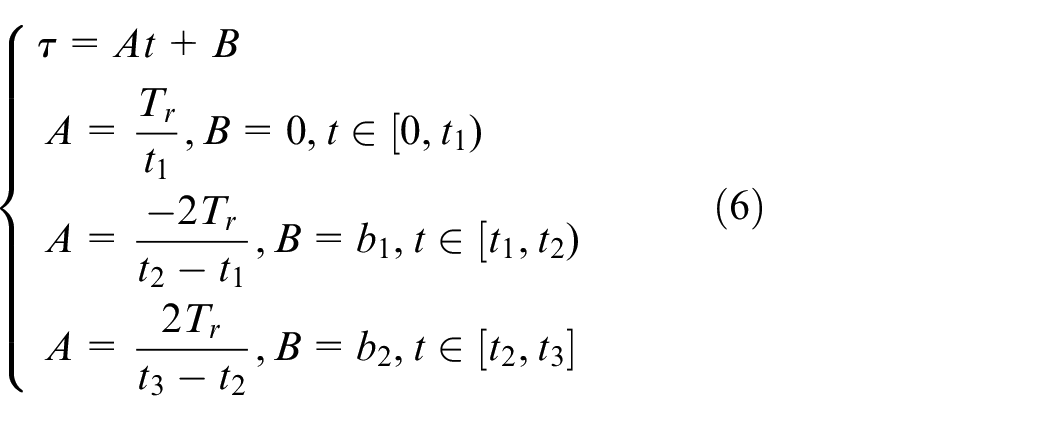
The prevailing loading apparatus in use is a servo motor, known for its advantages in terms of straightforward control and superior accuracy. The execution of equal torque gradient loading is achieved by manipulating the servo motor to apply gradient loading in accordance with the predefined unit torque. The procedure is elucidated in Figure 3, and the sequence of steps is described in equation (6).
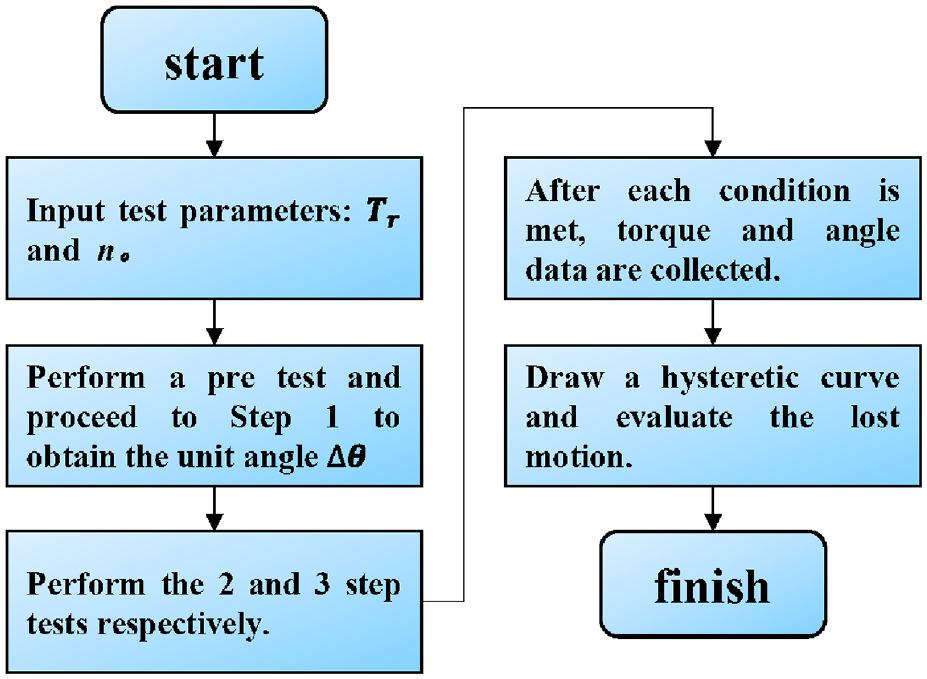
Test method
The lost motion testing procedure employing this loading approach is depicted in Figure 5. Prior to commencing the test, it is imperative to set the test parameters, including the unit torque, target torque, sampling criteria, and loading rate. Depending on the specific sampling criteria, the test can be classified into two categories: slow testing and fast testing.
(1) Slow testing: This refers to the loading process where the instability of the servo motor leads to torque fluctuations around the target value with each loading cycle as per the preset value. To enhance torque sampling accuracy, loading is temporarily paused until the torque stabilizes before data collection. This method extends the duration of the test.
(2) Fast testing: Represents the loading process that does not necessitate waiting for torque stabilization. The servo motor control is deemed to be reasonably precise, and it is assumed that each gradient load attains proximity to the target torque. Therefore, each gradient load is sampled only once, resulting in a relatively shorter test duration.
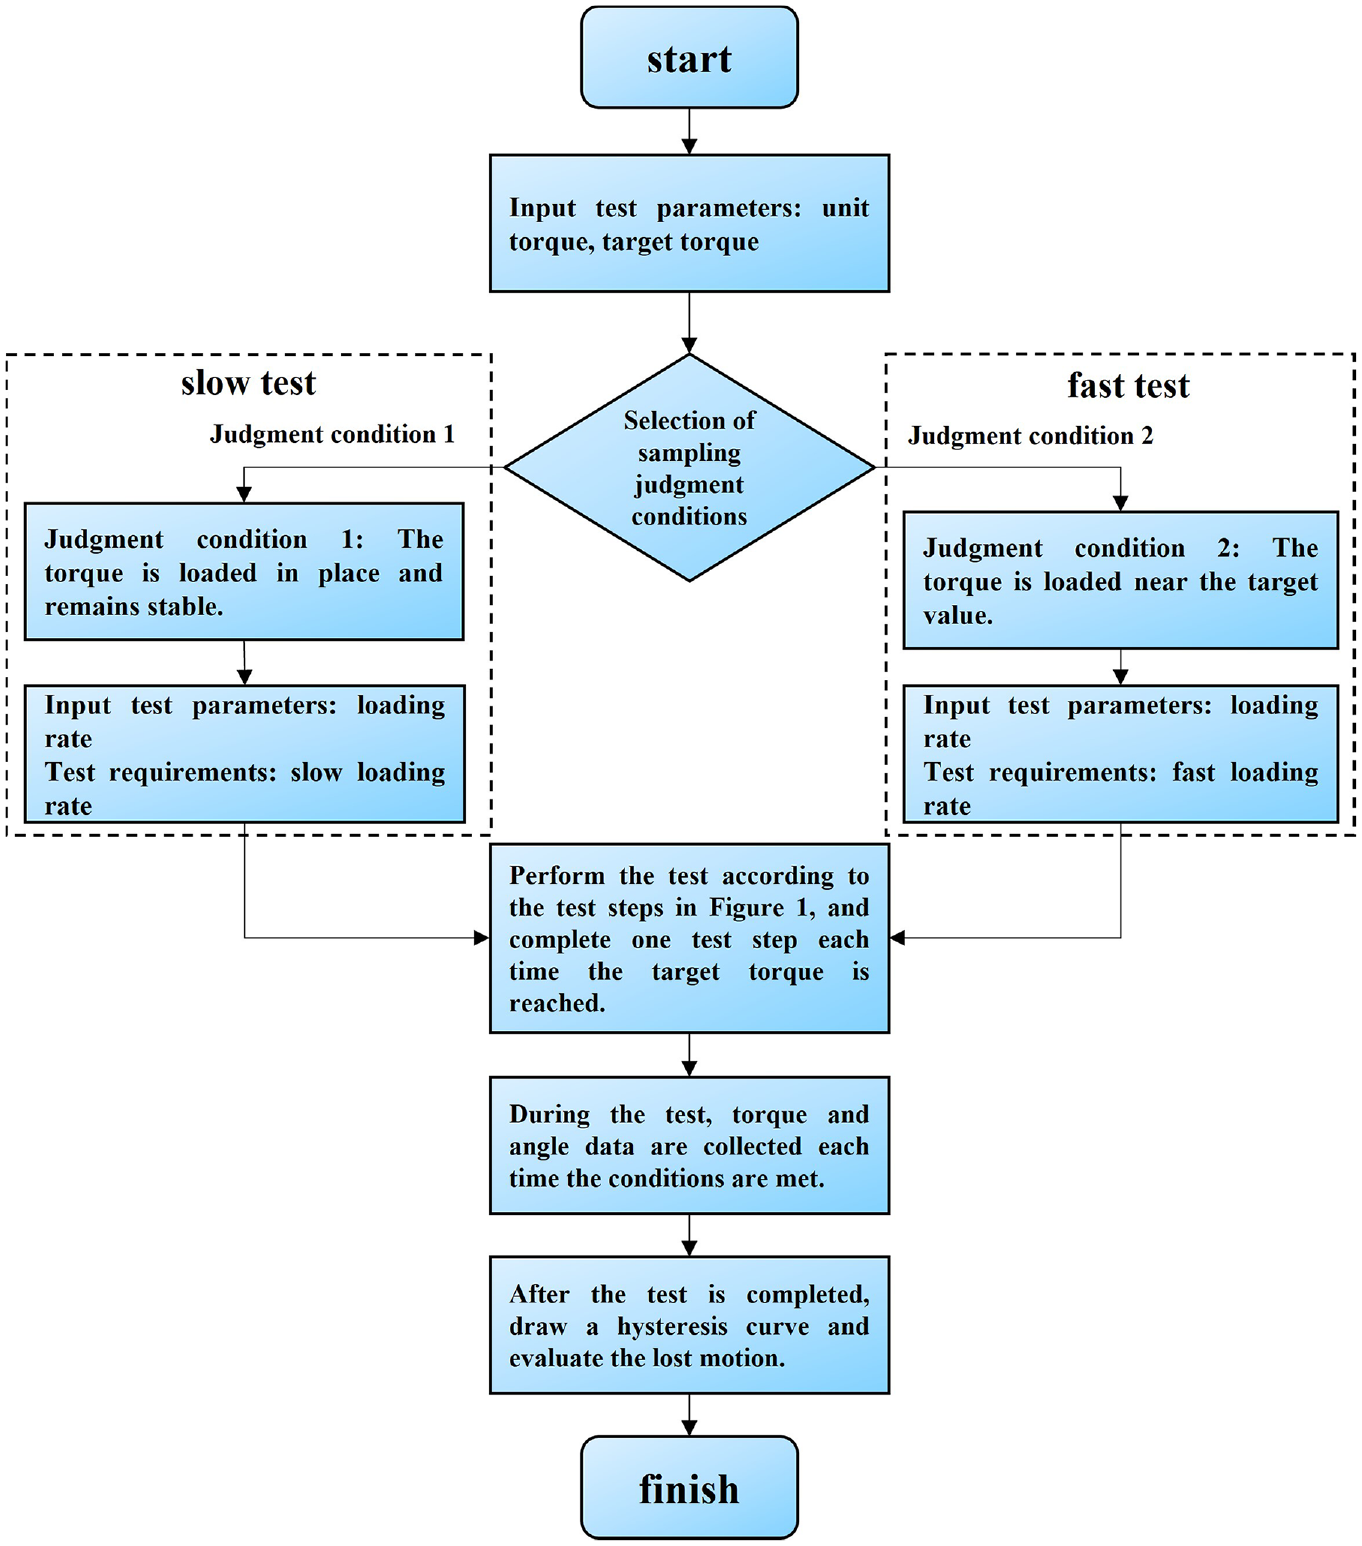
Test flow of equal torque gradient loading.
Difficult issues
Small-sized reducers, characterized by a modulus below 0.5 mm, typically feature lower rated torque and peak torque design values.
12
In accordance with the applicable testing standards,
1
in order to maintain result accuracy, it is recommended that the number of sampling points for a single step in Figure 1 should not be fewer than 100. The target torque
Nonetheless, there is a limitation in the resolution of the servo motor, which may result in a situation where the designated unit torque value falls below the threshold of the servo motor’s loading resolution. This makes it unfeasible for the testing equipment to perform small-scale testing. Carrying out the test with a significant unit torque will have an impact on the hysteresis curve as explained below.
(1) The method of employing a substantial unit torque for loading influences the configuration of the hysteresis curve. Employing a modest unit torque during loading results in a hysteresis curve with a multitude of data points, allowing for a comprehensive representation of the lost motion generation process. Conversely, utilizing a substantial unit torque widens the spacing between points, leading to a reduction in the number of data points on the hysteresis curve and the omission of critical information. This can even lead to an alteration in the shape of the hysteresis curve, as depicted in Figure 6.
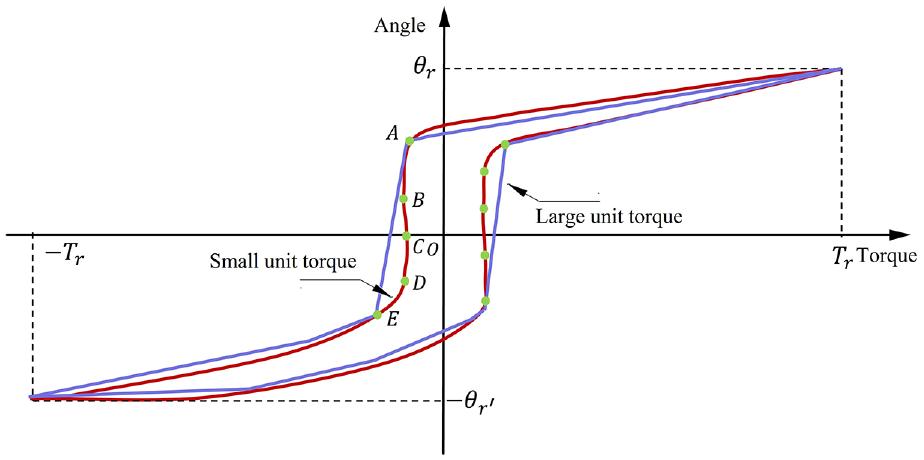
Influence of unit torque on lost motion test.
Figure 6 depicts that the section near 0 Nm on the hysteresis curve corresponds to the geometric error area of the reducer. Within this region, the internal state of the reducer oscillates between engagement, disengagement, and engagement once more. During the drawing process of the hysteresis curve from
(2) The utilization of the large unit torque loading method also affects the numerical values within the hysteresis curve. Raising the unit torque is comparable to elevating the loading rate, and the reducer demonstrates loading rate dependency. The hysteresis of the system is influenced by the speed of external input. As indicated by prior research in the literature,
13
loading rate dependency significantly influences lost motion testing when equal torque gradient loading is employed. Let the unit torques of two tests be
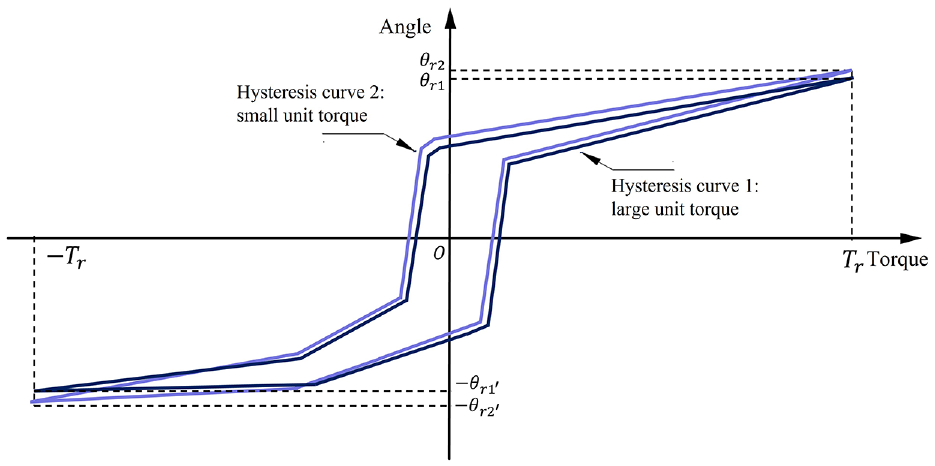
Influence of loading rate on lost motion test.
Hysteresis curve 1 is affected by the loading rate and reaches the target torque
Upon scrutinizing the aforementioned factors, it becomes evident that the constrained loading resolution of the servo motor hinders the feasibility of conducting small-scale testing. Furthermore, the use of a substantial unit torque in equal torque gradient loading can lead to alterations in both the numerical values and shape of the hysteresis curve, consequently yielding an incomplete and erroneous assessment of the reducer’s lost motion performance. Therefore, this paper introduces two alternative methods, namely equal position gradient loading and uniform speed loading, built upon the existing equipment capabilities.
Equal position gradient loading
Loading principle
Position encoders commonly employed in industrial servo motors typically possess resolutions exceeding 214. This increased resolution facilitates servo motors in attaining finer unit angle control compared to torque control. The equal position gradient loading method capitalizes on this characteristic. The loading process is shown in Figure 8 and equation (8), where
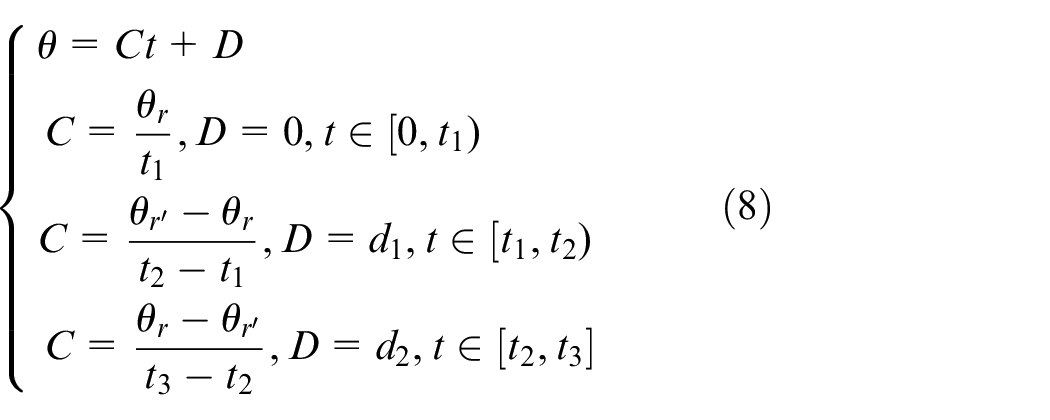
Principle of equal position gradient loading.
Test method
When conducting tests using the equal position gradient loading method, a preliminary assessment is required, denoted as step 1 in Figure 9. In this pre-test, the unit angle
Test steps of equal position gradient loading.
Test flow of equal position gradient loading.
Steps 2 and 3 in Figure 9 constitute the actual testing stage. During this phase, data is gathered from the torque sensor and angle sensor each time
Advantage
In comparison to the equal torque gradient loading method, the equal position gradient loading method addresses the issue of the unit torque being smaller than the servo motor’s loading resolution. It also offers a significantly higher number of data points in a single step, surpassing the standard requirement, resulting in the following advantages in test outcomes:
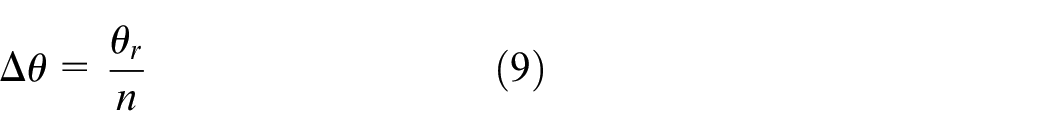
(1) It does not alter the shape of the hysteresis curve. This method allows for the setting of a smaller unit angle to construct a comprehensive hysteresis curve that accurately represents its shape. Additionally, when illustrating the geometric error area at 0 Nm in the reducer, it depicts the internal meshing-disengagement-meshing state, as shown in Figure 11.
(2) This approach excels at reducing the impact on the numerical values of the hysteresis curve. In contrast to equal torque gradient loading, which cannot mitigate loading rate dependency, equal position gradient loading achieves a lower loading rate by utilizing a smaller unit angle. This effectively diminishes the influence of loading rate dependence on the numerical values of the hysteresis curve, ensuring precise lost motion results.
The issue resolved by equal position gradient loading.
In summary, equal position gradient loading uses the high-resolution position encoder found within the servo motor. However, in cases where the servo motor’s resolution falls short, uniform speed loading can serve as a suitable alternative.
Value and application
Loading principle
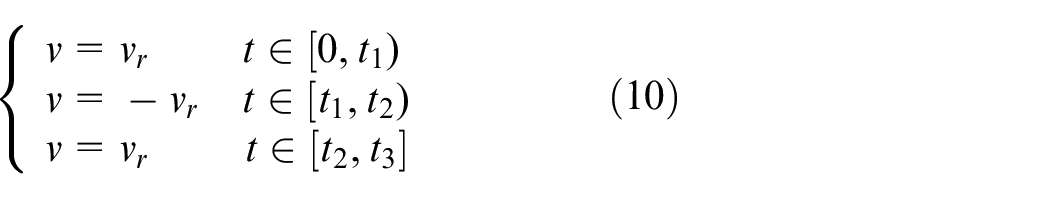
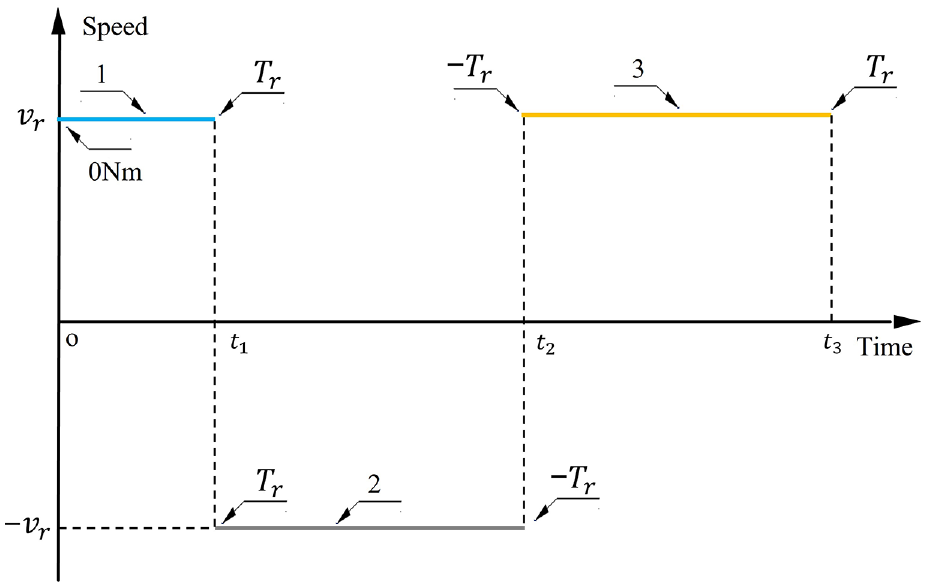
Uniform speed loading is a technique that utilizes the speed mode of the servo motor to control the rotational speed of the reducer’s output shaft at a uniform and low pace. During this procedure, torque and angle data are collected at regular time intervals. The loading principle is shown in Figure 12 and equation (10), where
Principle of uniform speed loading.
Test method
The testing methodology is depicted in Figure 9, and the testing procedure is presented in Figure 13. (1) The output end rotates forward to the target torque
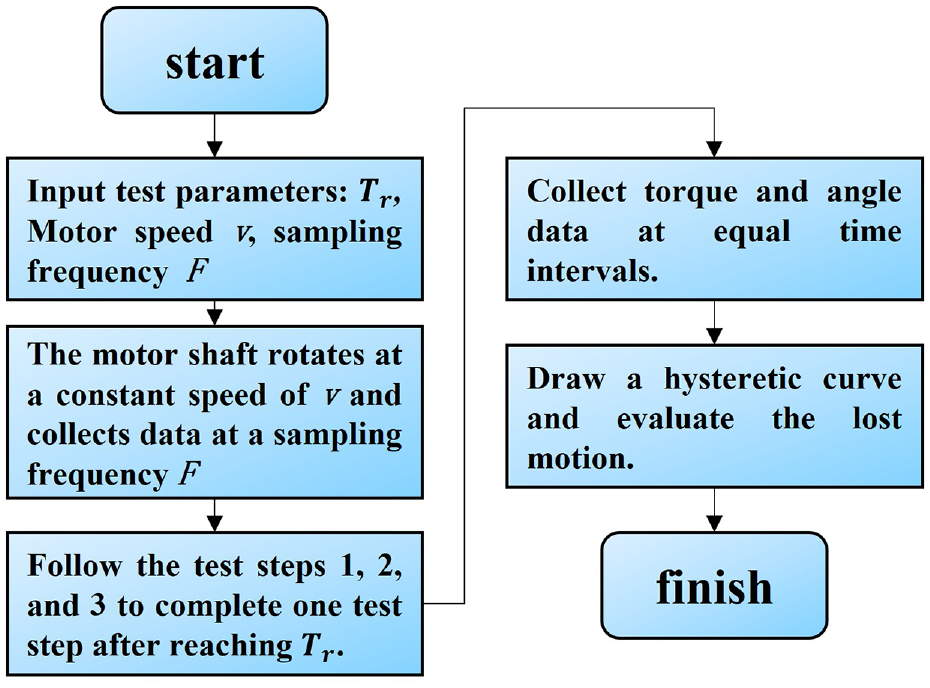
Test flow of uniform speed loading.
Advantage
In conclusion, both the uniform speed loading and equal position gradient loading methods represent enhancements over the equal torque gradient loading. They eliminate the need for specifying a unit torque or unit angle; thus, reducing the demands on the servo motor. Moreover, these methods preserve the original shape of the hysteresis curve and provide an accurate representation of the meshing state within the reducer, as demonstrated in Figure 11. Additionally, lowering the speed minimizes the influence of loading rate dependency on the test results.
A comparative analysis has established that these loading methods are better suited for small-sized reducers and yield more precise test outcomes. The efficacy of these loading methods will be further explored through experimentation.
Conclusion
Experimental condition
Figure 14 displays the author’s designed lost motion tester for small-sized reducers, composed of three primary components: a precision mechanical system, a hardware system, and test software. The input end of this tester accommodates small reducers, with the flexibility to test various reducer types, including square and cylindrical, through fixture adjustments. The output end is subjected to loading by a servo motor with a rated torque of 10 Nm, capable of precise gradient loading down to 0.02 Nm. An encoder with a resolution of 214 captures the output end’s angle, while a high-precision circular grating and a torque sensor gather data on the torque. The entire test system employs automated control software to achieve precise lost motion testing.
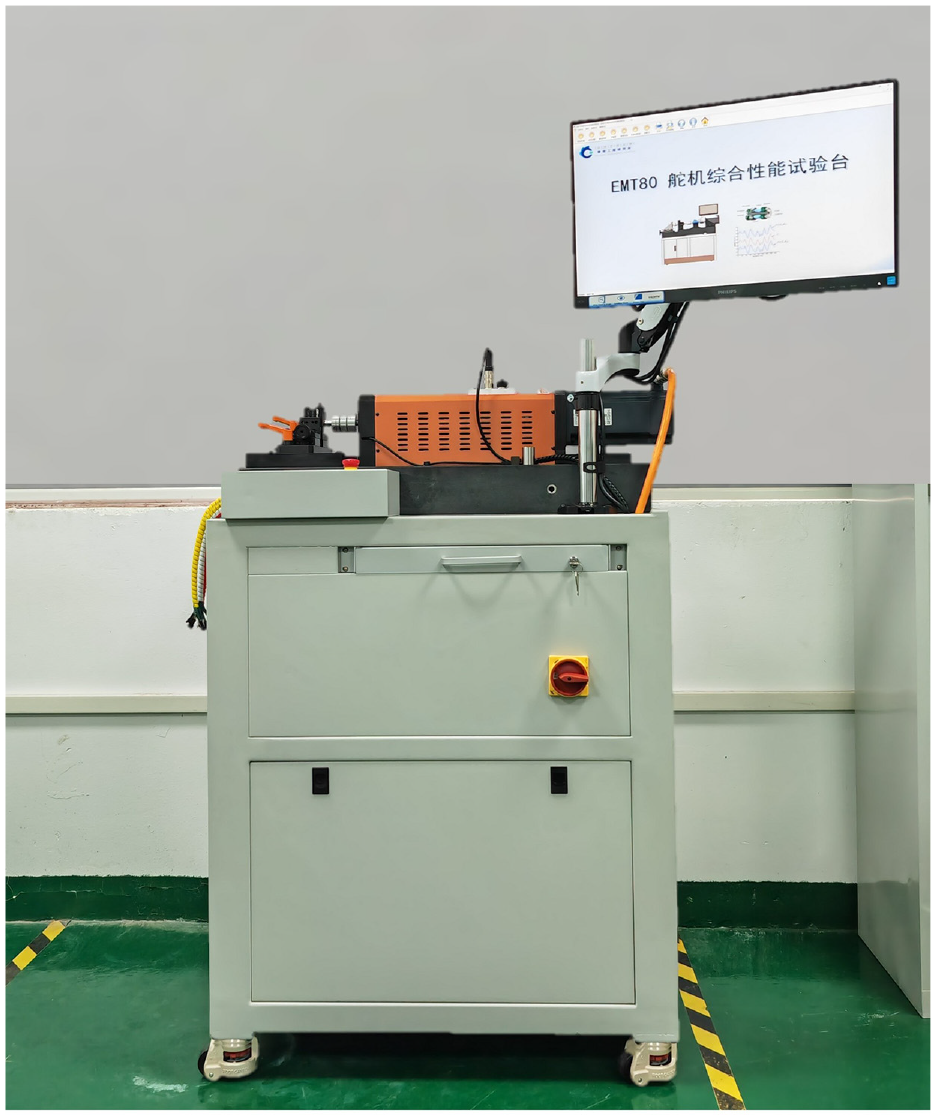
Testing machine.
Figure 15 presents the small reducer undergoing testing, and its structural details are provided in Figure 16. It offers dimensions of 40 mm in length, 20 mm in width, and 40 mm in height. The gear assembly employs parallel shaft gears and features a three-stage reduction. Powder metallurgy is the chosen material, and the motor shaft gear is mounted on the motor’s output shaft through an interference fit. Each stage’s gears are affixed to the gear shaft using a clearance fit, and rolling bearings are utilized. For specific parameters, refer to Table 1.
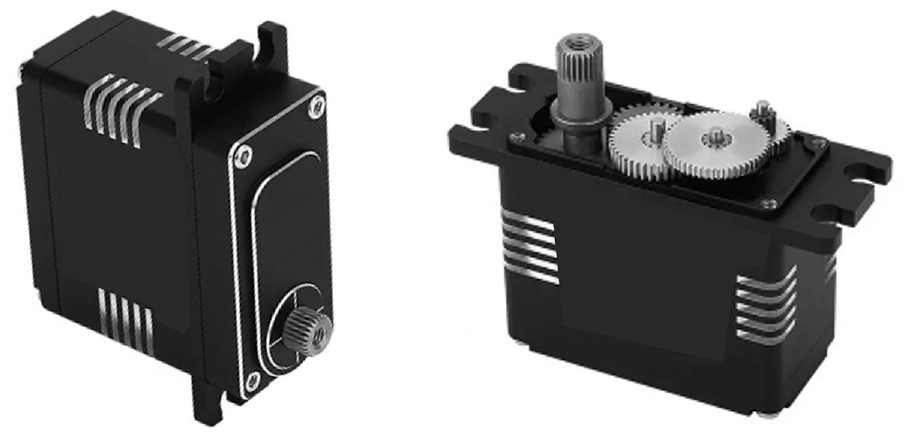
Physical picture of small-size reducer.
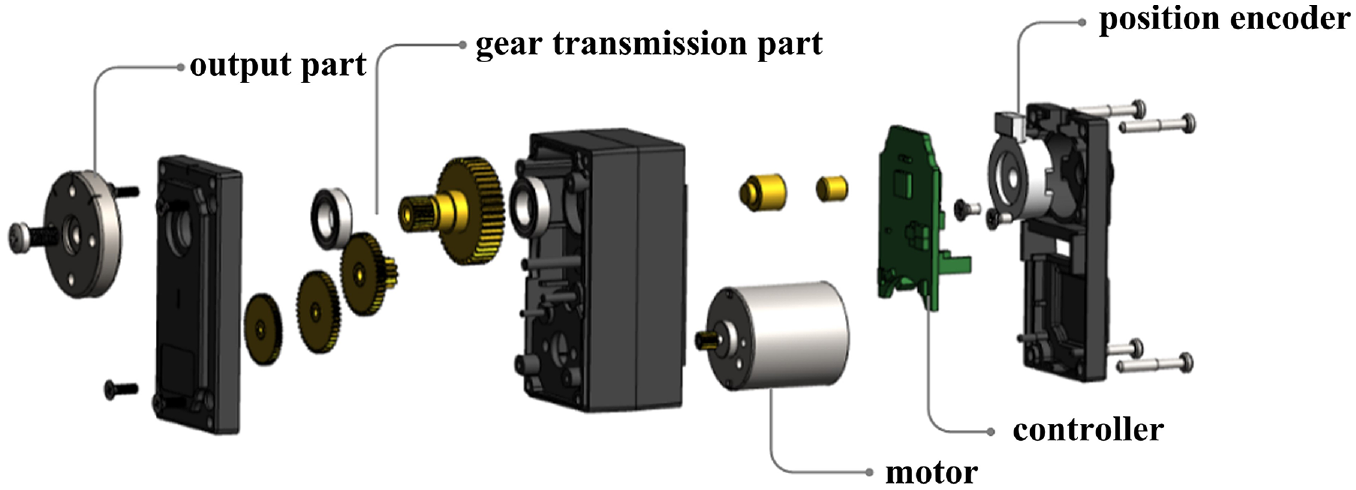
Structure diagram of small-size reducer.
The parameters of small-size reducer.
Test experiment
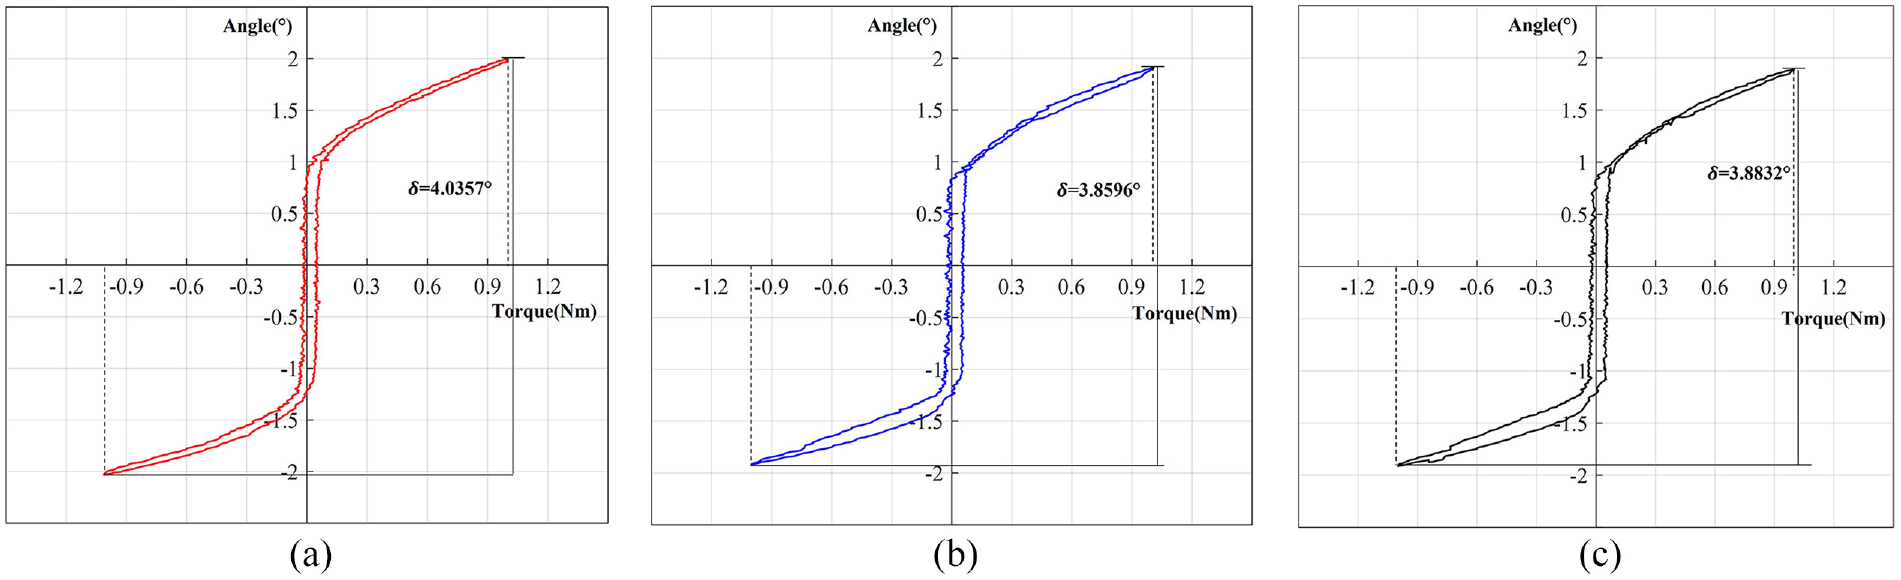
Table 2 provides the test conditions for the three loading methods. The engineering practice’s standard condition is denoted as condition 1. To validate the earlier analysis, various multiples of condition 1 are included in the testing. The resulting test outcomes are illustrated in Figures 17 to 19, and the corresponding lost motion values (δ) are detailed in Table 3. Changes in the hysteresis curve’s shape for the three loading methods under condition 1 are summarized in Table 4.
Experiment conditions.
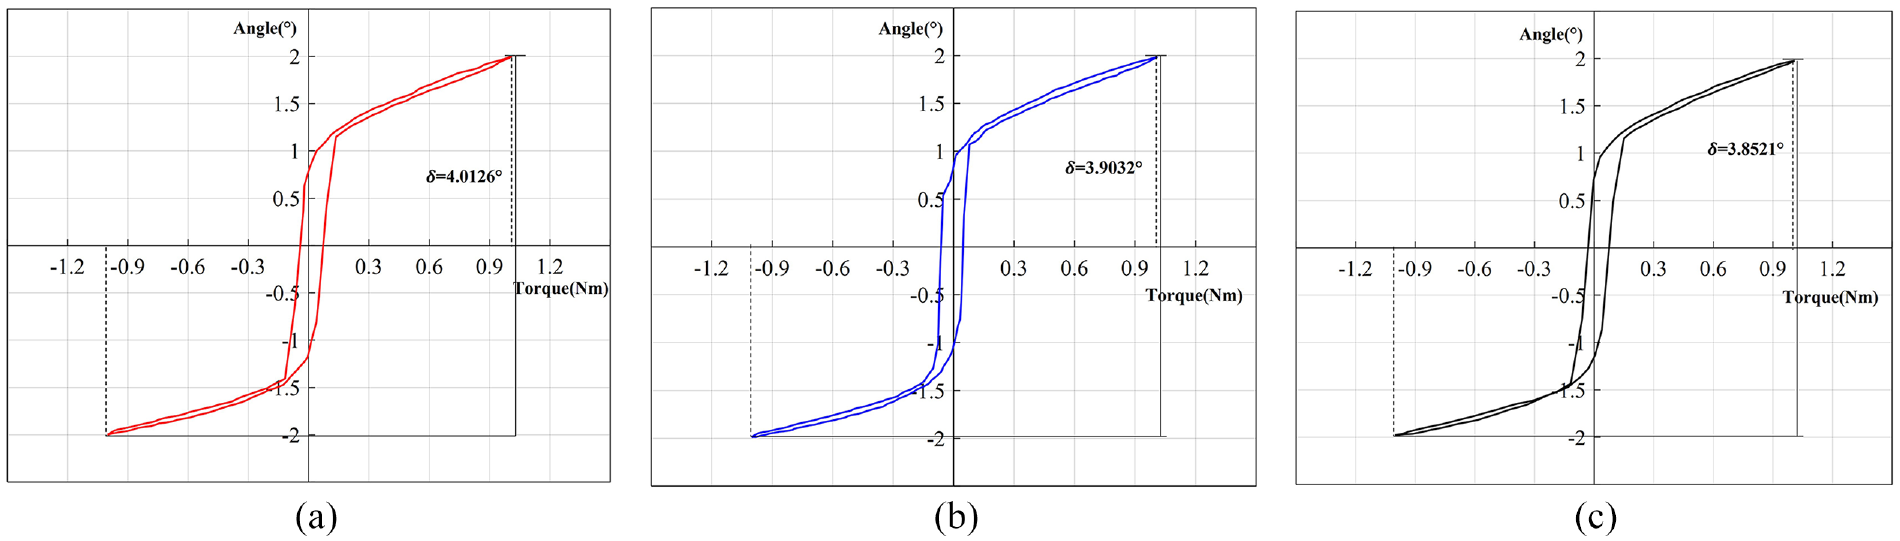
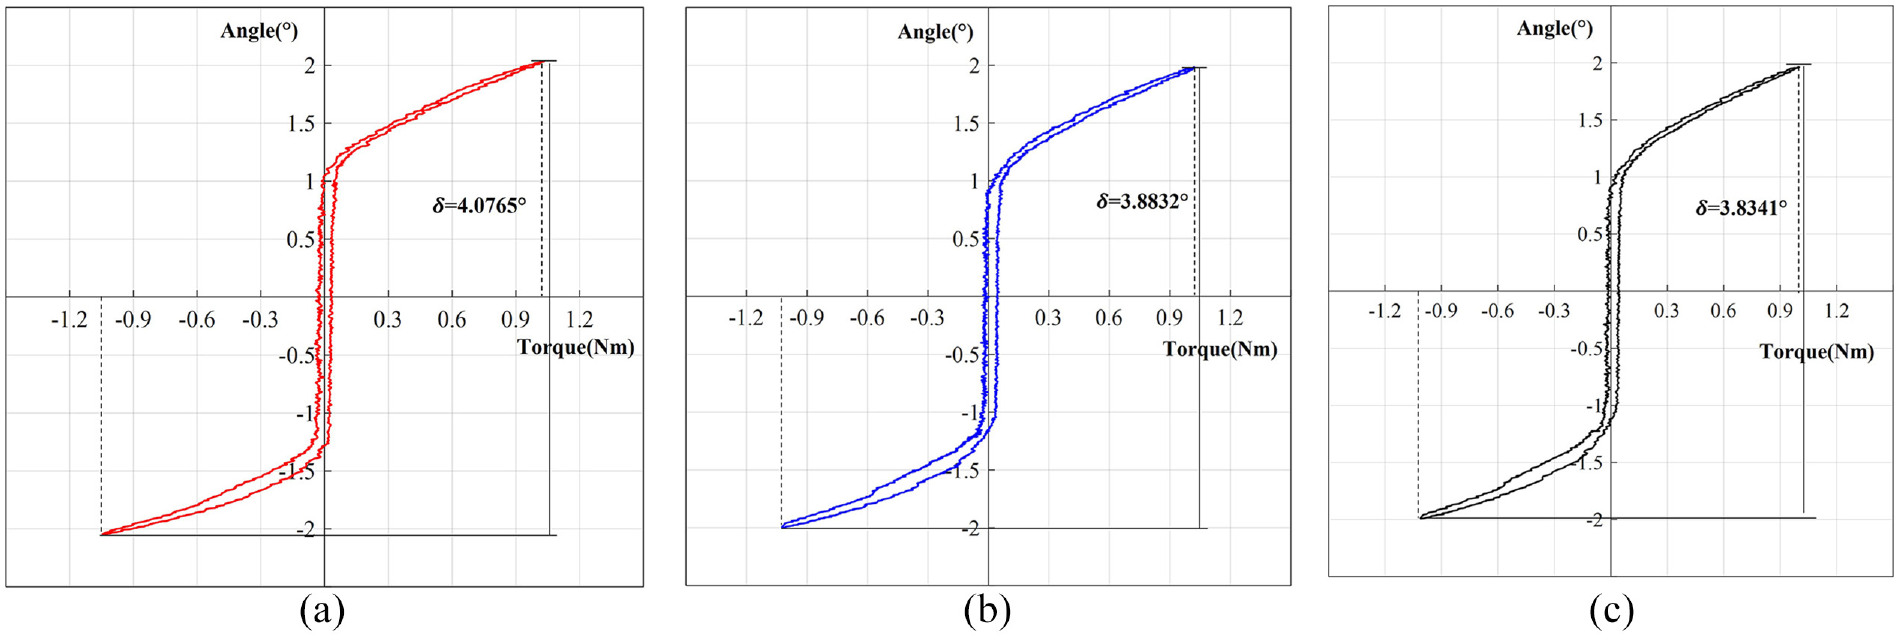
Constant torque gradient loading test: (a) 0.02 Nm, (b) 0.05 Nm, and (c) 0.1 Nm.
Equal position gradient loading test: (a) 0.01°, (b) 0.02°, and (c) 0.1°.
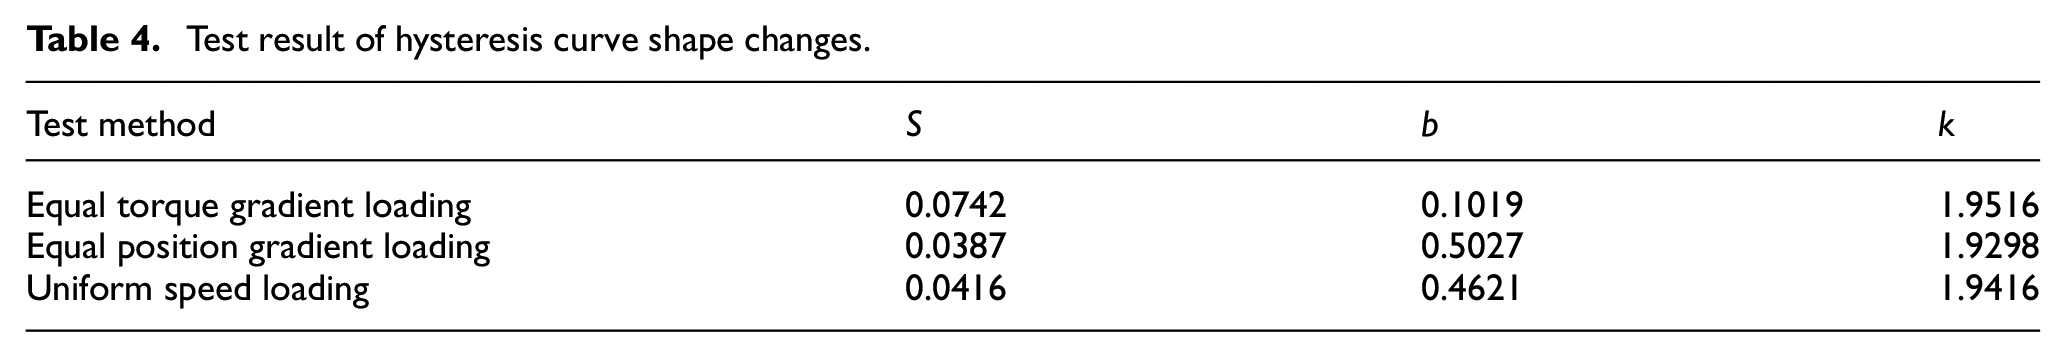
Constant speed loading test: (a) 0.01°/s, (b) 0.05°/s, and (c) 0.1°/s.
Test resultof lost motion.
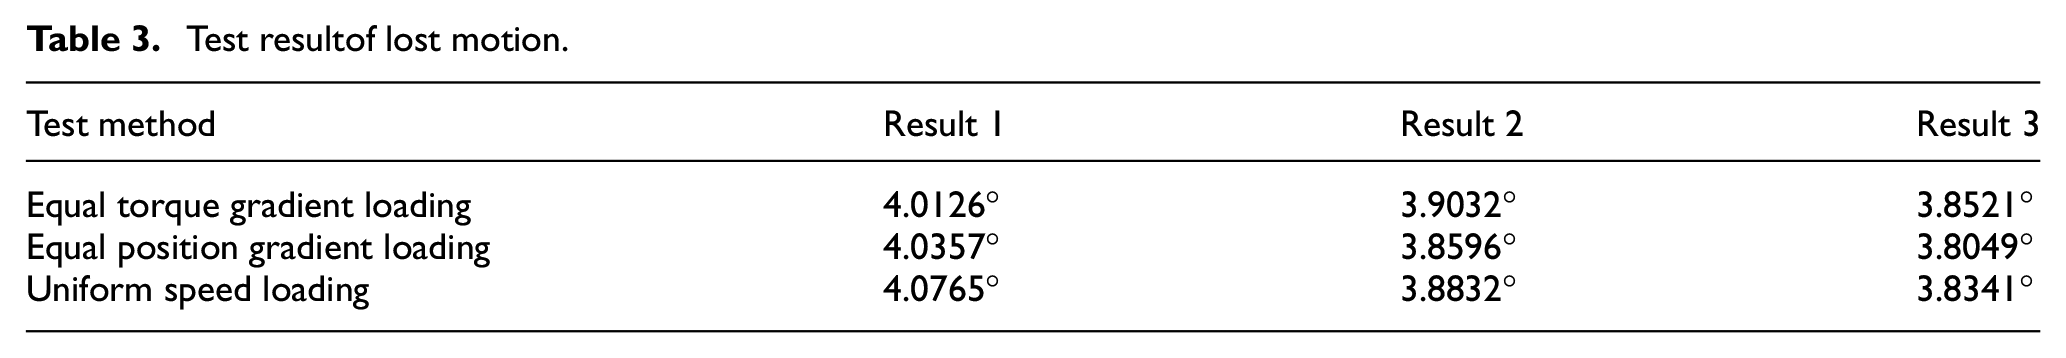
Test result of hysteresis curve shape changes.
Result analysis
The examination of the hysteresis curve shape revealed the following findings: All three loading methods produced hysteresis curves with an S-shape. The enclosed area S and width b varied among the methods. Equal torque gradient loading had a larger S and b due to missing data points caused by loading with a substantial unit torque. The degree of inclination k was relatively consistent, tied to the reducer’s design and unaffected by other factors. Within the geometric error area around 0 Nm, the hysteresis curve of the equal torque gradient loading method appeared relatively smooth and did not accurately depict the internal meshing state of the reducer. In contrast, the hysteresis curves of the other two methods effectively reflected the meshing state inside the reducer.
From a numerical perspective, it can be observed that: The lost motion results obtained from the three loading methods are relatively similar, affirming the efficacy of both the equal position gradient loading and uniform speed loading methods. All three loading methods are influenced by loading rate dependence. As the loading rate increases, the lost motion value of the reducer decreases. In the process from 0 to
In light of the obtained results, it is evident that the limited resolution of the servo motor results in missing data and alterations in the hysteresis curve’s shape when employing a substantial unit torque in equal torque gradient loading. However, these limitations are overcome by equal position gradient loading and uniform speed loading. Both loading methods have been proven effective in terms of the hysteresis curve’s shape and numerical values when testing lost motion in small-sized reducers. Furthermore, these loading methods provide a more comprehensive understanding of lost motion.
Conclusion
This paper investigates loading methods for assessing lost motion in small-sized reducers, yielding the following conclusions:
(1) Considering the attributes of small-sized reducers and the restrictions of equal torque gradient loading, we propose two loading methods: equal position gradient and uniform speed gradient loading.
(2) When a substantial unit torque is employed in equal torque gradient loading due to the limitations of servo motor loading resolution, it results in changes in the hysteresis curve’s shape, leading to an increase in area S and width b. However, the degree of inclination k remains unaffected.
(3) Both equal position gradient loading and uniform speed loading surmount the obstacles posed by servo motor loading resolution limitations, effectively capturing the hysteresis curve’s characteristics and reflecting the meshing state within the reducer.
(4) All three loading methods are susceptible to loading rate dependence; nevertheless, equal position gradient loading and uniform speed loading can mitigate the impact of variations in loading rate on test results by reducing the load rate.
Footnotes
Author contributions
The contribution of Zhaoyao Shi is proposing the new hysteresis model. The contribution of Huiming Cheng is verifying the model and analyzing the influence of loading rate dependence on the lost motion test. The contribution of Zhiyong Yu is giving suggestions to reduce the loading rate dependence. The contribution of Pang Zhang and Bo Yu is compiling some of the figures. All authors have read and agreed to the published version of the manuscript.
Declaration of conflicting interests
The author(s) declared no potential conflicts of interest with respect to the research, authorship, and/or publication of this article.
Funding
The author(s) disclosed receipt of the following financial support for the research, authorship, and/or publication of this article: This work was supported by the Zhongguancun open laboratory concept project (grant number Q7001004202101).