
Abstract
Statistical process control basically involves inspecting a random sample of the output from a process and deciding whether the process is producing products with characteristics that fall within a predetermined range. It is used extensively in the field of reliability engineering. The reliability of the production process is thoroughly monitored for any internal variation using the SPC. The aim is always to settle such variations through a proper control monitoring. If the underlying distribution of the process is known to the researcher than the use of parametric control charts are useful but in many cases when there is doubt about the distribution of the process then it is preferred to use non parametric control charts. In this paper we propose the modified Exponentially weighted moving average (EWMA), Double Exponentially weighted moving average (DEWMA), Hybrid Exponentially weighted moving average (HEWMA), Extended Exponentially weighted moving average (EEWMA), Modified Exponentially weighted moving average (MEWMA) and mix- type control charts by mixing these control charts with Tukey control chart EWMA-TCC, DEWMA-TCC, HEWMA-TCC, EEWMA-TCC, MEWMA-TCC for the shape parameter of the Kumaraswamy Lehmann-2 Power function distribution (KL2PFD).
Introduction
Statistical quality control is an operative instrument to uphold the constancy of any manufacturing process such as the process to monitor the number of errors produced by any newly heaved software by a software manufacturing company or the reliability of any production process of the filling height of soft drink beverages. The reliability of such production processes is thoroughly monitored for any internal variation. The aim is to settle such variations through proper control monitoring. If the underlying distribution of the process is known to the researcher than the use of parametric control charts is useful but, in many cases, when there is doubt about the distribution of the process then it is advised to use non parametric control charts.
Many authors have proposed parametric control charts such as Shewhart control chart by Shewhart, 1 EWMA control chart by Roberts, 2 HEWMA control chart by Shamma and Shamma, 3 DEWMA control chart by Adeoti, 4 EEWMA control chart by Naveed et al. 5 Also the work on Nonparametric control chart are constructed to monitor a distribution free process such as Tukey Control chart (TCC) by Alemi. 6 The Tukey control chart (TCC) uses the principal of box plot and is efficient to monitor the process with less number of observations as compare to other control charts. Many authors further studied the TCC for example Borckardt et al. 7 and Torng and Lee 8 studied the performance of the chart for serially dependent variables. Many other authors also studied the TCC such as Lee 9 ; Lee et al. 10 ; Lee and Torng 11 ; Tercero-Gomez et al. 12 ; Torng. 13
The studies based on the mixture of TCC with some parametric control charts includes Khaliq et al., 14 Khaliq et al. 15 and Khaliq and Riaz 16 who studied the EWMA-TCC and CUSUM-TCC charts to monitor the mean of the process and showed their performance over simple control charts for symmetrical distributions. Similarly, Abu-Shawiesh, 17 Raza, 18 and Riaz, 19 Taboran 20 proposed some mixed control charts with TCC and proved their efficiency for process mean. Phantu and Sukparungsee 21 also suggested mixing of doubly EWMA and TCC and showed its efficiency over EWMA–TCC. Khaliq 22 developed median based EWMA-TCC and concluded that it’s better to be used under rational subgrouping (Zaka et al. 2022). 23
Although the skewed distribution occurs more often in different real-life scenarios but very less work has been discussed for such situations when the process distribution does not follow the normality but a skewed distribution. Interested readers may read Noorossana et al., 24 Lin et al., 25 Erto et al., 26 Liang et al. 27 and Khan et al. 28 Also, the control monitoring for the shape parameter of Power function distribution, weighted power function distribution was done by Zaka et al., 29 Zaka et al. 30 The KL2PFD introduced by Zaka et al. 29 is more flexible to use for the positively skewed data than Kumaraswamy distribution and Power function distribution. By considering this advantage of Kumaraswamy distribution, we will discuss the importance of the shape parameter distribution and its application in reliability engineering problems.
The shape parameter is a kind of numerical parameter, which directly affects the shape of a distribution rather than simply shifting or stretching it. So, the importance of the shape parameter cannot be ignored. Several authors have proposed the monitoring of the shape parameter for the skewed distributions such as Zaka et al.29,30–32 and Zaka and Akhter. 33
After reading the above literature, we see that the problem about the construction of proper control monitoring is unaddressed for the KL2PFD which has application in almost all fields of life. Also, the experts of statistical quality control provided either parametric control charts such as EWMA, DEWMA, HEWMA, EEWMA or non-parametric control charts are proposed but the mixture of these two types of control charts is rarely available in literature.
To overcome the gap discussed above and took motivation from the literature, we propose the modified EWMA, DEWMA, HEWMA, EEWMA, MEWMA and mix-type control charts by mixing these control charts with Tukey control chart (EWMA-TCC, DEWMA-TCC, HEWMA-TCC, EEWMA-TCC, MEWMA-TCC) for the shape parameter of the KL2PFD. In this paper we have not only modified the existing control charts for the shape parameter of KL2PFD but also proposed the mix-type control charts by mixing these control charts with Tukey control chart (EWMA-TCC, DEWMA-TCC, HEWMA-TCC, EEWMA-TCC, MEWMA-TCC) for the shape parameter of the KL2PFD.
The uniqueness of this paper comes from the fact that the construction and comparison of control charts for the shape parameter of KL2PFD has not been discussed so far in literature. In this paper, a brief discussion on the shape parameter of KL2PFD is presented in Section 2. The proposed parametric control charts for the shape parameter of KL2PFD (Section 2) is given in Section 3. The Mix-type control charts for the shape parameter of KL2PFD (Section 2) are proposed in Section 4.
Shape parameter of KL2PFD
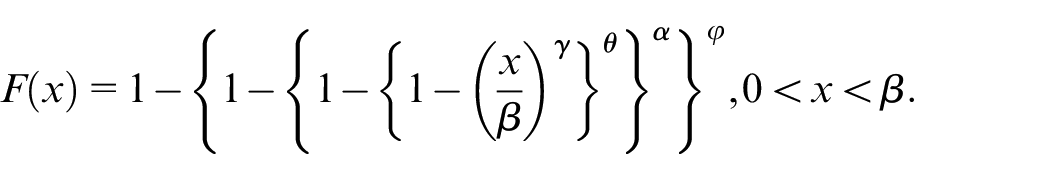
Zaka et al. 29 proposed the KL2PFD as a more consistent probability distribution which is easily used to model different real-life situations. The probability distribution function and cumulative distribution function is given by
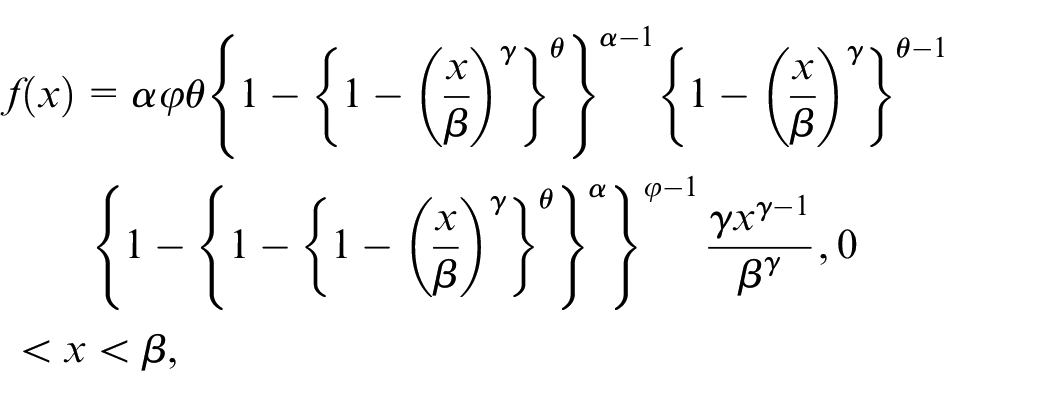
and
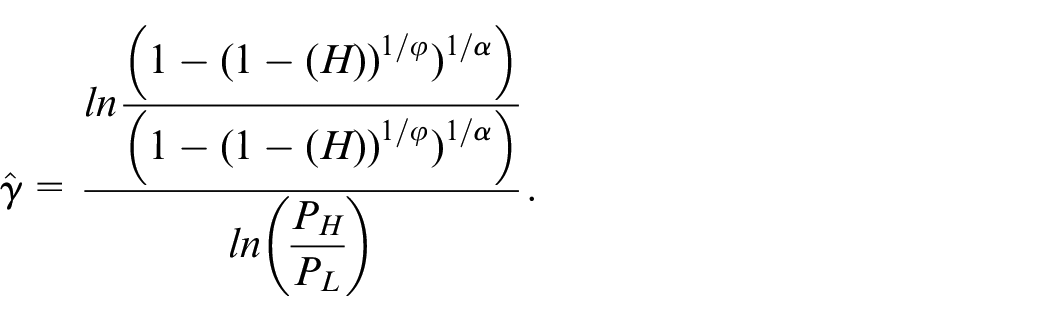
The percentile estimator (PE) for the shape parameter of KL2PFD is also discussed in Zaka 34 is given by
Some proposed parametric control charts for the shape parameter of KL2PFD
Modified EWMA control chart for shape parameter of KL2PFD
The EWMA control chart for the shape parameter of power function distribution was first proposed by Jabeen and Zaka 35 . We have proposed modified EWMA for the shape parameter of KL2PFD. The statistic for EWMA is given as

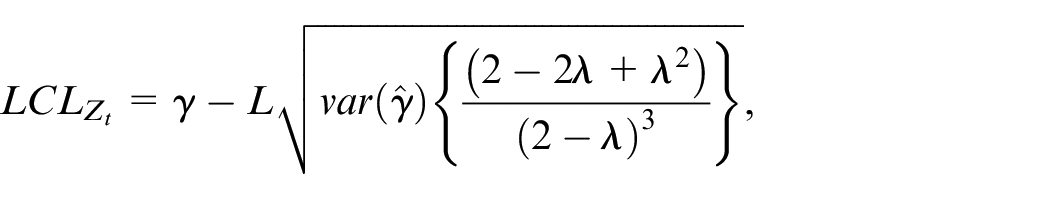
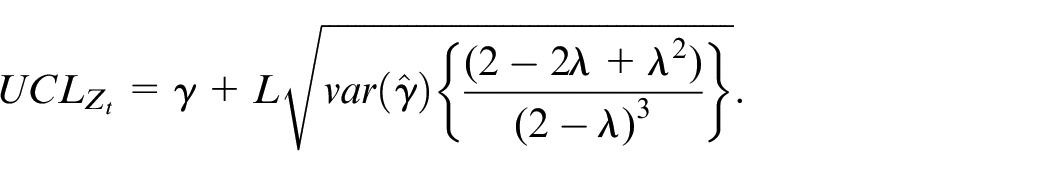
and the control limits are given as


where “L” is chosen in such a way that the ARL0 of EWMA control chart reaches a pre-specified level.
Modified DEWMA control chart for the shape parameter of KL2PFD
The usual DEWMA control chart was discovered by Shamma and Shamma 3 to control the average of any process. We modify Shamma and Shamma 33 to study the performance of DEWMA control chart for the shape parameter of the KL2PFD

where

The control limits (Now, we can introduce the control limits in the following form)

Where L is chosen in such a way that the ARL0 of DEWMA control chart reaches a pre-specified level.
Modified HEWMA control chart for shape parameter of KL2PFD
The HEWMA control chart to study the shape of any distribution was discussed by Zaka. 30 The modified HEWMA for the shape parameter of KL2PFD is given below

where
The control limits are given by

where the value of L is chosen in a manner that ARL0 of HEWMA control chart reaches a pre-specified level.
Modified MEWMA control chart for the shape parameter of KL2PFD
The MEWMA was proposed by Khan. 28 The modified MEWMA is given by

We have proposed the modification to Khan et al. 28 using the shape parameter of the underlying probability distribution of process


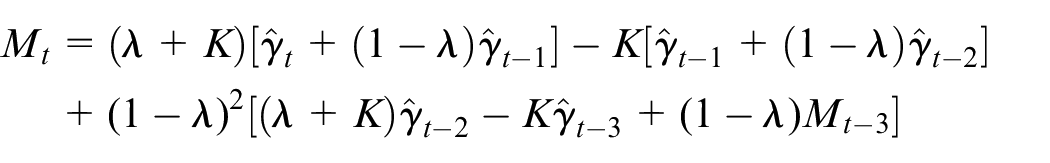
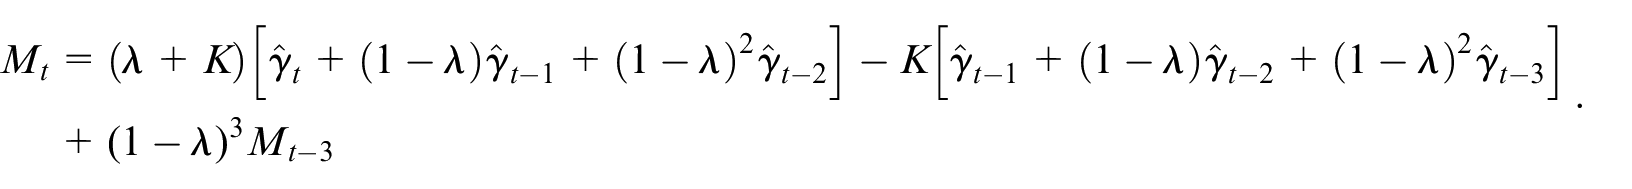
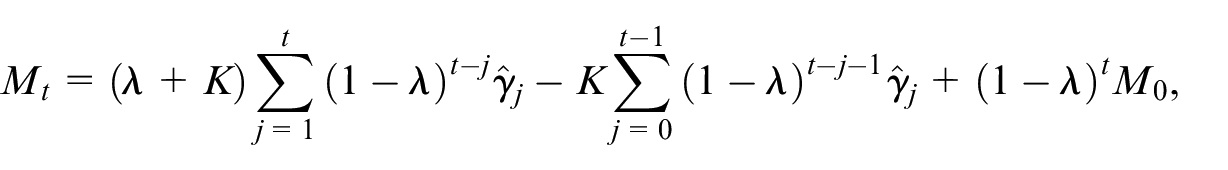
On generalizing, we get


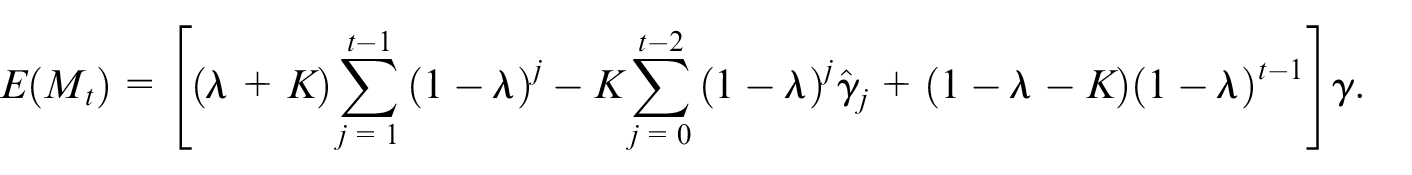
The variance is given as
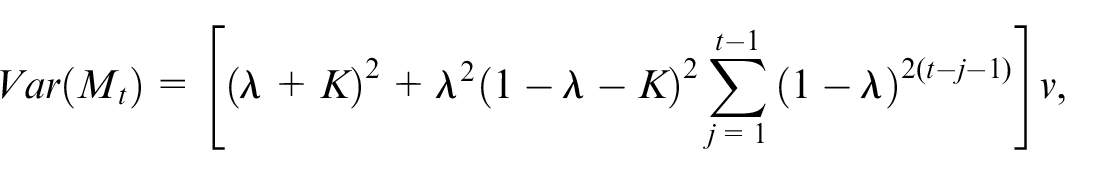
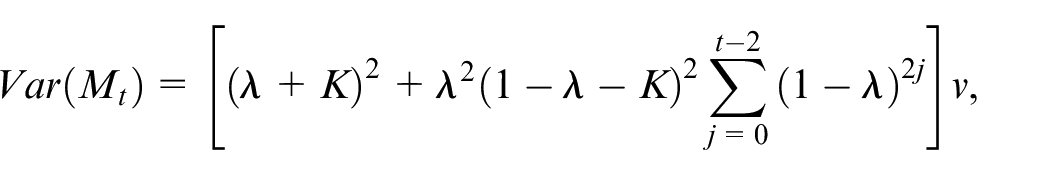
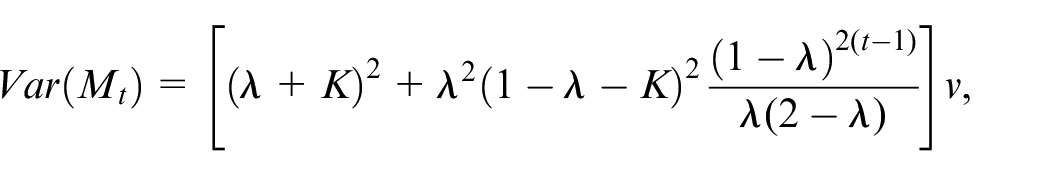
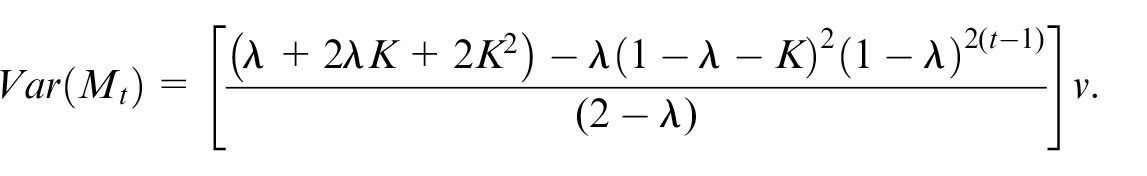
The control limits are given as
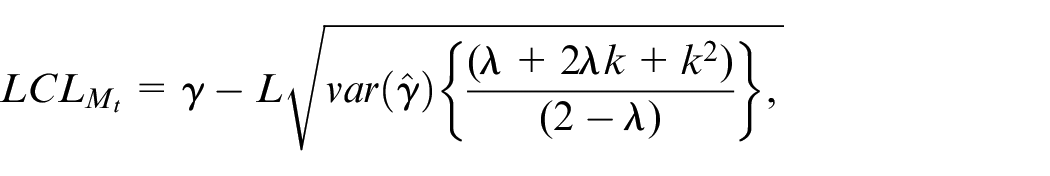

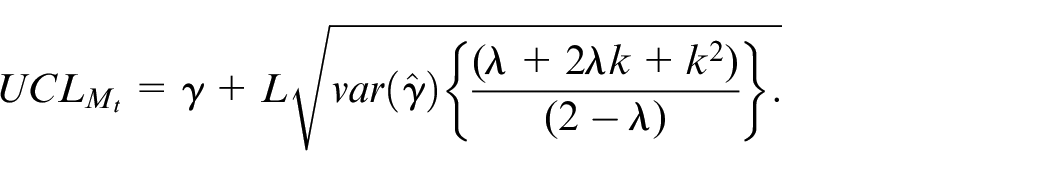
Where the value of L is calculated in such a way that the ARL0 of HEWMA control chart reaches a pre-specified level.
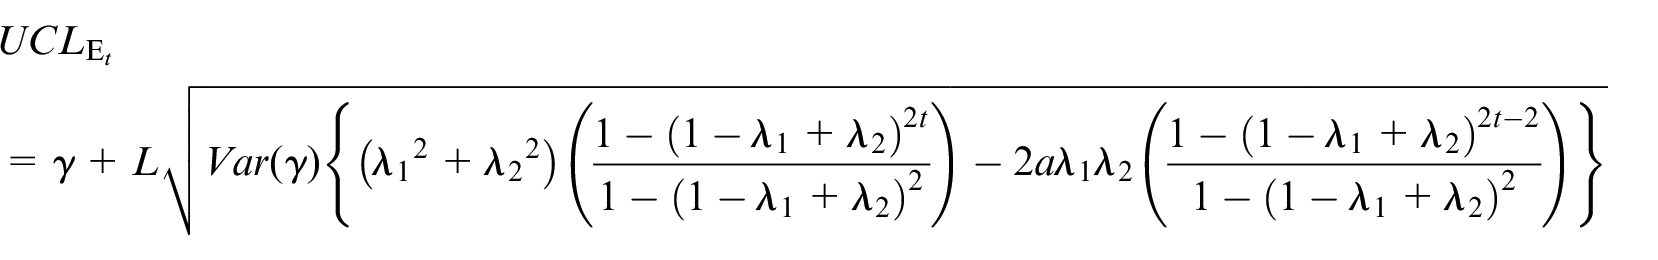
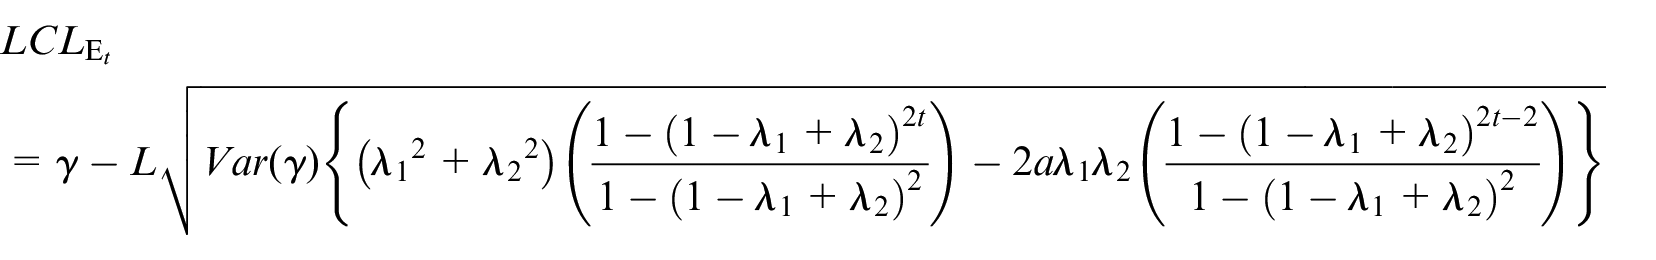
Modified EEWMA control chart for shape parameter of KL2PFD
The traditional EEWMA control chart was proposed by Naveed et al. 5 The EEWMA was first modified by Jabeen and Zaka 35 using the shape parameter of some skewed distribution. We have modified it for the shape parameter of KL2PFD as:

The control limits are given as

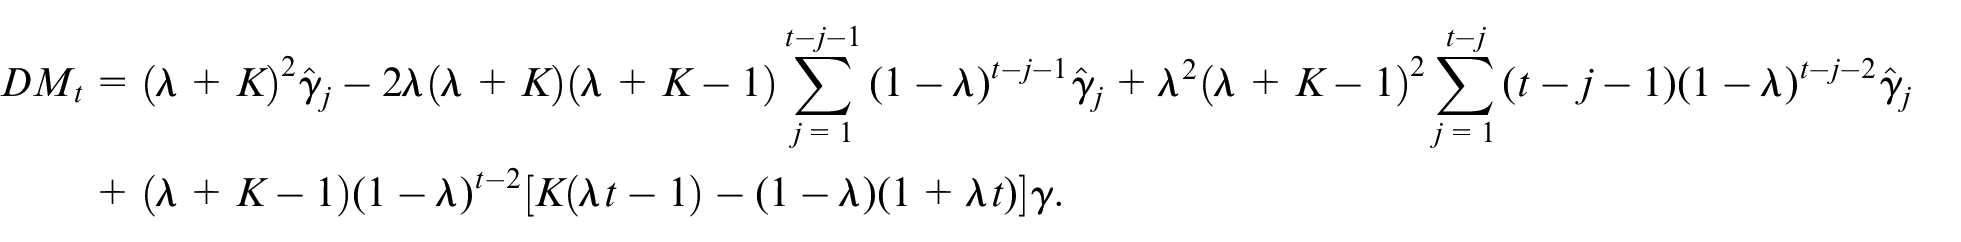
Modified DMEWMA control chart for shape parameter of KL2PFD
The DEWMA as a mixture of two control charts is first proposed by Alevizakosa et al. 36 We have modified Alevizakosa et al. 36 for the shape parameter of any probability distribution as given by


Where
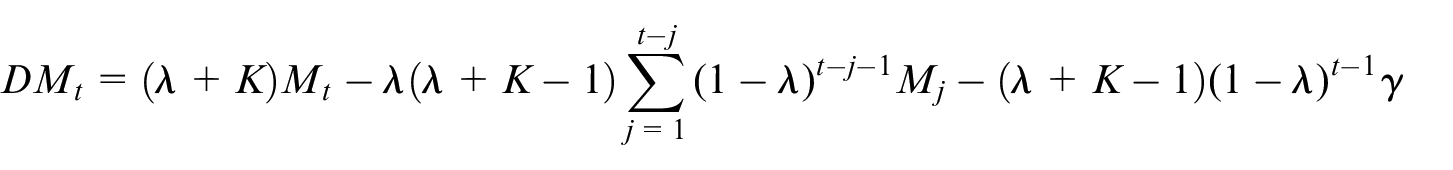
In the same way following Alevizakosa et al., 36 we find variance as
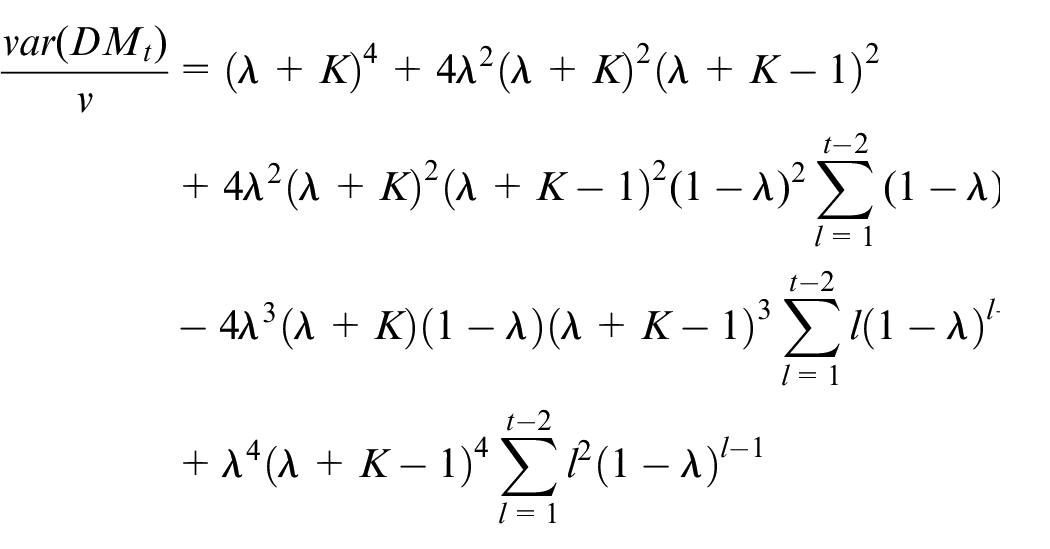
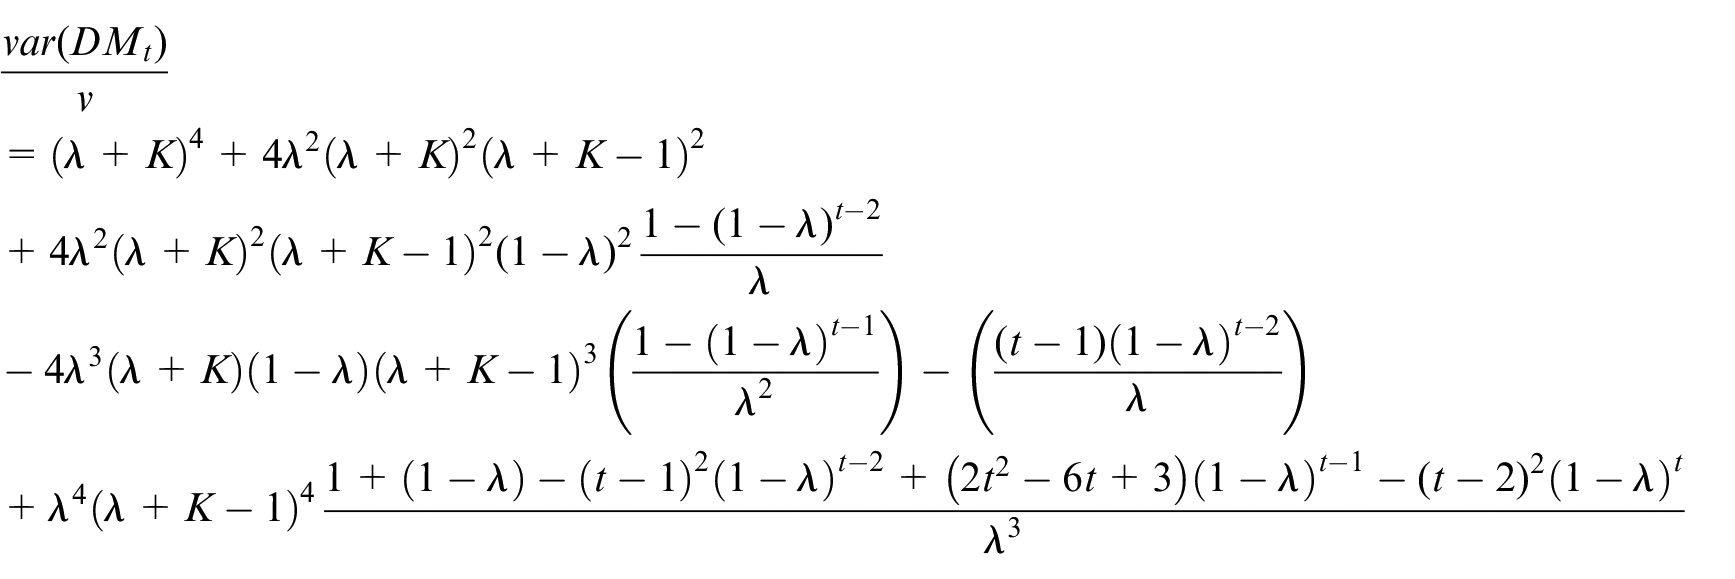
The control limits are:


Construction of some mix-type control charts for the shape parameter of KL2PFD
In this section, we discuss the construction of some mix-type control chart to control the shape of any underlying process.
EWMA-Tukey Control Chart for the shape parameter
The control limits for the mixture of two control charts EWMA for the shape parameter of Power function distribution proposed by Zaka et al. 30 and Tukey control chart proposed to monitor non normal distribution is given as

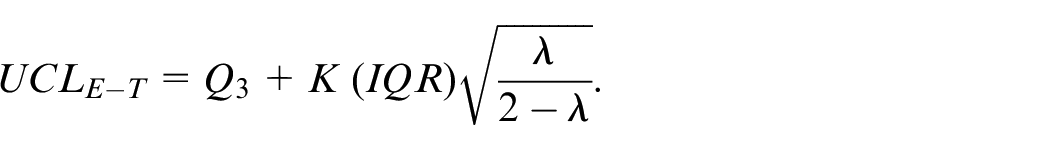
Where
DEWMA-Tukey Control Chart for the shape parameter
The control limits using DEWMA-Tukey Control Chart for the shape parameter is given as
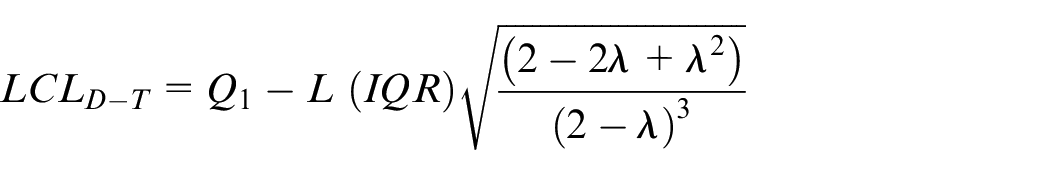

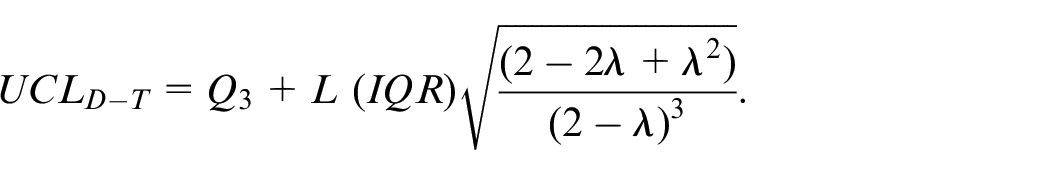
Where
Construction of HEWMA-TCC Control chart for the shape parameter of KL2PFD
The control limits for HEWMA-TCC for the shape parameter of KL2PFD is given below
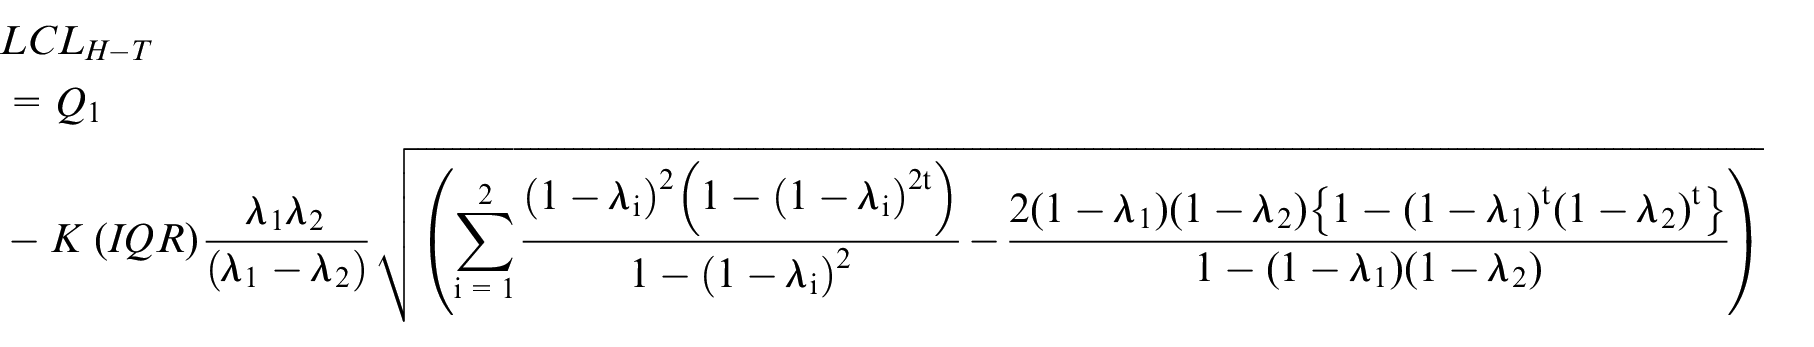

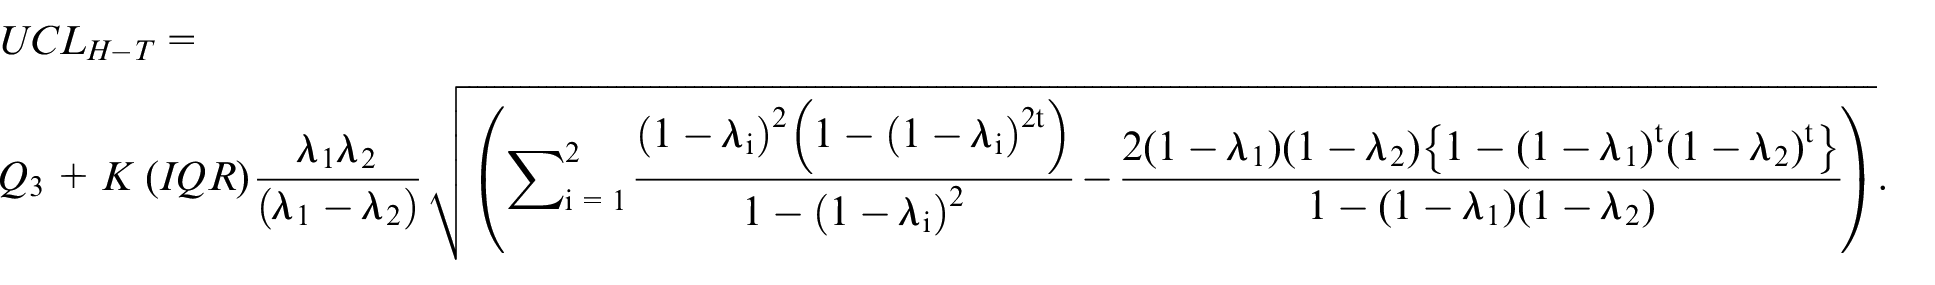
Where
MEWMA-Tukey Control Chart for the shape parameter
We modified the MEWMA proposed by Khan et al. 28 for the shape parameter of any distribution and Tukey control chart (TCC) proposed to monitor non normal distribution is given as
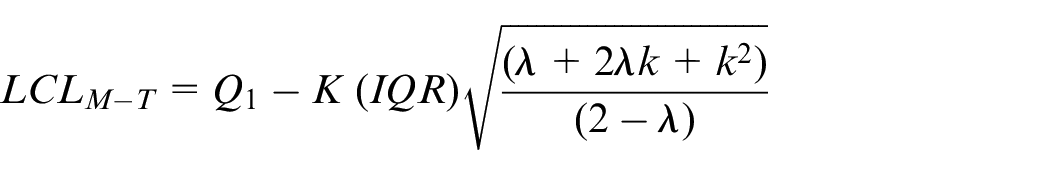

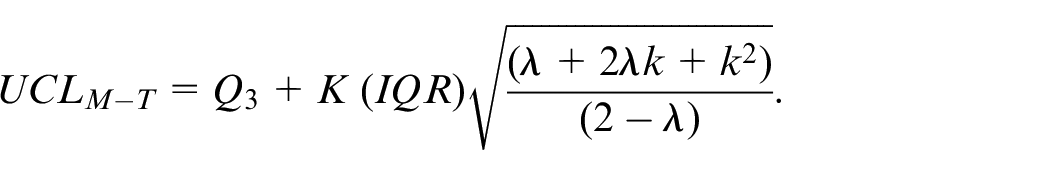
Where
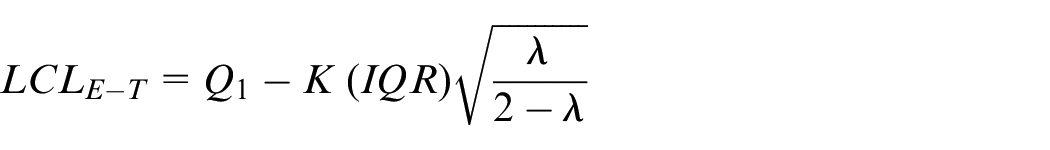
DMEWMA-Tukey Control Chart for the shape parameter
We modified the DMEWMA by Alevizakosa et al. 36 for the shape parameter of any distribution and Tukey control chart (TCC) proposed to monitor non normal distribution is given as


Where
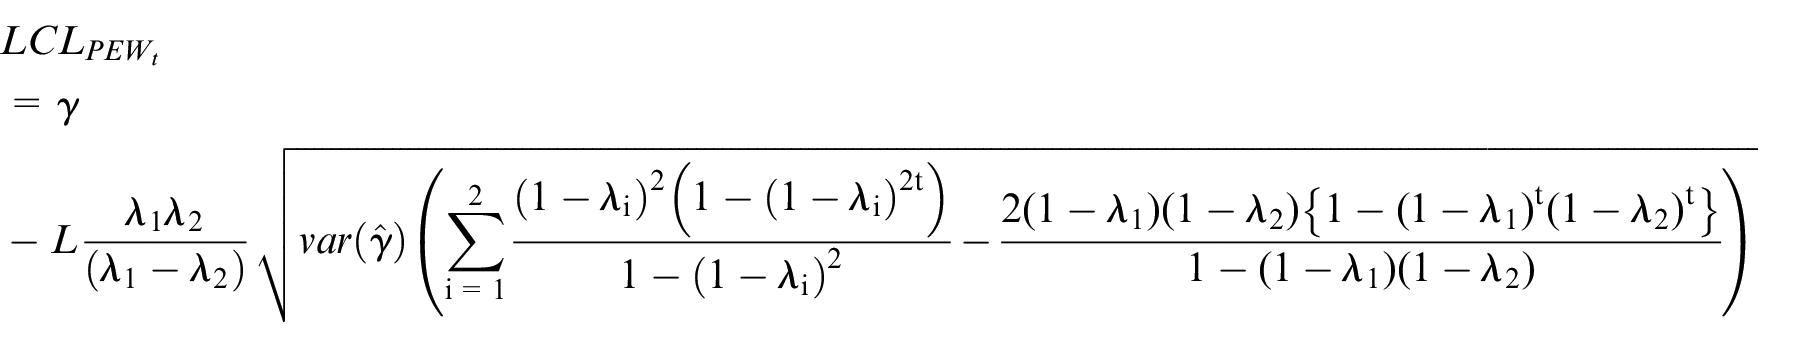
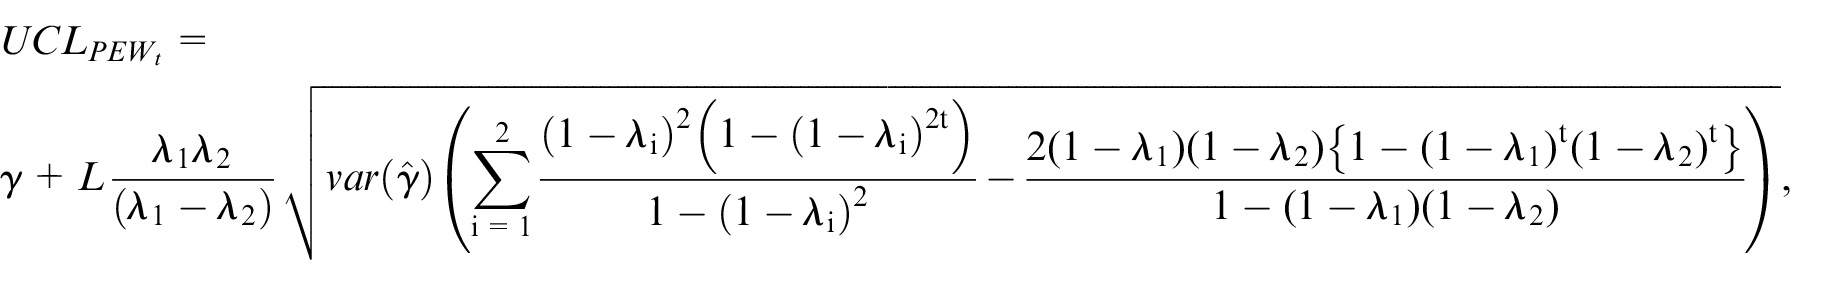
Construction of EEWMA-TCC Control Charts
We have mixed the EEWMA control chart proposed by Zaka et al. 30 and Tukey control chart to produce a flexible control chart that can be used for the early detection of any minor change in the process. The control limits are given as
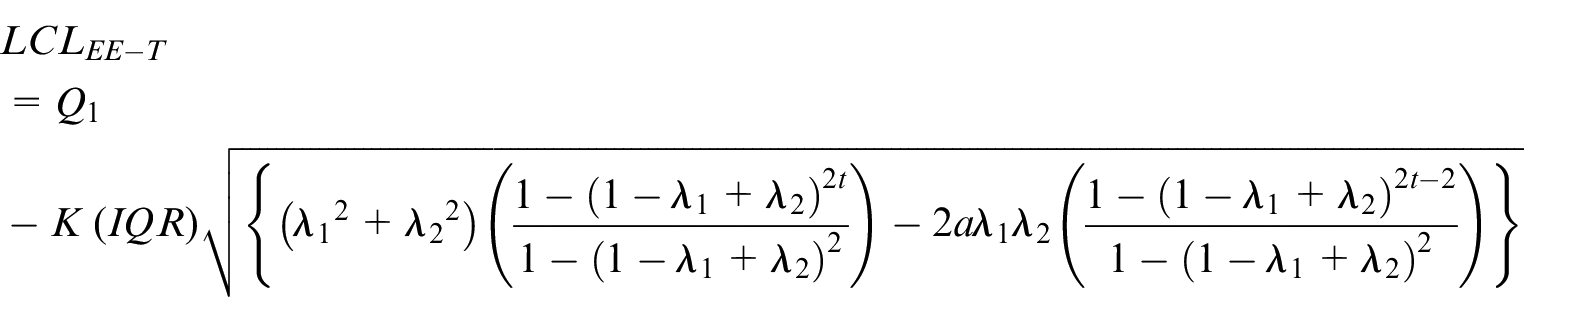

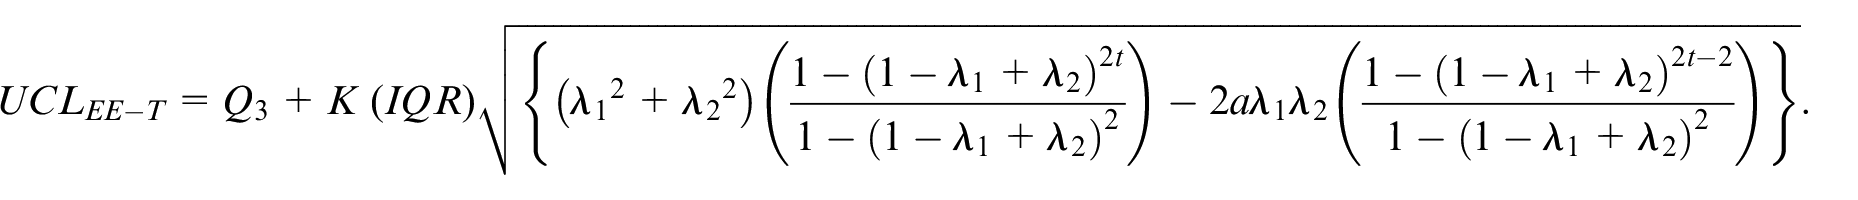
Where
DMEWMA-Tukey Control Chart for the shape parameter
We modified the DMEWMA by Alevizakosa et al. 36 for the shape parameter of any distribution and Tukey control chart (TCC) proposed to monitor non normal distribution is given as


Where
Performance evaluation of proposed parametric and mix-type control chart and algorithm
Average run length
The ability of the control charts is evaluated through Average run length (ARL) criterion. It is well-defined as the average number of samples used to plot before any signal of an out-of-control sample. ARL is marked by ARL0 for the expected number of samples until a control chart signals, given that the process is in control and ARL1 for the expected number of samples until a control chart signals, given the process is out of control.
By definition
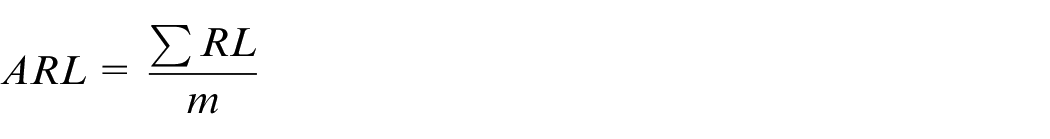
Where
Algorithm
For Parametric control charts we use the following algorithm to generate Tables 1 to 6. The steps are explained as follows
Generate a random sample of size n = 150 from KL2PFD.
Calculate
Decide the value of
Compute ARL value and fix it as 350 for each control chart given that process is in-control state.
Now assume if the process parameter
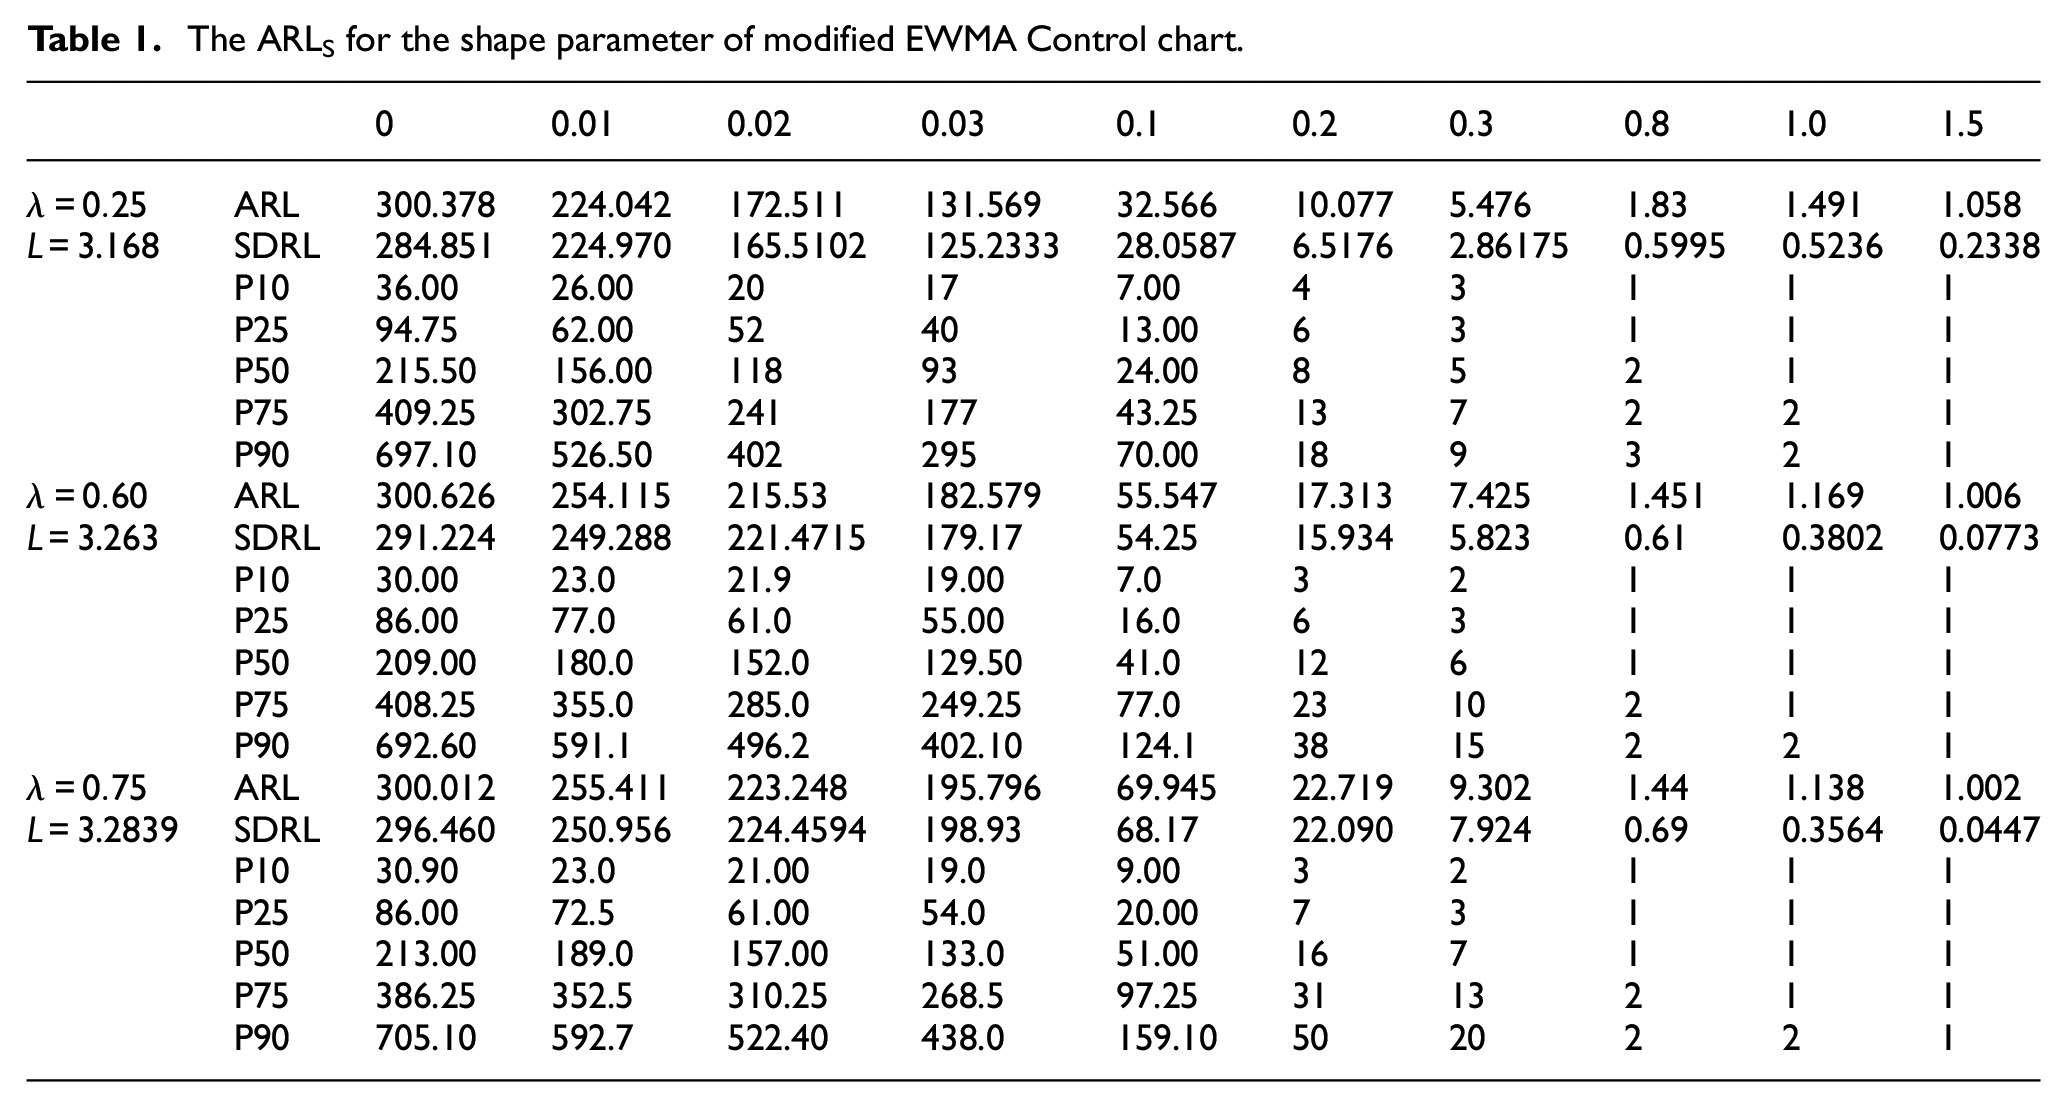
The ARLS for the shape parameter of modified EWMA Control chart.
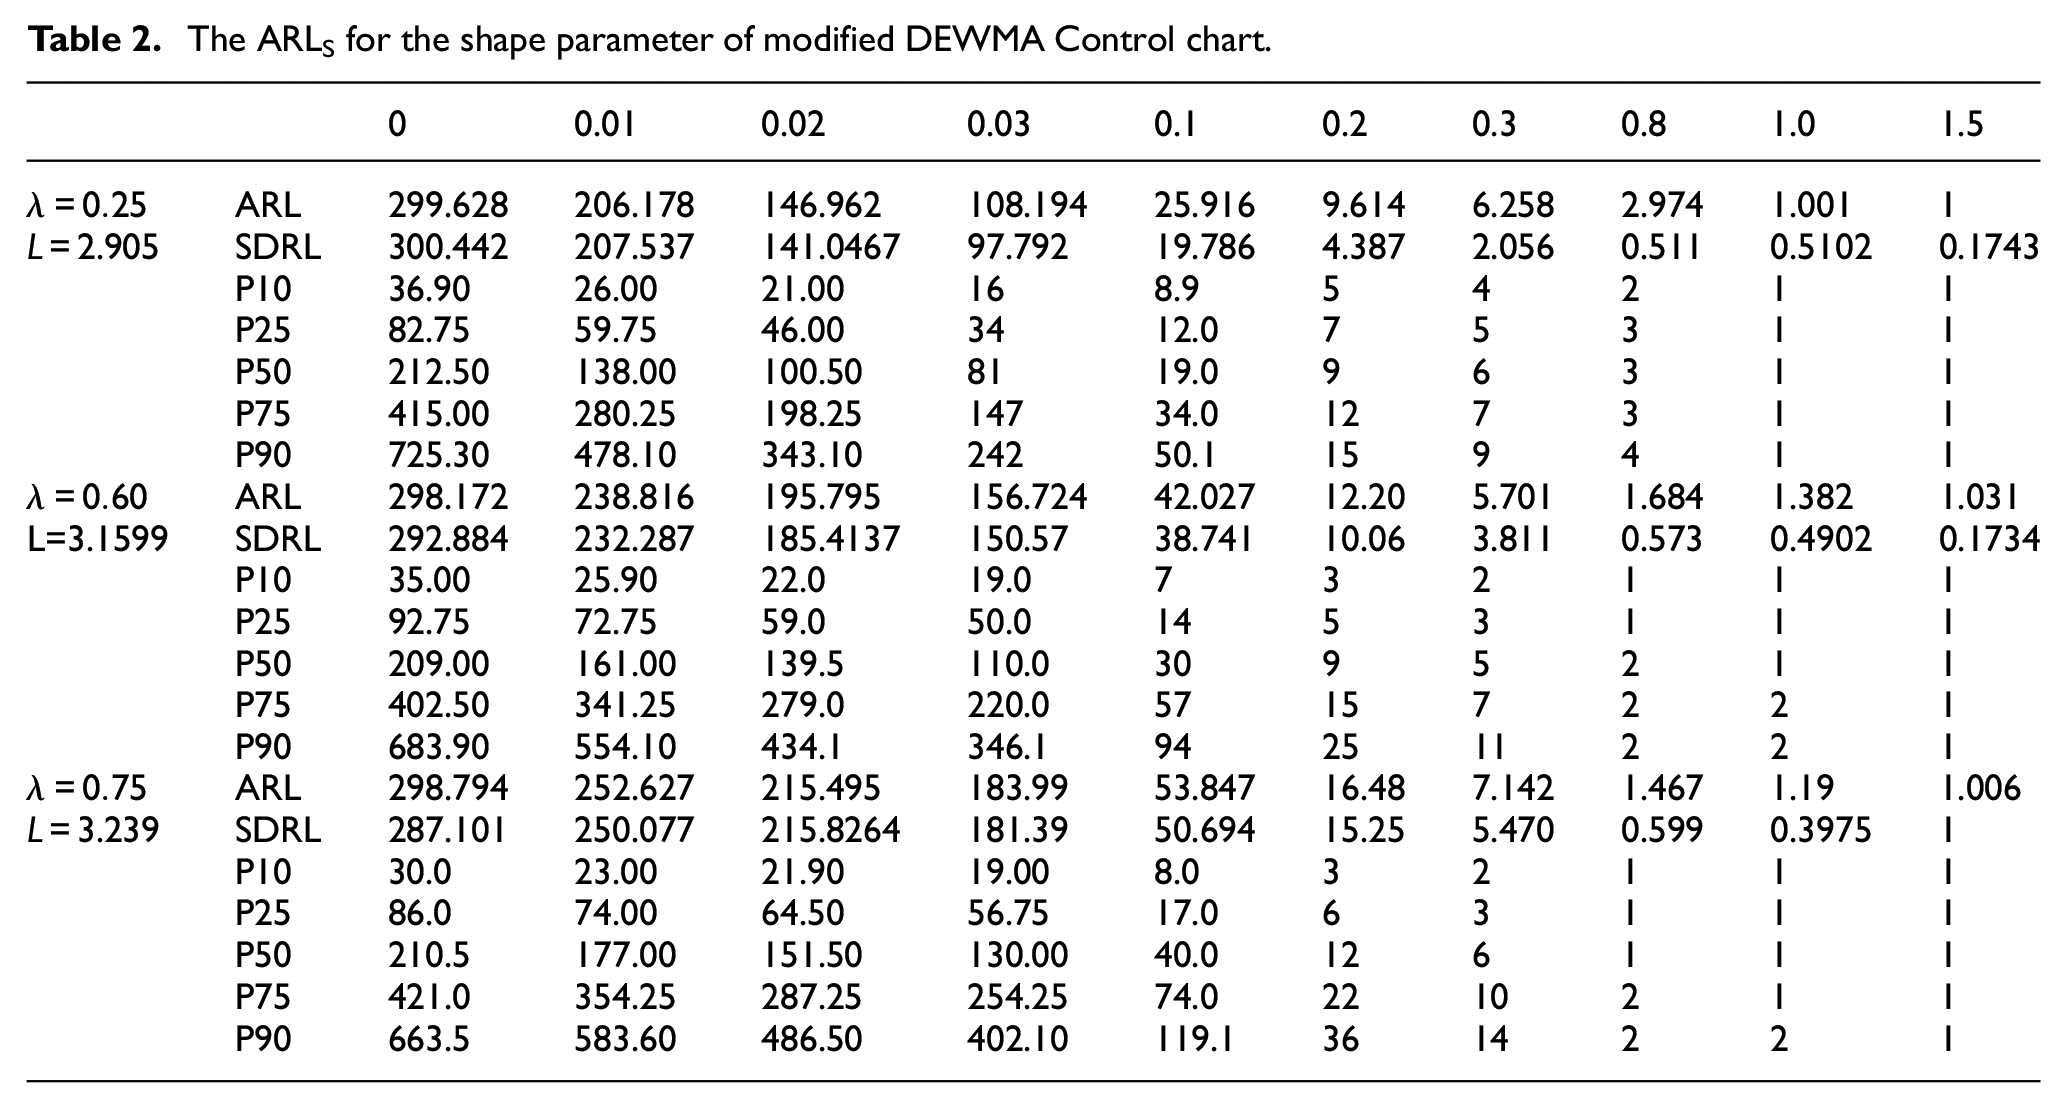
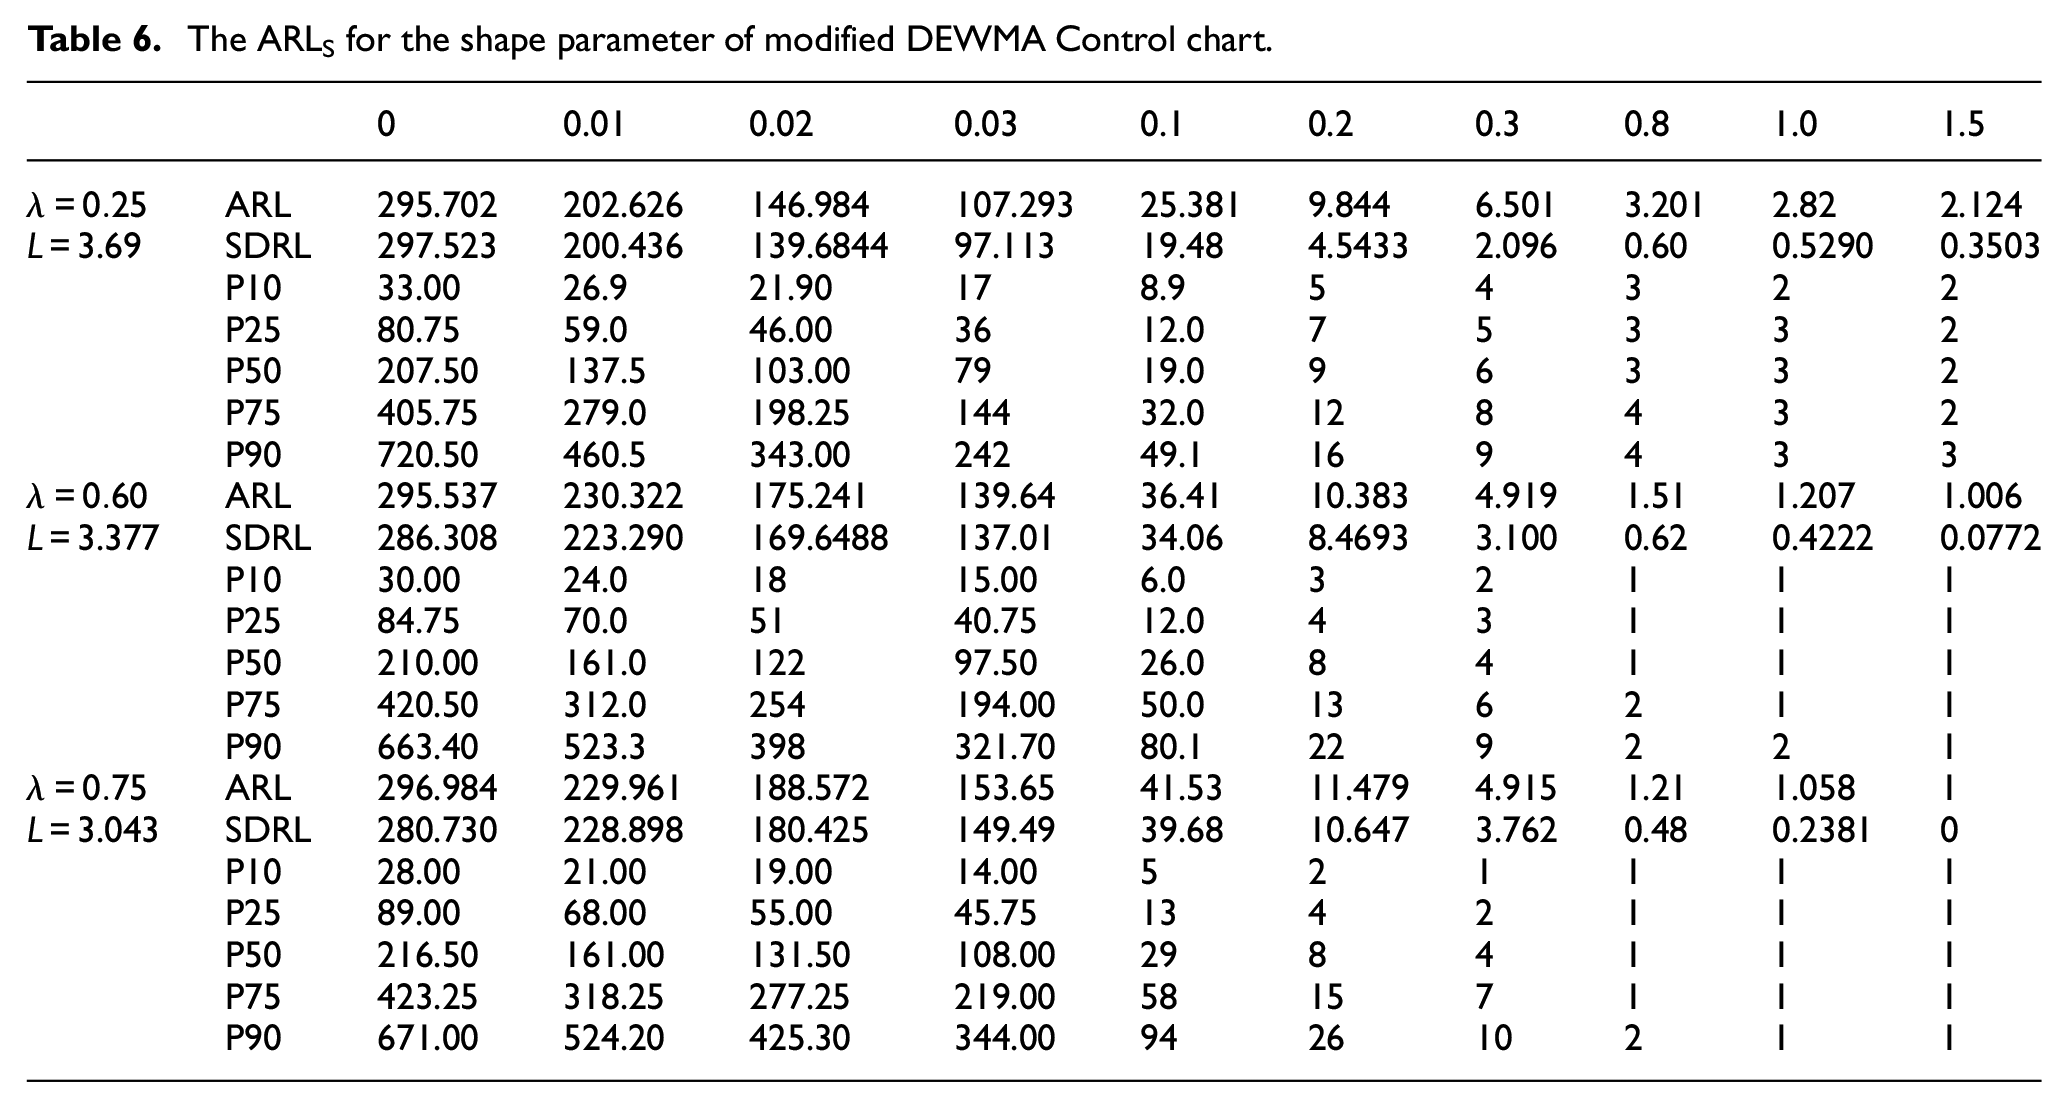
The ARLS for the shape parameter of modified DEWMA Control chart.
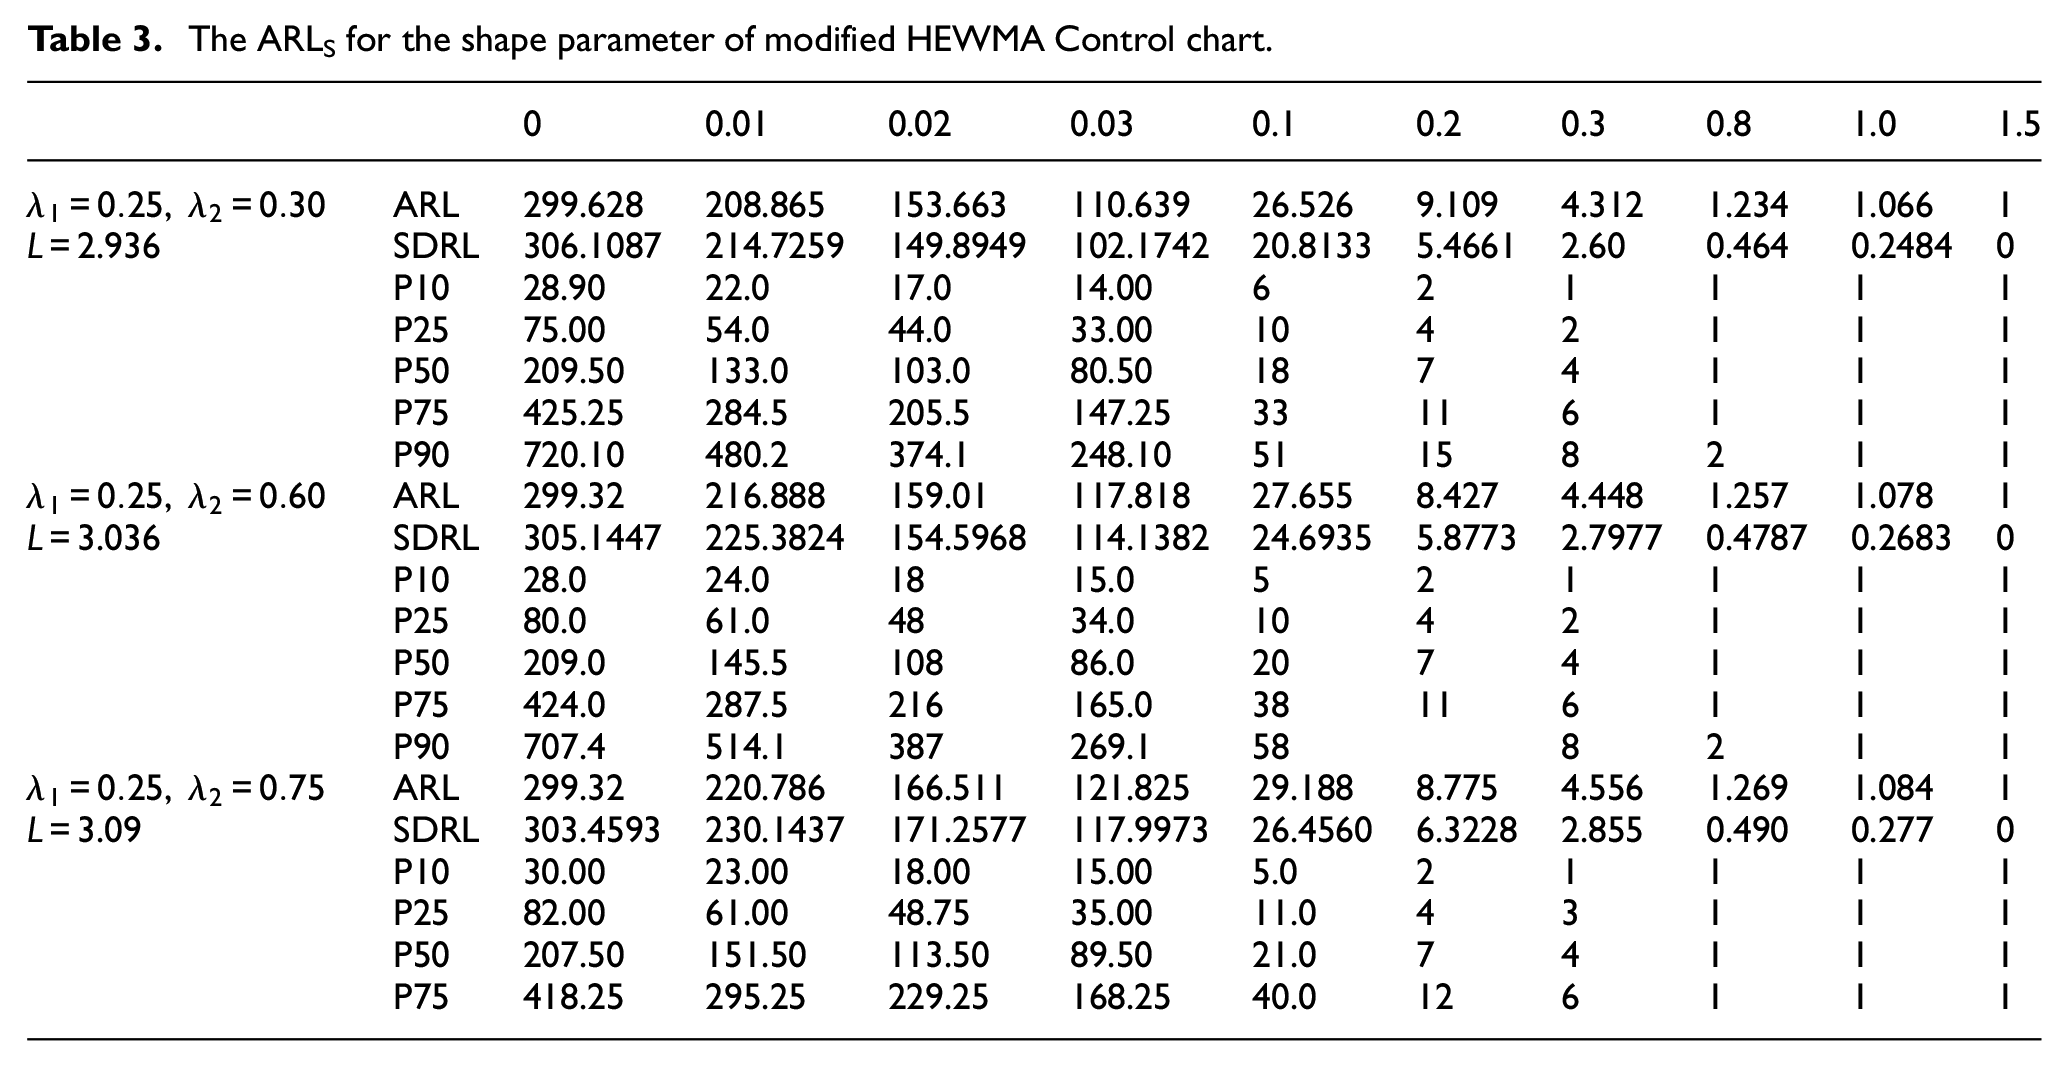
The ARLS for the shape parameter of modified HEWMA Control chart.
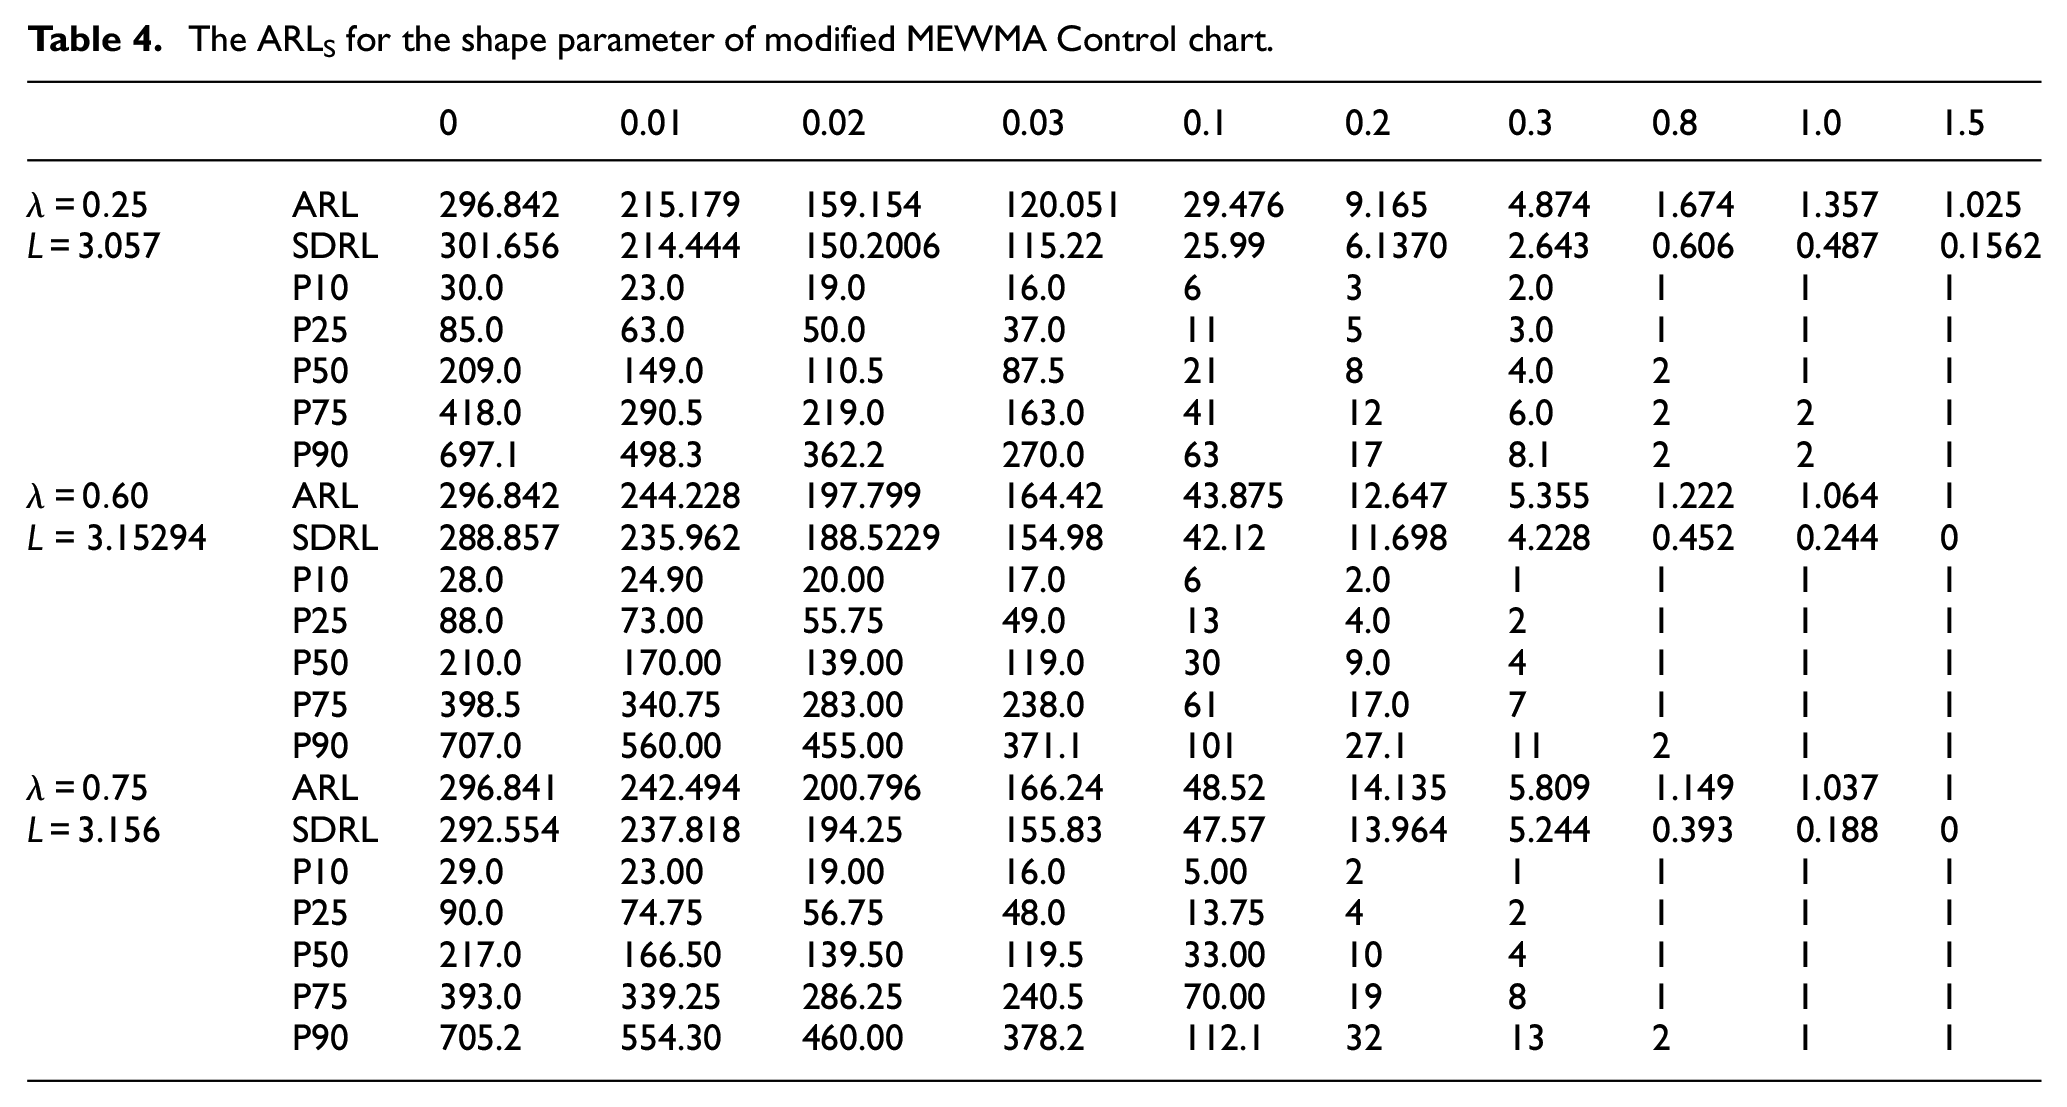
The ARLS for the shape parameter of modified MEWMA Control chart.
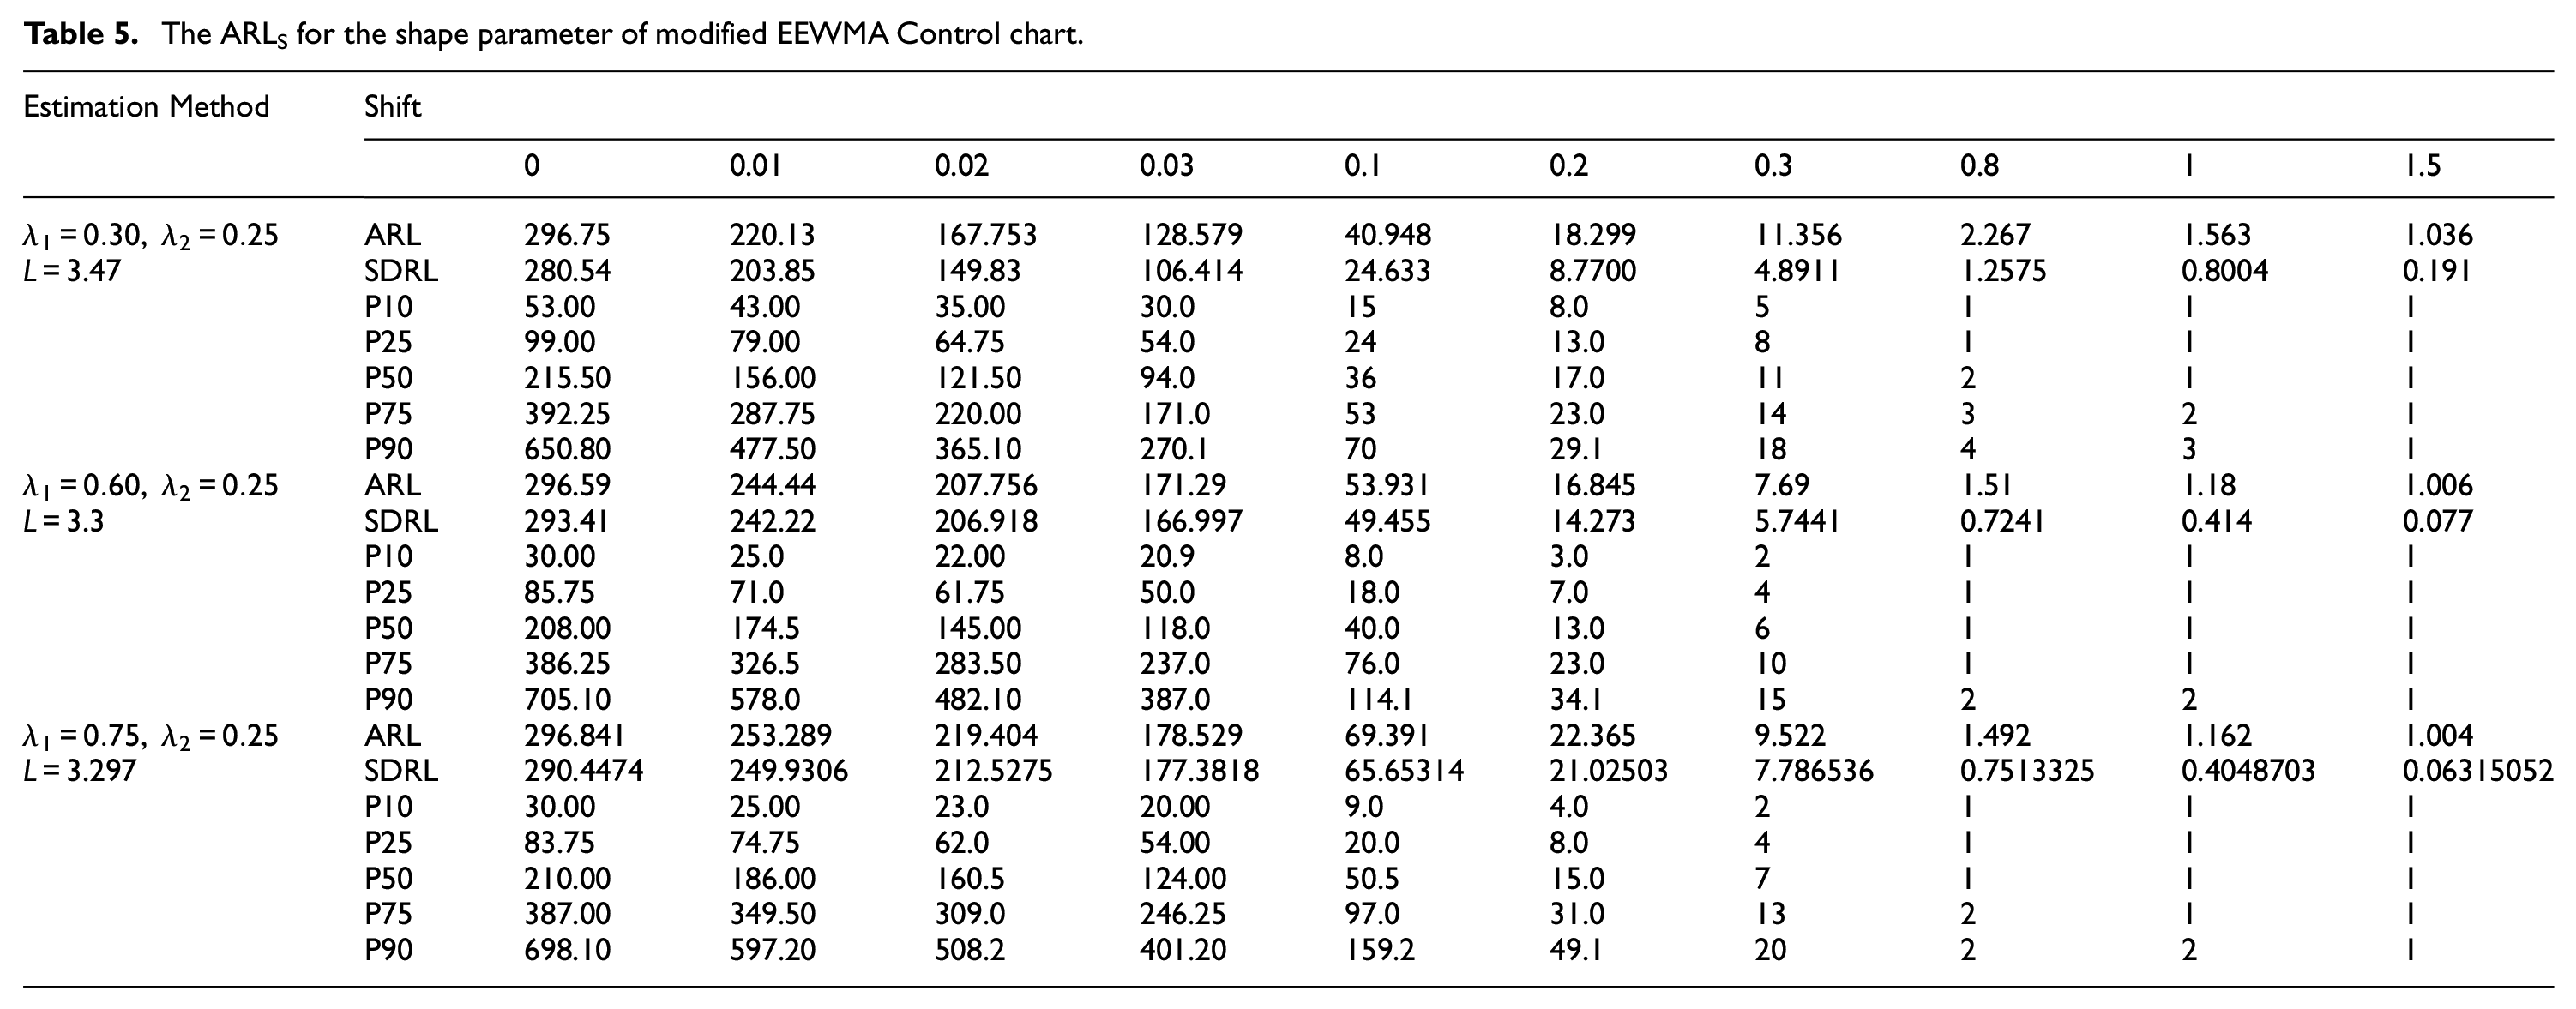
The ARLS for the shape parameter of modified EEWMA Control chart.
The ARLS for the shape parameter of modified DEWMA Control chart.
For non-parametric control charts, we used the following algorithm to generate Tables 7 to 12. The steps are explained are as follows
Repeat the Step 1–2 and find the quartiles
Find the control limits of the EWMA-TCC, DEWMA-TCC, HEWMA-TCC, MEWMA-TCC, EEWMA-TCC and DMEWMA-TCC based on shape parameter of KL2 PFD.
Repeat Step 4 and then take the shift in process parameter and Repeat Step 5.
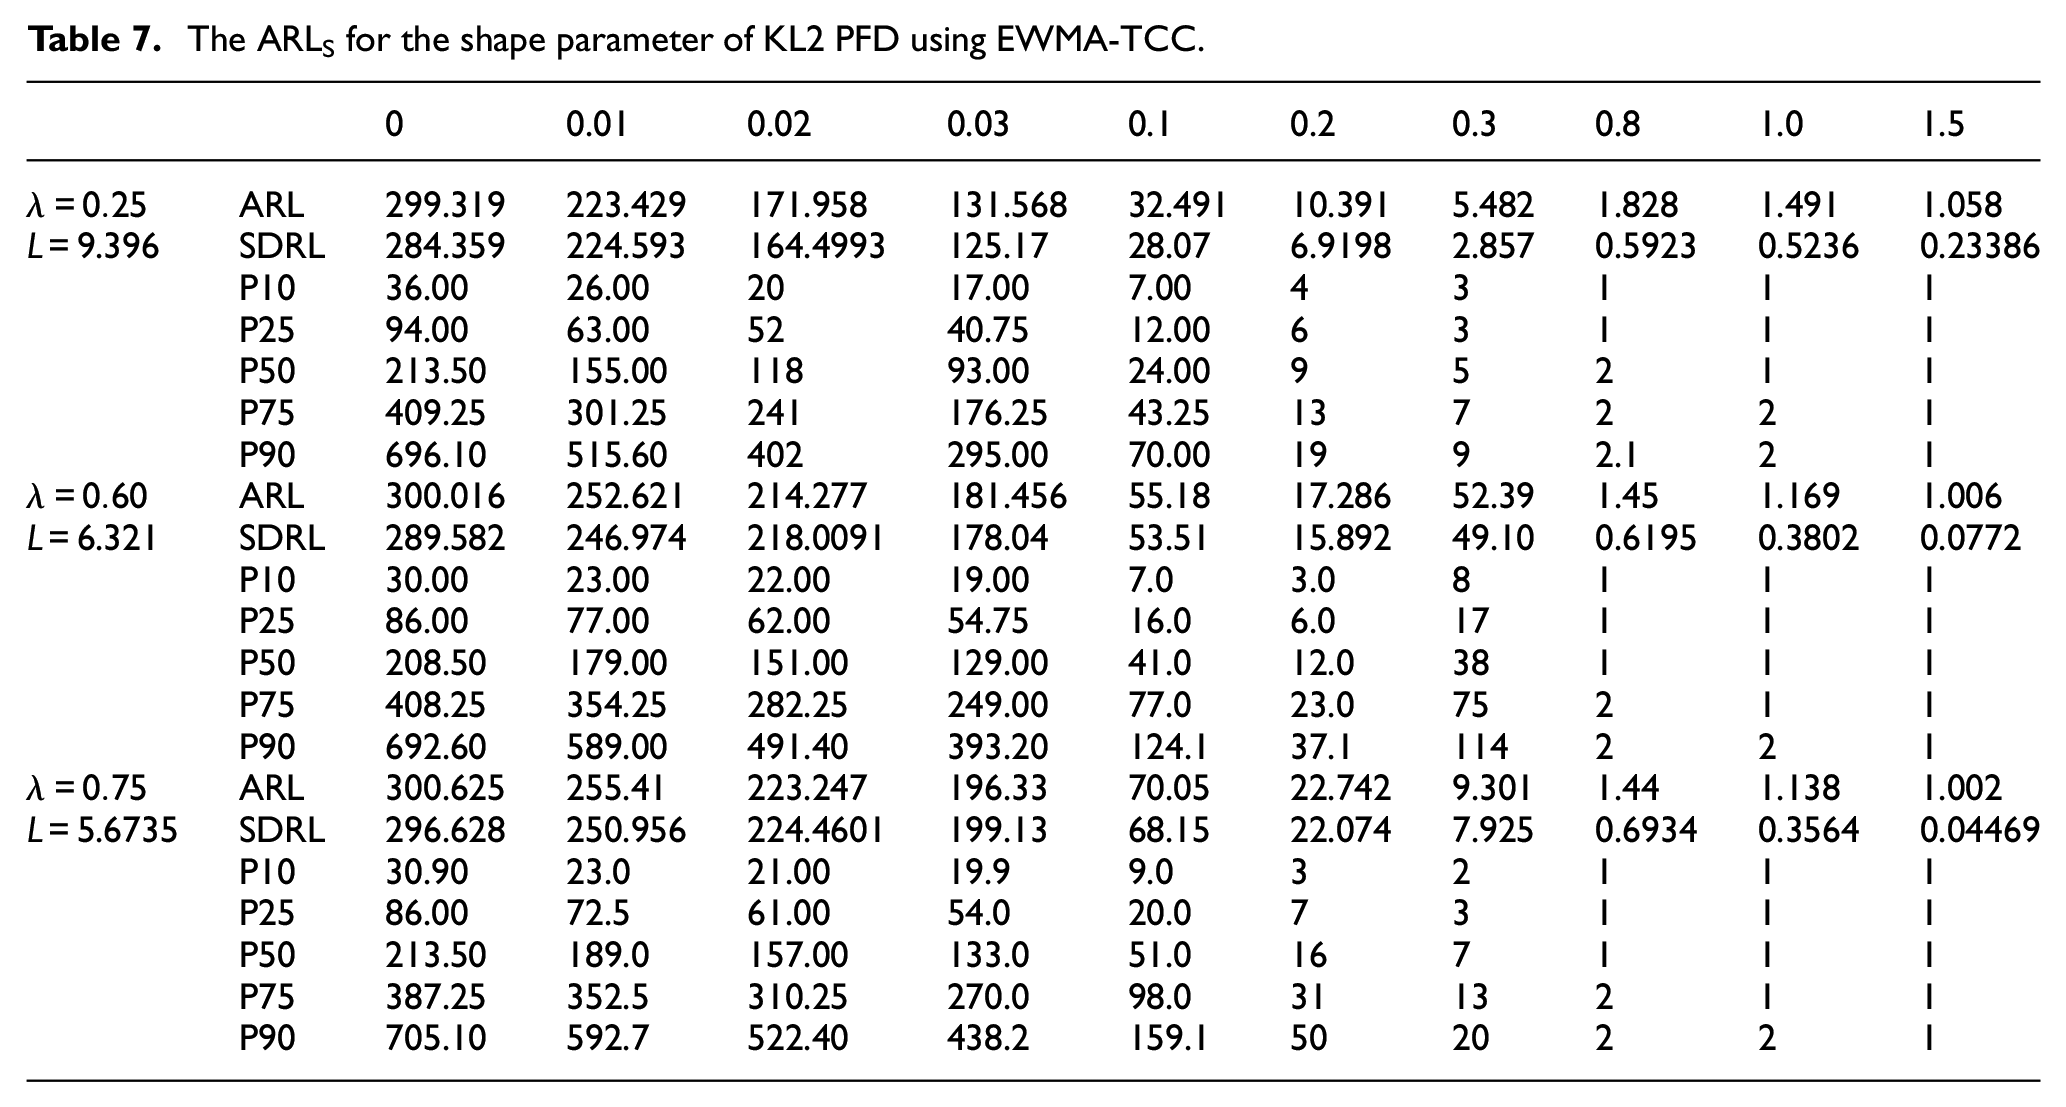
The ARLS for the shape parameter of KL2 PFD using EWMA-TCC.
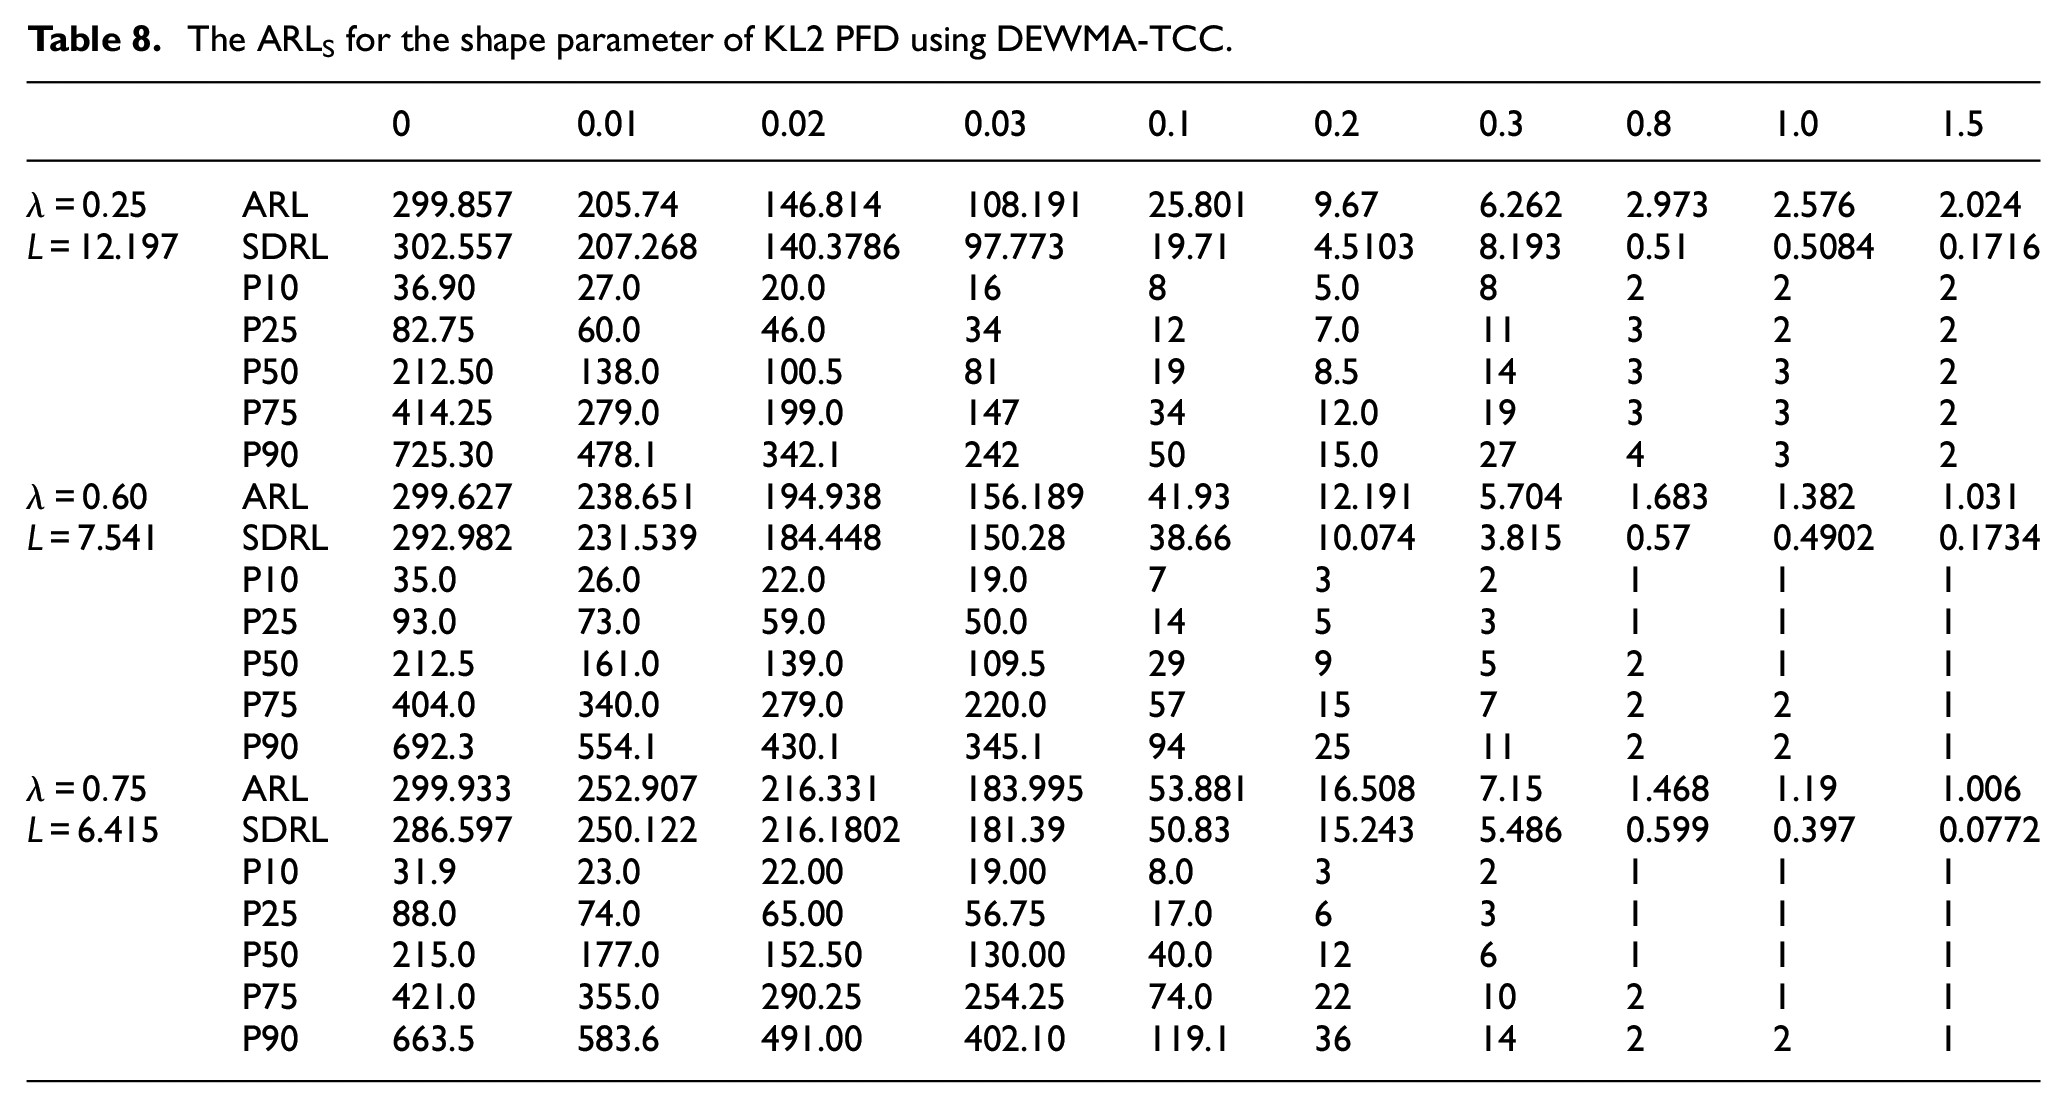
The ARLS for the shape parameter of KL2 PFD using DEWMA-TCC.
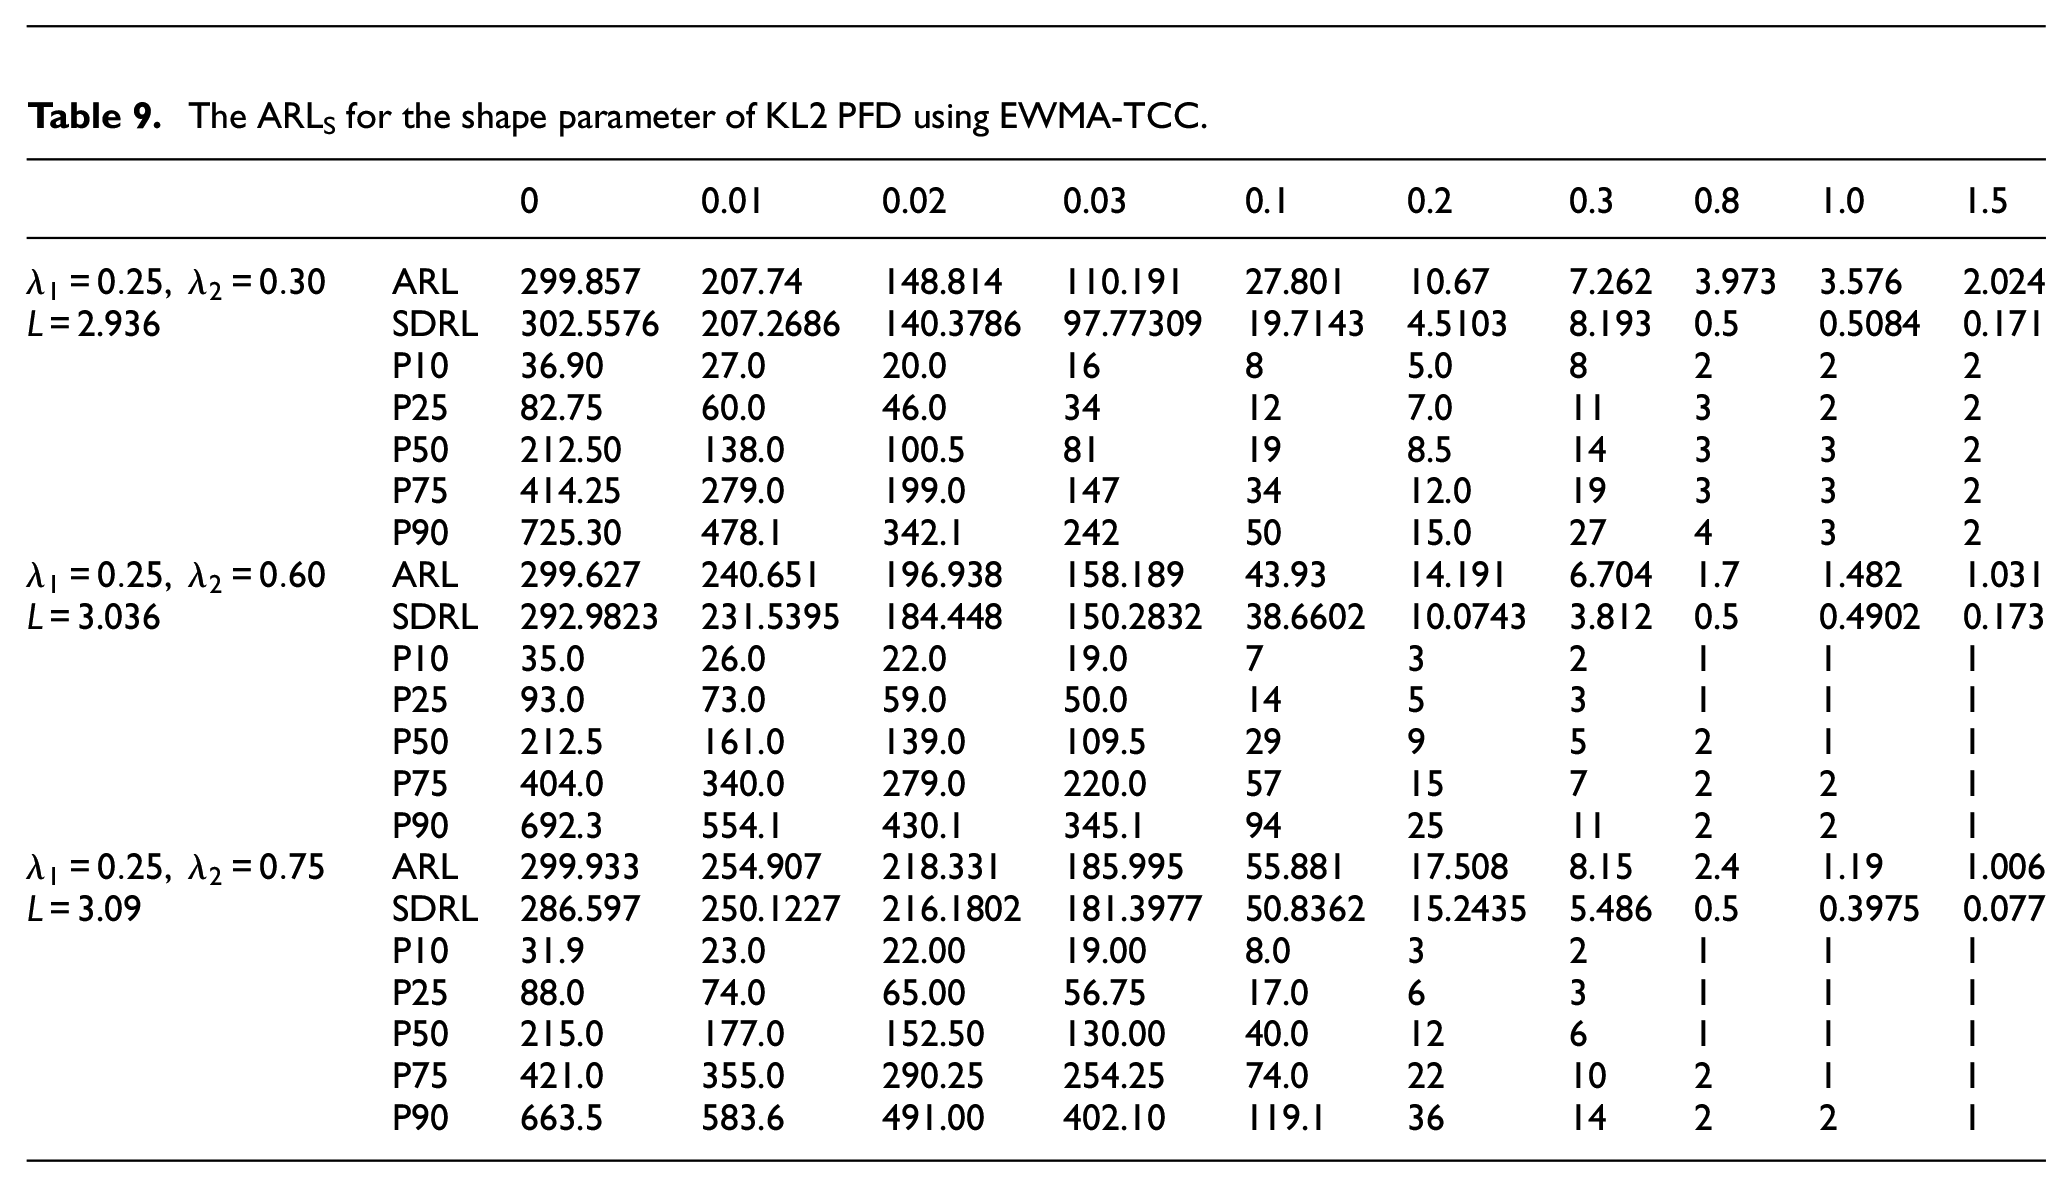
The ARLS for the shape parameter of KL2 PFD using EWMA-TCC.
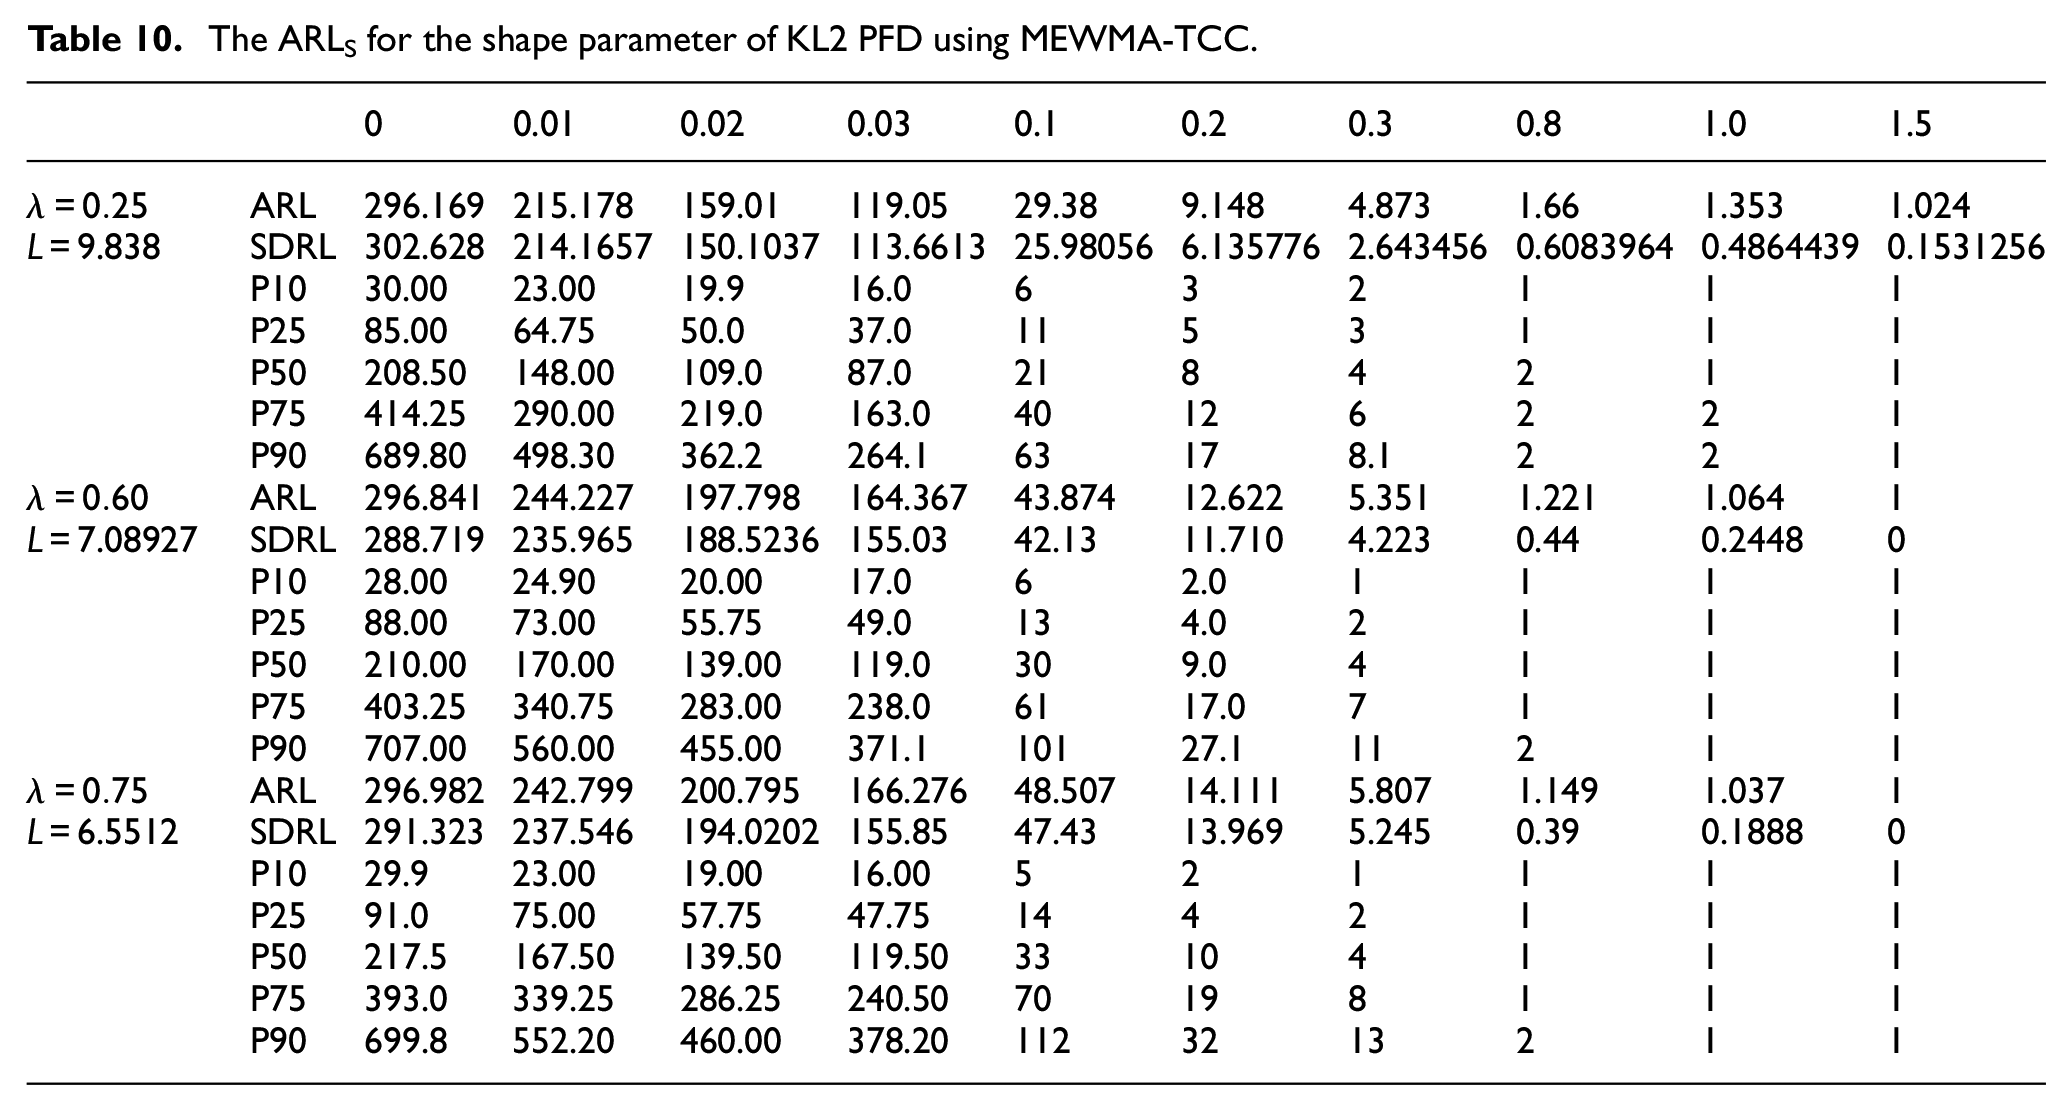
The ARLS for the shape parameter of KL2 PFD using MEWMA-TCC.
The ARLS for the shape parameter of KL2PFD using DMEWMA-TCC.
The ARLS for the shape parameter of KL2 PFD using EEWMA-TCC.
Performance evaluation and interpretations
In this section, the assessment from the previously mentioned control charts is made using the criterion of ARL. The evaluations have been done using the Algorithm mentioned in Section 5 using the shifts 0.01, 0.02, 0.03, 0.1, 0.2, 0.3, 0.8, 1.0 and 1.5.
Parametric control charts
We have constructed Tables 1 to 6 to evaluate the performance of some parametric control charts such as EWMA, MEWMA, HEWMA, DEWMA, EEWMA and DMEWMA.
From Table 1, we observe the ARL value as 224.042 at a shift value of 0.01 in the shape parameter. Also for different choices of
Table 2 shows the ARL values for DEWMA control chart for the shape parameter of KL2PFD. We see that DEWMA control chart for the shape parameter outperforms EWMA and provide early detection. For different choices of, we see an increase in ARL values such as at
Now if we see Table 3, we see that HEWMA gives ARL as 208.865 which is >DEWMA but <EWMA. It shows HEWMA can detect early as compared to EWMA DEWMA is better to use than HEWMA. Also, for different choices of
Now if we see Table 4, which is based on MEWMA, we see that MEWMA provides the ARL value of 215 at a shift of 0.01 which is <EWMA but >HEWMA and DEWMA. We also see the same behavior of increasing ARL for MEWMA by the increase in
Table 5 discusses the performance of EEWMA control chart; the ARL at shift of 0.01 is 220.136 which are higher than HEWMA, MEWMA and DEWMA but <EWMA. Also, we see that when
Mix-Type Control Charts
The Non- parametric control charts are also proposed in section 4 that is, EWMA-TCC, MEWMA-TCC, HEWMA-TCC, DEWMA-TCC, EEWMA-TCC and DMEWMA –TCC. Tables 7 to 12 discusses the ARL values of these proposed control charts for the shape parameter of KL2PFD. From Table 7, we see that ARL value for the shape parameter at shift of 0.01 is 223.429. For the different choices of
From Table 8 that shows the performance of DEWMA-TCC, we see that at the shift of 0.01 from the true shape parameter is 205.74 which shows its efficiency over EWMA-TCC. From Table 9, it is clear that HEWMA-TCC is providing the ARL of 207.74 which is a little higher than DEWMA-TC.
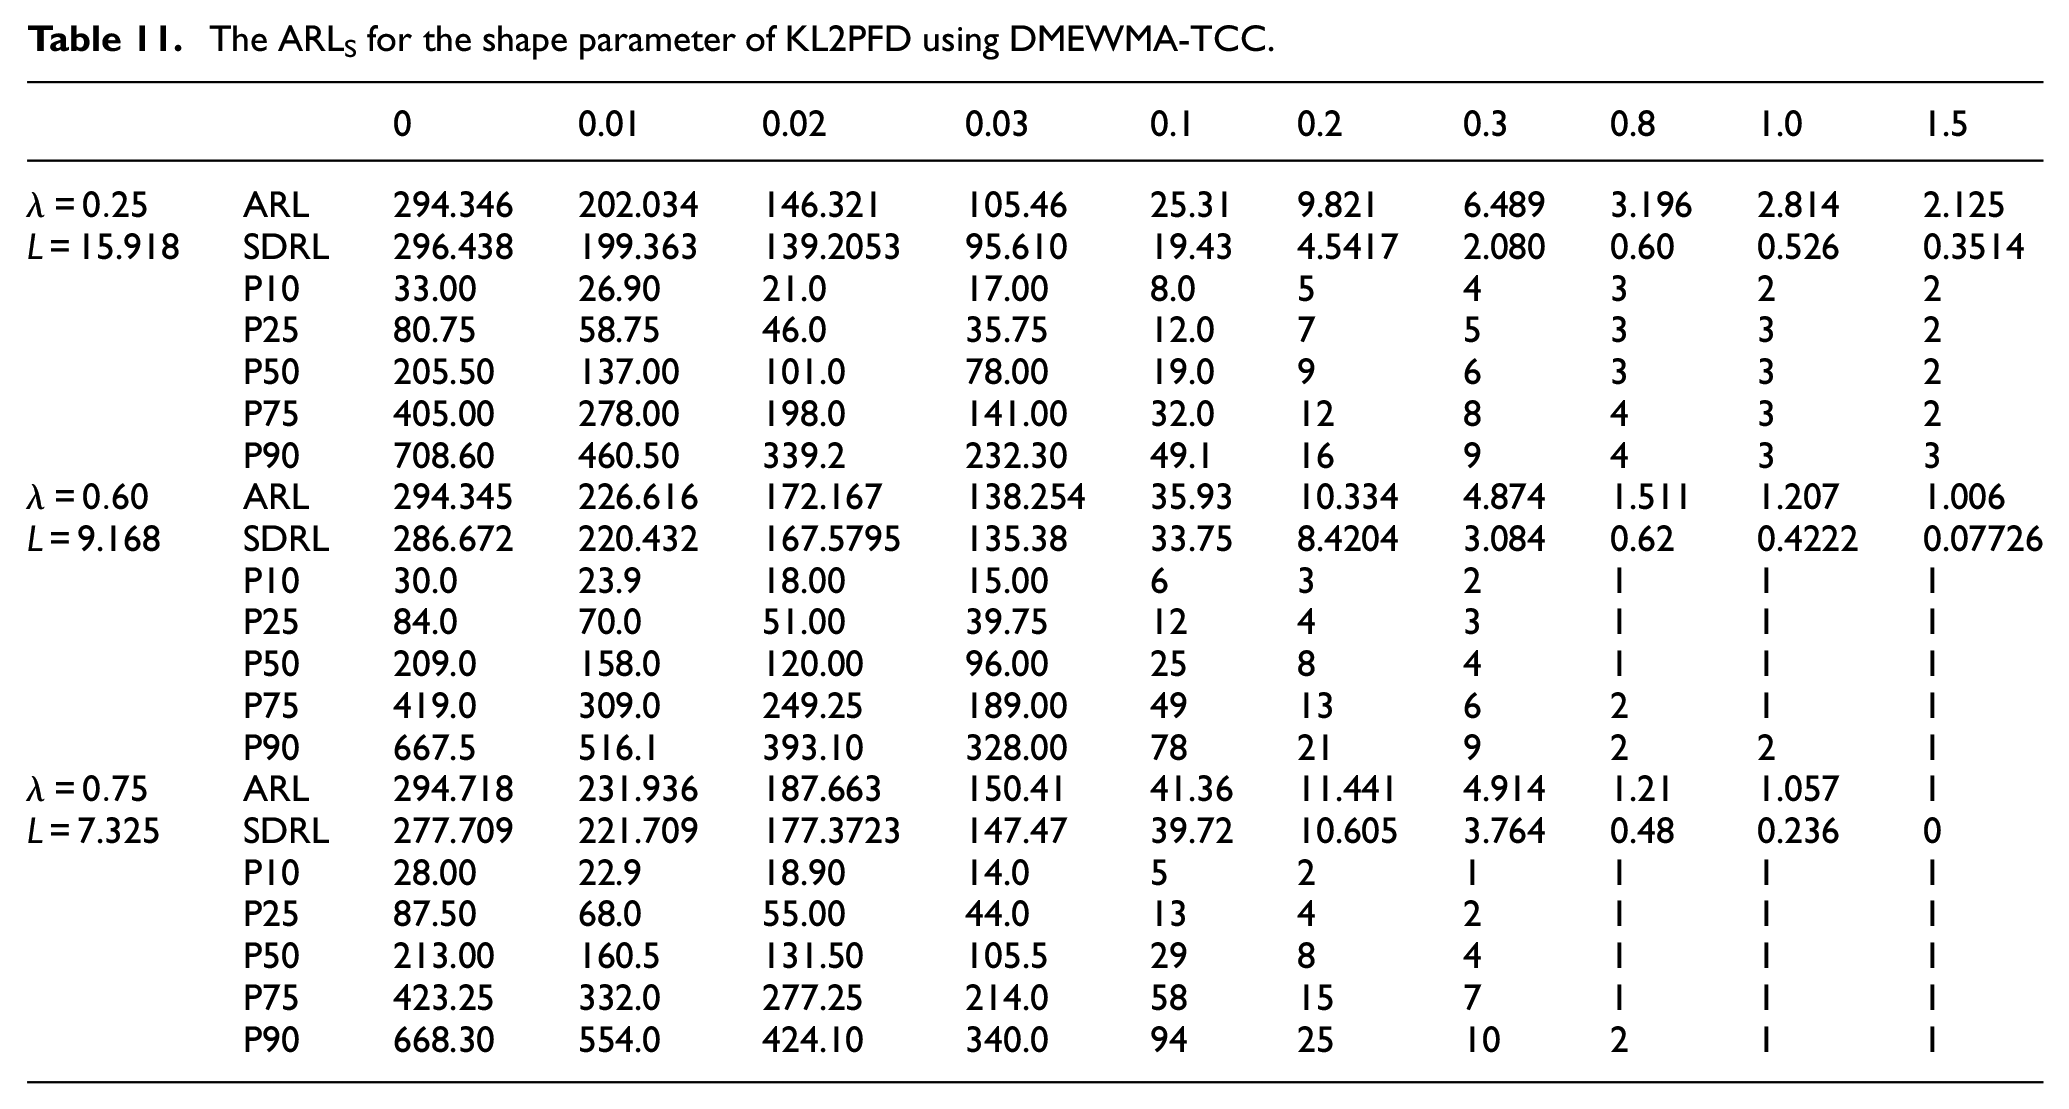
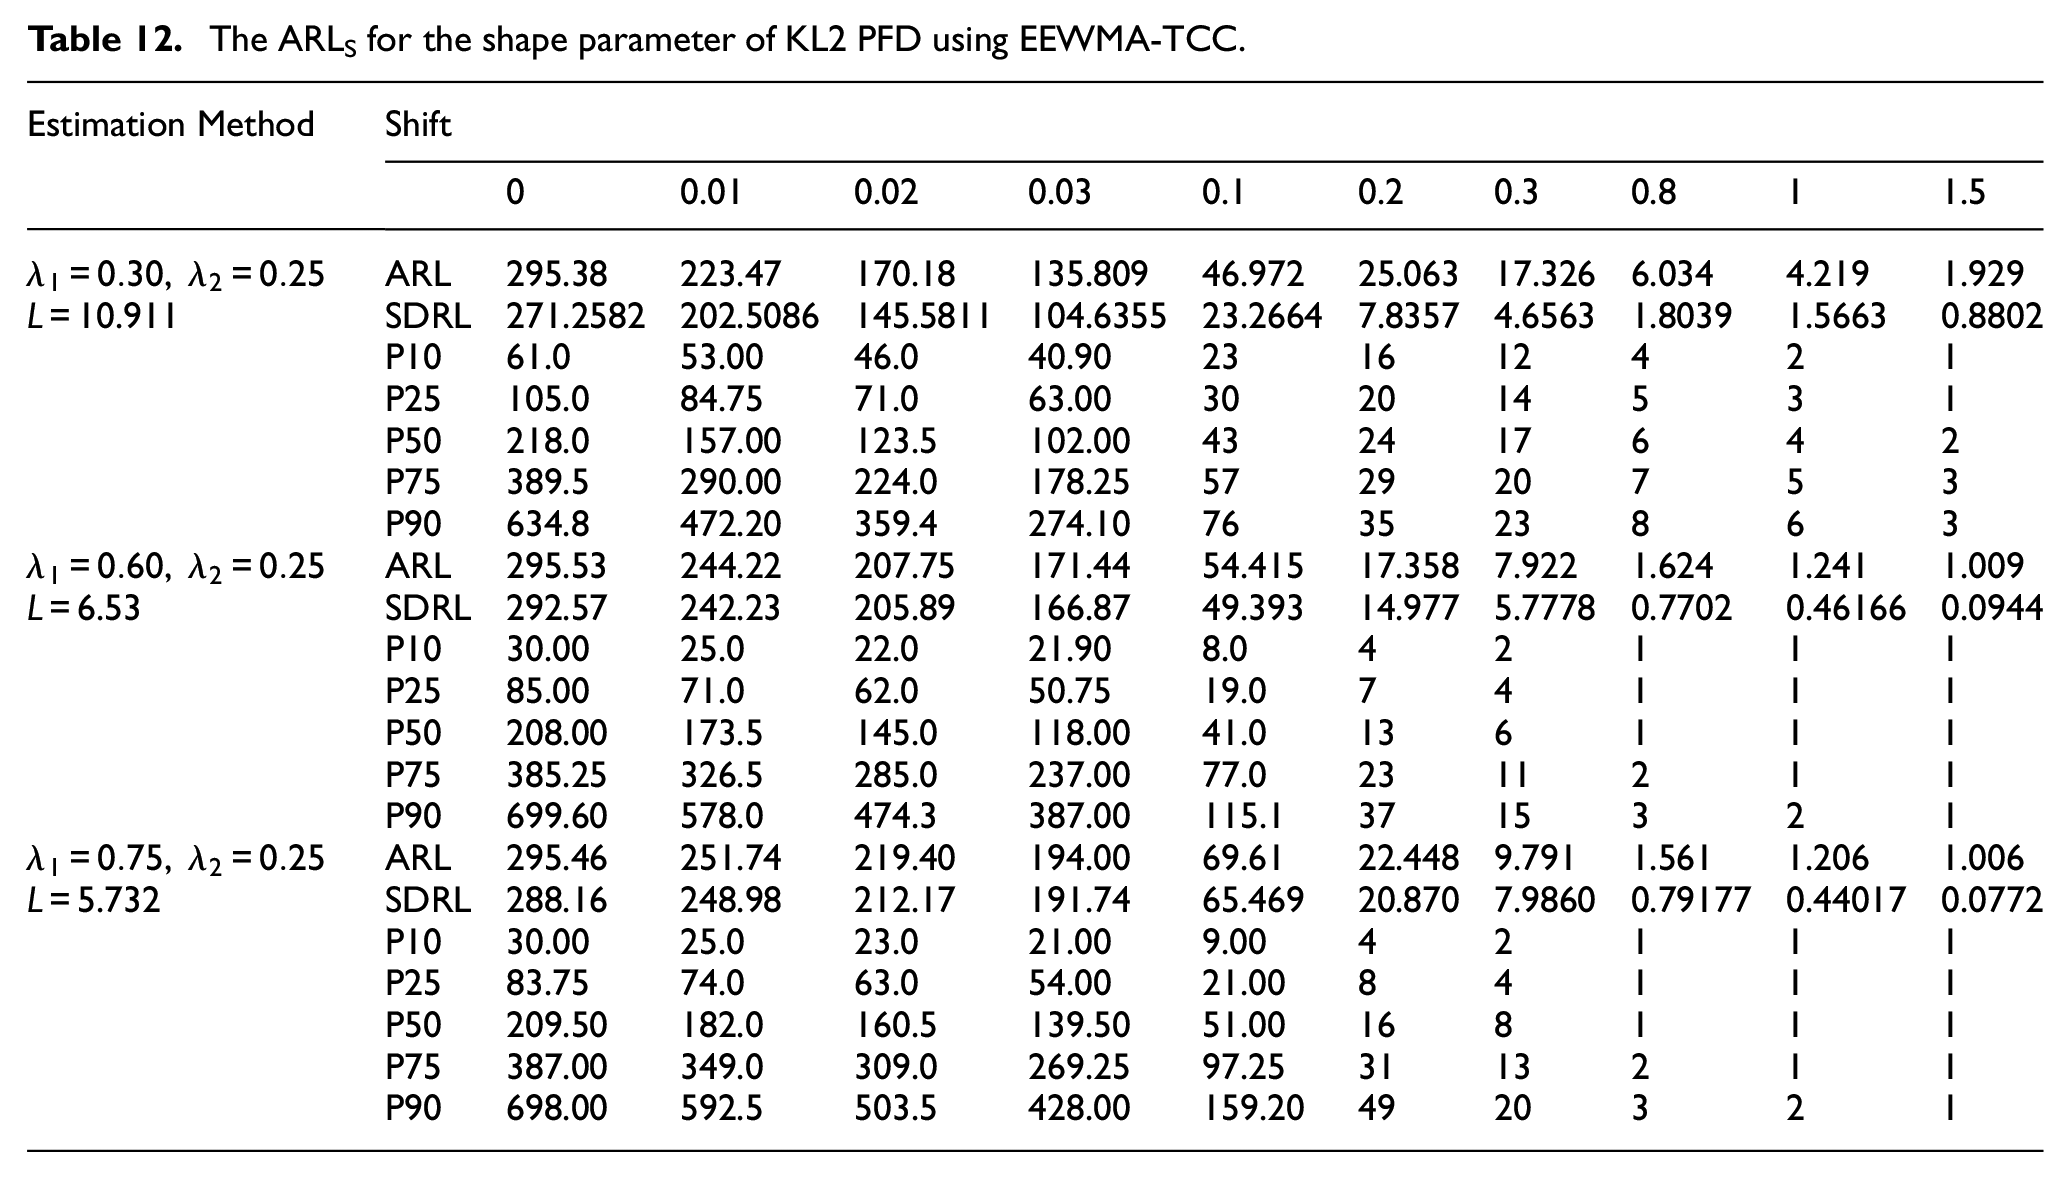
Tables 10 and 11 provide the performance chart of MEWMA–TCC and EEWMA-TCC. We see that for a shift of 0.01 in the true value of the shape parameter of KL2PFD, we get the ARL as 215.178 for MEWMA-TCC and 223.473. We see that both MEWMA-TCC and EEWMA-TCC gives large ARL values when
Parametric control charts versus Mix-Type Control Charts
From all the above detailed discussion about the performance of all proposed control charts, we see that the performance of the parametric and mix- type control charts vary. The use of mix-type control chart is suggested for EWMA. DEWMA, HEWMA and EEWMA control charts because mix-type control chart provides early detection in this case. Overall DMEWMA proprietarily detects for the monitoring of the shape of any process having KL2PFD.
Simulation study
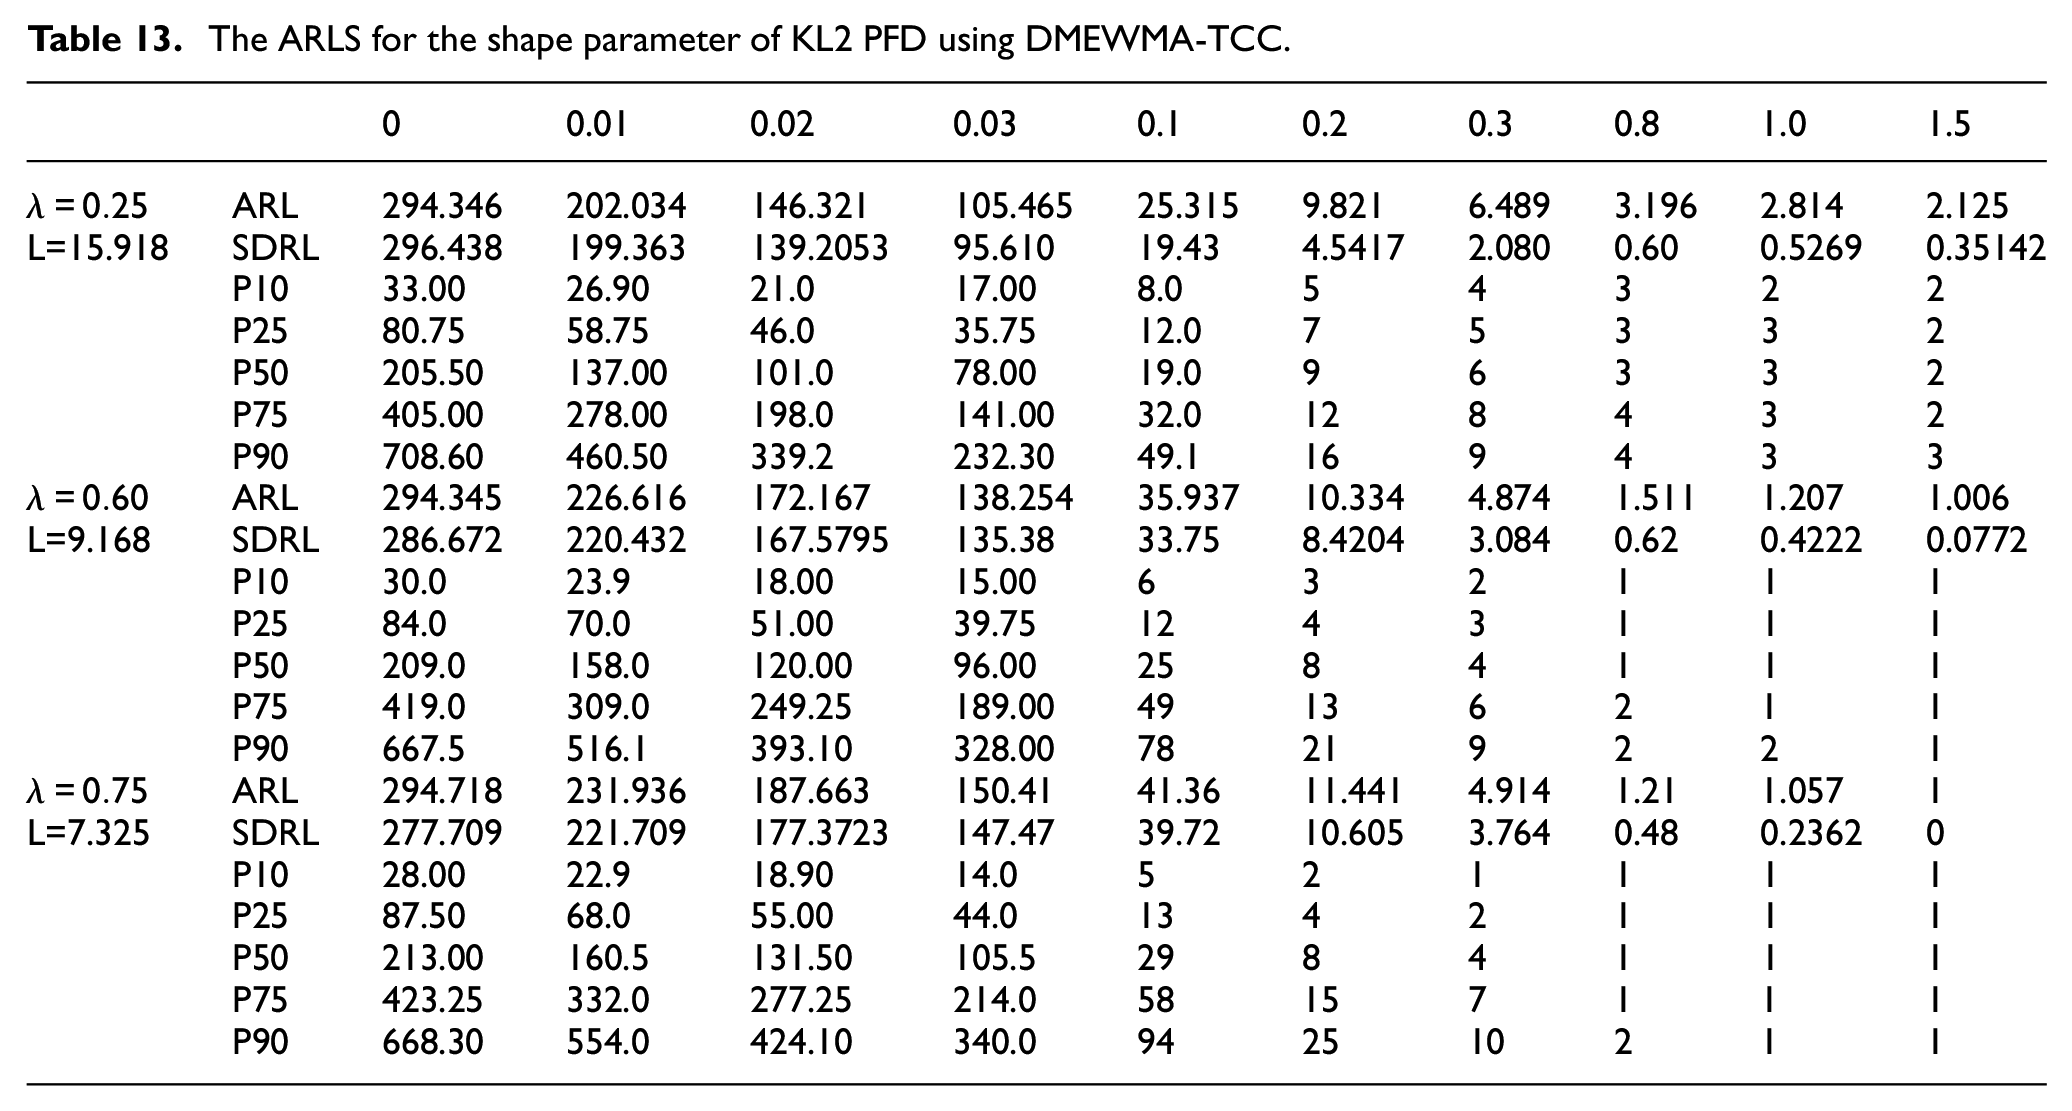
From Section 6, we have observed that DMEWMA control chart for and DMEWMA Tukey control chart helps in early detection of any shift for Parametric control charts and Mix-Type control chart. We have further tried to evaluate the performance of each control chart by generating 50 observations from KL2PFD out of which 25 observations are generated using the shift of 0.40. The results are presented in Tables 13 and 14.
The ARLS for the shape parameter of KL2 PFD using DMEWMA-TCC.
Simulated data.
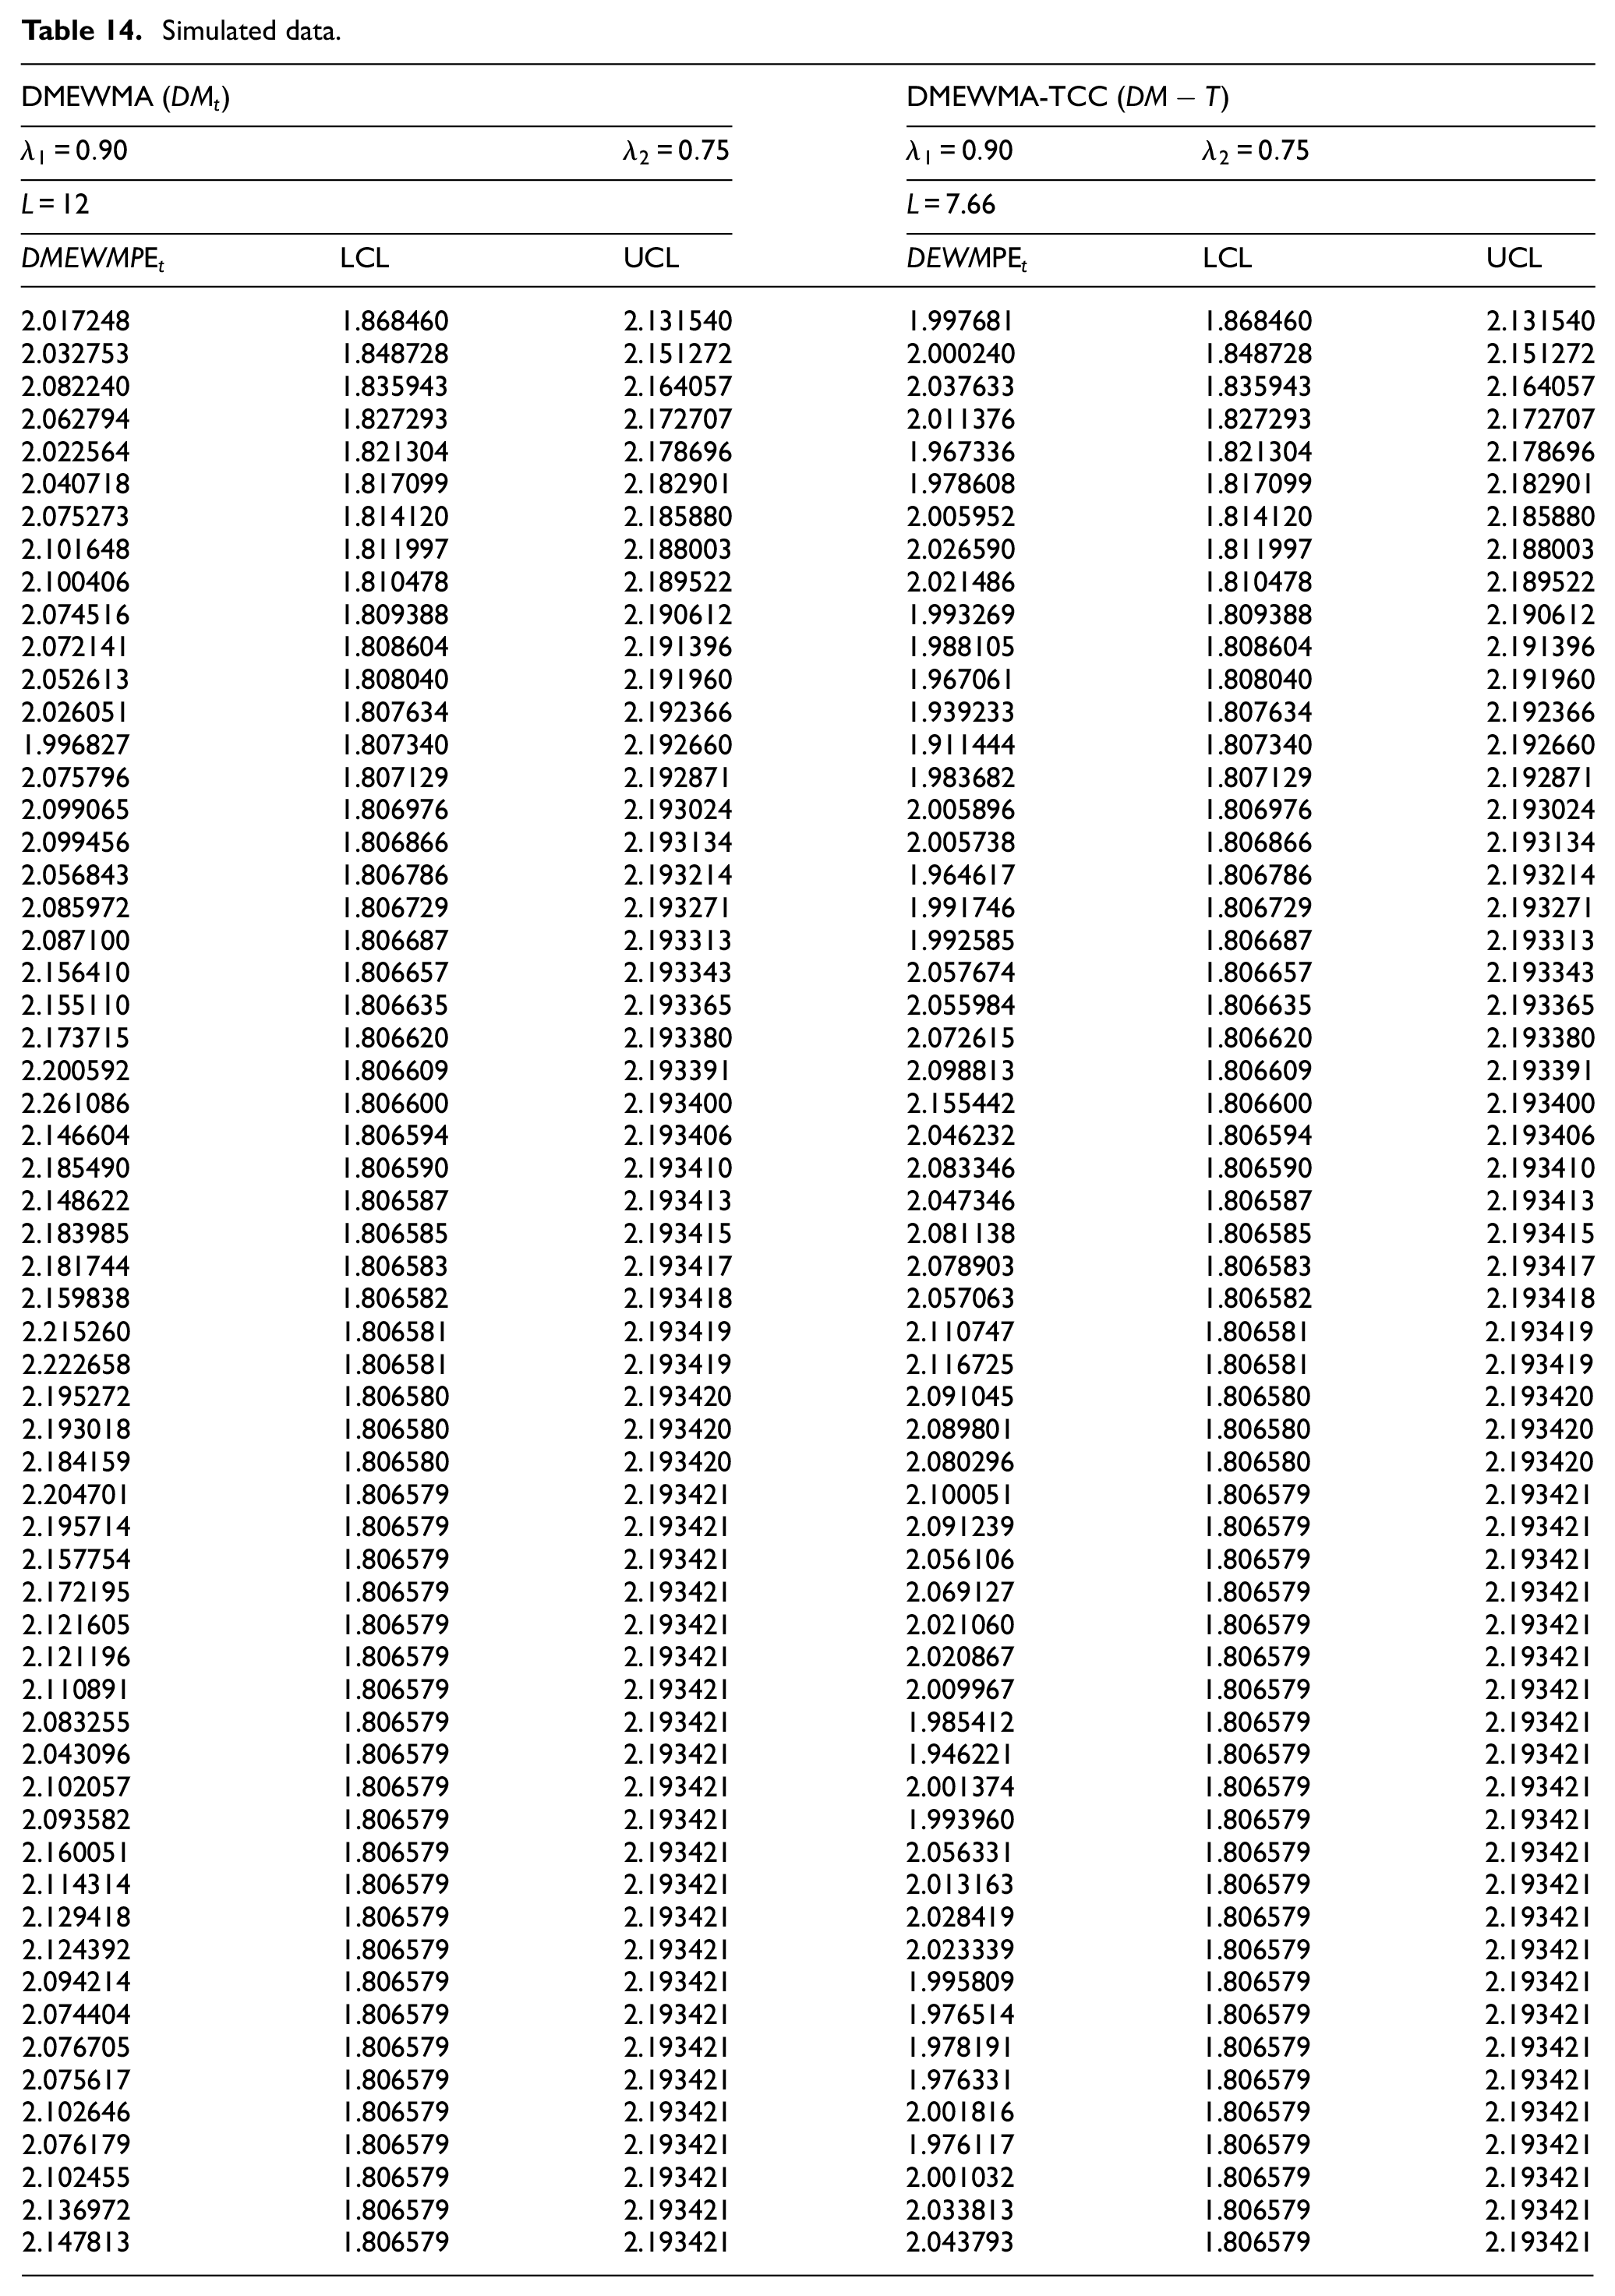
From Table 14, Figures 1 and 2, we see that DMEWMA control chart helps in the early detection of any shifted process
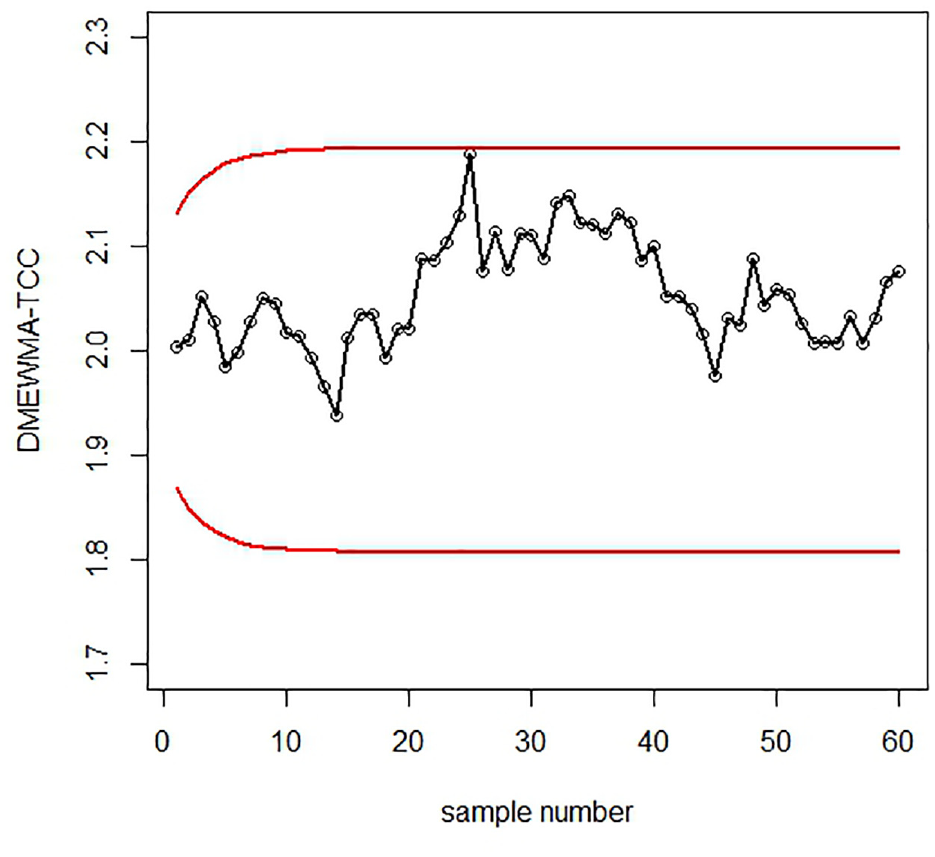
Graph of simulated data of the proposed DMEWMA-TCC control chart under PE.
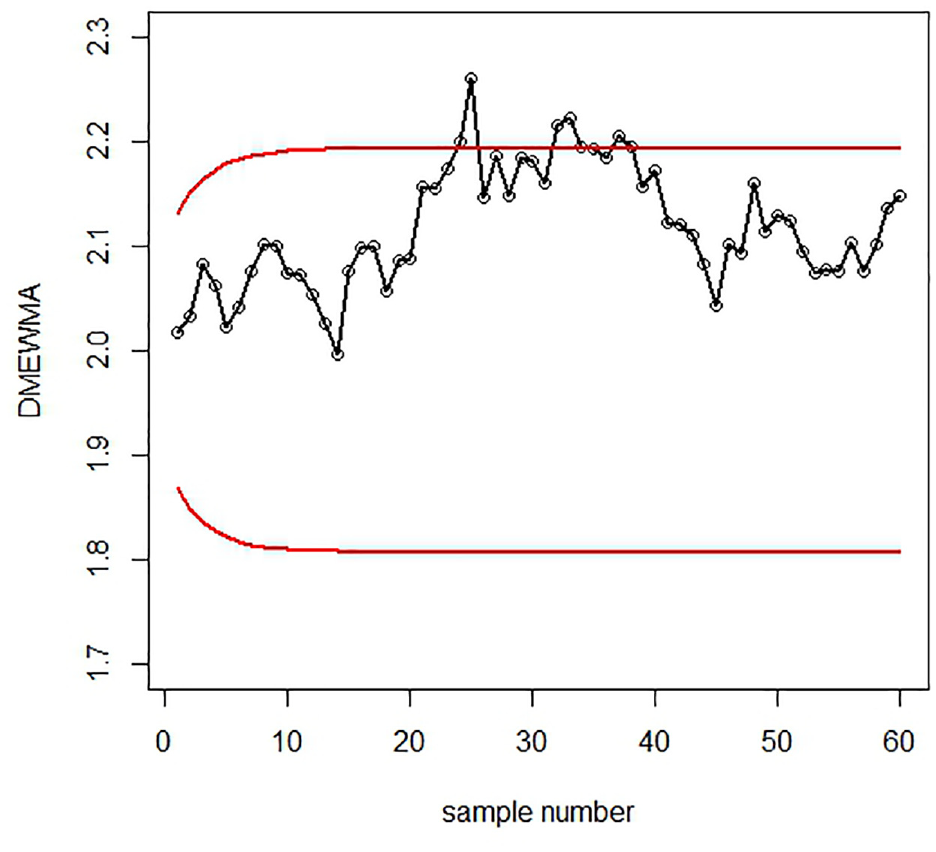
Graph of simulated data of the proposed DMEWMA control chart under PE.
Real life application
Filling height of soft drink beverage bottles
We have used the data of filling height of soft drink beverage bottles given by Montgomery
37
. The data set has 15 samples each of size
We plotted for both DMEWMA-TCC and DMEWMA control charts under PE, as shown in Figures 3 and 4. We have constructed DMEWMA and DMEWMA-TCC control charts under PE in Figures 3 and 4. We see that DMEWMA detects the process shift early compared to DMEWMA-TCC, which shows that DMEWMA is better to be used in filling height data of soft drinks when the distribution of the underlying process is KL2PFD.
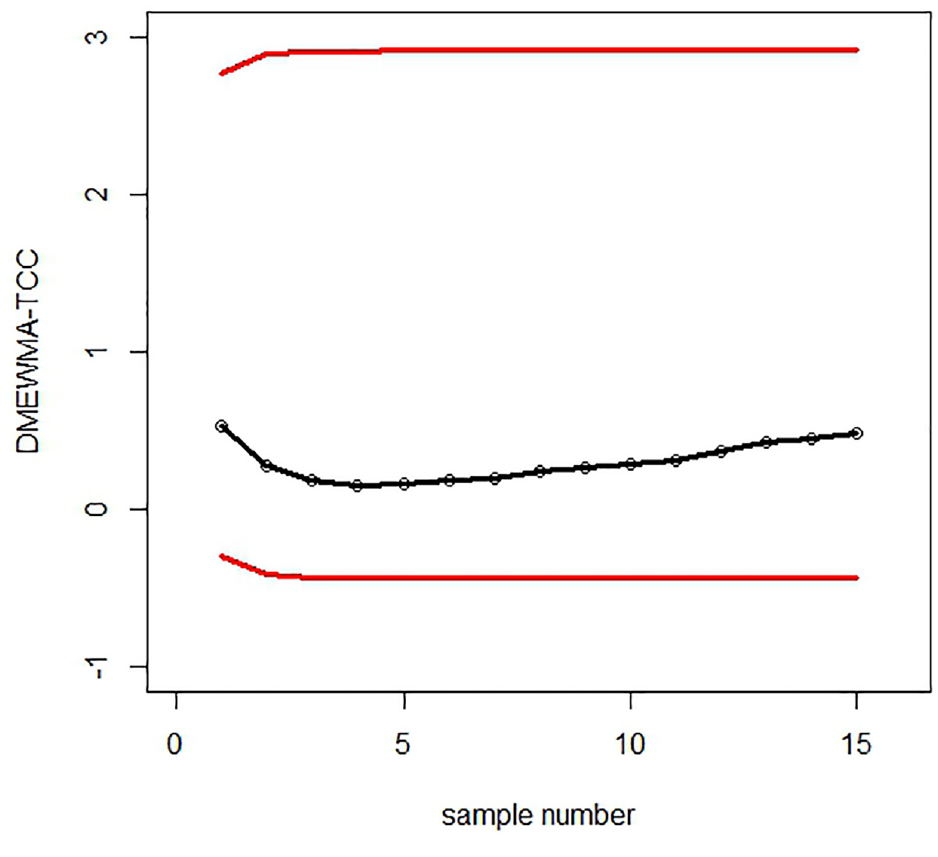
Graph of real data of the DMEWMA-TCC control chart under PE.
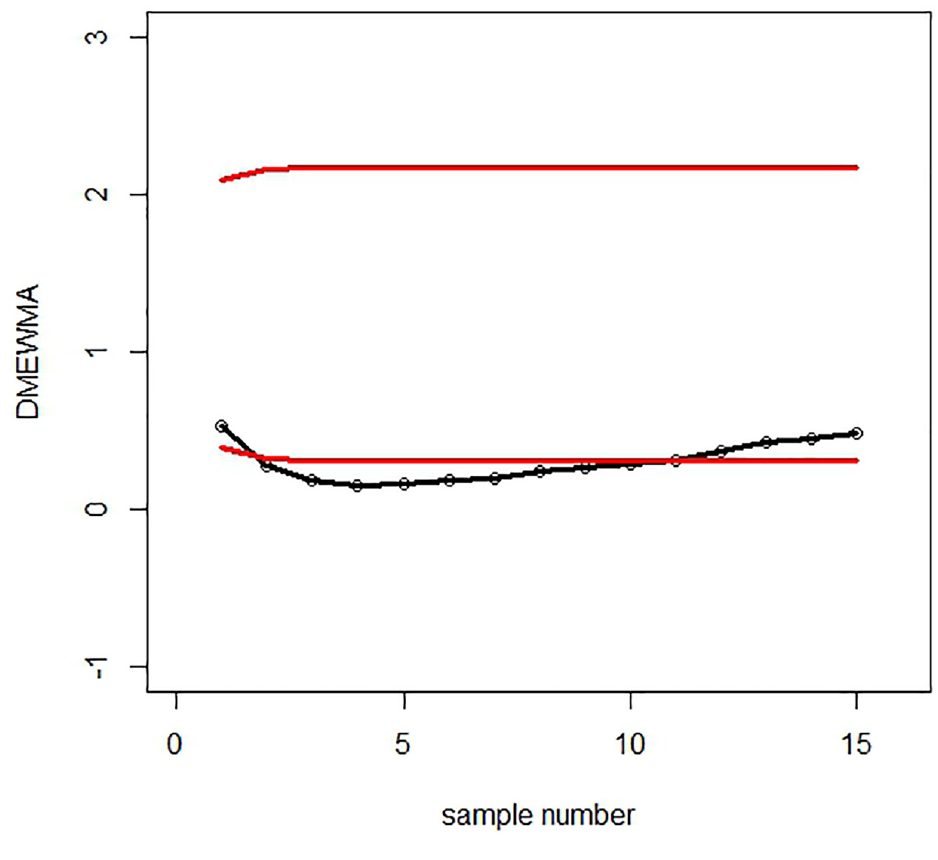
Graph of real data of the DMEWMA control chart under PE.
Hard-bake process in the semiconductor manufacturing process
The second data set is also taken from Montgomery.
37
The data consists of a hard-bake process in conjunction with photolithography in the semiconductor manufacturing process. Our aim of using this data is to provide a better process monitoring for the flow width of the resist. Thirty samples each of size 5 wafers are taken with a time interval of 1 h and flow width measurements are in microns. We used DMEWMA control chart to monitor the shape of the process following KL2PFD. From Figures 5 and 6, we see that at
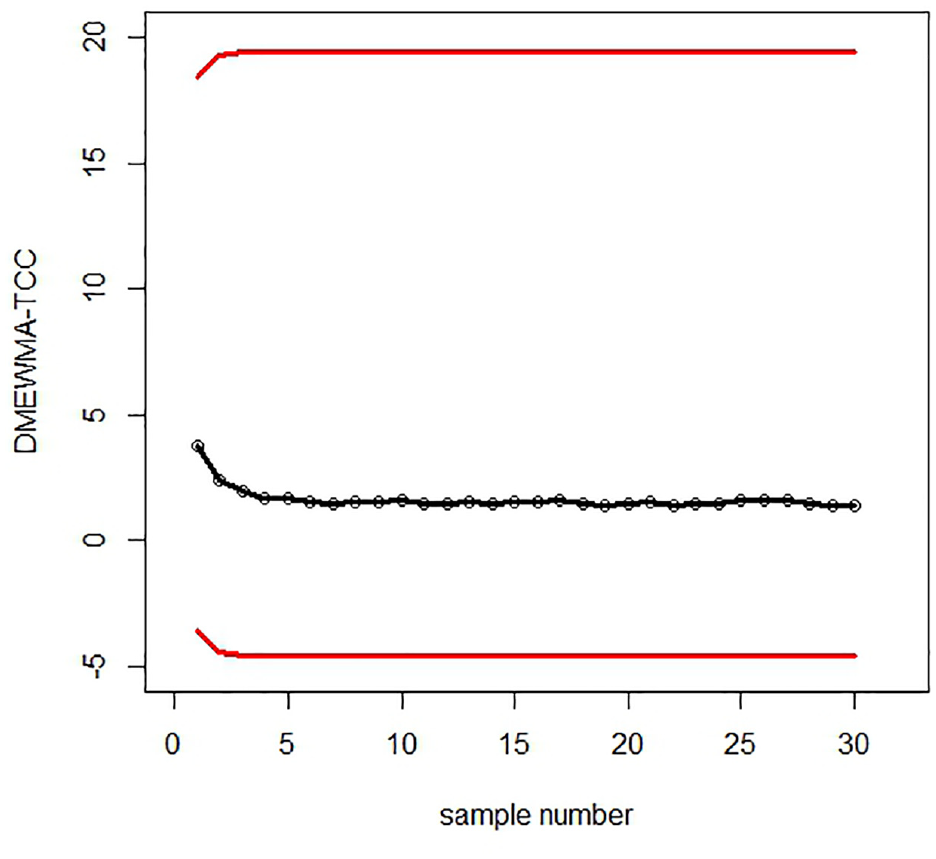
Graph of real data of the DMEWMA-TCC control chart under PE.
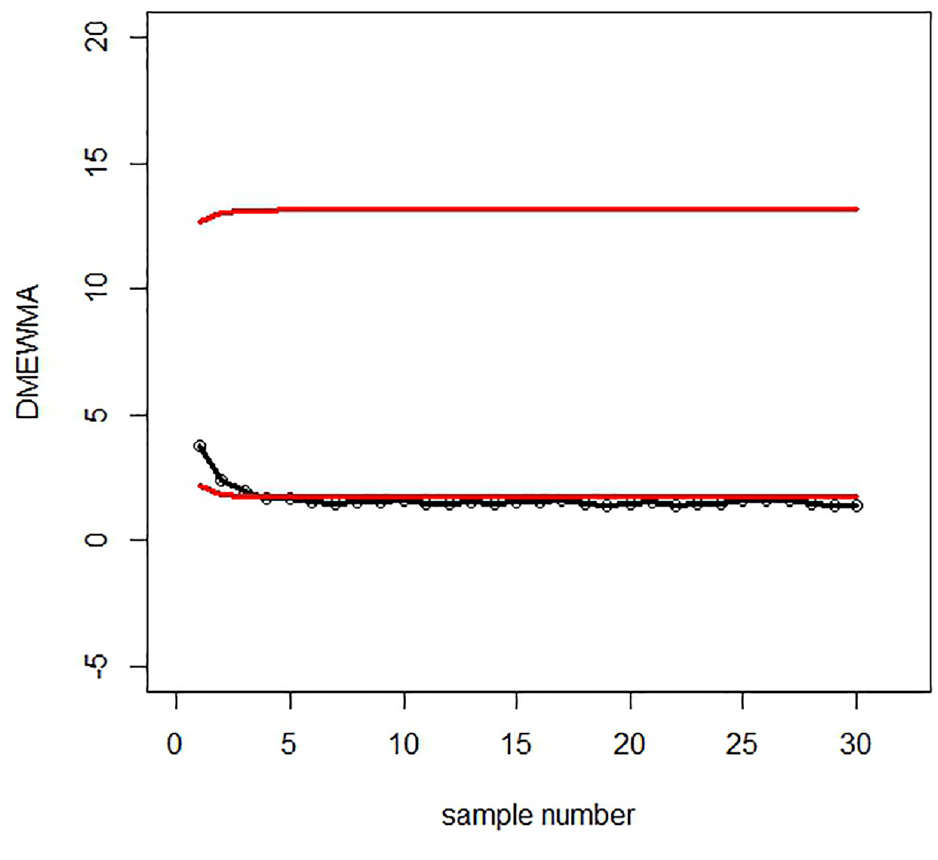
Graph of real data of the DMEWMA control chart under PE.
Operation side of the telecommunication industry
The Real-life data is taken from the operation side of the telecommunication industry, where errors in the software frequently occur regarding the billing amount, dispatch issue, contact and login details. The per-day frequency of errors in the software is reported below: 1124, 1013, 1187, 1153, 1141, 1051, 1178, 1145, 1124, 1132, 1141, 1136, 1241, 1301, 1214, 1421, 1258, 1109, 1321, 1121, 1114, 1021, 1131, 1142, 1165, and 1184. The data followed the KL2PFD and plotted for DMEWMA control charts. We have constructed DMEWMA control charts on real-life dat. For example, in Figures 7 and 8, we see that DMEWMA under PE predicts the process shift at early levels compared to DMEWMA-TCC, which indicates that DMEWMA under PE provides a better explanation of the distributions when the underlying process is based on KL2PFD.
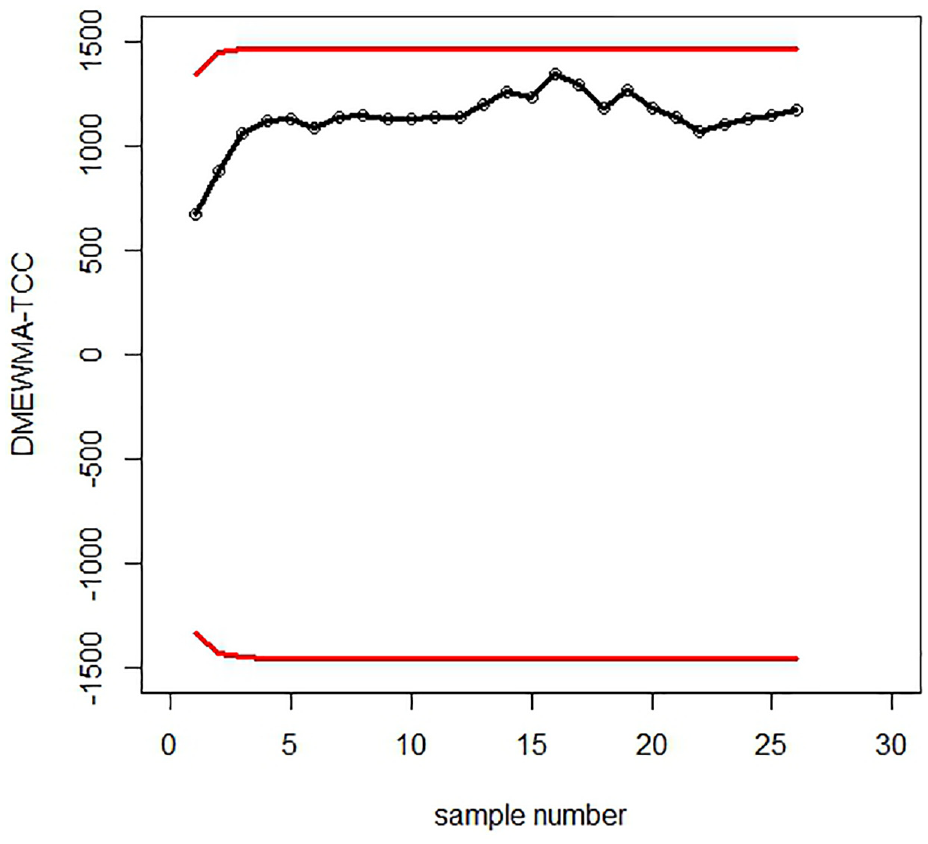
Graph of real data of the DMEWMA-TCC control chart under PE.
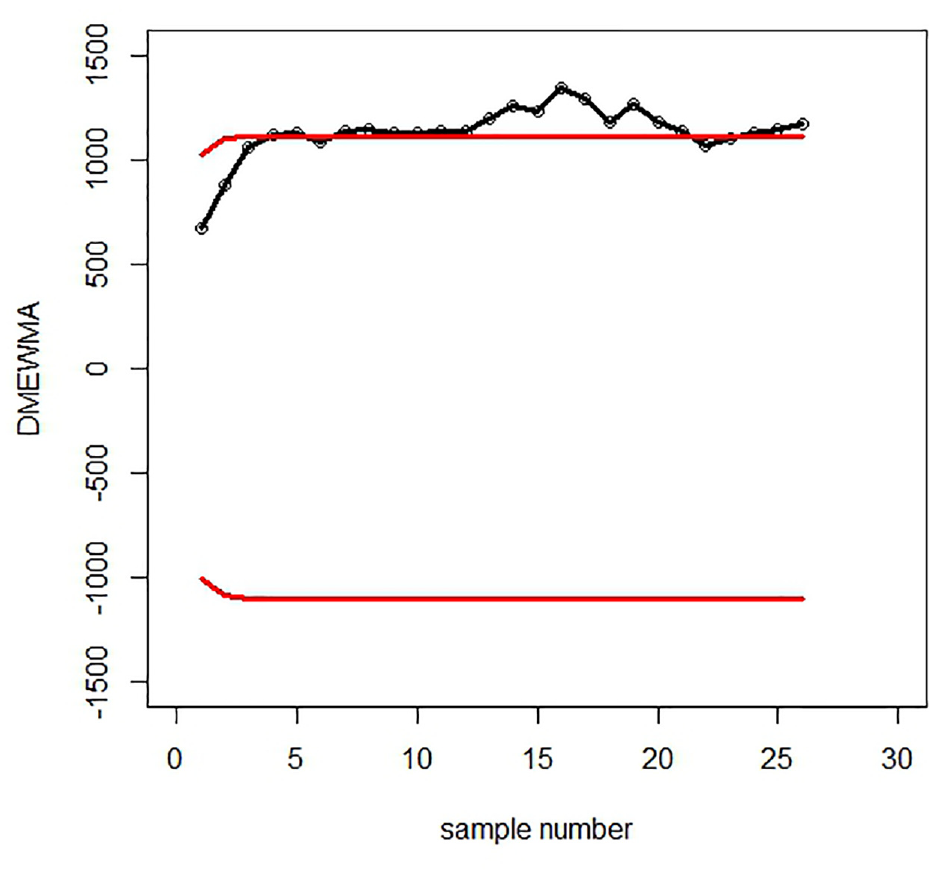
Graph of real data of the DMEWMA control chart under PE.
Final remarks
Some parametric and mix-type control charts have been developed for monitoring processes where the information about the quality characteristic is available. We assume that the quality characteristics follow KL2PFD. The shape parameter of the process is estimated through percentile estimator and further used to construct the parametric and mix type control charts.
We have fixed the ARL at 300 and then constructed the tables of ARL, SDRL using EWMA, DEWMA, HEWMA, EEWMA, MEWMA and DMEWMA for the shape parameter of KL2PFD.
We have made a comparison of these control charts and we observe that the DMEWMA control chart proves to be more efficient to detect any little change in the shape of process.
To investigate the performance of mix type control charts such as EWMA-Tukey, DEWMA-Tukey, HEWMA-Tukey, EEWMA-Tukey, MEWMA-Tukey and DMEWMA-Tukey. We construct control monitoring charts for the shape parameter of KL2PFD and finds DMEWMA- Tukey control chart more efficient in the early detection of any little change in the shape of process having KL2PFD.
By comparing the performance of all parametric and mix-type control charts, we find out that DMEWMA effectively detects any shift as compared to other control charts. After this, DMEWMA-Tukey shows better results to perceive any early shift in the process following KL2PFD.
We also showed the performance of proposed control charts using real-life data and simulation studies. We used three different real life data sets such as the data of filling height of soft drink beverage bottles given by Montgomery. The data consist of a hard-bake process in conjunction with photolithography in the semiconductor manufacturing process given by Montgomery and the data of operation side of the telecommunication industry, where errors in the software frequently occurred regarding the billing amount, dispatch issue, contact and login details. For all these three data sets it’s clear from Figures 3 to 8 that the proposed control chart DMEWMA for the shape parameter performs outclass by providing minimum ARL value (early shift in the process).
The main objective of the paper is to provide the reader with the wide application of KL2PFD in the field of Statistical quality control. The shape parameter is mostly ignored when we come to the application of probability distributions. The current paper is an innovation in the field of probability distribution and statistical quality control which not only provide new control charts named as parametric and Mix-type control charts but also proves their validity by taking the different real life data sets and the shape parameter of KL2PFD is controlled using the proposed monitoring.
Footnotes
Declaration of conflicting interests
The author(s) declared no potential conflicts of interest with respect to the research, authorship, and/or publication of this article.
Funding
The author(s) received no financial support for the research, authorship, and/or publication of this article.
Data availability
The data used to support the findings of this study are included in the article.