
Abstract
Various pipe production procedures, including the construction of seamless pipes using a shaft with the conical tip in the oil industry, require data on the circumferential strain and stress state of the pipe. A method for measuring the displacement, strain and stress behavior of a pipe ring tensile specimen (PRTS) in the hoop direction is what this study’s goal was to develop, as there was a lack of a standardized testing process. For the study, five single S235JRH steel PRTS were tested. In the paper, it is presented how to test S235JRH steel PRTS using a Digital Image Correlation method, Thermal Imaging camera, and 3D scanner. A specially designed steel tool with two D blocks was developed for testing steel PRTS. The strain progression was documented using the 3D Digital Image Correlation method. Using a thermographic camera, an attempt was made to analyze the change in the temperature field of the PRTS during the test. All the specimens were subjected to 3D scanning to verify the cross-sectional geometry of the PRTS after a fracture. Fractures of all Single PRTS occurred in the break zone and almost identical places. The deviation value for the Experimental Ultimate strength value (true stress value) higher than the theoretical Ultimate strength value. Deviation value for the Experimental 0.2% Offset Yield Strength value is higher than the theoretical value. The results of the analysis of cross-sectional dimensions revealed a more significant variation in the thickness of the PRTS compared to its width. A potential area of literature review is the application of a high-resolution thermal imaging camera and the analysis of the stress state of the material using it.
Keywords
Introduction
Characteristics of pipe material include resistance to fatigue, corrosion and fracture. In the manufacturing of pipes, there are numerous methods employed, each with its own specific requirements and considerations. One crucial aspect that must be considered in these methods is the assessment of the pipe’s circumferential stress and strain state. This information is vital for ensuring the durability, performance, and safety of the pipes in various applications. The first example of such a procedure is the method used in the industry of oil to build seamless pipelines using a shaft with a conical tip. 1 The pipe is expanded radially to the necessary diameter by passing through the produced illuminated sample using a conical mandrel.
In recent years, in works Bouvier et al, 2 Pereira et al, 3 corrections were made to the shape of the test samples, with the aim of achieving a uniform distribution of deformations and stresses. The objective of testing processes, including shear, strain test in plane or tensile tests, is to acquire valuable experimental data that accurately represents a well-defined distribution of stress/strain fields. The information obtained can be employed to evaluate the material properties of anisotropic materials, particularly in the context of metal sheets.
Similarly, the examination pipe materials are not simple as sheet shape of metals, owing to the tube geometry. Cutting specimens from pipes that are flattened and testing them in tensile tests are simple procedures, are still used in Zribi et al, 4 Pierron et al. 5 Nevertheless, the process of flattening introduces residual stresses and pre-existing strains in the material, which subsequently influence the behavior of the pipe material, ultimately, material parameter identification accuracy, as stated in the papers Saikaly et al, 6 Dick and Korkolis. 7
In order to establish the mechanical characteristics of thermoplastic tubular materials ASTM D2290, 8 researchers created a tensile test for the ring shape of the specimen to overcome these problems. One key benefit of the approach its ability to assess the material properties of received metallic pipes specifically in the circumferential direction, thereby eliminating excessive work hardening by flattening.
To explore the effects of hydride precipitation in internally pressurized Zircaloy pipes on fracture resistance under elevated temperatures. In the latter half of the twentieth century, was introduced the RHTT (Ring Hoop Tensile Test) 9 approach for the first time. In paper Mehan et al., 10 investigated the mechanical characteristics of nickel-base super-alloy in the hoop direction using the ring hoop test.
Petersen et al. 11 developed a new RHTT that incorporates double-D blocks and a dog-bone insert and investigated the influence of ring and D-blocks friction. To investigate the ductility of Zircaloy-4 cladding pipe, Link et al. 12 built a large RHTT specimen with plane-strain deformation. To prevent flattening ring-shaped specimens and establish the hoop stress-strain curve of tubular thin-walled materials, Wang et al. 13 devised a ring hoop tensile test. Jiang et al. 14 used the RHTT on ring specimens collected from two magnesium-based alloy pipe at room temperature. The researchers used a specimen with a single or double shaped segment.
He et al. 15 and Lin et al. 16 both used RHTT on specimens to examine the formability of AZ31B magnesium alloy tubes at warm temperatures. Dick and Korkolis 7 also used RHTT on a dog bone-shaped specimen to examine the formability of a material. Barsoum and Al Ali 17 developed RHTT samples using numerical analyses and calculated the friction coefficient between the ring and the supporting D-shaped block. Nagase et al. 18 investigated the mechanical properties of Zircaloy cladding in the hoop direction using analytical and experimental methods and developed a ring specimen with a single gage section to avoid friction and bending effects.
Several researchers have attempted to explore the material behavior in the hoop direction of metallic pipes using various ring specimen geometries, according to this literature review.
In Table 1 compares various geometries of metallic RHTT specimens and application of Digital Image Correlation (DIC) method. It indicates that there is no standard or single design for this type of test. DIC is a non-contact optical method that uses digital cameras and specialized software to track the displacement and deformation of a material during testing. Using DIC allows for more accurate and detailed measurements of strain and deformation in RHTT specimens, which can provide valuable information about the mechanical behavior of the material under test. However, it is important to note that the accuracy of DIC measurements can be affected by factors such as lighting conditions, camera settings, and the quality of the speckle pattern on the surface of the material. Comparison DIC with other methods:
DIC provides high-resolution full-field measurements, while strain gages and extensometers offer localized measurements.
DIC excels at capturing complex deformations, which can be challenging for strain gages and extensometers.
DIC is non-contact, while strain gages and extensometers require physical contact, affecting stress distribution.
DIC requires a camera setup, but strain gauges and extensometers can be quicker to install.
DIC can capture larger deformations than traditional strain gages. All methods can be applied to various materials, but DIC might require higher contrast for certain surfaces.
DIC involves image analysis, which can be time-consuming, while strain gages and extensometers provide direct measurements.
DIC is versatile for various applications, including non-homogeneous materials, while strain gages and extensometers are more limited.
Comparative overview of the PRTS specimen geometries and dimensions in the literature for testing pipe ring materials.
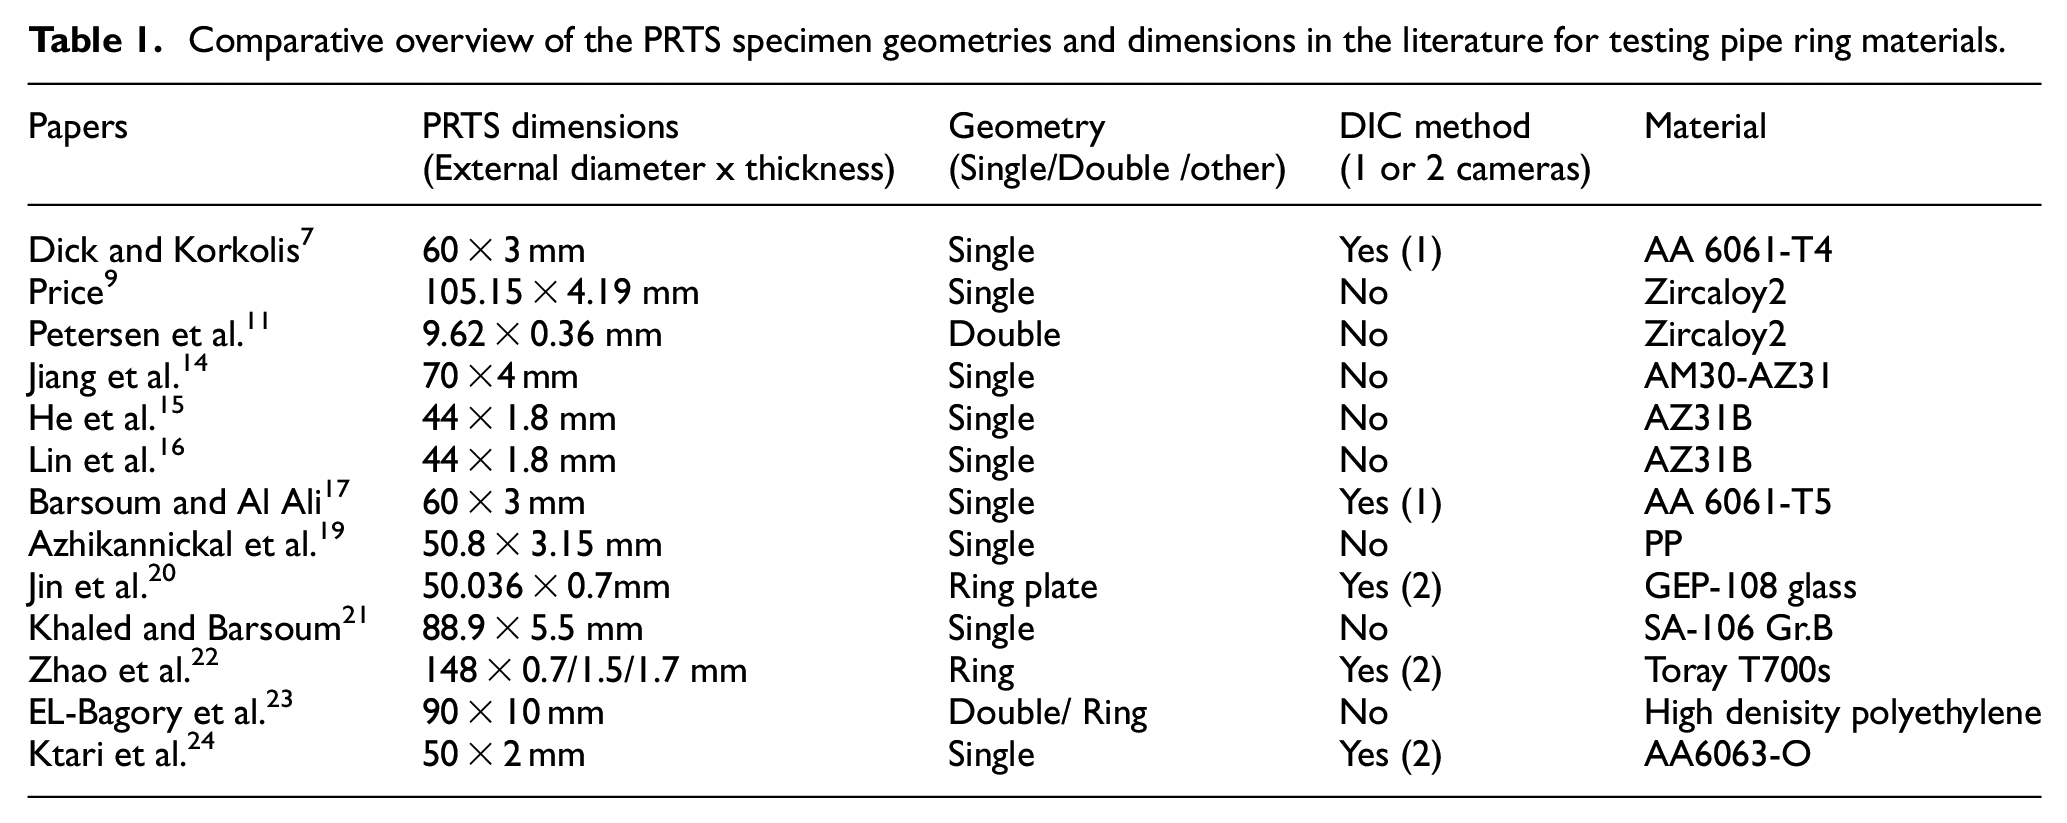
The recommended dimensions in the literature are often inconsistent, and authors have not always demonstrated whether the employed ring specimens undergo uniaxial tensile strain and stress states. This lack of consistency in the dimensions and testing conditions can make it difficult to compare results across studies. Another factor that can influence the mechanical properties of RHTT specimens is friction between the ring and the tool. However, some publications ignore or underestimate the friction effect, as noted by Jiang et al. 14 and Nagase et al. 18 Only a few studies have attempted to account for friction in their RHTT experiments.
In the last two decades, the research field of (DIC) has been growing at an ever-increasing pace. In the publications7,17,20,22,24 the application of the Digital Image Correlation (DIC) method for testing Pipe Ring Tensile Specimens (PRTS) with different geometries is discussed. In Table 1, papers Dick and Korkolis, 7 Barsoum and Al Ali, 17 a numerical analysis was executed, and the numerical analysis results were compared to the DIC method results.
The aim of this study is to determine the stress and strain behavior of S235JRH steel PRTS in hoop direction using the DIC method, PRTS dimensions check after testing using a 3D scanner, and temperature analysis of the outside surface on PRTS using a Thermal Imaging Camera.
Materials and method
For this research, PRTS was made of structural steel S235JRH. As a basis for testing steel PRTS, the previous research was used, which was presented by reviewing the literature in the first chapter. The pipe dimensions for PRTS specimens DN32 (Ø42.4 × 2.8 mm). In total, five Single PRTS were prepared (Figure 1(a)), according to a published paper. 1
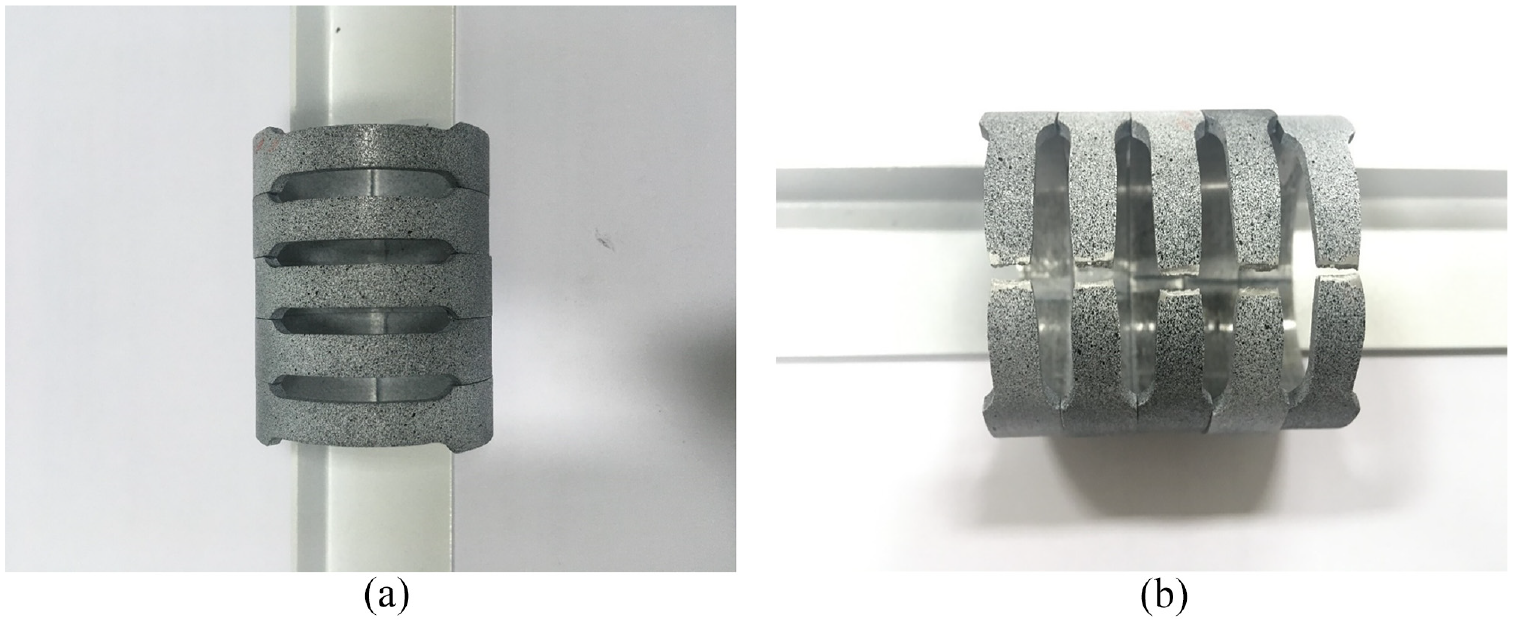
Overview of Pipe Ring Tensile Specimen: (a) painted PRTS with white base color and a stochastic pattern with sprayed of black dots and (b) fracture location for all PRTS after testing.
The experimental setup is presented in Figure 2. Steel PRTS was tested using the custom-made testing tool (Figure 2(b)). For the purpose of testing the same PRTS tool for testing with D blocks was used as in the paper. 1 Figure 2(b) shows the PRTS testing tool. Tensile testing was performed on Shimadzu tensile testing machine AGS-X (Shimadzu, Japan).
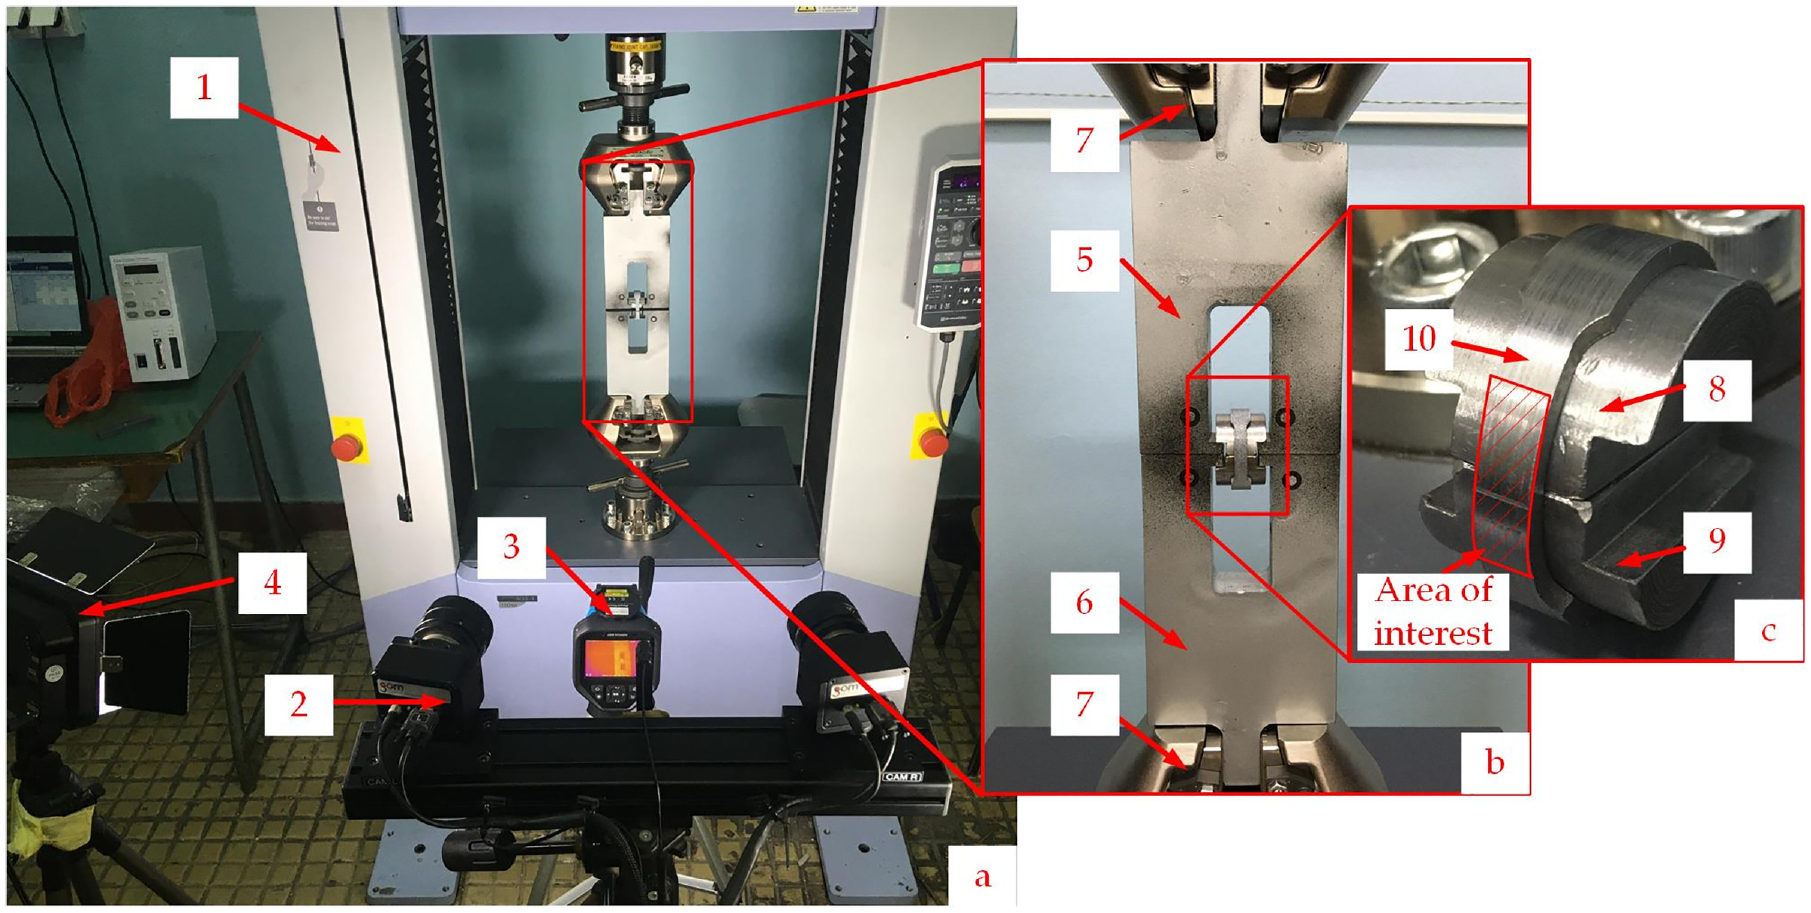
Overview Testing tool and testing setup: (a) view PRTS testing equipment: (1) Tensile testing machine; (2) Aramis 2M; (3) Thermal imaging camera Peak Tech 5620; (4) Light, (b) detailed view of testing setup: (5) Upper fork; (6) Lower fork; (7) Tensile testing machine grip, and (c) D blocks assembly: (8) Upper D block; (9) Lower D block; (10) PRTS.
The Three-Dimensional Digital Image Correlation method (3D DIC method) 1 is used by the Aramis 2M system (Figure 2(a)-position 2). As part of the experimental setup, calibration was done. Several studies26–31,34,35 discuss the mode of operation, calibration, object preparation, and measurement technique in great detail.
Thermal imaging cameras work based on the principle that all objects emit infrared radiation (heat) as a function of their temperature. The camera detects this radiation and converts it into a visible image where warmer areas appear as brighter or different colors, while cooler areas appear darker. A Thermal Imaging Camera Peak Tech 5620 (Peak Tech, Germany) was used to record the temperature field. Reviewing the literature, there is no experiment that has tried to analyze temperature the change, on the specimen surface, during the testing.
A 3D scanner is a tool that records the appearance and shape of real-world items or settings in order to produce a digital representation in three dimensions. Numerous industries, including engineering, manufacturing, architecture, healthcare, and entertainment, frequently use this technology. The 3D scanner Atos Core 200 (GOM, Germany) 1 was used for the cross-section area analysis of the PRTS after the tensile test.
The test procedure consisted of the following steps:
1. Specimen preparation: All PRTSs were painted white with a stochastic pattern of black dots. To visibly assign pixels in photographs, the measuring surface must have a high contrast pattern. (Figure 1(a)).
2. DIC system calibration: This step includes calibrating and setup the cameras. Calibration was completed as part of the testing setup. A few studies25–32 go into great detail about the mode of calibration, object preparation, operation and measuring procedure.
3. Tool and specimen positioning: Including assembling the D blocks inside the PRTS, placing the testing tool on the tensile testing machine, and mounting the montage on the testing tool. The tool comprises of two forks (Figure 2(b), positions 5 and 6) which are put in the upper and lower chuck (Figure 2(b), positions 7), two D blocks (Figure 2(c), positions 8 and 9) put into the PRTS (Figure 2(b), position 10) and assembled on the tool. The internal pressure in the PRTS, which is the pipeline’s most common load, is simulated by loading with D blocks.
4. Setup of tensile testing machine: This step includes setup the test properties on the machine. For all PRTS, the tensile testing machine (Figure 2(a), position 1) is set to test by, 33 with 1 mm/min test speed. Trapezium software is used to track stroke displacements and force values during the experiment.
5. Thermal imaging camera preparation: Setting up the camera and adjusting the emissivity coefficient and the distance from the PRTS. The characteristics of the thermal imaging camera are as follows:
Temperature field −20°C do +550°C;
Thermal resolution 384 × 288 pixel;
Emissivity (range) 0.90 (0.01–1.0);
Distance 300 mm
6. 3D scanner calibration: This step includes adjusting and calibrating the cameras. Atos Core 200 adjusting scanner parameters are as follows:
Calibration object CP40-200-100678
Measuring surface 200 × 150 mm,
Working distance 250 mm,
Dimensions of sensor 206 × 205 × 64 mm.
Standard calibration 0.054 Pixels
7. 3D scanner measurements: Following a satisfactory calibration, a measurement was made.
8. DIC system measurement: A successful calibration (step 2) was followed by a DIC measurement. The tensile test process was carried out in accordance with the standard’s specification. 33 Figure 2(a) shows the installation plan for testing. During the loading, digital photos were automatically taken every 1 s. The nominal picture for data processing was the first recorded image (prior to loading). The following were the Aramis setup settings for this study:
Resolution of two CCD cameras is 1600 × 1200 pixels (Figure 2(a), position 2),
Two 50 mm camera lenses,
Measuring volume of 105 mm × 75 mm × 55 mm,
Measuring distance (distance between camera support and center of measuring volume) 800 mm,
Facet (subset) size 25 × 20 pixels,
Calibration deviation 0.027 pixels (according to the manufacturer, a calibration variance may range from 0.01–0.04 pixels for proper calibration),
LED lamp for specimen illumination (Figure 2(a), position 4).
9. Thermal imaging camera measurement: After successful preparation, a thermal imaging camera measurement was carried out simultaneously with step 6.
10. 3D DIC system data analyzing: The Aramis software was used to carry out the calculation.
11. 3D scanner calibration: It also involves calibrating and adjusting the cameras. The following configuration variables are for the Atos Core 200:
Measuring plane of 200 × 150 mm,
Working range of 250 mm,
Sensor dimensions 206 × 205 × 64 mm.
12. 3D scanner measurements: After effectual calibration, measurement was completed.
13. 3D scanner data processing: Following that, the computation was carried out using the Atos software (GOM, Braunschweig, Germany). After the tensile test, inspect the geometry of the PRTS cross-section.
14. Thermal imaging camera data processing: Afterward, the calculation was carried out using the iVMS software. The measuring point is placed in the central zone area of interest (Figure 6), and the temperature on the PRTS surface is measured over time.
Results and discussion
Results from testing using the 3D DIC method, 3D scanner and Thermal Imaging camera are presented and discussed, as well as summarized results for all PRTS.
For in-plane tests, the one camera DIC approach may be used. However, because of the cylindrical design of the pipe, it is questionable whether one camera could accurately analyze displacement and strain on such a surface.
Figure 3 shows the results of a representative Single PRTS-S3 specimen, moment before the fracture (stage 52), and summarized results are shown in Figure 7(a). In this research, the DIC measurement findings for the von Mises strain are provided. In Digital Image Correlation (DIC), the strain reference used for comparing with the DIC results is typically the initial, undeformed state of the material or structure. This initial state is considered as the reference configuration, and strains are measured with respect to this reference. Also, for comparison of the maximum value of deformation obtained by the DIC method with the nominal value of elongation for the material is used by the appropriate standards for that type of material.
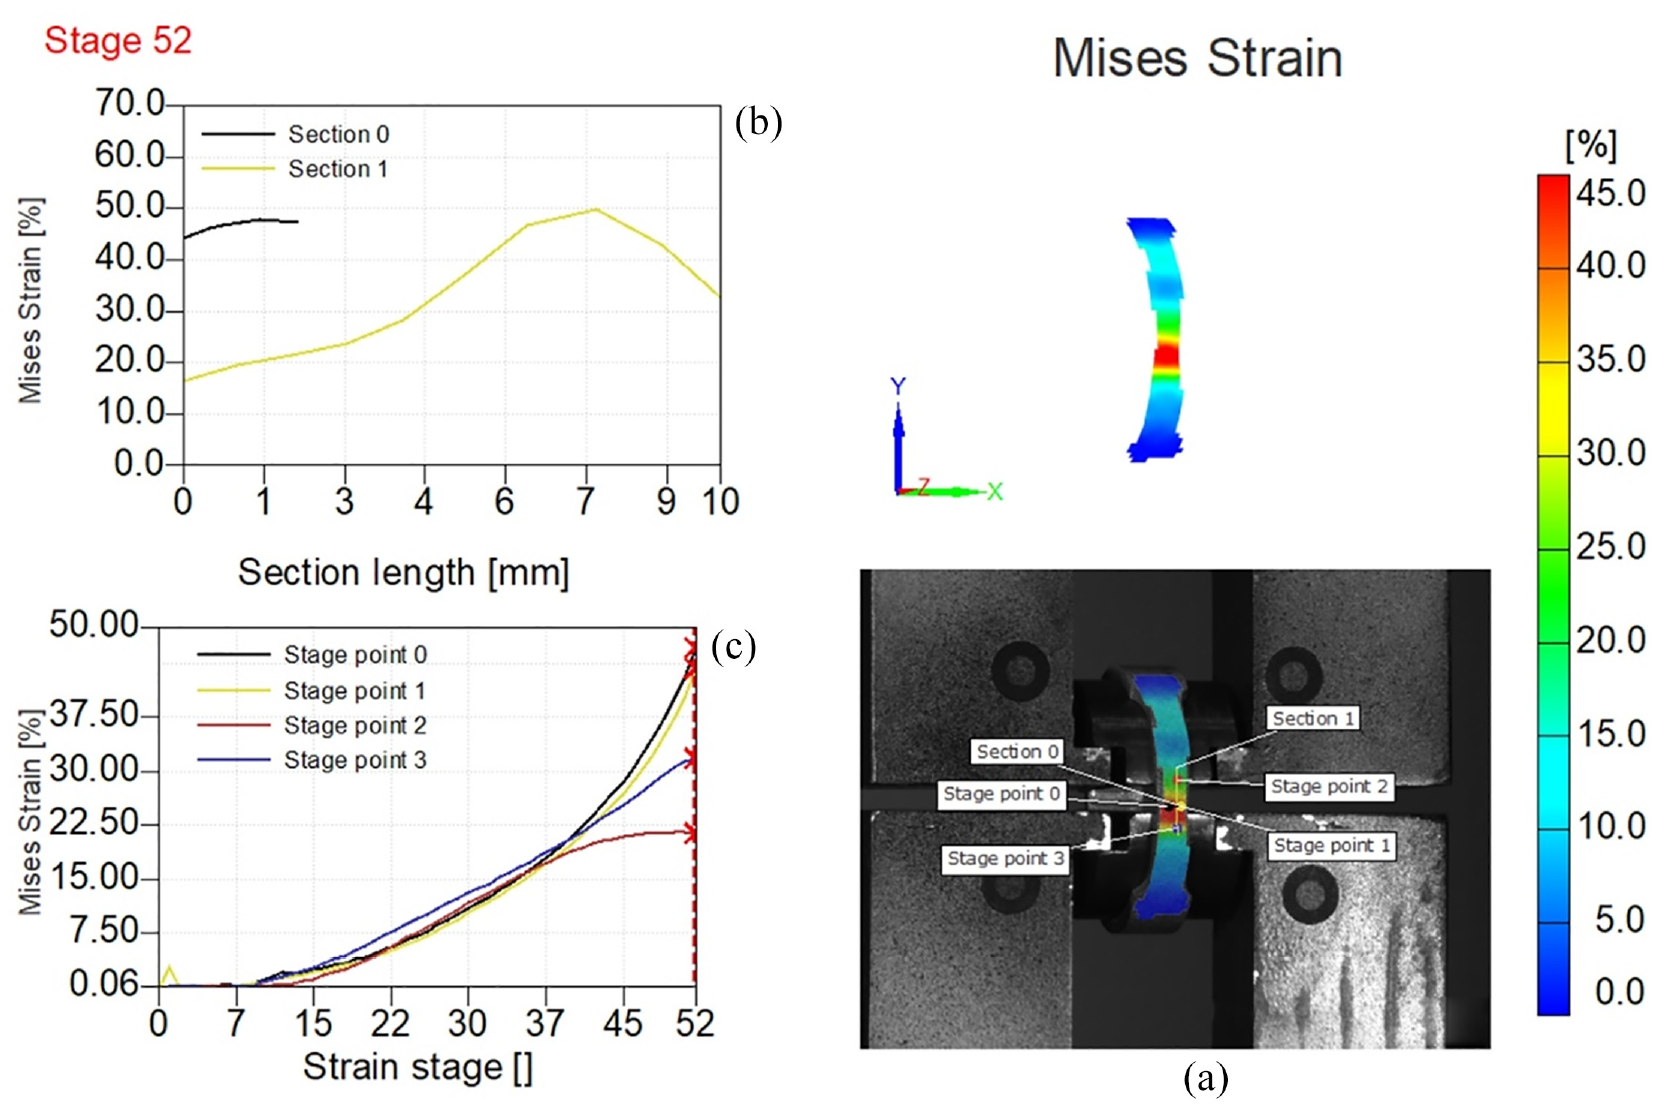
Von Mises strain field visualization prior to fracture for Single PRTS-S3: (a) von Mises strain field visualization at the stage just before fracture, (b) value of von Mises strain in relation to section length, and (c) change in von Mises strain value over time.
Four points (stage points 0–3) and two sections (Sections 0 and 1) were used to investigate the strain field in Figure 3(a) (Stage points 0–3). The intersection of the D blocks is where Section 0 is situated horizontally (black line). Vertically positioned on the Area of interest, Section 1 is orthogonal to Section 0 (yellow line). Stage points are positioned at the conclusion of each Section. Stages 0 and 1 were put on Section 0, while Stages 2 and 3 were put on Section 1. In Figure 3(a), the von Misses strain section right prior to the fracture for Single PRTS is depicted as a function of section length. The experimental data shown in Figure 3(b) demonstrates that the intersection of the D blocks is where the highest strain values are recorded. The yellow line in Figure 3(b) represents the highest von Mises values, which are 48%. Von Mises strain is depicted as a function of time for Stage points 0–3 in the diagram in Figure 3(c). 1 Similar tendency can be seen in the stage point diagram (Figure 3(c)), which is constant from the first to the tenth stage due to low loading values, from this point to the fracture, the von Mises strain rises exponentially.
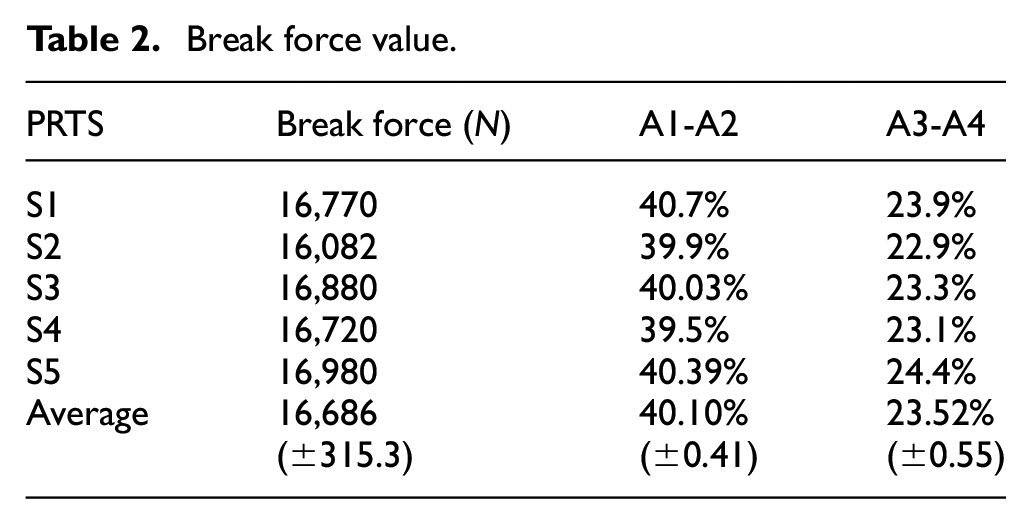
All PRTS that fractured did so on the side that the camera was shooting. (Figure 1(b)). Table 2 displays the average value of these break forces for all PRTSs. All values for PRTS showed negligible differences in brake force.
Break force value.
The Atos Core 200 (GOM, Braunschweig, Germany) was used to analyze the dimensions of the PRTS cross-sectional area. According to Figure 4, the dimensions were examined on the side of the PRTS’s region of interest (Figure 2(c)). Two orthogonal directions were measured for each side: the first for specimen thickness (lines A1–A2) and the second for specimen width (lines A3–A4). All measurement lines were set at the margins of the specimen. Figure 4 shows a Single PRTS-S3 and the measurement elements and analyzed distances.
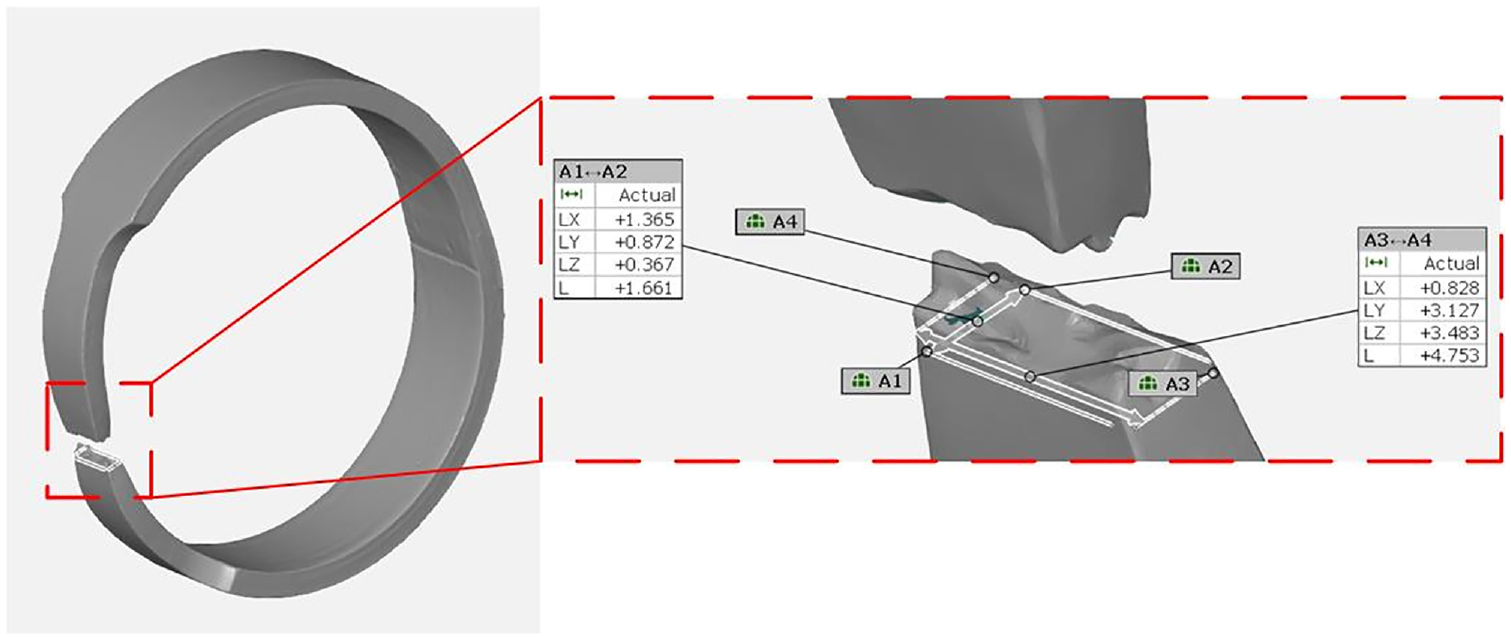
The cross-sectional dimensions of the PRTS region of interest were measured using a 3D scan of a Single PRTS-S3.
It’s important to notice, the change in the cross-sectional area on the opposite side of PRTS area of interest (in the wider part of the PRTS) is on average 1.02%, so it is not considered further.
Following the experiment, Table 2 displays the percentage changes in cross-sectional dimensions for all PRTS in the relevant area. The findings of the change in cross-sectional measurements showed that the thickness of PRTS had changed more than the width. The average value of the change in the thickness of the PRTS is 40.1% and the width is 23.5%, it clearly shows a significant change in the cross-sectional area, which is a characteristic of ductile fracture.
Figure 5 displays the two engineering stress-strain curves: the standard tensile curve of S235JRH (blue line), the experimental tensile curve for average engineering stress values of PRTS (green line). The standard tensile curve of S235JRH was obtained using the Ramberg–Osgood relationship method.36,37 The non-linear connection between stress and strain is explained by the Ramberg-Osgood approach. The engineering stress for all PRTS was calculated using the force data from the tensile testing machines for all stages and nominal cross-section areas and the average value was obtained. Cross section area for Single PRTS was described in. 1 The strain was obtained using the Aramis 2M system. The strain is stated in percentages, and in MPa are all stress values. The fracture of PRTS occurred after the maximum stress value of 367.47 MPa was reached, as can be view on the diagram in Figure 5 (green line), indicating that it was a ductile fracture. Detail A in Figure 4 shows an enlarged detail of the elastic area for tensile curves and 0.2% Offset Yield Strength values for both types of curves. For the standard tensile curve of S235JRH this value is 248 MPa and for PRTS is 208 MPa. The experimental PRTS value of Ultimate strength is 367.47 MPa (Engineering stress value), the True Ultimate strength value is 463.4 MPa and the Ultimate strength for the standard tensile curve is 366 MPa.
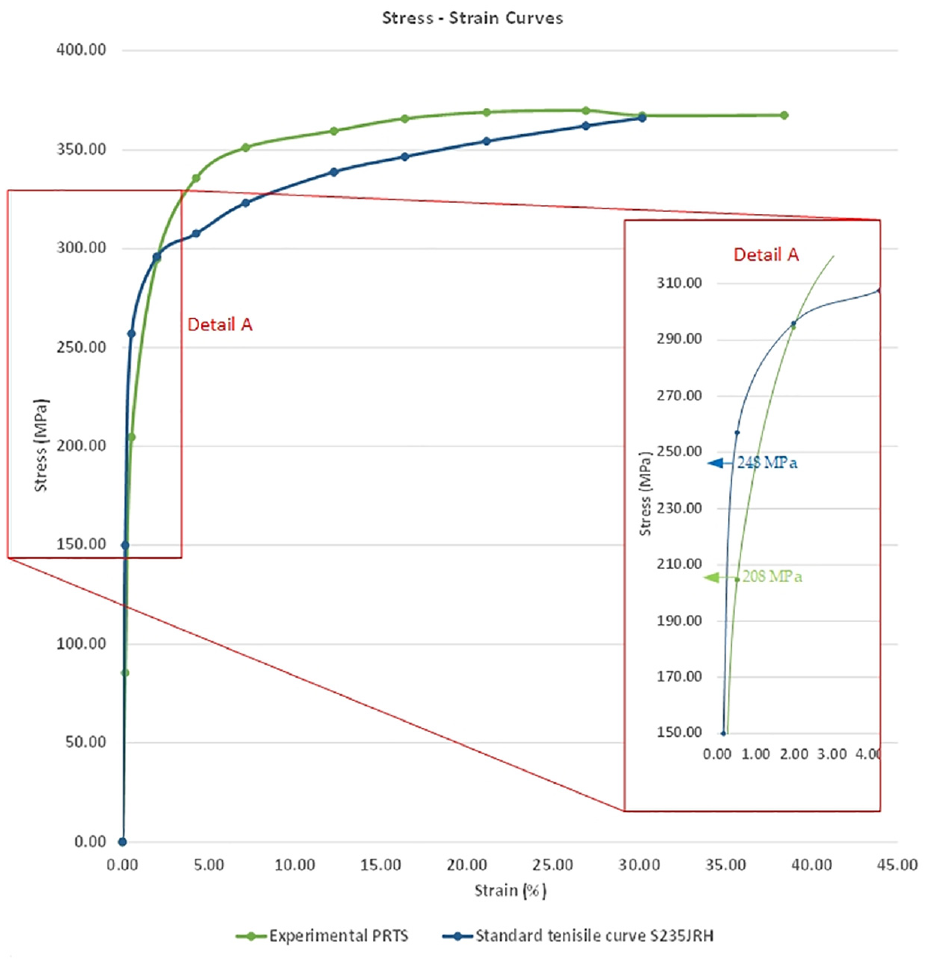
Stress–strain curves with detail A: blue line – standard tensile curve of S235JRH, green line- experimental tensile curve of PRTS.
Using a Peak Tech thermal imaging camera, an attempt was made to analyze the change in the temperature field on the area of interest of the PRTS during the experiment. The temperatures were measured in one spot point on the area of interest central position Figure 6(a). The diagram in Figure 6(b) show average temperature-stages dependence for all PRTS. Temperature was measured on the area of interest surface from the beginning to the end of the test. The temperature value ranges from 31.1°C to 32.3°C degrees with an average value of 31.7°C.
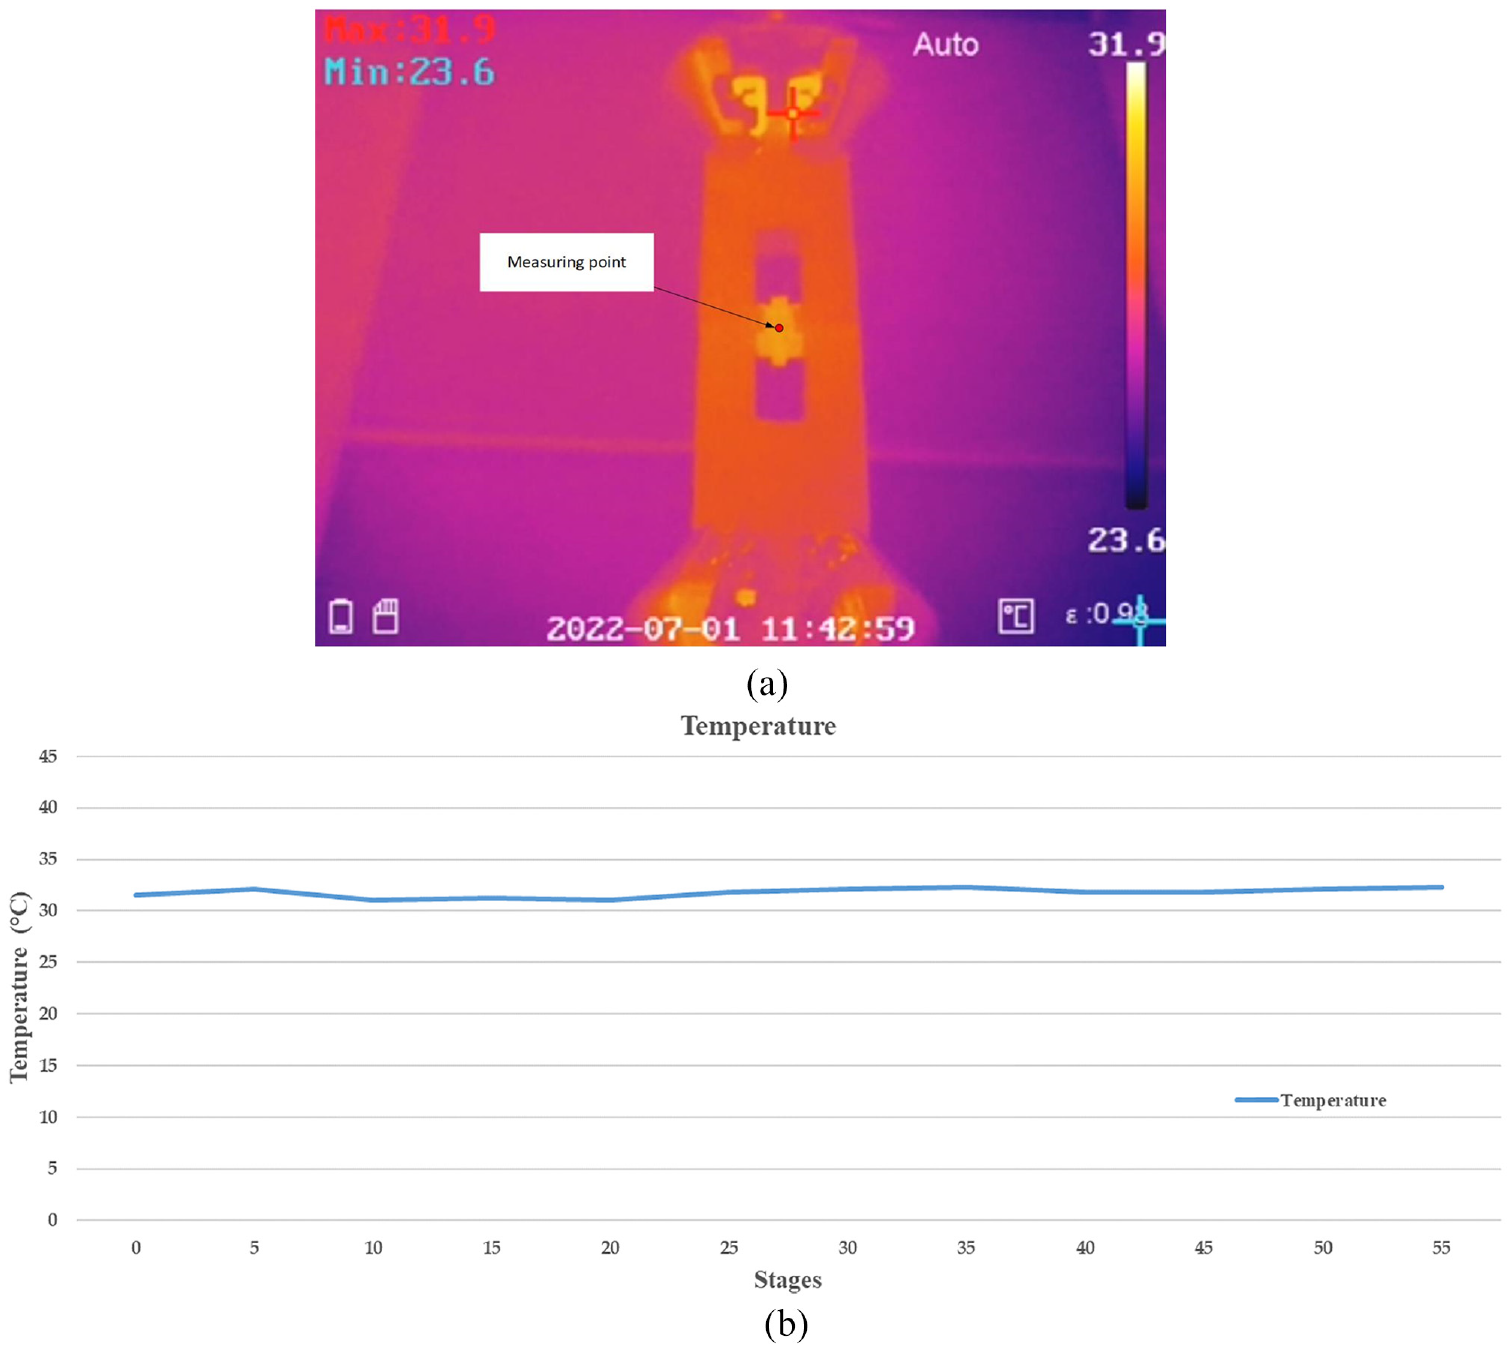
Visualization of thermal field for Single PRTS-S3: (a) initial moment of the experiment and (b) dependence visualization of temperature-stages.
Figure 7 shows dependence visualization of average strain stages for all stage points, engineering stress stages, and temperature stage values for all PRTS. Figure 7(a)’s plot displays average strain-stages dependency values for all PRTS at stage points from 0 to 3. The graph in Figure 7(a) shows up to the tenth stage has extremely low strain values and only after the mentioned moment, the value of strain starts to increase with a linear trend to the maximum value. From the beginning of the experiment (stage 0) to stage number 32 strain value for all stage points are approximately the same, after that, the strain value follows a pattern that is similar for stages 0 and 1 and stages 2 and 3. The Figure 7(b) represents an engineering stress-stages dependence. The highest stress value of 367.47 MPa.
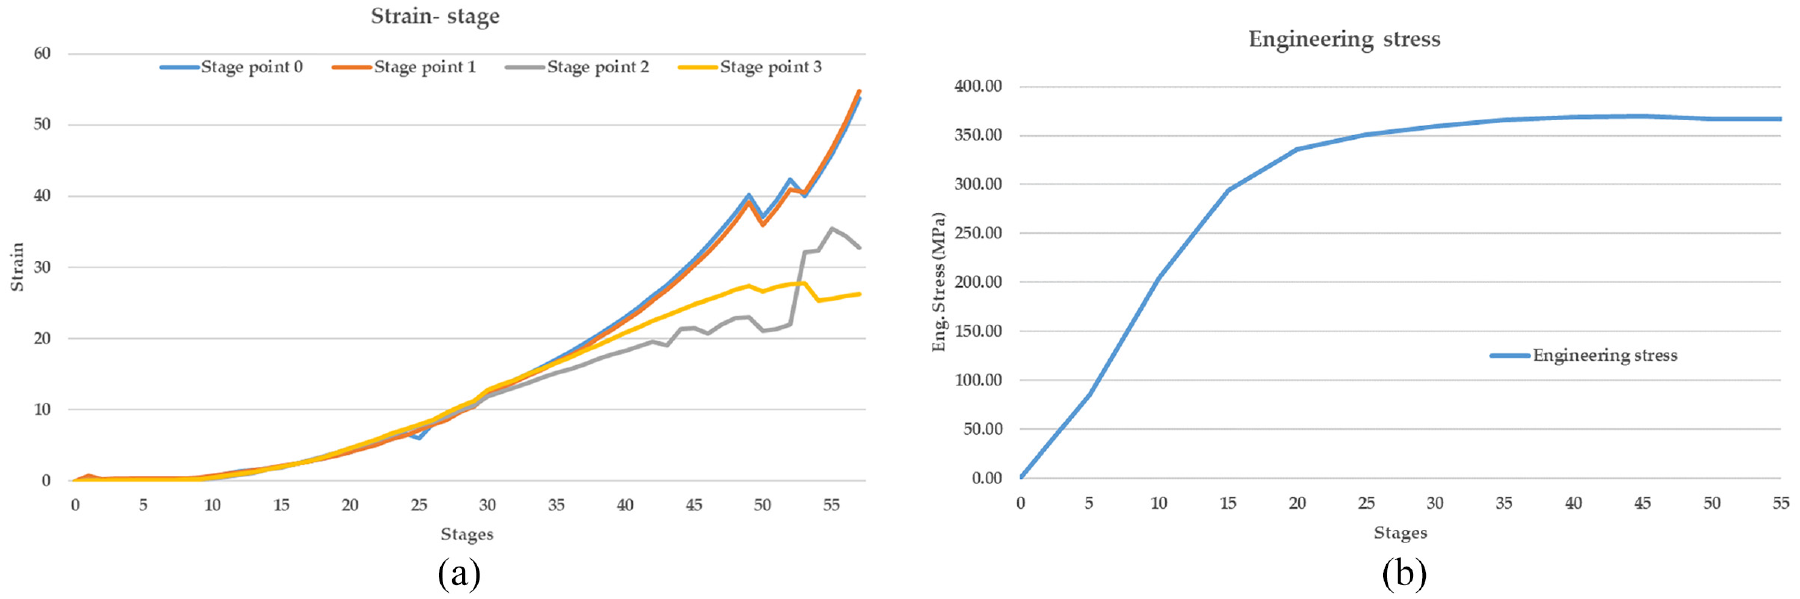
Dependence presentation of: (a) dependence of average strain-stages for all PRTS and (b) engineering stress-stages.
For Single PRTS, the 3D DIC approach should be used. The presented method will also be used on high-quality materials used in thermal power plants.
The limitation of this study is related to the thermal imaging camera position. The position of the camera is limited as of DIC cameras which need to have a clear view of the front specimen surface.
Conclusions
Based on previous research 1 with plastic PRTS, identical steel PRTS with a Single configuration were made and tested in the same methodology. The mentioned results lead to the following conclusions:
Fractures of all Single PRTS occurred in the break zone and almost identical places;
PRTS fractures are ductile, as seen by the fracture surface (Figure 1(b)) and Table 2;
Deviation value for the Experimental 0.2% Offset Yield Strength value is 19.2% higher than the theoretical 0.2% Offset Yield Strength value;
Deviation value for the Experimental Ultimate strength value (Engineering stress value) is 0.4% higher than the theoretical Ultimate strength value;
Deviation value for the Experimental Ultimate strength value (true stress value) is 26.6% higher than the theoretical Ultimate strength value;
The use of a thermal imaging camera for temperature field research reveals that there is no substantial change in temperature when evaluating the S235JRH material.
Digital Image Correlation (DIC) is a powerful technique for measuring displacement and deformation, but it does have some limitations:
Contrast and Lighting: DIC requires sufficient contrast and uniform lighting on the surface being analyzed. Poor lighting conditions or low contrast can lead to inaccuracies in the results.
Large Deformations: DIC accuracy decreases with larger deformations. Beyond a certain point, significant changes in shape might lead to difficulty in tracking features accurately.
Spatial Resolution: The accuracy of DIC is limited by the resolution of the camera and the size of the image subset used for correlation. Fine details might not be captured accurately.
Surface Texture: Extremely rough or highly reflective surfaces can be challenging for DIC. The technique assumes that points on the surface remain distinguishable between images.
Speckle Pattern: DIC relies on a speckle pattern (randomized texture) on the surface for tracking. If the speckle pattern is too regular or too irregular, it can affect the accuracy of tracking.
Strain Concentration: DIC measures surface strains. In cases of stress concentrations, especially at sharp corners or edges, the measured strains might differ from the actual strains in the material.
Data Processing: DIC involves significant data processing, especially for high-resolution images or large datasets. This can lead to longer analysis times.
Camera Calibration: Precise camera calibration is essential for accurate results. Errors in calibration can propagate through the analysis and introduce inaccuracies.
Software and Algorithms: The accuracy of DIC depends on the quality of the software and algorithms used for image correlation. Different algorithms might perform differently in various situations.
Environmental Factors: Vibrations, changes in temperature, or air currents during image acquisition can introduce noise and affect accuracy.
The continuation of the research may go in the direction of applying an additional camera to monitor the change in the thickness of the test tube, developing a numerical model and perfecting the method of evaluating and predicting the behavior of the material.
Footnotes
Declaration of conflicting interests
The author(s) declared no potential conflicts of interest with respect to the research, authorship, and/or publication of this article.
Funding
The author(s) disclosed receipt of the following financial support for the research, authorship, and/or publication of this article: This research was funded by the Ministry of Education, Science and Technological Development Republic of Serbia, grant number 451-03-47/2023-01/200213 from 03.02.2023.