
Abstract
The few applications used by Small and Medium Scale Enterprises (SMEs’) businesses lack efficiency and the appropriate intelligence to save them from price instability, inventory carrying costs, excess inventory, wrong decision making, inaccurate monitoring of stock levels, etc. through predictive analytics. The study explored various Artificial Intelligence Machine Learning (AI/ML) models and data structure array types that could be used with the day-to-day local weather conditions of low and high temperatures to predict market parameters and aid SMEs with predictive data to use for combating wrong decision-making, inaccurate business monitoring and excess inventory, etc. Among the ML models explored included sequential minimal optimisation, iterative reweighted least-squares, Fan-Chen-Lin support vector regression, linear regression newton method and multivariate linear regression Ordinary least squares for a multivariate linear regression and logistic regression. The models were compiled using visual C# and Accord.Net libraries. Multivariate linear regression Ordinary least squares models recorded the least predictive accuracy loss, for the test quantity prediction test samples, and varying acceptable square loss values, for usage in geo-localised mobile intelligent systems for SME predictions due to their favourable scores. The jagged array overall performed better than the multi-dimensional array on some time and space complexity tests. This work is contributing to the body of knowledge by evaluatively suggesting better data structures and ML models for building intelligent systems in Xamarin forms using C# and small data for the model training for applications in mobile phone systems that will aid SMEs’ in adjusting spending and sales targets.
Introduction
Accurate and reliable market predictions are the significant factors for a successful business, 1 which most small and medium-scale entrepreneurs (SMEs) are deprived. Mainly because they cannot afford the expensive systems used by large-scale enterprises, which mainly run-on desktop computers. Little research has been done concerning the use of handheld mobile devices for localised forecasting and prediction. And the selection of better data structures and artificial intelligence machine learning models and factors is needed for building intelligent geo-localised mobile device applications for predicting the market’s demand and supply of goods and services, goods availability and cash flow more accurately for SMEs.
SMEs in third-world countries lack market forecasting portable systems. They resort to spreadsheets, calculators, and speculation to make decisions. 2 Because these mentioned are not forecasting systems, they face several challenges, such as market competition, global financial and economic crises, changes in consumer profiles and preferences, 3 imbalances in cashflow for their supplies and their outgoing orders, spiralling cost overruns, and underproduction of in-demand items. SMEs are key factors for local development, overcoming poverty and bringing up employment in rural areas. 4 They are specialist suppliers of goods and services for large firms due to their supply of cheap goods and services. 5
Some studies have looked into Artificial Intelligence Machine Learning AI/ML systems that can predict SMEs’ market business parameters. Among them is Pelekamoyo et al., 6 in an article titled: ‘Forecasting market’s demand and supply with machine learning and local weather’ discussed how to use the day-to-day local weather conditions of low and high temperatures as the main variables for forecasting the SME’s market business parameters. The study compared machine learning (ML) models built using visual C# DotNet and other models built in python language. Where it established that C# ML models performed better than the python models, in forecasting the local-market indicators using the local-weather attributes of low and high temperatures. 6 Moreover, C# mobile intelligent predictive applications can easily be built with Xamarin Forms, with no need for cloud computing, or heavy libraries like TensorFlow or Keras to run on Android, or Apple OS and forecast or predict data, unlike python scripts which may need to be used as a third-party language script in either Java or C# or C++ mobile application which can reduce performance and scalability of such mobile ML predictive system. 6
Other
Other research studies on sales demand forecasts in e-commerce used long short-term memory neural networks, exploiting non-linear relationships that exist in e-commerce business data. 1 While conditioning the forecast of some individual time series on the past behaviour of similar time series, quality forecasts with a Long Short-Term Memory network (LSTM) are achievable. 1
Aleco et al. 7 used feed-forward artificial neural networks to gain insights into the accuracy of different network architectures and studied the effects of different input variables and the capability of the models to utilise the factors in forecasting the medium-scale fertiliser distributor sales revenue.
Aras et al., 8 in a study titled ‘Comparative study on retail sales forecasting between single and combination methods’, forecasted sales for a global furniture retailer operation in Turkey using state space models, ARIMA and ARFIMA models, neural networks, and Adaptive Network-based Fuzzy Inference System (ANFIS). During the same study, forecast benchmark performances of different models and combinations of different models were established, for the results of the single models underperformed as compared to the other combined models overperforming in the time series investigations. 8
Massaro et al., 9 in the article, Augmented Data and XGBoost Improvement for Sales Forecasting in the Large-Scale Retail Sector reported improved results and reduced errors in the forecasts due to the use XGBoost model, trained and tested using Augmented Data (AD) technique. The method employed data mining technologies, processing precious information to increase sales profit while applying the extreme gradient boosting (XGBoost) algorithm in an industrial project as a supervised learning algorithm to predict product sales including promotion conditions and a multiparametric analysis. 9
Applying deep learning models for stock price time series forecasting equally has shown promising results on the extremely nonlinear time series data which has been a challenge for a while. 10 Balaji et al., 10 pointed out that, ‘Accurate prediction of stock prices and the direction of stock price movement is also essential for a stock trader/investor to trade profitably’. The authors used in their study, to achieve good accurate prediction benchmarks, had to employ at least 14 different deep learning models based on Long-Short Term Memory (LSTM), Gated Recurring Unit (GRU), Convolutional Neural Networks (CNN) and Extreme Learning Machines (ELM), evaluated on stocks for their ability to generate one-step ahead and four-step ahead time series forecasts. 10
Comparative model benchmarking helps in the selection of better forecasting models for particular problems. Thakur (ND), for instance, equally compared long short-term memory (LSTMs) networks, base support vector machines (SVM) regression and multi-linear regression using comparative benchmarking, and by incorporating new features, an increase in the accuracy of the predictive models was guaranteed in the LSTMs, performing better than SVM 11 on the datasets therein used.
Previous studies on predictive solutions for markets and businesses concentrated only on medium-scale enterprises (MSE), and large businesses, neglecting the SMEs. And the solutions for MSE looked at so far have never looked into the integration of the forecasting models into mobile device platforms. With the few solutions are restricted to python language scripts for AI/ML solutions, which is a restricted language for enterprise desktop or mobile solutions.
Most of the research for market and business forecasts rely heavily on time series forecasts, which do not exploit non-linear relationships which exist in e-commerce business data. 1 Some forecasting models like the feed-forward artificial neural networks once used for medium-scale fertiliser distribution, 7 tend to be heavy to run on mobile devices. And in some instances, they are outperformed by other simpler forecasting models. The reason why most existing demand forecasting methods in the e-commerce domain are largely influenced by forecasting techniques from the exponential smoothing and the ARIMA families, 1 the ARIMA and ARFIMA models, neural networks, and Adaptive Network-based Fuzzy Inference System (ANFIS). 8 While the current studies rely on time series forecasts, and other linear data methods, market behaviour in itself is non-linear and very unpredictive. Using weather parameters in forecasting SME market parameters has proved to be an accurate procedure for SME market parameters’ forecasting than using related market factors which include, sale’s transactions, purchase orders and inventory items’ quantities, with methods which use time-series methods like the Long-Short Term Memory (LSTM), Gated Recurring Unit (GRU), Convolutional Neural Networks (CNN), etc. 6 Little is, however, known about the best forecasting models for low-power mobile devices, and better data structures to use for in-application data storage and interactions.
From this background, this work sort to answer the question: ‘What are the better forecasting-predictive models, and which data structures are efficient for use with an AI/ML model in mobile-device applications for SMEs?’. Thus, more specifically, the work serves two objectives, to establish which among the various ML value prediction and data classification models are efficient for use in mobile-device applications, and to evaluate which among the compound array data structures should be preferred for use in mobile-device applications.
The AL/ML models explored include sequential minimal optimisation (SMO), iterative reweighted least-squares (IRLS), Fan-Chen-Lin support vector regression (FCL-SVR), linear regression newton method (LRN) and multivariate linear regression Ordinary least squares (MLR-OLS) for a multivariate linear regression and logistic regression.
Before proceeding further, an SMO is an ML iterative method model which breaks down large quadratic programming (QP) optimisation problem into a series of smallest possible QP problems, which arises during the training of support-vector machines (SVM), and the small QP problems are solved analytically, which avoids using the time-consuming numerical QP optimisation. 12 While an IRLS model, according to Ongko, 13 also referred to as an Iterated Weighted Least Squares (IWLS), is an algorithm for finding the maximum likelihood estimates of generalised linear models. The IRLS sets a desired magnitude frequency response and finds an optimal approximation to it by iteratively solving an optimal complex approximation, by iterating on the weights. 14 Fan-Chen-Lin 15 support vector regression (FCL-SVR) is a decomposition method for training support vector machines (SVMs), used to solve quadratic programming problems where the quadratic matrix may be too large to fit in memory, and it uses second-order information to achieve fast convergence. The linear regression newton method (LRN) is an iterative optimisation model with a quadratic rate of convergence, which start by approximating the learning curve with a random starting point with a second-order Taylor extension to compute the maximum of that extension by taking its first derivative and setting it equal to zero, making it faster than gradient descent which has only a sublinear rate of convergence that can find the perfect beta coefficients. 16 And the multivariate linear regression Ordinary least squares (MLR-OLS), is multiple regression using several independent variables, used for estimating coefficients of linear regression equations for predicting the value of one or more dependent variables measured at the interval or ratio level, by minimising the sum of square differences between the observed and predicted values. 17
This work contributes to the body of knowledge by providing an overview solution for SMEs who lack decision support system (DSS) applications on their mobile devices for improving decision-making capabilities. Coupled with expensive internet services in most third-world counties, they require systems in which lower-level components operate on local data to provide localised support needed for achieving global goals, that is, a decentralised system.
This paper has four primary parts, the first is the introduction, which includes the background, the relevant literature and the gaps, and the objectives. Followed methodology, where the methods data analysis methods are discussed. Then the results and discussion section, where the results of the study are talked about and summarised. And finally, the conclusion, where the theoretical and managerial applications and implications are discussed with suggestions for further improvements and research.
Methodology
The intelligent mobile device predictive system application was designed on the premise of the flowchart in Figure 1 using Xamarin forms. The language used was C# .Net. The system used weather high and low temperatures to predict the next day’s market parameters of goods’ quantity supply, the quantity ordering cost and sales status (good sales or bad sales). The data in the application is stored in an SQLite database, and transferred to arrays in the application to use for ML model predictive training.
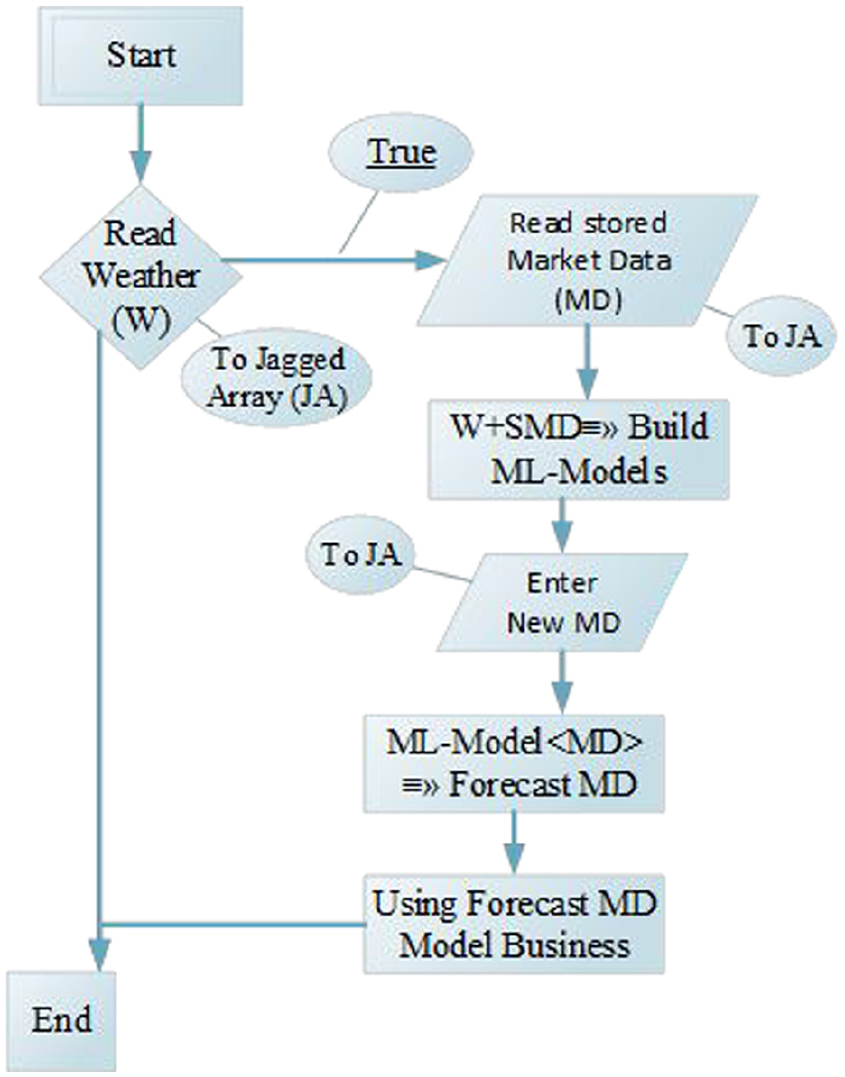
Mobile system data flowchart diagram.
The study used 150 array rows for the multidimensional array and the jagged array respective, for the prior study, and 1000 array rows for the multidimensional array and the jagged array respective, in the main study. For both studies, each array row had six elements. The arrays’ space and time complexity benchmarking were performed on a laptop computer with 8 GB RAM and intel core i7-7700HQ 2.80 GHz CPU (Central Processing Unit) and a mobile device with 2 GB RAM and 1.3 GHz quad-core CPU. The main software used on the computer for other benchmarking scores of diagnostic objects created in memory and diagnostic heap size readings is Visual Studio (VS) 2022 diagnostic tools memory usage.
For the ML models forecasting/predicting comparative study, eight samples were predicted using value prediction and value classification. And the ML models used, included: Multivariate Linear Regression Ordinary Least Squares (ORS) for multivariate linear regression and logistic regression models, measuring the Accuracy Loss, R-Square Loss, and Log-Likelihood Loss; the Sequential Minimal Optimisation (SMO) model set with Polynomial Kernel of second degree, Complexity parameters of auto, 50 and 150 measuring the logistic and log-Likelihood loss; the Iterative Reweighted Least Squares (IRLS) model set with 50, 100 and 150 number of iterations, measuring the logistic and log-Likelihood loss; the Fan-Chen-Lin Support Vector Regression (FCL-SVR) model with Kernel Estimation set to true and with complexity parameters of auto, 50 and 150, measuring the logistic and log-Likelihood loss; and finally, the Linear Regression Newton Method (LRNM) model set with complexity parameters of auto, 50 and 150, measuring the logistic and log-Likelihood loss.
In the models, the complexity parameter was the cost values associated with each input used for the creation of the accurate model and the iteration convergence tolerance values for all the models were set varying from 1e-2 to 1e-4 to determine the convergence of the model used when predicting the goods order prices and the quantities to order.
Results and discussion
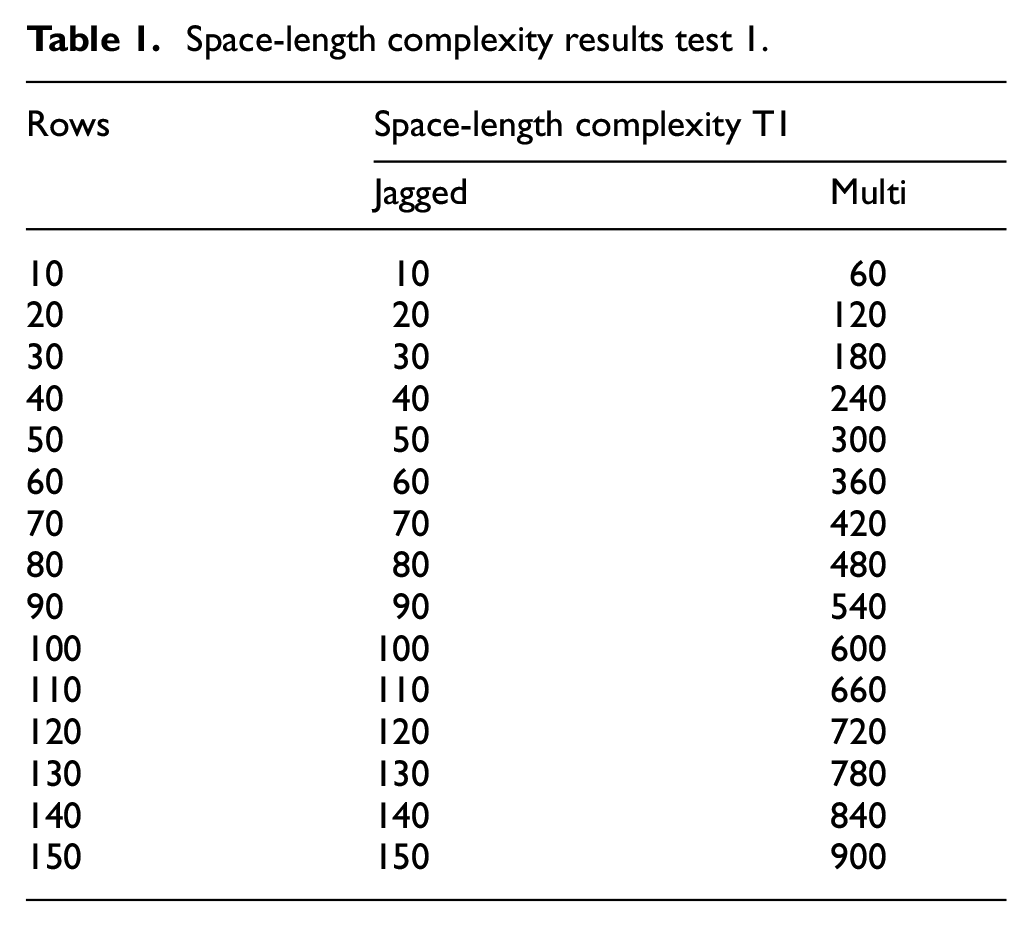
From the study, 150 array rows were used for the prior experiment study, the C# array length property yielded the following results shown in Table 1, the comparative results for the multidimensional and the jagged array length complexity which is represented graphically in Figure 2.
Space-length complexity results test 1.
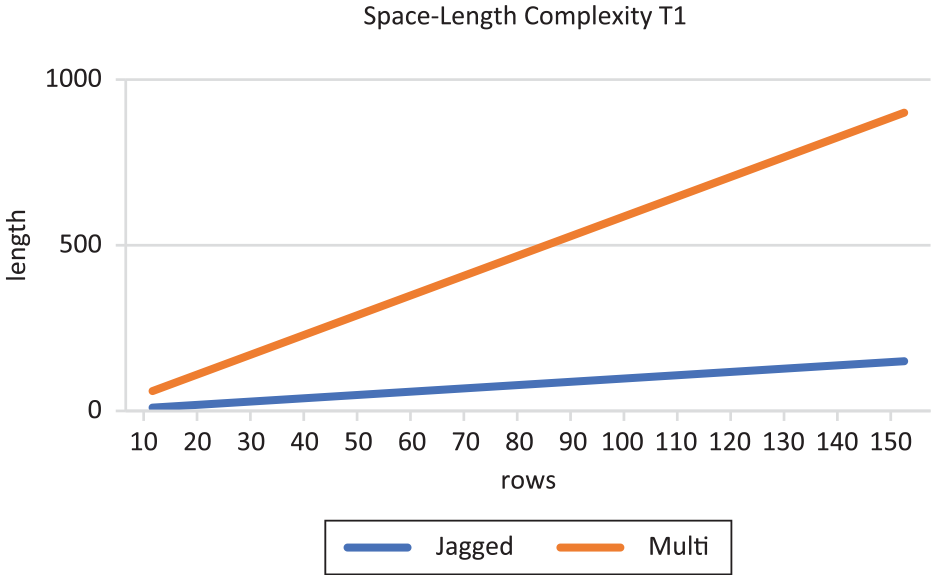
Space-length complexity graph test 1.
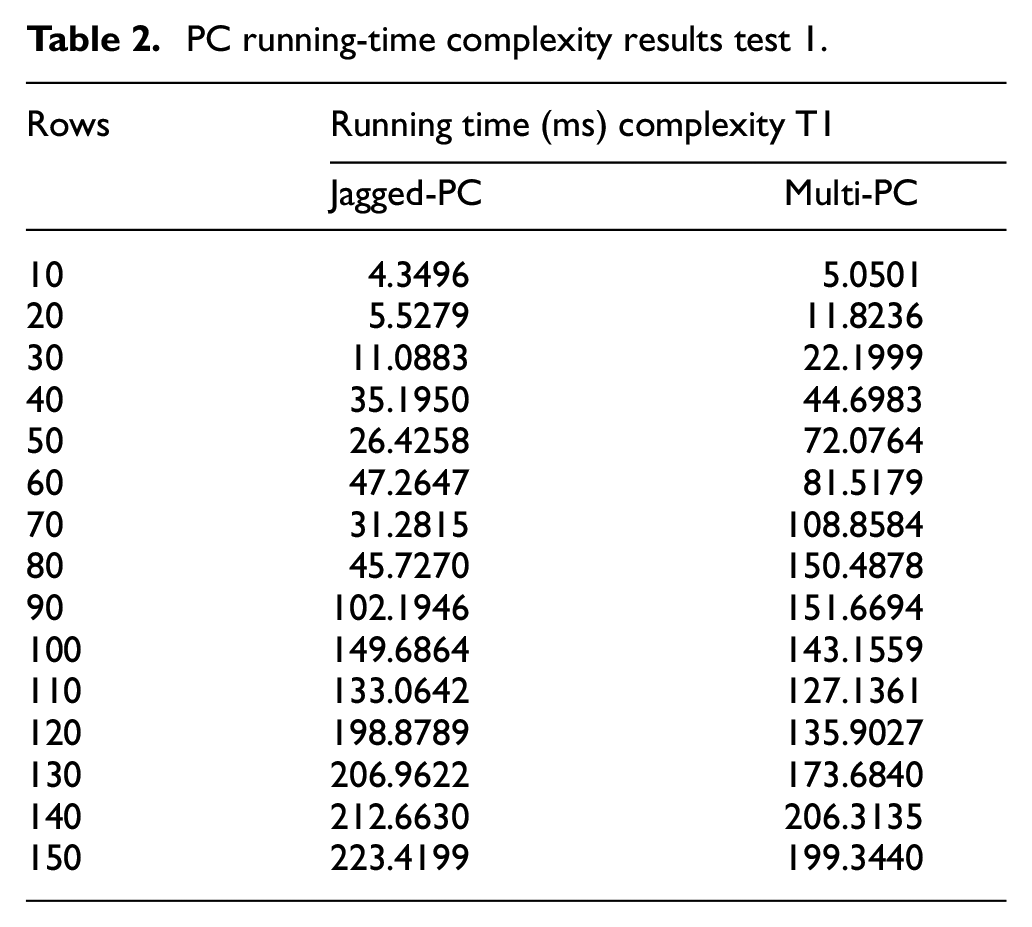
While Table 2 shows the prior comparative results for the multidimensional and the jagged array running time complexity which were measured on a computer, the function’s execution elapsed time measured in milliseconds. Which was represented graphically in Figure 3.
PC running-time complexity results test 1.
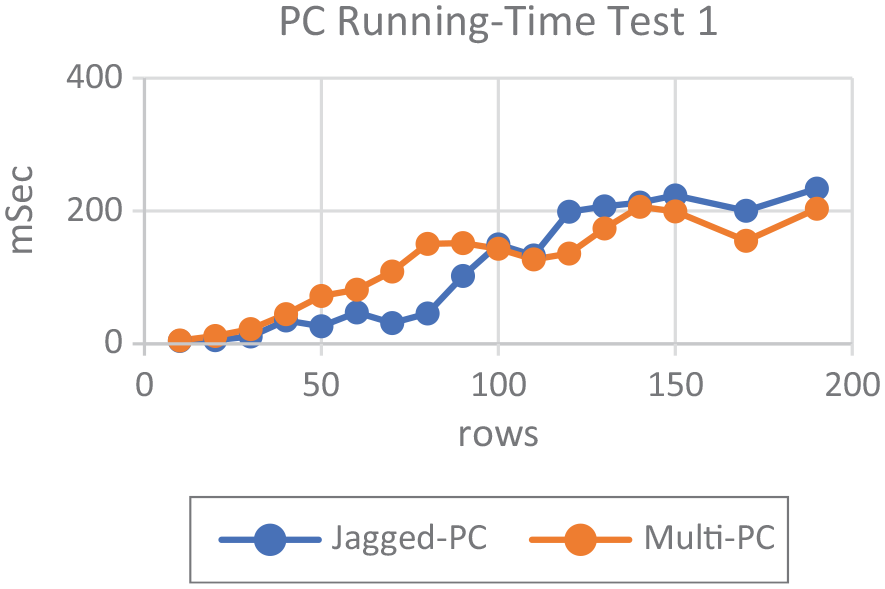
PC running-time test 1 graph.
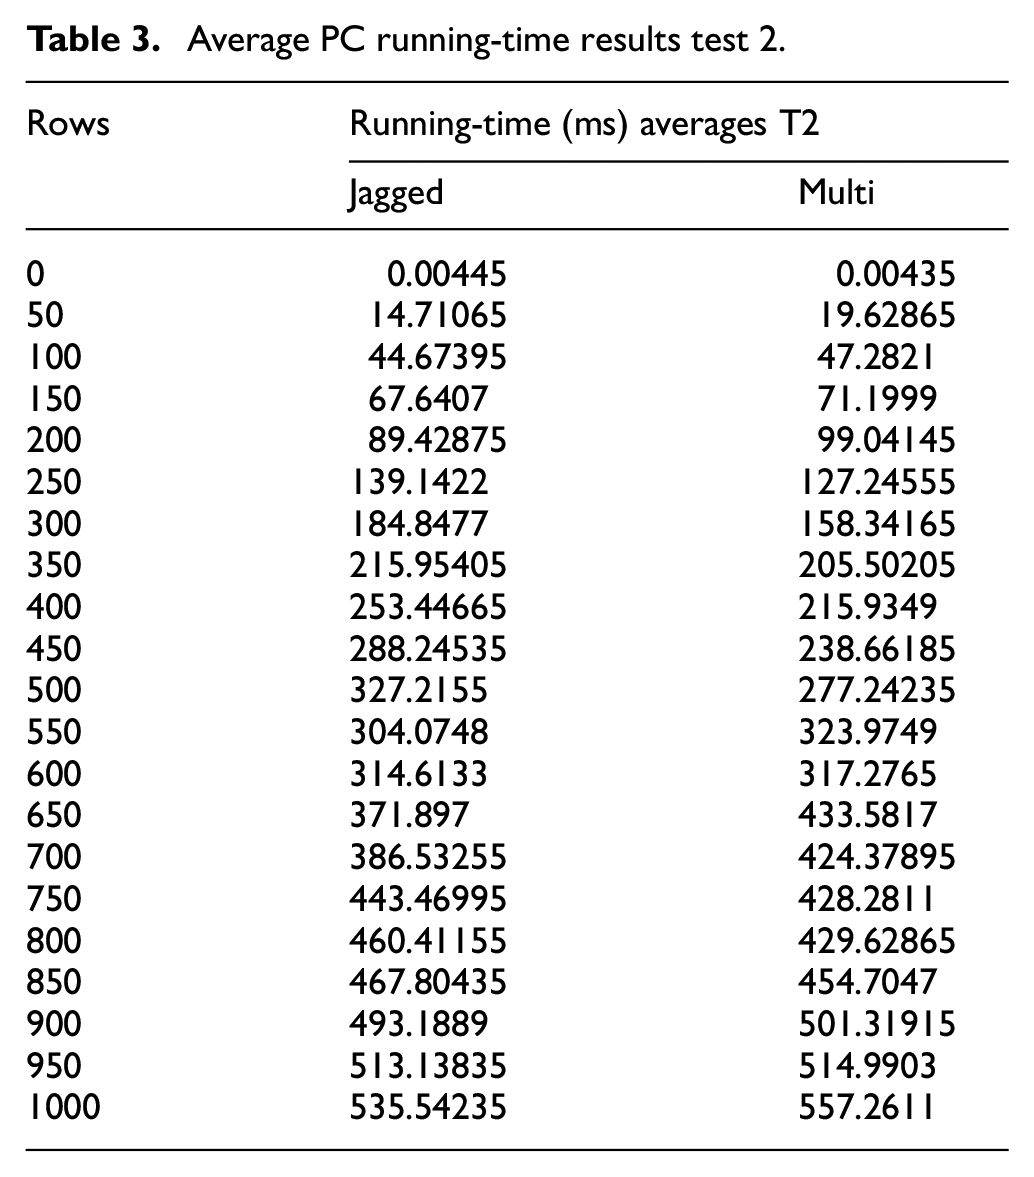
Table 3 shows the post comparative experiment study results for the multidimensional and the jagged array running time complexity which were measured on a computer, using the function’s execution elapsed time measured in milliseconds which was represented graphically in Figure 4.
Average PC running-time results test 2.
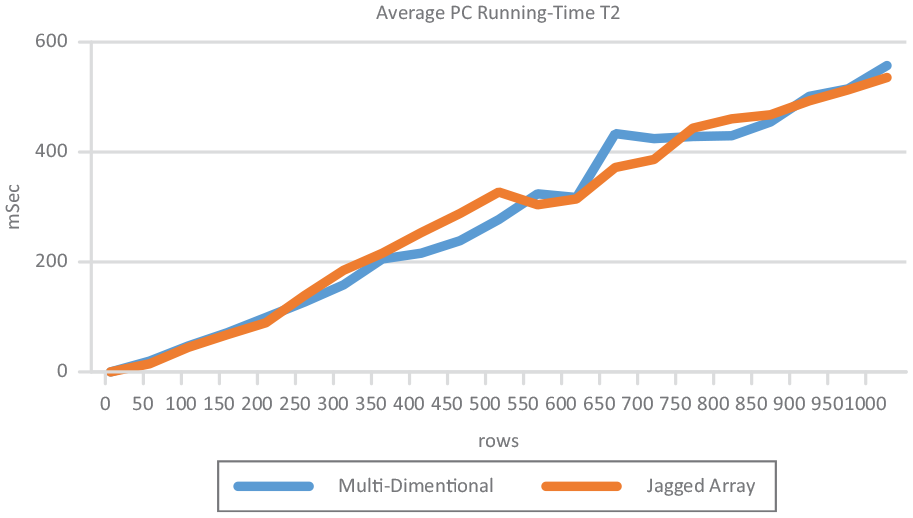
Average PC running-time graph test 2.
The main experiment’s results show a computed average computer running time for the multi-dimensional array to have a standard deviation of 173.1872911, maximum of 557.2611 and minimum of 0.00435 while the average computer running time for the jagged array had a standard deviation of 169.4140719, maximum of 535.54235 and minimum 0.00445. The jagged array scored the least standard deviation and had the least maximum running time.
While Table 4 shows the main comparative results for the multi-dimensional and the jagged array objects created in memory which were measured on a computer using VS 2022 which are represented graphically in Figure 5.
Created objects in memory results.
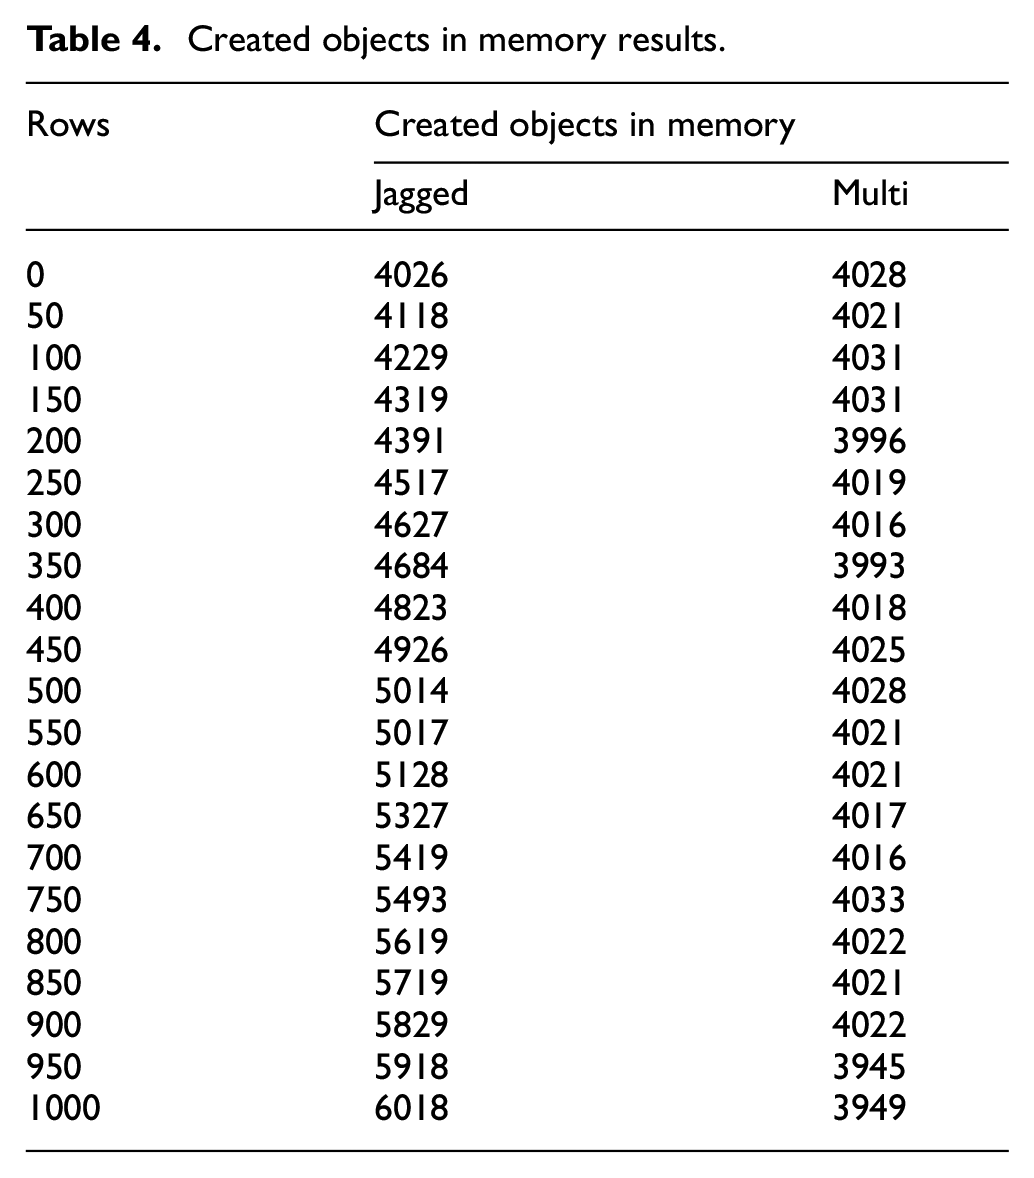
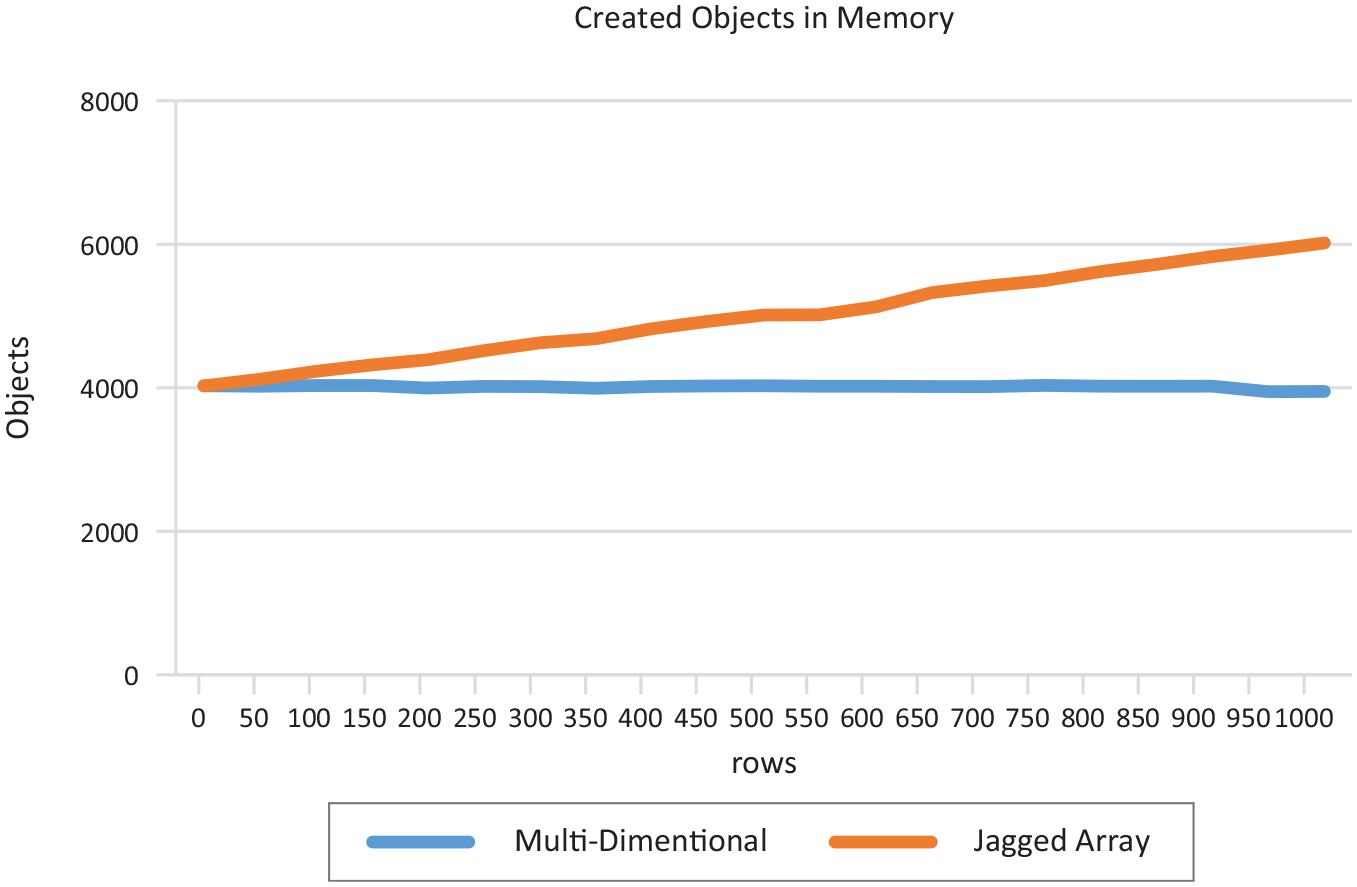
Created objects in memory graph.
On average, the created objects in memory for the multi-dimensional array had a standard deviation of 23.46628788, maximum of 4033 and minimum of 3945 while the objects created in memory for the jagged array were of a standard deviation of 604.44176 maximum of 6018 and minimum of 4026. In this instance, the multi-dimensional array had the least standard deviation, least maximum and the least minimum of objects created in memory.
Table 5 represents the memory heap size results for the main comparative results for the multi-dimensional and the jagged array.
Memory heap size results.
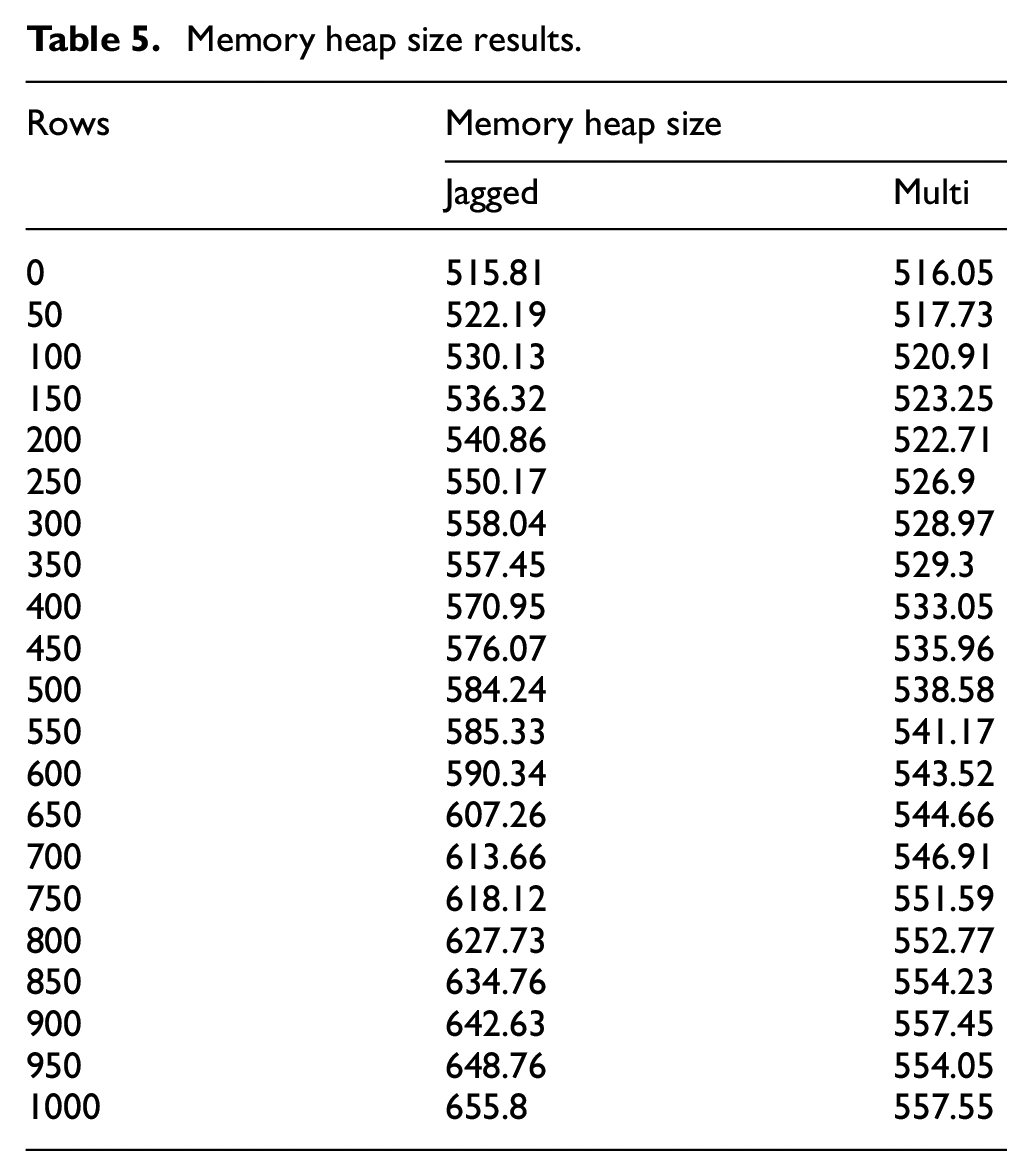
The heap size for the multi-dimensional array had a standard deviation of 13.4414661, maximum of 557.55 and minimum of 516.05 while the heap size for the jagged array had a standard deviation of 42.63093518, maximum of 655.8 and minimum of 515.81. As evident from Figure 6, the multi-dimensional array had the least standard deviation, least maximum and the least minimum heap size in memory.
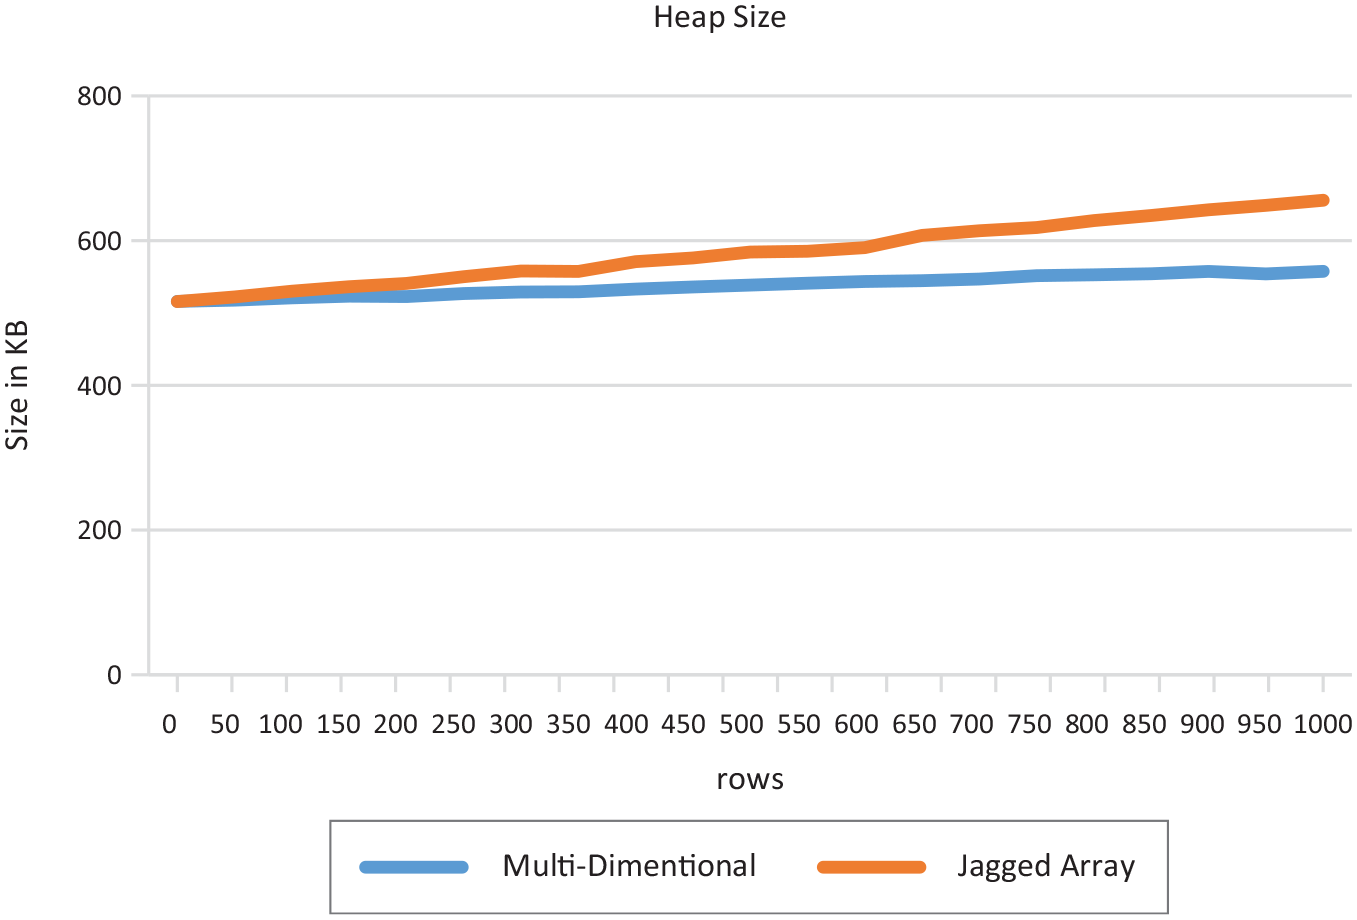
Heap Size Graph.
On the mobile device, the results show a computed average running time for the multi-dimensional array to have a standard deviation of 11,650.40444, maximum of 39,988.131 and minimum of 1078.776 while the average computer running time for the jagged array had a standard deviation of 11,570.65082, maximum of 38,922.274 and minimum 1063.122. The jagged array scored the least standard deviation and had the least maximum and minimum running time as in Table 6 and Figure 7.
Mobile running-time complexity results.
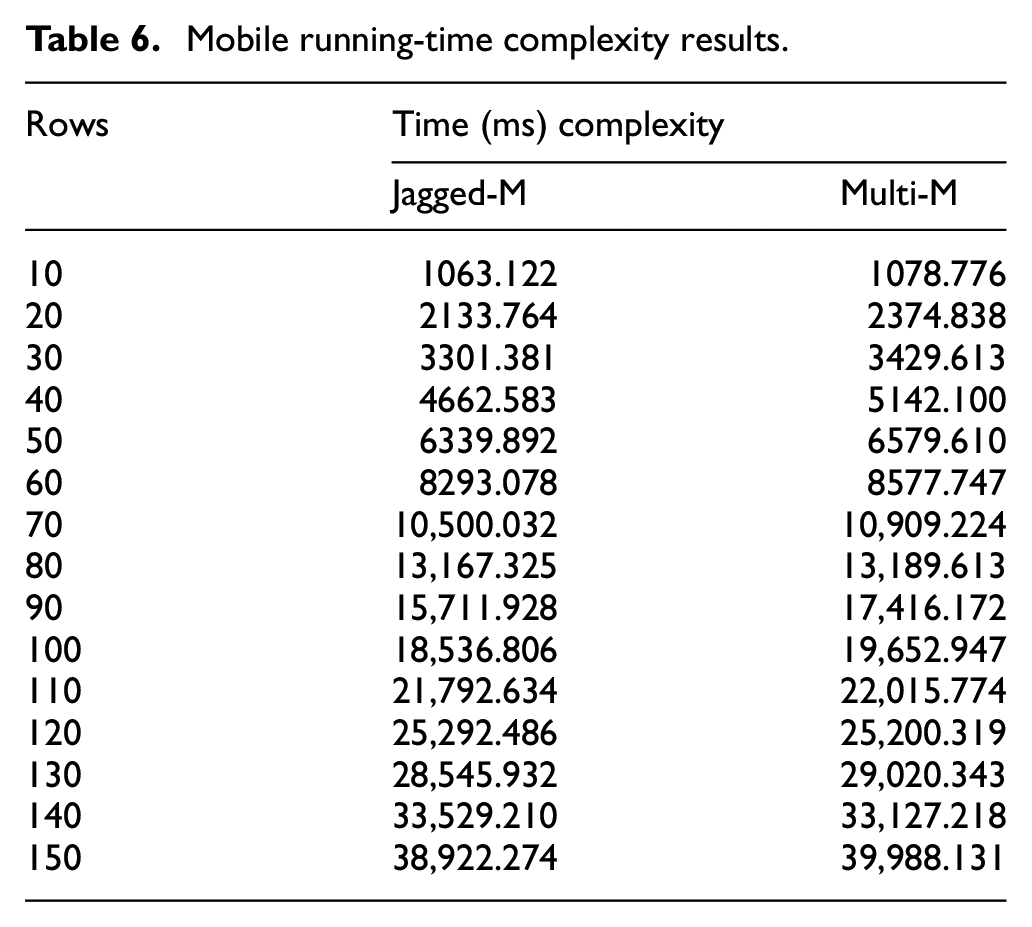
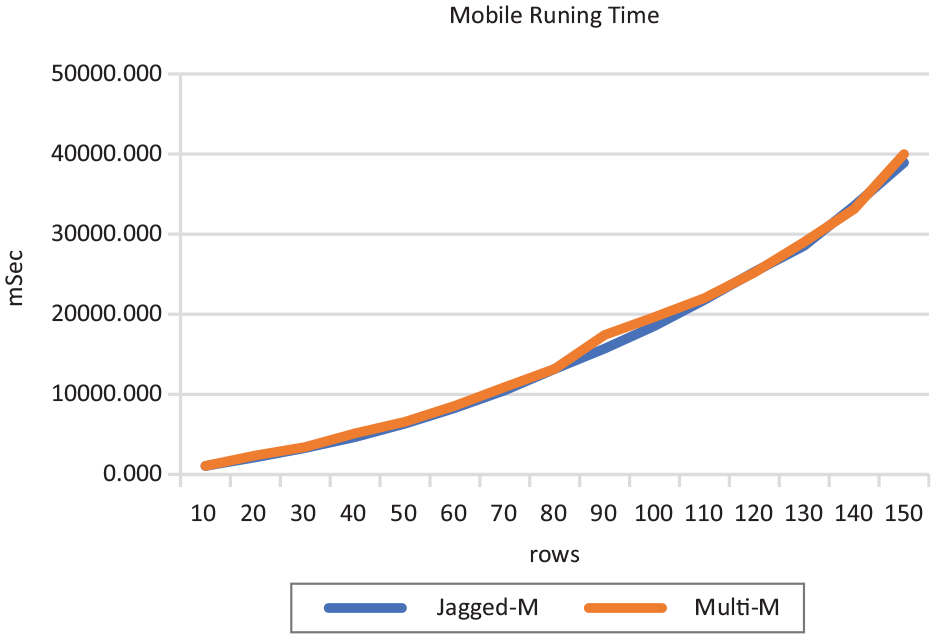
Mobile Running-Time Complexity Graph.
A jagged array outperforms a multi-dimensional array when accessing and iterating the arrays 18 because each inner array can be of a different size, as compared to a multi-dimensional array, where each row element has the same, fixed size as the other row elements in that dimension. 19
From the study results, multi-dimensional arrays’ execution time average standard deviation
And of the models, the sequential minimal optimisation (SMO), iterative reweighted least-squares (IRLS), Fan-Chen-Lin support vector regression (FCL-SVR), linear regression newton method (LRNM) and multivariate linear regression ordinary least squares (ORS) for a multivariate linear regression and logistic regression models, the accuracy loss, log-likelihood loss, logistic loss, and r-square loss were recorded for each respective model.
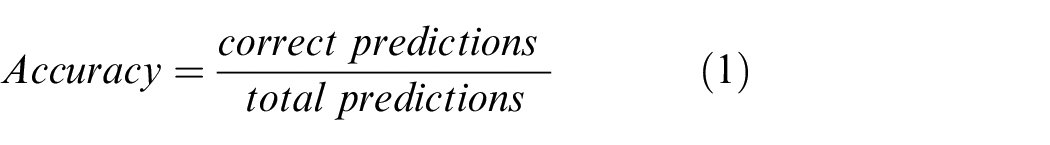
A loss is a number that shows how bad the model’s prediction is. Accuracy is a metric used to measure the performance of a model, defined as in equation (1):
Accuracy loss measures a model’s prediction perfection, where the loss is zero; otherwise, the loss increases for any parameter moving away from zero. 20 While R-squared (R2) measures the goodness-of-fit for linear regression models, used to measure and evaluate the scatter of the data values around the fitted regression line, 21 given as in equation (2):
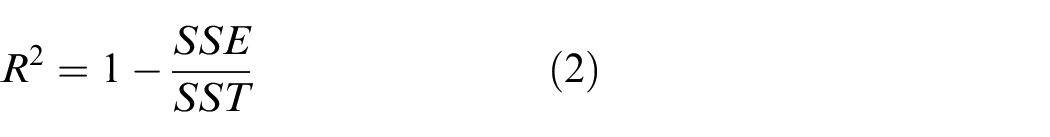
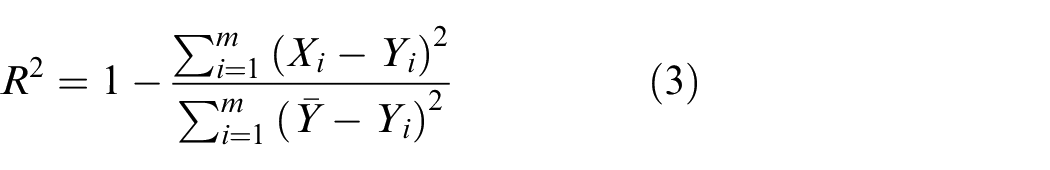
Where R2 is the ratio of ‘Sum of Squares Regression’ (SSR), which is the total variation of all the predicted values found on the regression plane from the mean value of all the values of response variables and the SST is the Sum of Squares Total, which is the total variation of actual values from the mean value of all the values of response variables. Alternatively, it can be computed as shown in equation (3):
Where
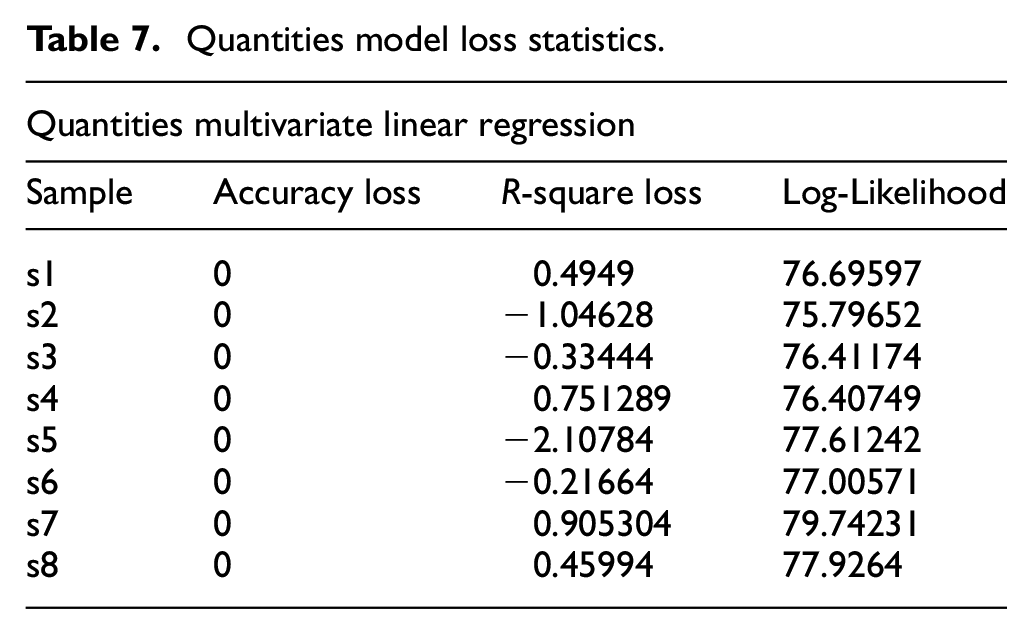
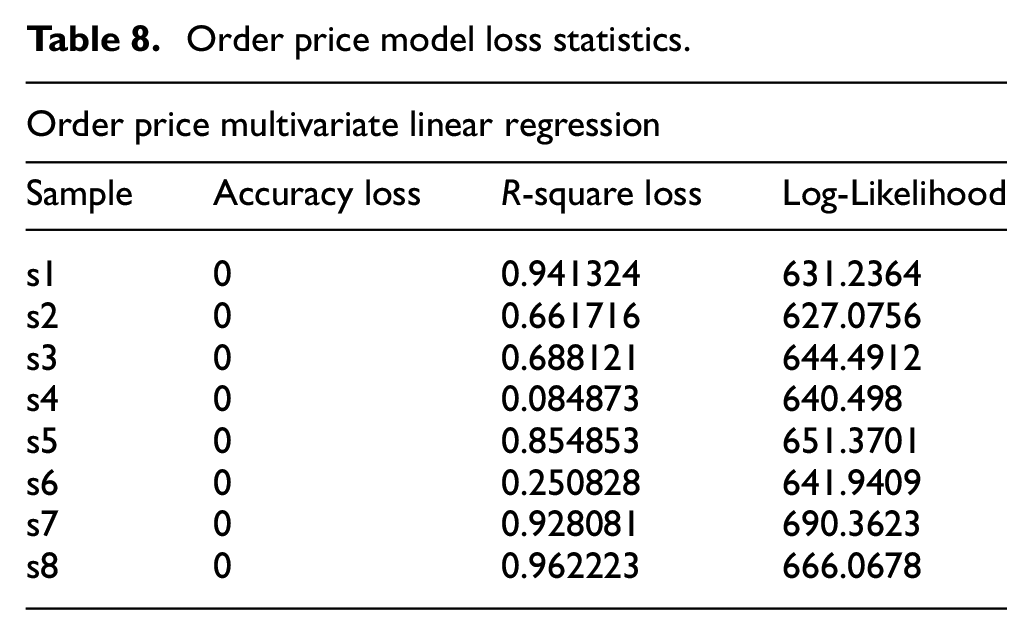
Tables 7 and 8 show the measured accuracy loss for all eight samples. From Table 8, the Multivariate Linear Regression model’s performance is relatively good as most samples, 6 of 8, recorded scores close to 1, above 0.5, with zero accuracy loss. While the Multivariate Linear Regression performance was poor for the quantities to order as observed in Table 7, with four of eight samples recording negative scores, two of eight scorings close to 1, and two of eight scoring average.
Quantities model loss statistics.
Order price model loss statistics.
The Log-Likelihood looks at the likelihood of a particular value of

Log-Likelihood of θ, which makes the optimisation problem easier,23,24 is optimally shown in equation (5):
According to, Analyttica Datalab, 25 ‘the higher the value of likelihood, the better is the fit of the model, as observed in the results displayed in Tables 7–10. All computer algorithms for fitting regression models are based on maximising the likelihood value’. The Log-Likelihood value measures the goodness of fit for a model.25,26
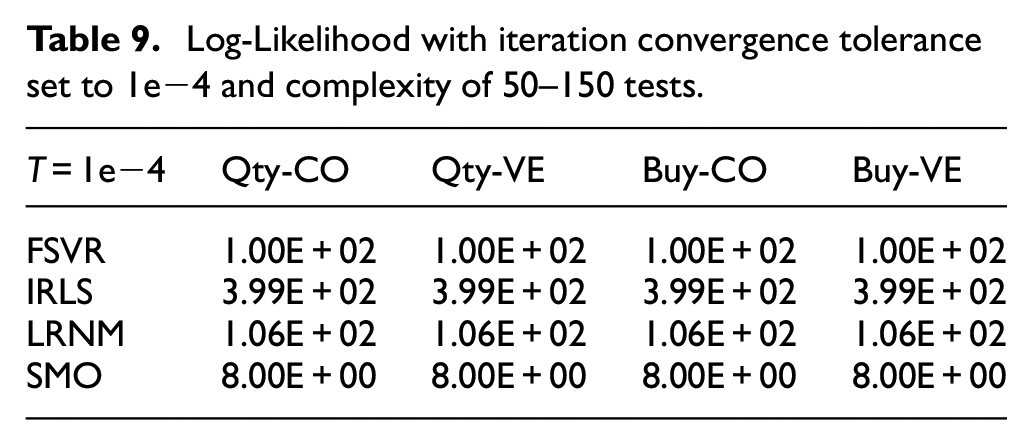
Log-Likelihood with iteration convergence tolerance set to 1e−4 and complexity of 50–150 tests.
Log-Likelihood with iteration convergence tolerance set to 1e−2.
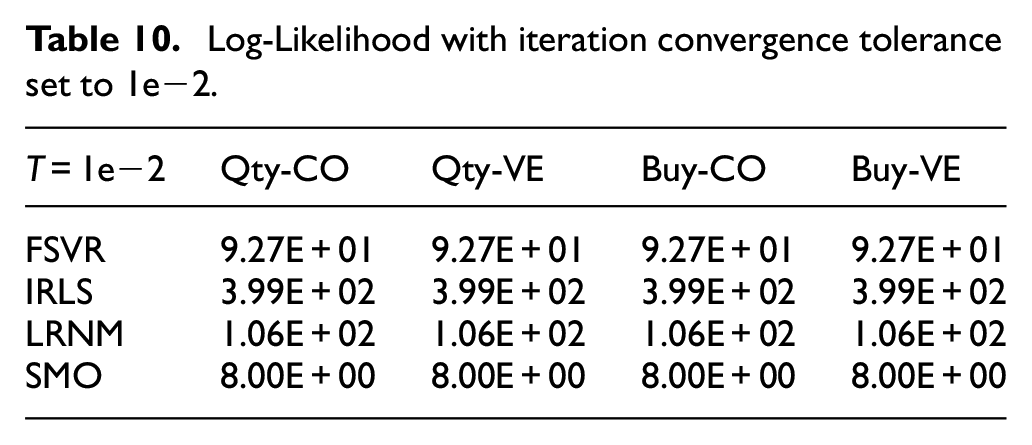
The results in Table 9, as compared to those in Table 10, the FSVR showed improvements for all samples as the models’ tolerance values reduced, with the IRLS having a higher value of Log-Likelihood, better than other models for all scenes.
Another loss measure used in the study was the logistic loss (LL) commonly referred to as log loss. It is used to assess classification models’ performances. The LL indicates how close the prediction probability is to the corresponding actual value, the more the predicted probability diverges from the actual value, the higher the log-loss value, 22 which can be equally calculated using equation (6):
Where n is the number of values observed,
According to Dembla, 22 a model with a lower log-loss score is better than one with a higher log-loss score.
Logistic models heavily use regularisation to avoid a complete overfit, where a model loss function moves towards 0 in high dimensions for all samples. 27
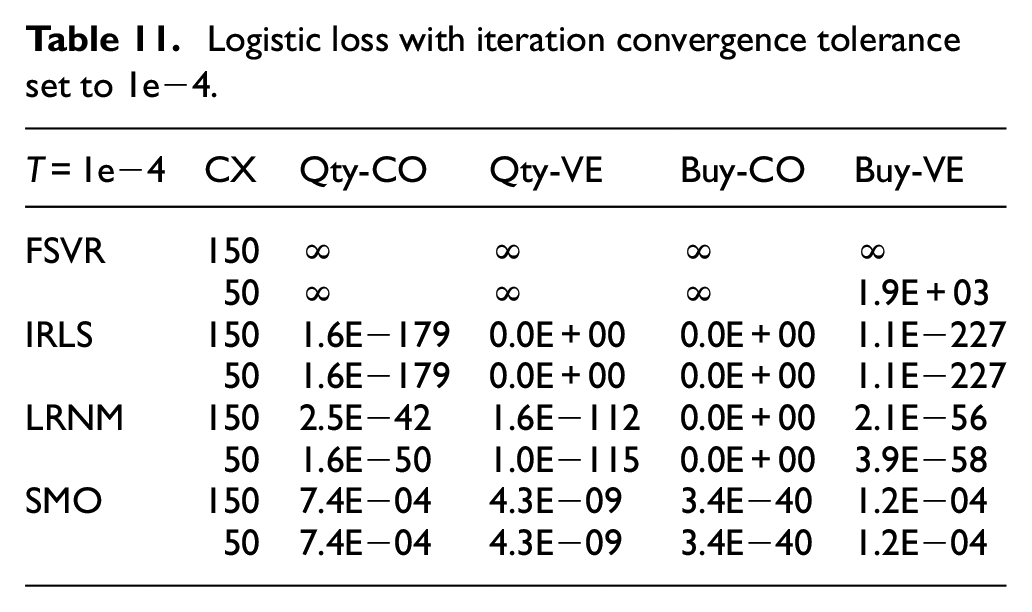
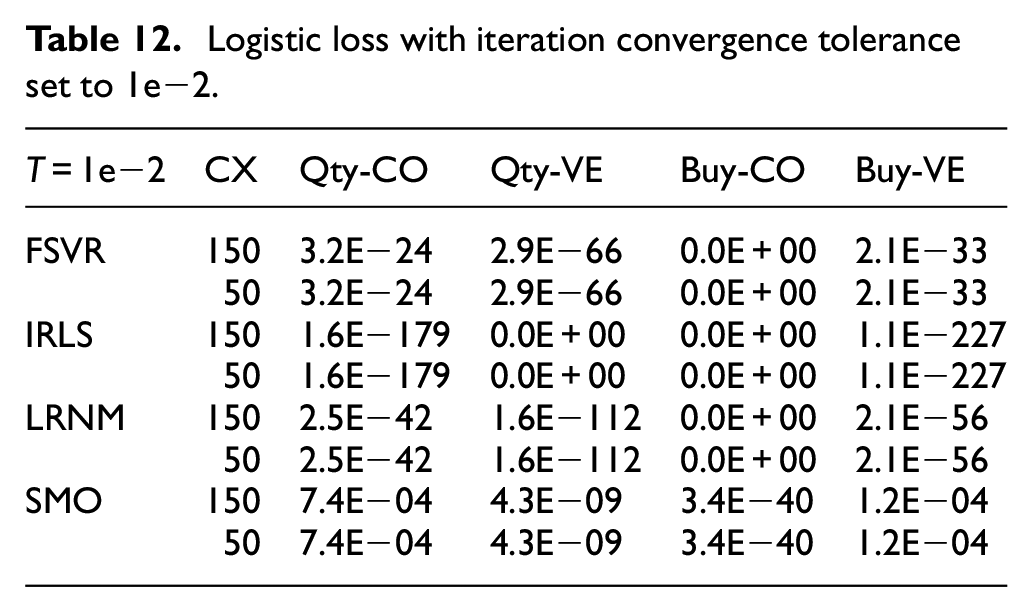
As observed in Table 11, FSVR diverges infinity from the actual values, while IRLS shows the least divergence when the iteration convergence tolerance is set to 1e−4, which is the same as in Table 12.
Logistic loss with iteration convergence tolerance set to 1e−4.
Logistic loss with iteration convergence tolerance set to 1e−2.
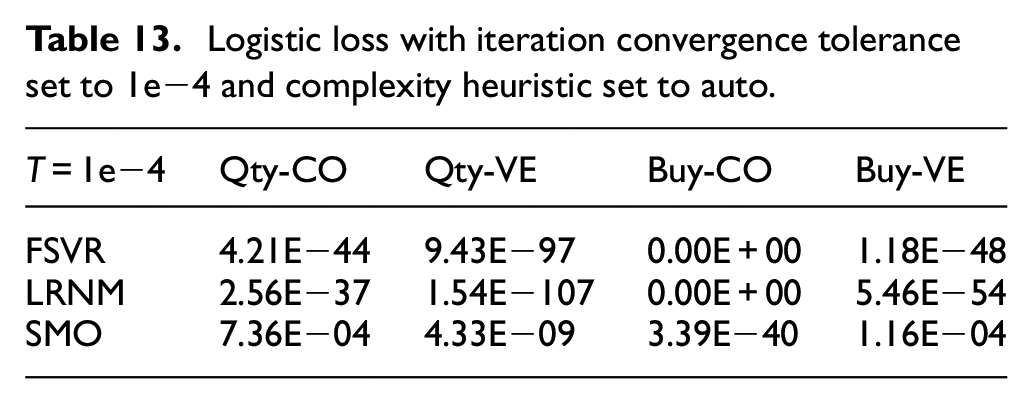
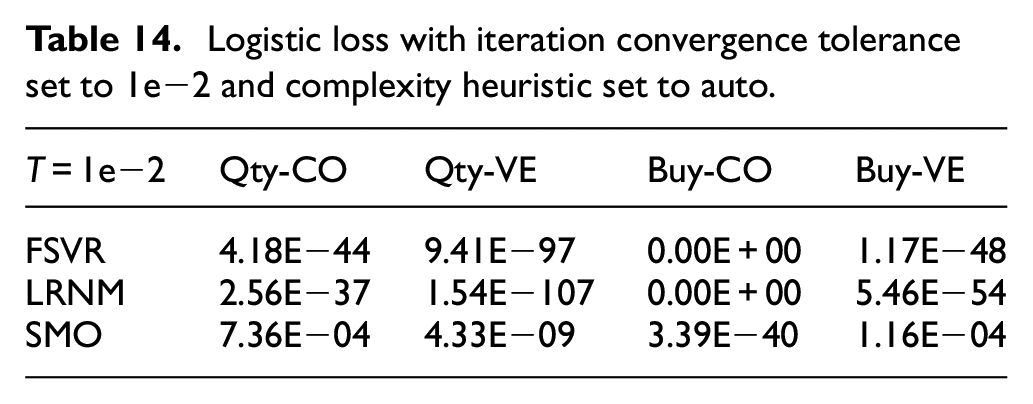
In Tables 13 and 14, where the complexity heuristic was set to auto, the FSVR performed better as compared to the LRNM and the SMO when iteration convergence tolerance where 1e−4 and 1e−2 respectively.
Logistic loss with iteration convergence tolerance set to 1e−4 and complexity heuristic set to auto.
Logistic loss with iteration convergence tolerance set to 1e−2 and complexity heuristic set to auto.
Log loss indicates how close the prediction probability is to the corresponding actual/true value or either 0 or 1 in the case of binary classification, and is calculated as in equation (7):
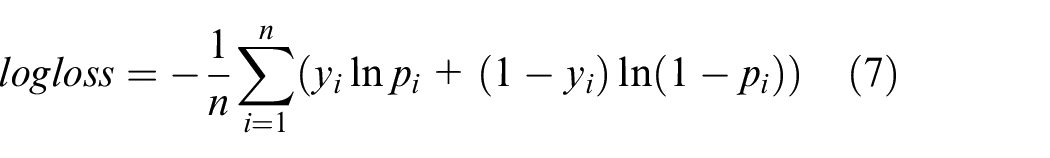
Where y is the actual value observed and p is the predicted probability. When the predicted probability diverges away from the actual value, the log-loss value gets high. 21
Conclusion and implications
This study sort to find out which of the common AI/ML forecasting-predictive models performs better, for use in mobile device applications. And which data structures between the multi-dimensional array and the jagged array are efficient and effective for use with an AI/ML model in mobile-device applications for SME market predictive purposes. This is the first study, to the best of our knowledge that highlights various AI/ML forecasting/predicting models performance benchmarks, and the multi-dimensional array and jagged array parametric performance benchmarks, which can aid anyone in AI/ML model and data structure selection for use in mobile device applications development. The other most important contribution of this study to the body of knowledge is that mobile intelligent application programmers can use the information herein to make effective SME software that will help SMEs with good decision support system (DSS) applications to use for improving their decision-making capabilities using systems with lower-level components operating on local data for providing localised support on a decentralised system.
For the study, it was evident to conclude that jagged arrays have the average minimum execution time on mobile devices and micro-computers, and they equally have the least average maximum execution time on mobile devices and microcomputers as well. However, multi-dimensional create fewer objects in memory and have the least maximum heap size while jagged arrays have a computed least space-length complexity. As noted from the study, and as supported by Allen, 18 Jagged arrays are a better candidate for use in mobile application support systems because they execute faster and don’t use the storage not required. This thereby saves a small amount of memory in comparison to the multi-dimensional array, 18 and by varying the number of columns for each row, 28 memory usage is lowered if there are many rows where some columns are not used. Jagged arrays have the most flexibility, all dimensions are dynamic and will automatically resize as needed. Jagged arrays are technically and structurally considered to be dynamic single-dimensional arrays of a dynamic single-dimensional array type. 28
IRLS has a higher value of likelihood, better than other models for all scenes. The Log-Likelihood value measures the goodness of fit for a model, preferring higher values over smaller ones.25,26
The iterative reweighted least-squares model outperformed most models, followed by the linear regression newton model when the complexity heuristic set. For multi-regression prediction, the multivariate linear regression ordinary least squares models seemed to be the better models for logistic regression and multivariate linear regression respectively. The results, clearly indicate that the iterative reweighted least-squares scored to a better candidate for mobile device logistic regression problems,13,14 with the ordinary least squares method being preferred for the multi-regression prediction problems 17 for a mobile decentralised decision support system.
The other impact of the study will be on the programmers, today, they recognise the importance of saving space while retaining the performance of running applications software. To meet the demands of SMEs in developing countries, software developers need to understand what defines a good working AI/ML model and a good data structure for a decentralised localised mobile system. The impact of this study will help other researchers to identify other specific needs of various market groups and other various predictive systems.
Footnotes
Declaration of conflicting interests
The author(s) declared the following potential conflicts of interest with respect to the research, authorship, and/or publication of this article: I confirm that the materials in the article are meant for research and educational purposes. This was original research, and it was conducted to contribute to the body of knowledge. No animals were used nor injured during the study course. All authors herein mentioned, participated in the conception and design, analysis, interpretation of the data, and drafting of the article. This manuscript has not been published in any publishing venue, nor is it under consideration for publishing elsewhere. The authors have no affiliation with any organisation that have a direct or indirect financial interest in the subject matter discussed herein, nor did any author receive research funding for this study. All the authors who participated are not employed by any company that has a sole interest in the article, nor is the author herein mentioned holding stocks or shares in any company which might be affected by the publication of your paper.
Funding
The author(s) received no financial support for the research, authorship, and/or publication of this article.