
Abstract
The non-intrusive appliance load monitoring (NILM) decomposes the total power consumption of a power system into its contributing appliances. Previous studies only considered using the total power consumption information of appliances to decompose the load consumption. Besides the total electricity consumption, there is also important information such as current, voltage, and time in the total electricity consumption data, which can be used to analyze the load consumption information. Therefore, we proposed a sequence-to-sequence network enhanced by an attention mechanism, which effectively integrated the external features besides the total electricity consumption in grid data. Finally, we applied and evaluated the proposed model on the electricity consumption data of a gas station with 12 appliances, and our model achieved a 90.5% accuracy in load decomposition. Our solution provides a new solution on the application of NILM in the industrial field and helps to manage energy more rationally.
Keywords
Introduction
With the development of science and technology, the intelligent power systems covered a wide range of applications, including power monitoring systems and energy management systems.1,2 Industrial electricity consumption accounts for a large share of global electricity consumption. 3 Understanding the electricity consumption of industrial infrastructure can help reduce and optimize the power consumption of industrial infrastructure. 4 Non-intrusive appliance load monitoring (NILM) is an important research direction in intelligent power systems that have become the focus of researchers in recent years.5,6 NILM breaks down the total power consumption of a power system into the contribution of a single device. The NILM methods can further obtain electrical information, which can help reduce power consumption costs and enable a more rational allocation of power resources.7–9 Although most NILM research focuses on household energy use due to the difficulty of obtaining data, applying NILM to the industry has gradually gained wide attention in recent years.10–14
In recent years, there is growing use of computer-aided models (e.g. signal processing, machine learning methods, and deep neural networks) in various fields such as medicine, economics, and industry, 15 which have also been used to solve NILM problems.16–18 A method of continuous wavelet transform (CWT) was proposed by previous studies to explore the electrical characteristics of the transients of NILM switching voltage and was compared with the previously used short-time Fourier transform (STFT). 19 The researchers designed an algorithm combining sliding windows and neural networks for high-frequency household electricity data load decomposition and achieved excellent performance. 16 Since the collection, transmission, and storage costs of high-frequency power data are high, there are limitations in real practice. The decomposition of low-frequency power data is more beneficial in the grid. There have been many studies using machine learning methods for NILM of low-frequency data.20,21 The factorial hidden Markov model (FHMM) of the load was established to transform the NILM problem into the optimal combination states problem. 22 The application of deep learning is a research trend recently, and many models have been proposed such as deep neural networks (DNN), gated recurrent unit (GRU), long short-term memory (LSTM), and co-attention network.23–27 Rafiq compared the structure of LSTM and GRU in detail, and discussed the effect of hyperparameter and regularization on the performance of load decomposition. 23 A recent study proposed a multi-feature combination multi-layer LSTM model for generating the modified input data for improving the classification performance, which was superior to the existing methods based on the GRU or a single-layer LSTM. 24 To overcome the problem of ignoring inter-device dependence in the existing single-task learning method of DNN model, some researchers proposed UNet-NILM for state detection and power estimation of multi-task devices, applying multi-label learning strategy and multi-objective quantile regression. 25
However, most previous deep learning-related studies only use the total power as input. Meanwhile, the attention mechanism has been successfully proposed in the field of multi-modal feature fusion such as image and text, which makes it possible to introduce external features based on the attention mechanism to increase the performance of NILM.
To integrate the external features in the model and fill the gap of NILM in industrial and commercial applications, this study proposed an attention mechanism-based NILM model. Since the industrial electricity sampling frequency is low, the electrical data volume is large, and the electrical state is complex, the K-means algorithm was used to cluster the two-dimensional load features in a steady state and then a combined code was obtained to reduce the dimensionality of the electrical state. Subsequently, the proposed model performed a load decomposition on the multiple features of the input. Finally, the proposed model achieved a 90.5% accuracy in load decomposition on gas station electricity consumption data.
Methods
The NILM (equation (1)) aims to obtain the power of each appliance from the decomposition of the total energy consumption information.

Where
Combined encoding
There are four categories of electrical loads: switched, continuous use, continuously variable, and limited state. 28 The NILM can be regarded as the appliance operating state combination problem, because each appliance’s operating state (all have rated power) is finite.

where S is the working status.
To get actual load representation for appliances in each state, we set the initial number of clusters of the K-means algorithm, which has a wide range of applications in the field of NILM,29,30 to the number of operating states of the appliance, and then cluster the active power and reactive power.
Then, we define the state of the M appliance at a certain moment as y:

where
Then the NILM problem can be further transformed into equation (4).

Finally, the problem is transformed into predicting the state codes of the appliances using the total electricity consumption information, and then corresponding the state codes to the actual power to achieve load decomposition.
Baseline model: LSTM-based seq2seq network
The LSTM (Long-short-term memory, Figure 1) includes input layer, hidden layer, and output layer. We represent the input of a time series as x and the output as h. At each time step, each LSTM cell updates six parameters. The LSTM can alleviate the gradient disappearance and explosion problems and is often used to learn long-term information about a sequence. 31
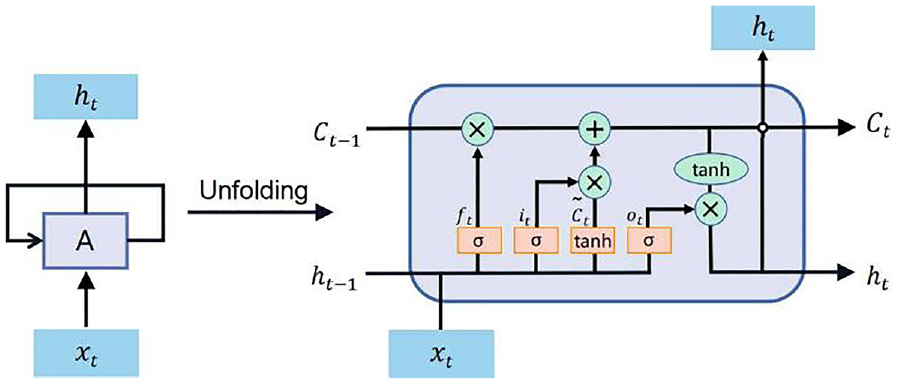
LSTM’s internal topology.
Attention model
Based on the seq2seq model, we proposed an attention model to fuse voltage, current, and time information. Figure 2 shows the overall structure of our model. The original seq2seq model encodes the total electricity information into the hm vector through the coding unit, and then analyzes the electricity consumption state coding of each appliance by decoding the hm vector. In this paper, we effectively fused the current, voltage, and time information with the coding vector through the attention module to generate a new coding vector M, and then completed the load analysis of different electrical equipment by decoding the M vector. The attention model acts as an internal unit to find intermediate representation features based on the combination of features from different sources. We obtained an external feature based on external information and a coded feature based on coded information, and then we computed a multimodal gate to fuse them because different data depend on external information differently. The definition of the Attention model is as follows:


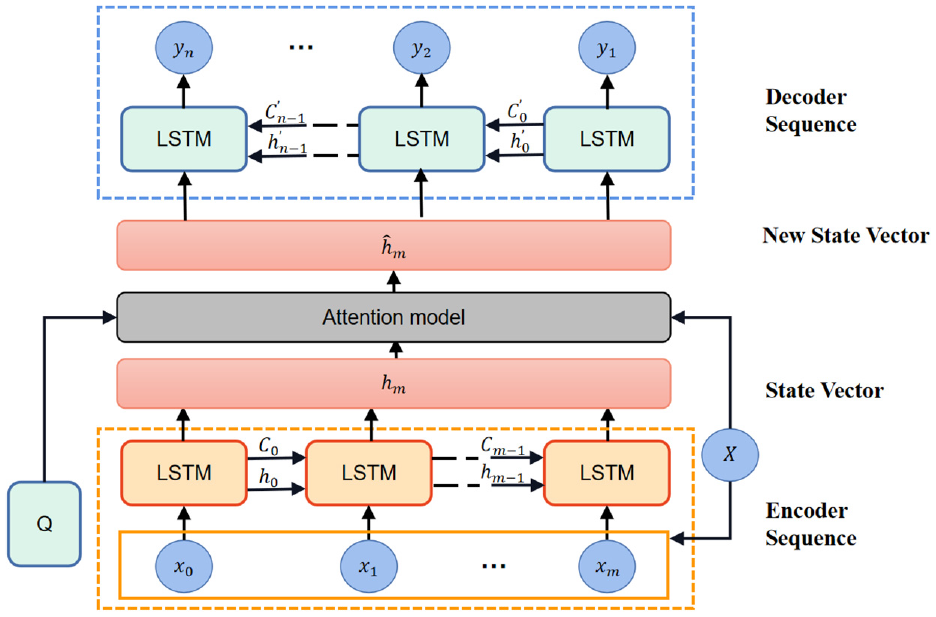
Attention mechanism enhanced sequence-to-sequence network structure diagram. The original seq2seq model encodes the total electricity information into the hm vector through encoding unit, and then analyzes the electricity consumption state coding of each appliance by decoding the hm vector. The attention model acts as an internal unit to find intermediate representation features based on the combination of features from different sources.
where
Model design
In this study, we proposed an attention mechanism enhanced sequence-to-sequence NILM model. The LSTM unit is a specialized neural network structure that is commonly used for processing sequential data because it can capture dependencies over time. In our model, the output of each LSTM unit becomes the input for the next time step, so each input data point needs to be matched with an LSTM unit.
Since our data was collected every 15 min, there were 96 time points in a day. We used 1 day’s worth of data as a batch for the model’s input and output. Therefore, to ensure that the LSTM unit can capture information from each time point, we chose to have 96 LSTM units per LSTM layer. This enables each LSTM unit to model the information at each time point and pass it as output to the next LSTM unit.
Thus, in this model, the number of neurons in the LSTM unit should indeed be equal to the number of time points in the input and output data. This ensures that information from each time point is effectively passed and captured, allowing the model to better learn and predict the data.
The stochastic Gradient Descent (SGD) optimizer was used to train our model, 32 with learning rate (LR) of 0.001 and momentum of 0.99, and we set the number of epochs to 50. 33 For detailed process of determining model parameters, please see Section Results and Discussion.
We divided the working states according to the working mode of appliances, and obtained the representative electrical characteristics of appliances in different states by clustering the active (P) and reactive power (Q) of the appliances with the K-means algorithm. Then, we combined the states of all appliances at a certain moment into a new integrated state, and at the same time, we extracted the electricity, voltage, power, current, electricity, power factor, and time information from the total electricity consumption data. The electrical data collected from each appliance sub-meter and the total electricity consumption data were used to build the model, and we randomly divided the total data into training set, validation set and test set according to 8:1:1 for model training, parameter tuning, and verification of model performance, respectively.
We train our proposed model with extracted electrical features and integrated state codes. When the model is trained, the integrated state codes are obtained by inputting appliance features and thus indexing the power of the appliance to complete the load decomposition.
Experiments and results
Data acquisition
We collected electricity and power data for 191 days from December 2020 to August 2021 at a gas station in Jinchang, Gansu Province. To avoid safety hazards, the Internet of Things (IoT) devices were not installed in the gas station operation area, but on switches in the main distribution room. We installed the acquisition devices and sensors at the end of the appliances and the distribution room, respectively. In practice, many devices are connected to the same assembly line, and multiple devices could be controlled by switches in the distribution room as needed. Electrical data collected by sensors match real-world reality due to the largely uniform deployment of switch-controlled electrical equipment.
We use snap-on current transformers to connect the acquisition device to the energized conductor (Figure 3(a)). The collection devices collected electricity consumption data (one for 15 min) for all appliances (Figure 3(b)).
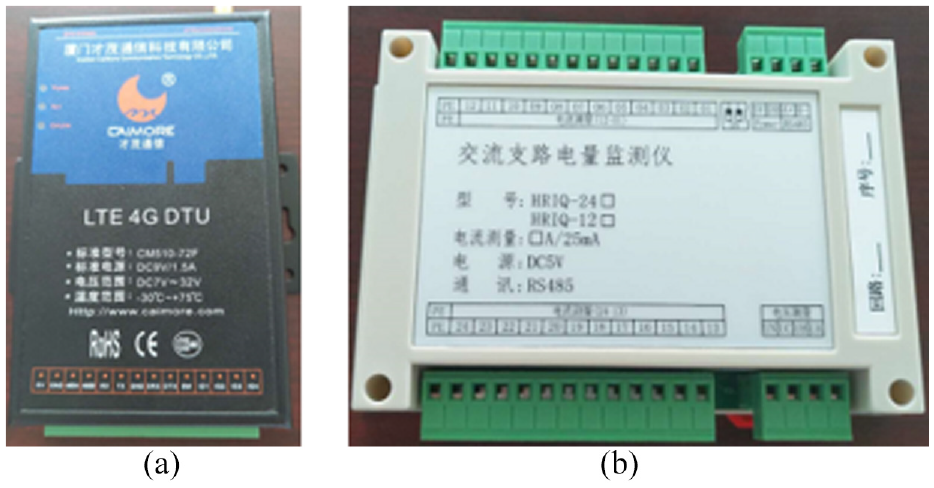
Data acquisition equipment: (a) snap-on current transformers and (b) AC branch power detector.
We measured several measurements of the 12 appliances of the gas station, such as active power and reactive power. All these appliances are gas station facilities, including Submersible Pump (A1), Central Air Conditioning (A2), Canopy Lights Strip (A3), Uninterrupted Power Supply (UPS, A4), Kitchen Socket (A5), Integrated Office Socket (A6), Lounge Socket (A7), Outdoor Advertising SignageCounter socket (A8), Counter Socket (A9), Convenience Store Socket (A10), Freezer (A11), and Canopy Lights (A12). Convenience Store Socket, Counter socket, Kitchen Socket, Lounge Socket, and Integrated Office Socket combine the electrical characteristics of small appliances throughout the room. UPS provides 24 h uninterruptible power supply for devices that require high power supply stability and is in standby mode most of the time. Freezers, Canopy Lights, Outdoor Advertising Signage, Canopy Lights Strip, and Central Air Conditioning are high-powered appliances that have multiple operating models and are time-sensitive. The measured values of the Submersible Pump denote the sum of the electrical characteristics of all the refueling units. Since fuel dispensers operate 24 h a day, it is difficult to determine the complete duty cycle.
We obtained the power factor, power, current, voltage, electric quantity, and electricity data from the power company’s data center. Figure 4 compares the total power consumption data with the sensor data (18consecutive days were randomly selected), and the trends and magnitudes of the two curves are generally consistent, which indicates that the sensor data are reliable.
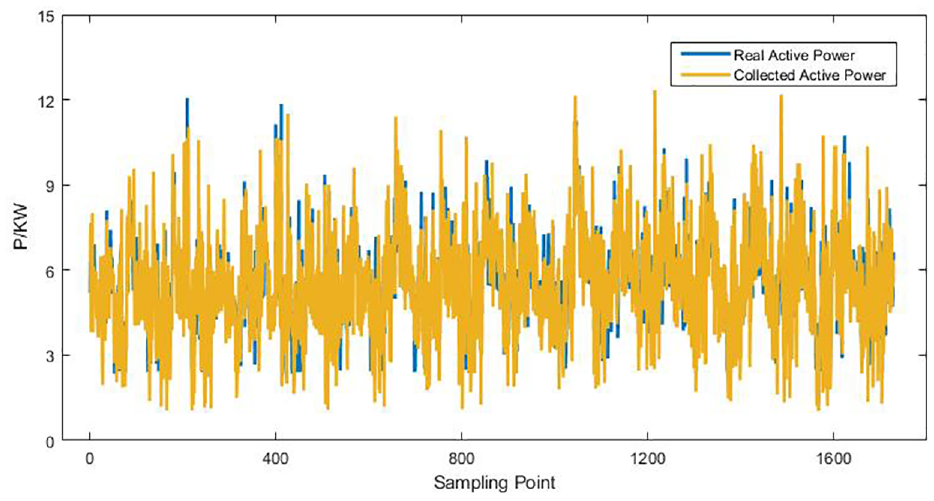
Comparison of collected data and real power data.
Performance evaluation
The 191 days of data was randomly divided into training set, validation set, and test set by 80%, 10%, 10%. The performance of our model was evaluated on the test set using two categories of metrics34,35: the first category includes accuracy, recall, precision, and F1 score, and the second category consists of mean absolute error (MAE), and Root Mean Squared Error (RMSE). The first category compares the difference between the predicted and actual states, and the second category compares the decomposed power signal with the real (equations (11) and (12)). We used several methods for comparison, including K-nearest neighbor, support vector machine, and random forest. To further verify that our proposed fusion mechanism works, we also compared the soft attention mechanism, the hard attention mechanism, and the baseline model.
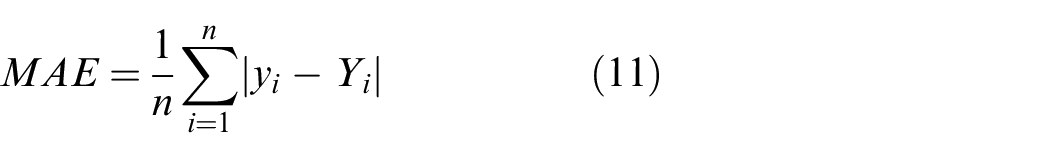
where
Results and discussion
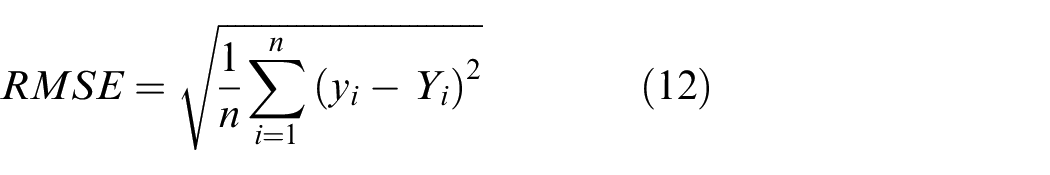
Figure 5 shows the operating states and the corresponding active/reactive power of each appliance that we obtained by K-means clustering.
The working state and power value of the appliance (S1 means status 1 and so on).
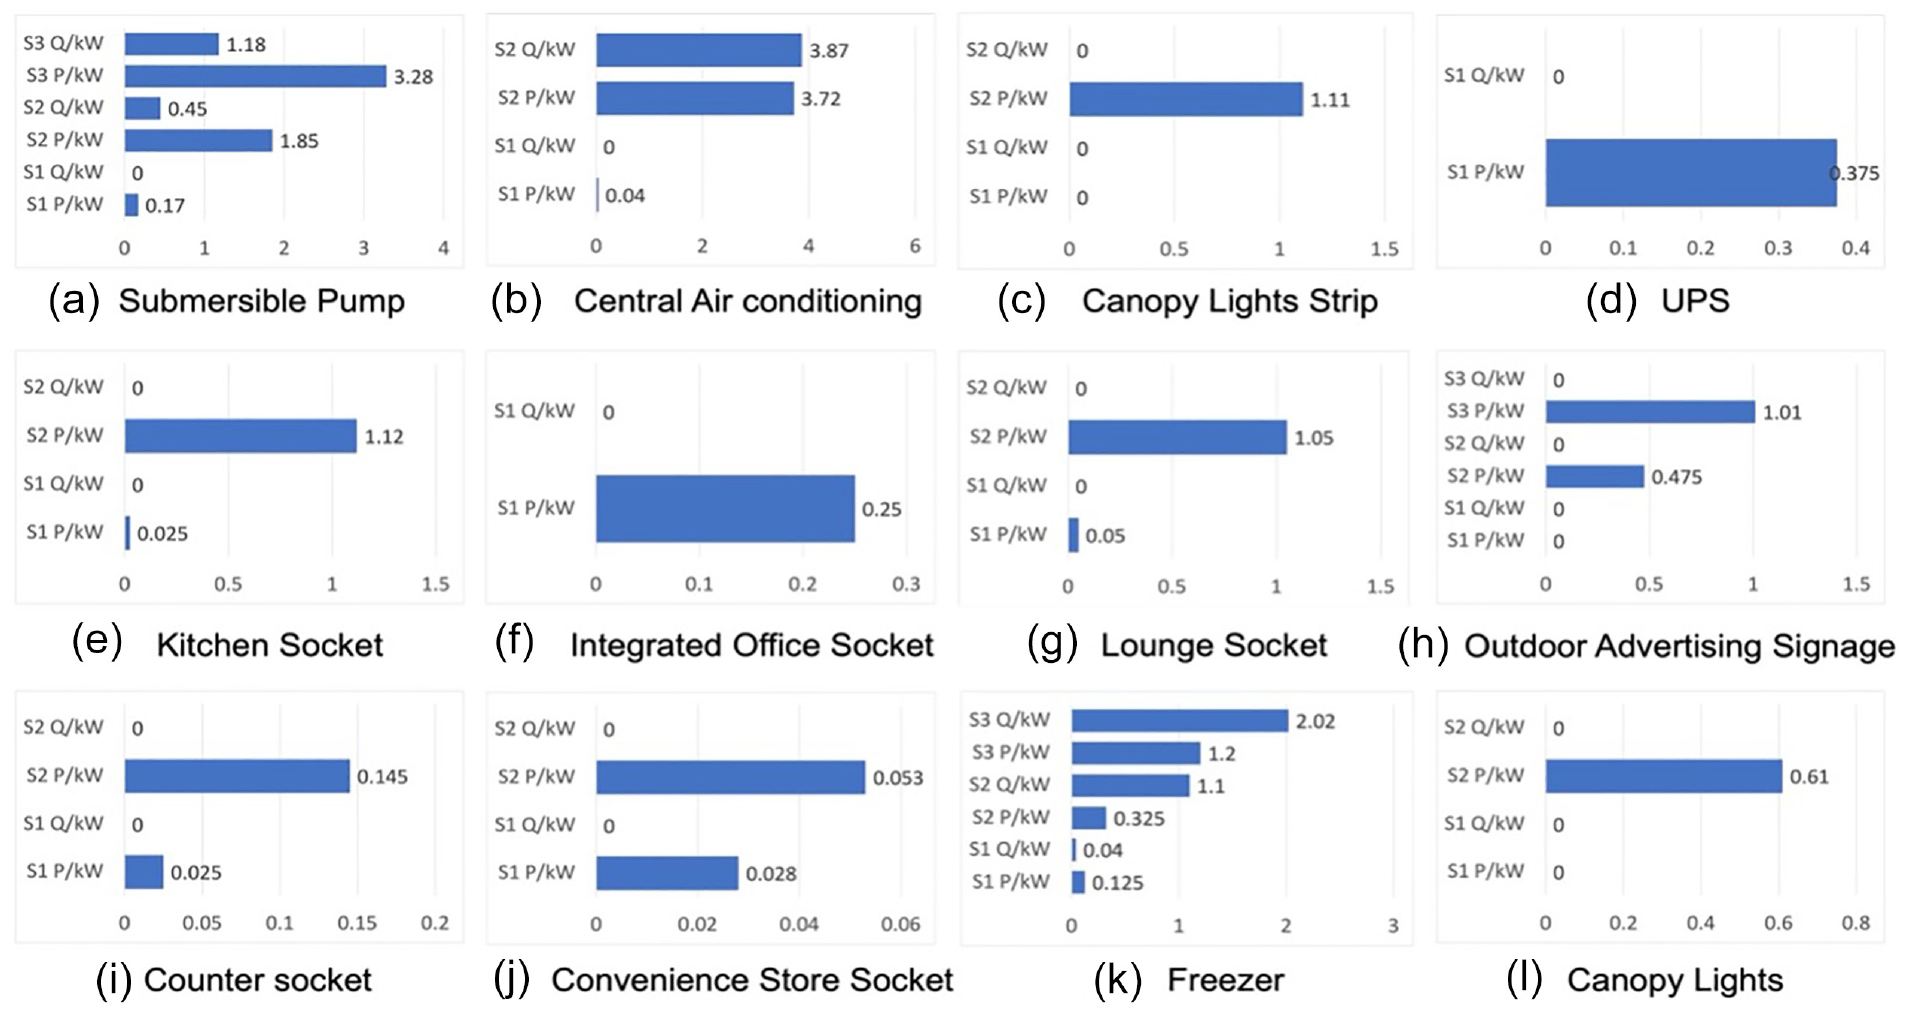
Figure 6 compares the power values of all appliances before and after coding. The figure shows that the yellow curve of index power values fits the blue curve of the actual power better, indicating that the state of the appliances we are defining is more accurate. Figure 7 shows the performance of state prediction, where the index power value (P) is the actual power for each operating state.
Comparison of P and actual power of all appliances.
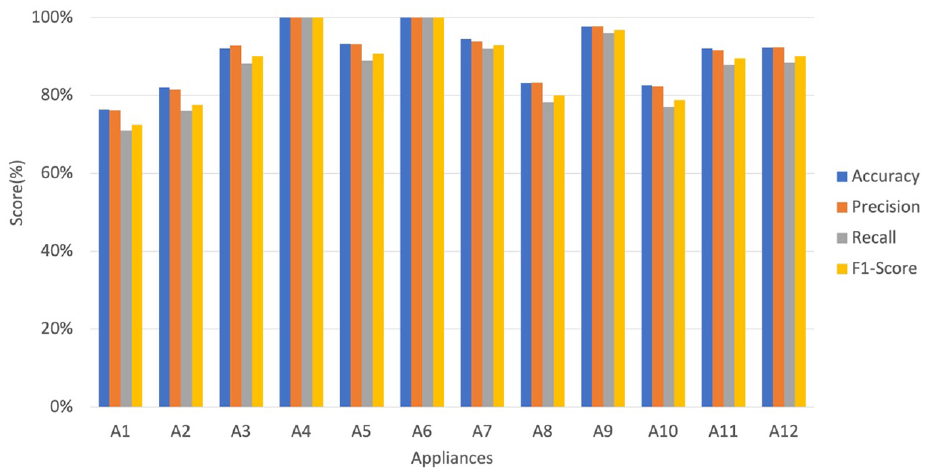
The performance of state prediction.
Figure 8 shows the mean accuracy, MAE, and RMSE of our proposed model and other comparable models. Our model achieves an accuracy of 90.5% and an MAE of only 16.15, which is better than the other models. The results show that the proposed method is able to enhance the capability of the baseline model by introducing electrical features (such as power) based on the attention mechanism. Besides, Figure 9(a) shows the MAE, RMSE, and accuracy performance of our model on three datasets: training, validation, and testing. As shown in the table, the final test performance of the model is with an accuracy of 0.905, and the MAE is equal to 16.15. Figure 9(b) shows the trend of loss changes for models with different epochs. For the convenience of differentiation, we use blue dots to represent the losses during the training process and red connecting lines to represent the losses during the validation process.
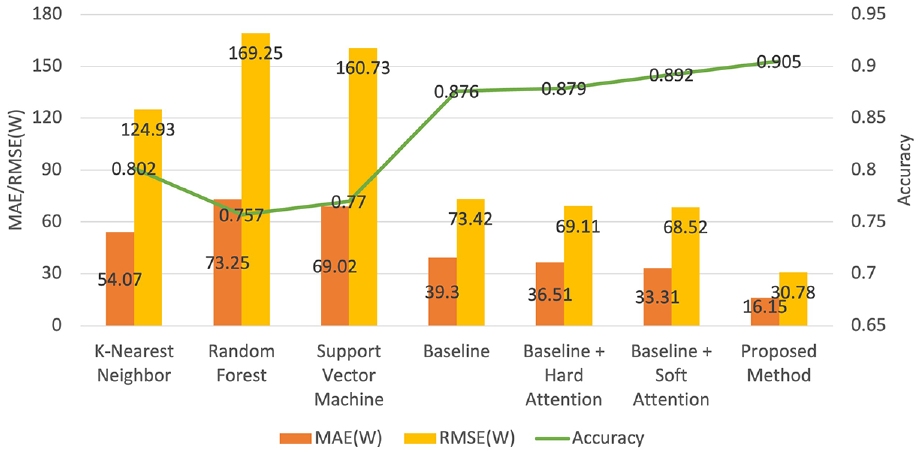
Model performance.
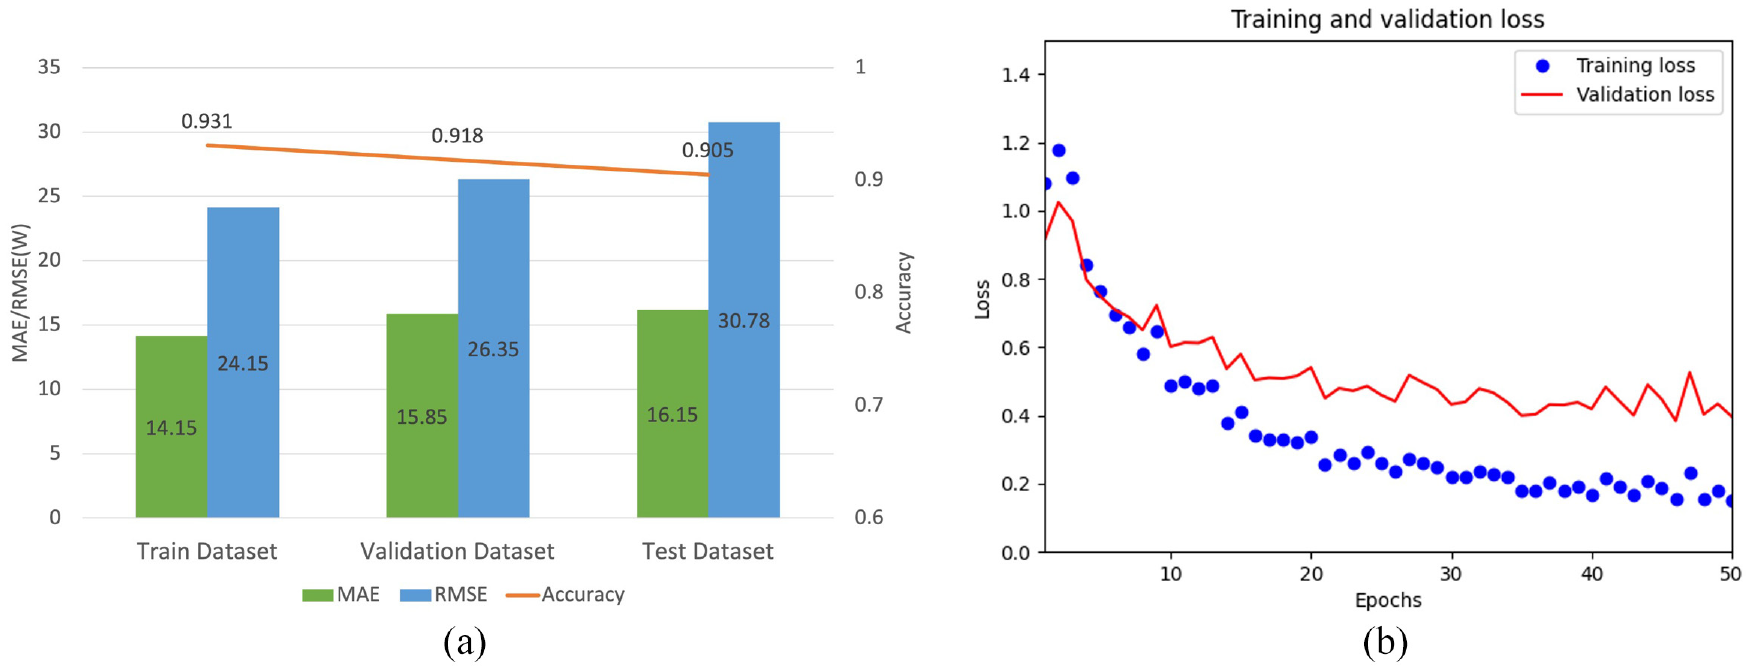
The performance and loss values of different datasets: (a) performance of the proposed model on different datasets and (b) the loss values of the train and validation datasets at different epochs.
Notably, to determine the parameters of the model, we compared the performance of the model when using different optimizers (e.g. SGD, Adam, and RMSprop 36 ), and we also compared the performance of the model at different learning rates (Figure 10). It can be seen from the results that when the optimizer is SGD, the MAE and RMSE values of the model are the lowest and the accuracy is the highest, while the model performance is the best when the learning rate parameter is 0.001 with the SGD optimizer.
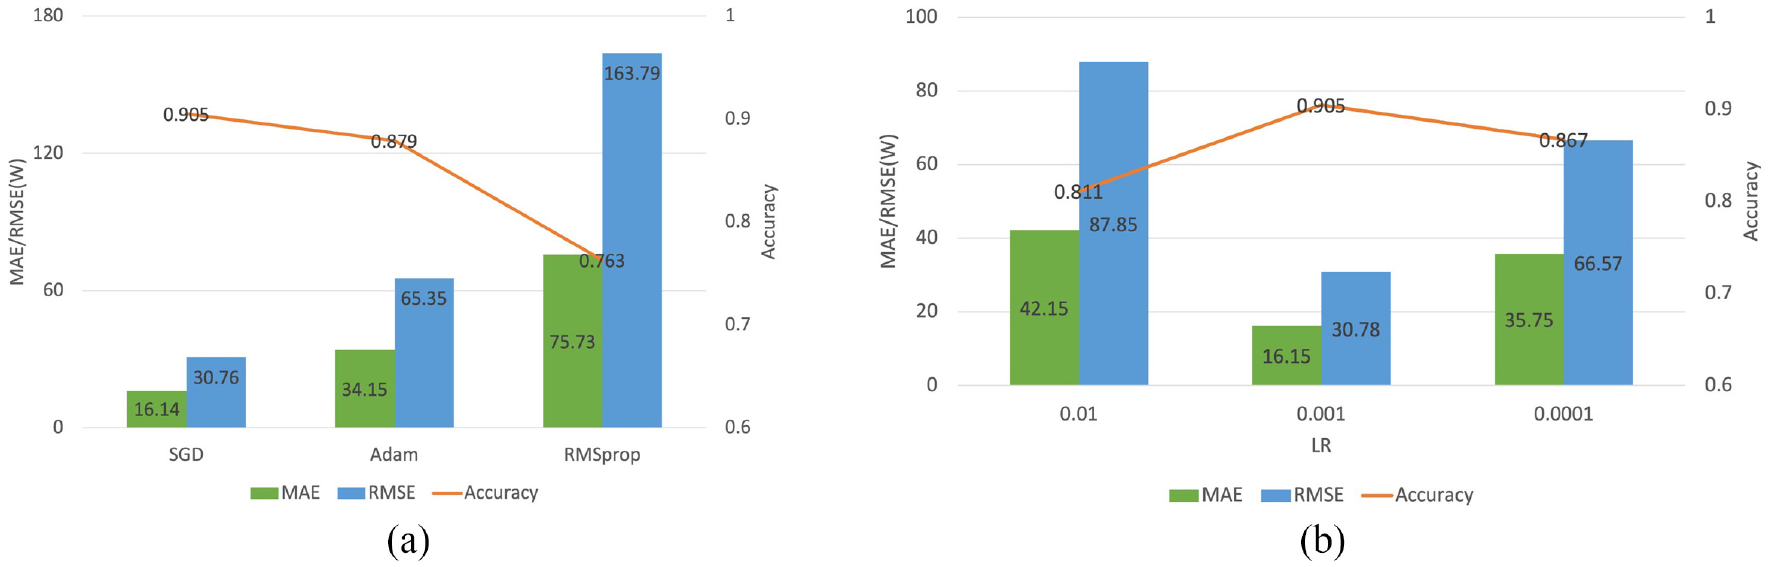
The process of determining model parameters: (a) impacts of optimizers on model performance in the test dataset and (b) impacts of learning rate on model performance in the test dataset, with optimizer = SGD (LR = learning rate).
The predicted total power of our model is very similar to the actual total power, which indicates that our model is very reliable (Figure 11).
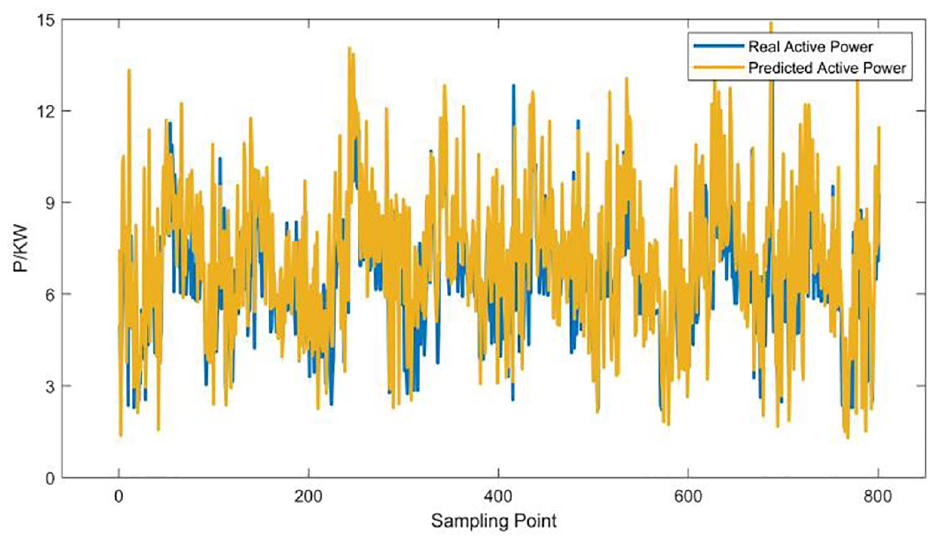
The comparison of predicted power data and real data.
According to the algorithm proposed in this study, the load decomposition can be calculated to get the proportion of energy consumption of each electrical appliance, as well as the corresponding cost. By analyzing the energy consumption proportion of all electrical appliances, we found that the most energy-consuming one is the Submersible Pump (Figure 12). Canopy Lights Strip, Kitchen Socket, Integrated Office Socket, and Outdoor Advertising Signage account for nearly half of the total energy consumption. The other appliances consume a smaller percentage of energy due to their low working power or less frequent use. These results are helpful to reduce the cost of power consumption and optimize the allocation of power resources.
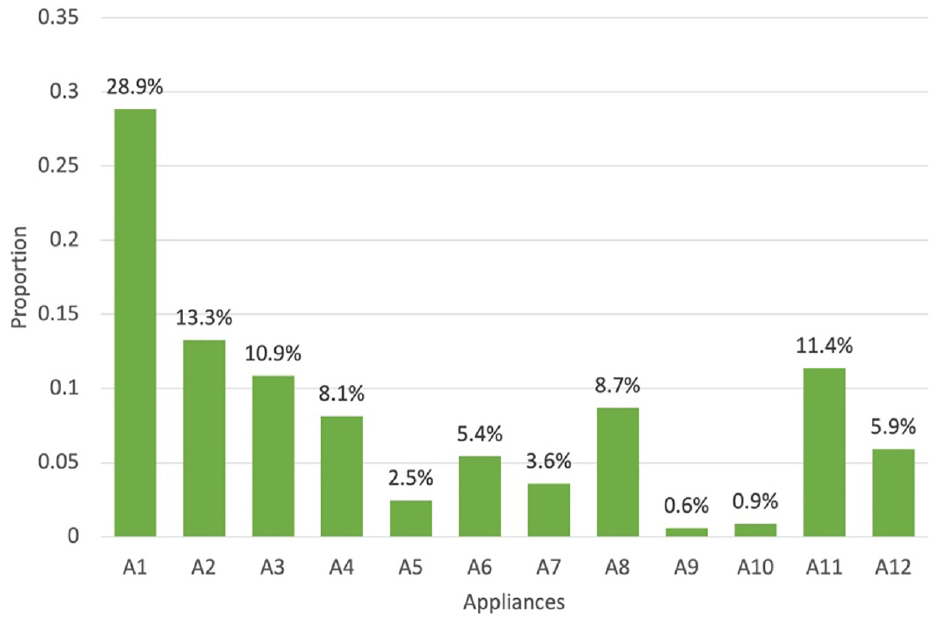
The proportion of decomposition power data of each electrical appliance.
Conclusions
In this study, we proposed an attention-based model that integrates multiple electrical features to enhance the sequence-to-sequence network for NILM. By training the model using total energy consumption signal and combined status code, our model achieves 90.5% accuracy in load decomposition on gas station electricity consumption data. The decomposition results show that our enhancement strategy works and that our model outperforms traditional methods. Our results demonstrated that the most energy-consuming appliance is the Submersible Pump, while Canopy Lights Strip, Kitchen Socket, Integrated Office Socket, and Outdoor Advertising Signage accounts for nearly half of the total energy consumption. These results are helpful to reduce the cost of power consumption and optimize the allocation of power resources. In the future, our work should design new architectures to accelerate the training and decomposition process of the model and improve the prediction quality.
Footnotes
Declaration of conflicting interests
The author(s) declared no potential conflicts of interest with respect to the research, authorship, and/or publication of this article.
Funding
The author(s) received no financial support for the research, authorship, and/or publication of this article.