
Abstract
In an environment where completely automated lines are gaining popularity, station service employees are declining yearly while passenger volume increases. In many cities, the need for station video surveillance with “complete coverage without dead ends” has been high. The traditional layout scheme based on design experience estimates often results in large blind spots and low efficiency in monitoring. In order to solve this problem, based on BIM technology, this work develops a quantified camera layout optimization approach employing an improved genetic algorithm. The plan includes three modules: the data extraction, which extracts the spatial information of the functional area from the BIM model to generate a data image; the optimization module, which adopts the improved genetic algorithm and uses the pixel coordinates provided by the data image to realize the camera pre-deployment; the visualization module, which designs the simulation plug-in through BIM secondary development technology, simulates and verifies the pre-deployment, and provides the solutions. The approach’s effectiveness was confirmed by verifying the deployment optimization at the station platform level. The optimal solution’s camera coverage is 27.2% better than the experience-based camera layout.
Keywords
Introduction
With economic development, urban rail transit passenger volumes are sharply expanding; the safety situation is getting increasingly severe, and completely automatic operating lines are becoming more and more common. At this point, CCTV provides real-time monitoring and control of images in critical regions of stations by train dispatchers but also performs the tasks of intelligent image analysis, extraction of sensitive events, and linking of alarms 1 . Numerous metropolitan subway systems have raised the requirement for “complete coverage without dead ends” for station video surveillance. Currently, the camera layout planning of CCTV generally relies on the design experience or simple estimation to operate on two-dimensional drawings. There are many practical problems, such as unscientific monitoring layout, extensive monitoring blind area, and low monitoring efficiency. It has become vital to consider how station camera placement might be improved to attain “complete coverage” while spending less.
Domestic and foreign research on camera placement algorithms is divided into qualitative and quantitative layout methods. The qualitative layout method is mainly based on the critical level of each placement of the monitoring area to analyze the positioning; according to the characteristics of urban monitoring objects and monitoring areas, Fan 2 divides the monitoring targets into five categories: point, line, surface, three-dimensional and mobile for urban video monitoring layout. Using the layout of video surveillance cameras in a shield section as an example, Zhu 3 obtains the areas that need to be monitored in the metro shield section based on the expert investigation method. The analytic hierarchy analyzes the monitoring area’s importance to determine the camera’s location. The qualitative analysis method of layout according to the importance of the location makes it difficult to ensure complete coverage of the monitoring range for the whole area, and more monitoring points are arranged, resulting in increased costs and wasted resources.
The quantitative geometric analysis method is used to optimize the monitoring layout. Wang 4 obtains the classroom monitoring camera’s installation position by analyzing the camera’s and the classroom’s parameters and taking the minimum blind area monitored in the classroom as the goal. Yaagoubi 5 analyzes the visibility of the 3D model in 3DGIS software and calculates its coverage to ensure that fewer cameras are used to achieve nearly 100% coverage of monitoring targets. The method of geometric analysis to determine the layout of video monitoring points is suitable for areas with a small monitoring range and a simple monitoring environment. Multi-camera monitoring for complex environments is not available. When solving the coverage problem, the genetic algorithm as a global optimization algorithm has gained the attention of scholars. Anton Vall 6 is based on a genetic algorithm to find the optimal arrangement of cameras in 3D buildings with coverage constraints. In the study of the optimization configuration of highway monitoring equipment resources, Yan 7 uses genetic algorithms to obtain optimized configuration schemes, thereby improving the use efficiency of monitoring equipment on highways. In existing studies, less consideration is given to the functional areas of the trains, and the interference of buildings or other facilities in the area is ignored, leading to poor results in practice. Usually, different regions deploy different camera selections and lens focal lengths, and changes in installation angles affect the monitoring coverage based on the two-dimensional plane of the algorithm design, which often does not take into account this constraint.
With the popularization of BIM (Building Information Modeling) technology in the design stage of the rail transit industry, some studies have also applied BIM technology to CCTV visual simulation. Chen et al. 8 configures Revit camera parameters to simulate CCTV virtual screen views; By optimizing the depression angle of the camera, partial visual interference is avoided. This study can only present the overall CCTV monitoring effect in a two-dimensional way, and the evaluation of design conflicts is not accurate enough to achieve complete coverage design requirements. Chen et al. 9 proposes a camera layout optimization framework that integrates an improved genetic algorithm and BIM, which discretizes the working scene into data images and uses data images to visualize the simulation results. The research updates the data image according to the mathematical optimization results obtained by the improved genetic algorithm, and the pixel value of the data image reflects the camera coverage area. This method cannot adjust the camera placement and angle in real time, which is not conducive to the practical application of engineering scenes.
Therefore, this study designs a quantified camera spatial layout optimization scheme and applies three-dimensional visual analysis to layout optimization using the secondary development technology of BIM and an improved genetic algorithm. In the engineering design stage, the spatial layout of the camera can be determined by the visual interface to obtain the optimal camera layout scheme to solve the problem of the “blind distribution” of multi-monitor cameras. The five primary aspects of this paper’s contribution are as follows:
(1) A CCTV camera layout optimization system integrating BIM technology and an improved genetic algorithm is designed.
(2) The optimization system considers the monitoring screen’s clarity, obstacle occlusion, and other factors to design the optimization algorithm.
(3) The camera’s monitoring coverage area family model is designed using BIM. The occlusion identification, hollow fusion, and shear methods are used to implement the obstacle shear algorithm in the field of vision. Develop a simulation plug-in based on REVIT.
(4) Data images are used as data media to connect three modules, and the discrete model and optimization results are visualized.
(5) A case study demonstrates the superiority of the developed optimization system over the current architecture.
The structure of this article is as follows. Section 2 elaborates on the overall design idea of the paper. Section 3 discusses the critical technology of extracting data images from BIM models. Section 4 studies the design of the pre-distribution point optimization algorithm. Section 5 analyzes the development process of the BIM visualization plug-in. Section 6 illustrates and verifies the feasibility of the optimization system. Section 7 concludes.
Design ideas
Compared with traditional two-dimensional CAD design, BIM has a more precise geometric representation of building parts in an integrated information environment, including spatial relations, physical characteristics, functional properties, and other attributes, reflecting a more accurate layout of the functional areas of the station. Therefore, BIM can automatically collect the essential information elements and provide accurate indoor building scenes for the camera layout optimization process. While doing so, it enables three-dimensional visualization of the optimization results, avoiding changes and corrections during the construction process.
Figure 1 depicts the project’s design concept. The optimal configuration is produced using an improved genetic algorithm using the BIM file as input, and the optimization effect is shown using Revit’s secondary development tool. In order to discretize the model and map it to the data image, the architectural details and equipment arrangement of the optimal station are first specified through BIM. Next, analyze the station’s structural characteristics, select the camera type, determine the camera monitoring coverage, design the deployment model, and then use the optimization method to realize the pre-deployment of the camera. Then, the field of view shearing, the merging algorithm, and the camera field of view modeling approach are investigated. The simulation plug-in is designed by secondary development technology of BIM to simulate the coverage area of the camera field of view. The pre-distribution results are imported into the BIM simulation model for layout adjustment. The optimization findings are then validated to achieve complete coverage without dead ends in a metro station’s public areas. The research focus of this paper is three stages: data image extraction in BIM model, research on pre-layout optimization algorithm and visualization of simulation effect.
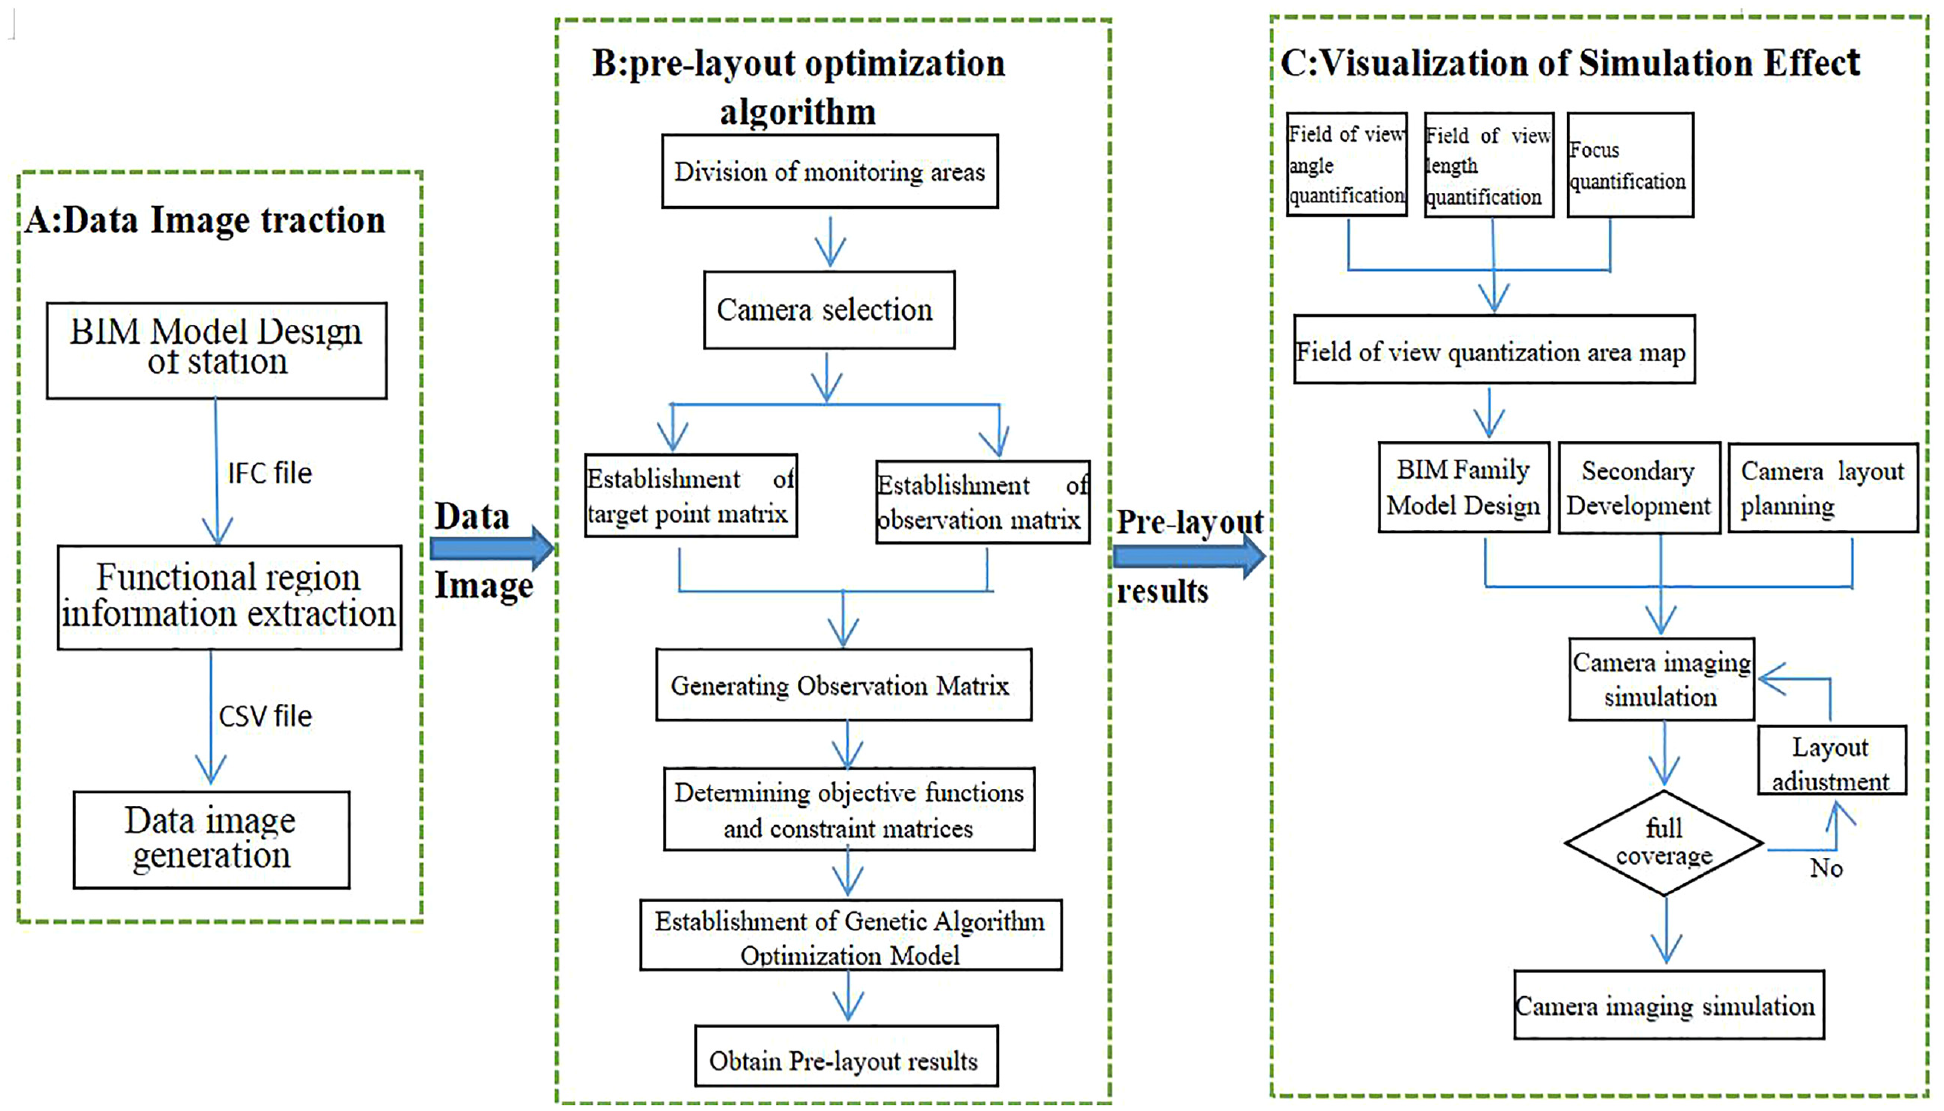
Overall research ideas.
Data image extraction in BIM model
The calculation of the pre-layout optimization algorithm largely depends on accurate data input, including the building scene and equipment layout information of the station functional area, which is conducive to the analysis of the coverage range and the determination of the occlusion area when monitoring the layout. It must accurately extract precise information from the BIM model to create workable solutions. The role of Part A is to convert the BIM model into a data image to provide the base data for Part B. Part A includes three main parts: BIM model development, BIM information extraction, and data image generation.
Building information modeling (BIM) is a tool designer may use to create and manage more durable, energy-efficient buildings. Software from Autodesk is referred to as Revit. The Revit series of software is designed for BIM. Create the station BIM model in Revit, then export the file in IFC format. Extract model information from the open-source library IfcOpenShell and save the data in a “CSV” file. There are numerous shape analysis and repair functions in IfcOpenShell that can convert, verify, form, and analyze the geometry figure in IFC files. The “ifcopenshell. Open” tool can input IFC files and retrieve IFC elements (e.g. columns, Etc.). Each geometry has a local coordinate system (LCS) for the IFC standard. The abstract class “ObjectPlacement” is used to describe the position information of the element, including two properties, “PlacementRelto” and “RelativePlacement.”“PlacementRelto” indicates whether the location information is associated with other elements. If “PlacementRelto” is neglected, the World Coordinate System (WCS) is used as the location information. “RelativePlacement” defines the coordinate position in the Local Coordinate System (LCS). The coordinates in the world coordinate system (WCS) and the local coordinate system (LCS) can be converted to each other. The model’s local coordinate information of elements such as buildings and equipment is extracted and transformed into the World Coordinate System (WCS). Define the abstract class “IfcRepresentation” concept to represent product shapes, such as curves, lines, Etc. The coordinates and shapes of the obstacles in the station area that can obscure the camera’s view are all kept in a CSV file, which we can access. As seen in Figure 2, the 3D visual model is reduced to a 2D model by converting the CSV file into a discrete data image.
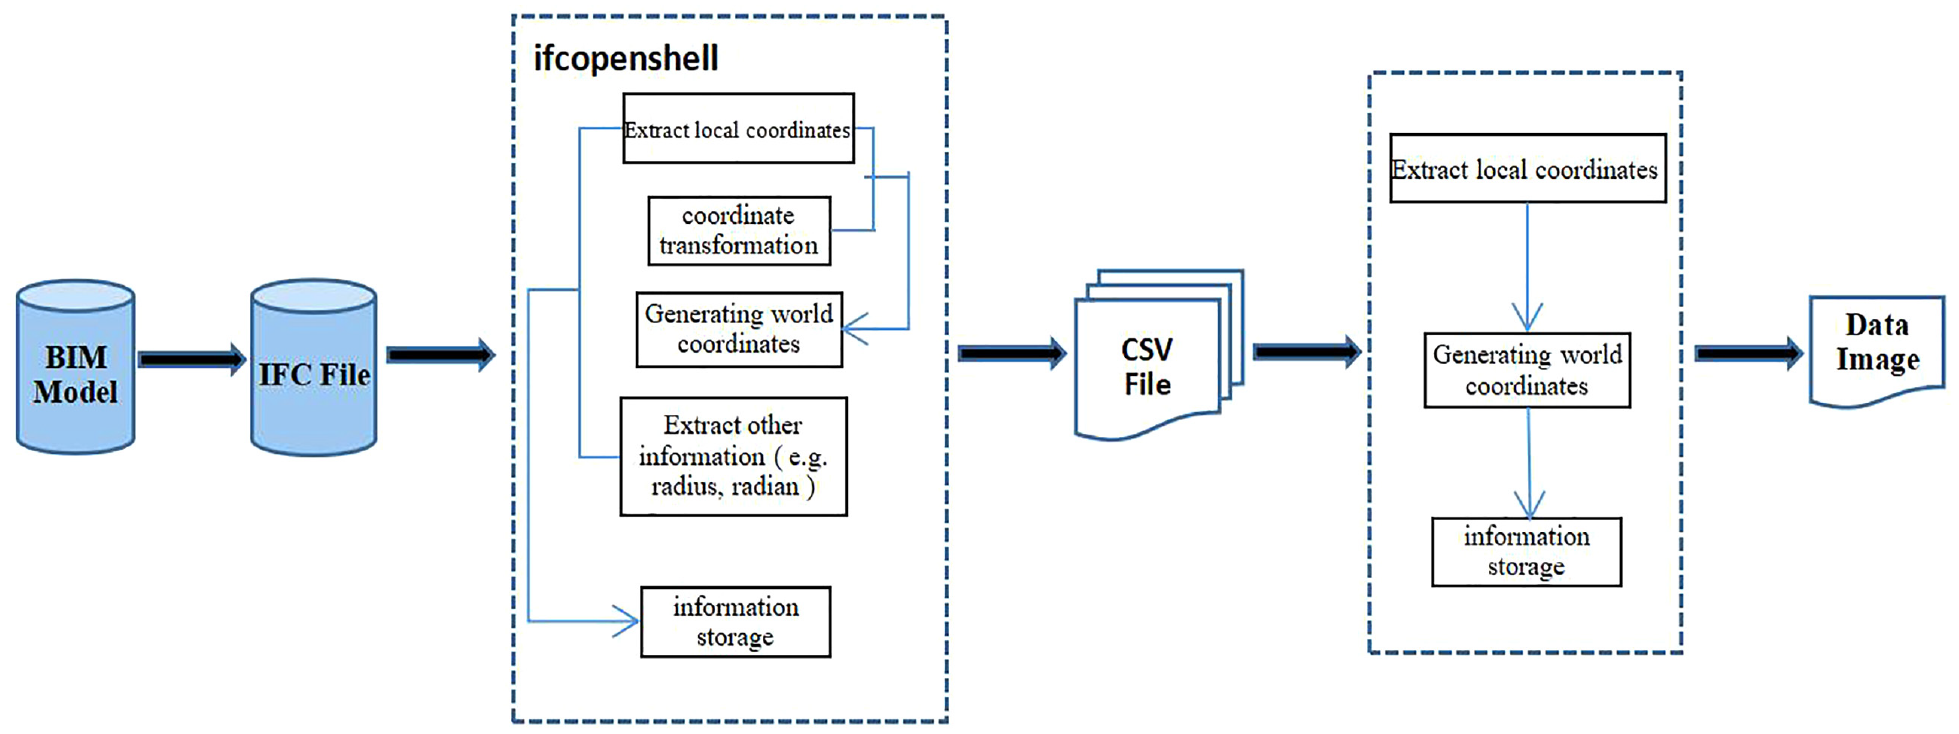
Data image extraction process.
Each pixel represents a discrete unit cell for data images, and its pixel index gives the unit cell coordinates to which it belongs are given by its pixel index. The pixel value also indicates the state of the unit cell (e.g. work part and obstacle part), with the pixel value 255 indicating a work area and the pixel value 0 indicating an obstacle-affected unit area. Since the information extracted from IFC files only contains limited data, such as endpoint coordinates, center coordinates, and radius information, a complete mapping process needs to be designed. Figure 3 shows three mapping instances of IFC products. Finally, a data image with complete data mapping is constructed, as illustrated in Figure 4, using the platform layer of the subway station as an example.
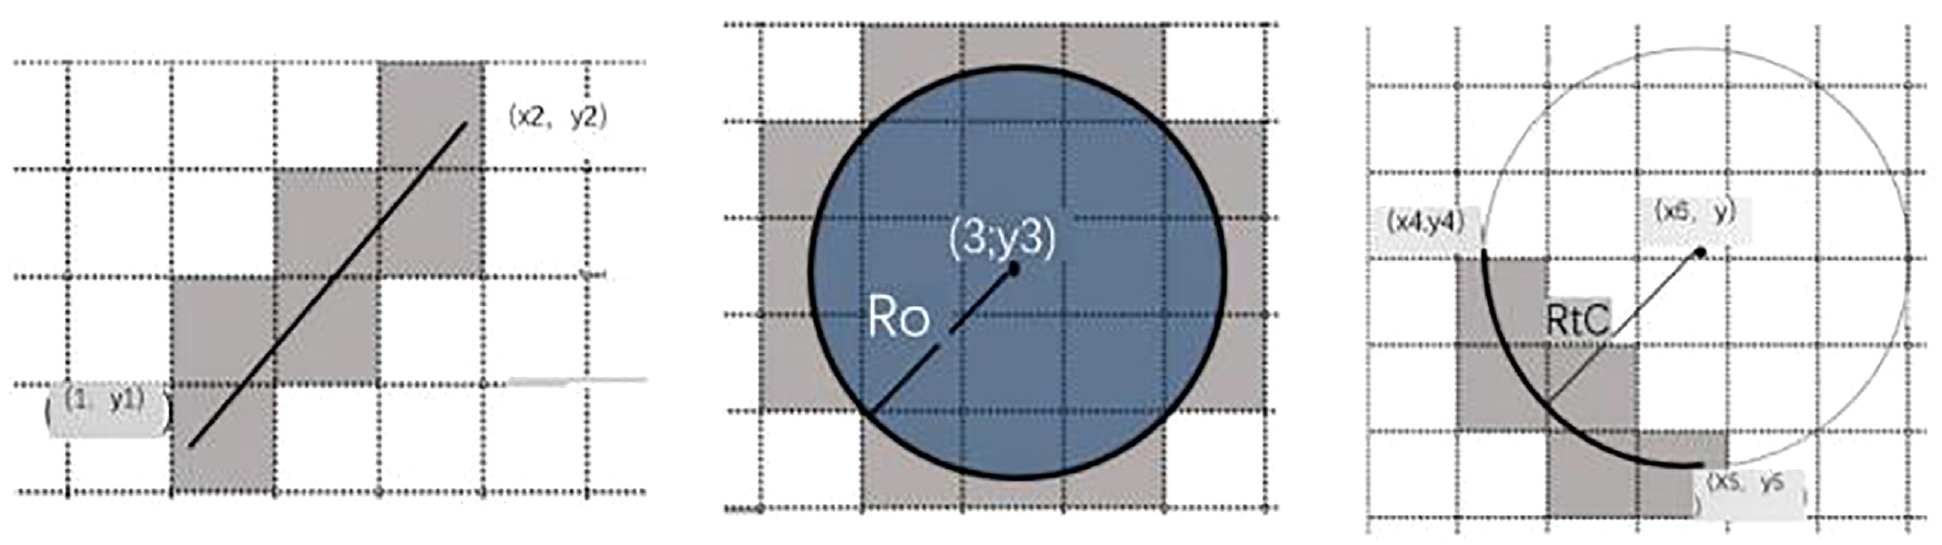
IFC file mapping instance.
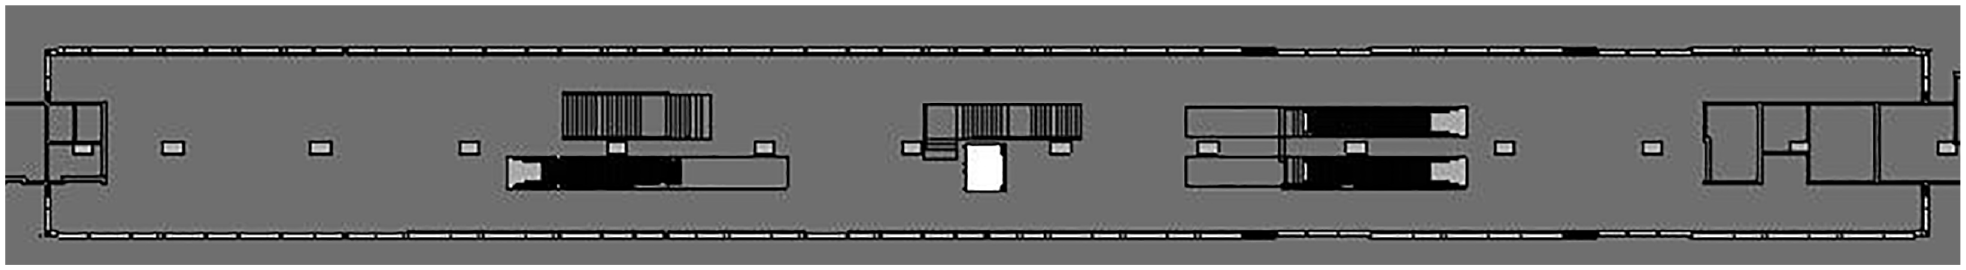
A data image example of a station platform layer.
Pre-location optimization algorithm
The mathematical model of camera placement in this research makes use of the definition below:
The number of candidate monitoring points is determined to be m at the monitoring site, and the candidate monitoring points make up a set M (1, 2,… j.. m). The monitoring site is divided into n square cells, forming the set N (1,2,…, i.. .n); the effective monitoring distance of the video surveillance point is L (
Camera visibility analysis
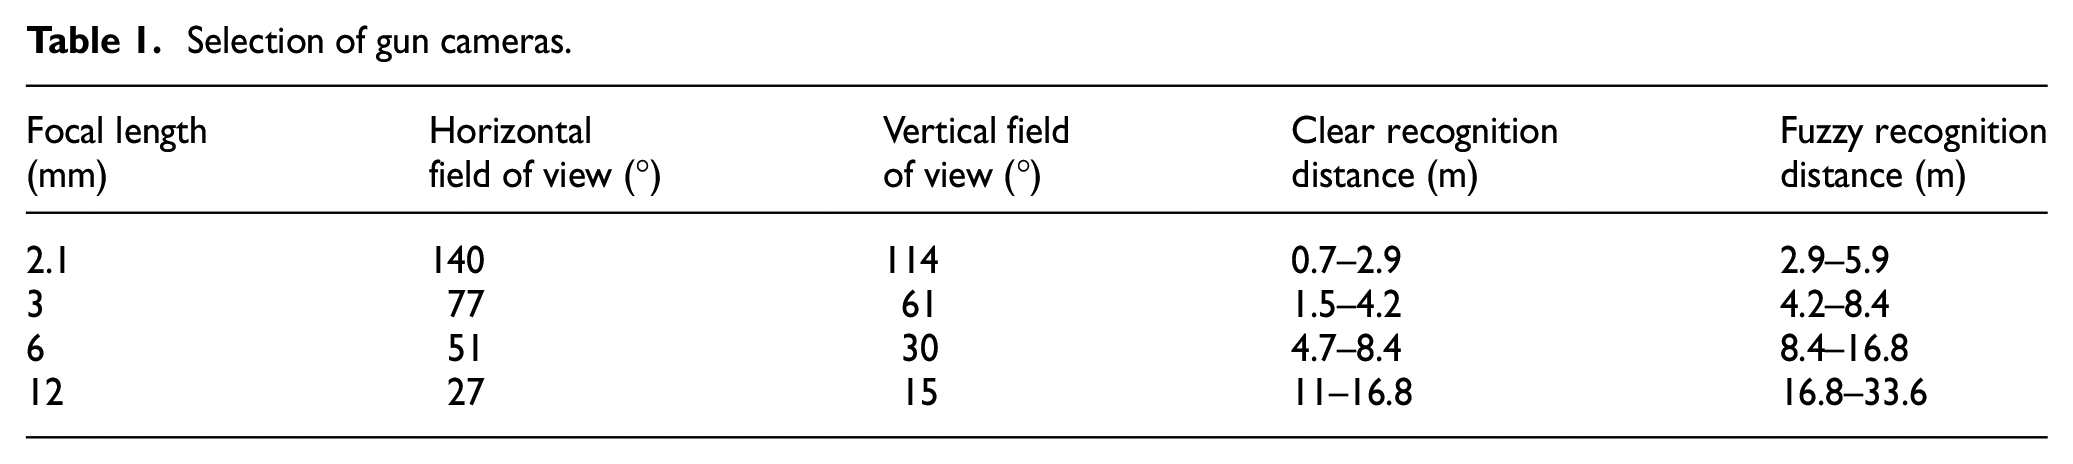
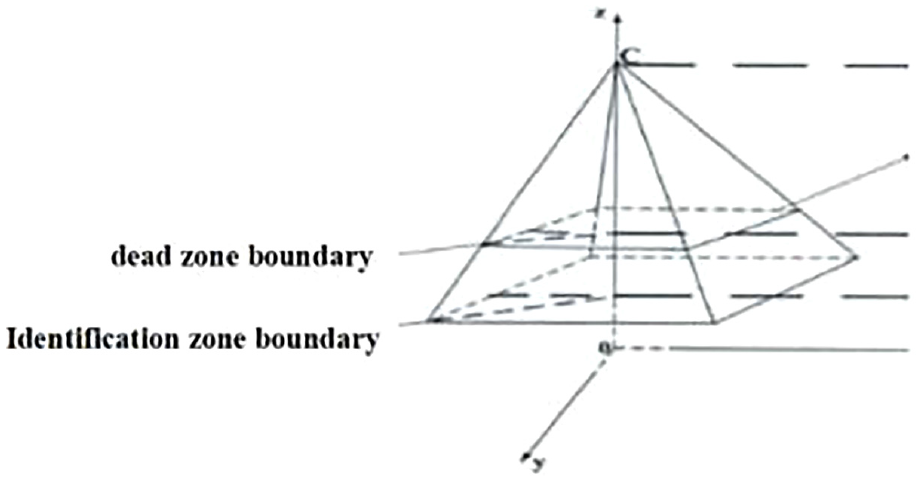
Two kinds of cameras are commonly used in urban rail transit: dome and gun. Since the dome camera needs to be rotated 360° by remote operation, it cannot monitor all areas of the site in real time and is always placed at the entrance and exit of the station. In this article, we mainly use the gun camera and determine the camera parameters through research, as shown in Table 1. The visual field plane is shown in Figure 5; when the person to be monitored appears in the clear identification area, the facial features can be recognized. Moreover, only human movement and clothing can be recognized in the fuzzy recognition area. This study considers the covered area of clear identification since the existing video surveillance system is responsible for passenger flow statistics, danger detection, and other objectives.
Selection of gun cameras.
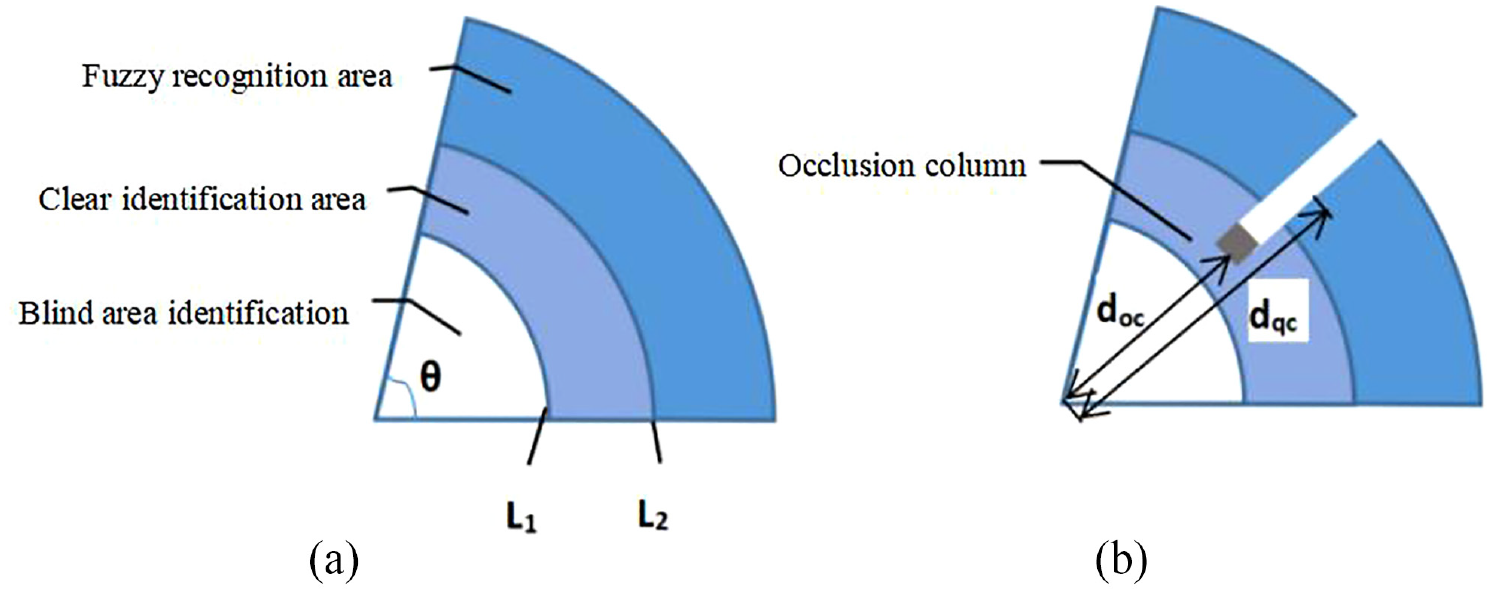
Planar viewable area of the monitor image: (a) no obstructions and (b) with obstructions.
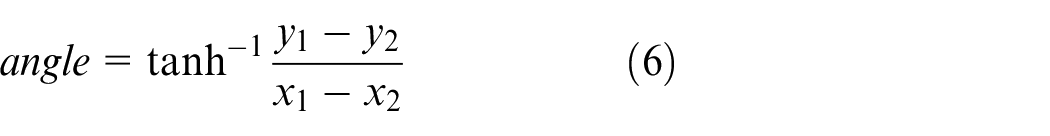
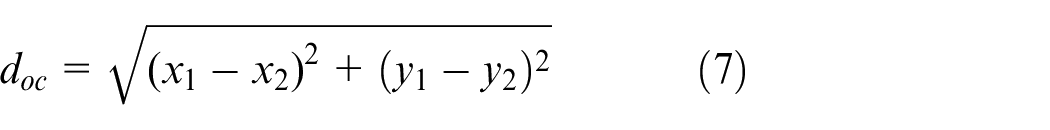
In this study, the location of the observation point is determined by its data image pixel index. Suppose the location of the candidate observation point is (xi,yi), its field-of-view angle is θ, and the coverage area is an annular region with a radius of L1 to L2. As shown in the figure, the working area (xj,yj) covered by the camera satisfies the formulas (1),(2),(3),(4),(5). If obstacles block the camera’s view, the angle between the obstacle and the camera (Formula (6)) and the distance doc (Formula (7)) need to be calculated. For the working area located within the same angle line of sight, if the distance dqc between the camera and the working area is greater than the doc, the working area will not be covered by the camera; otherwise, the working area will be covered.


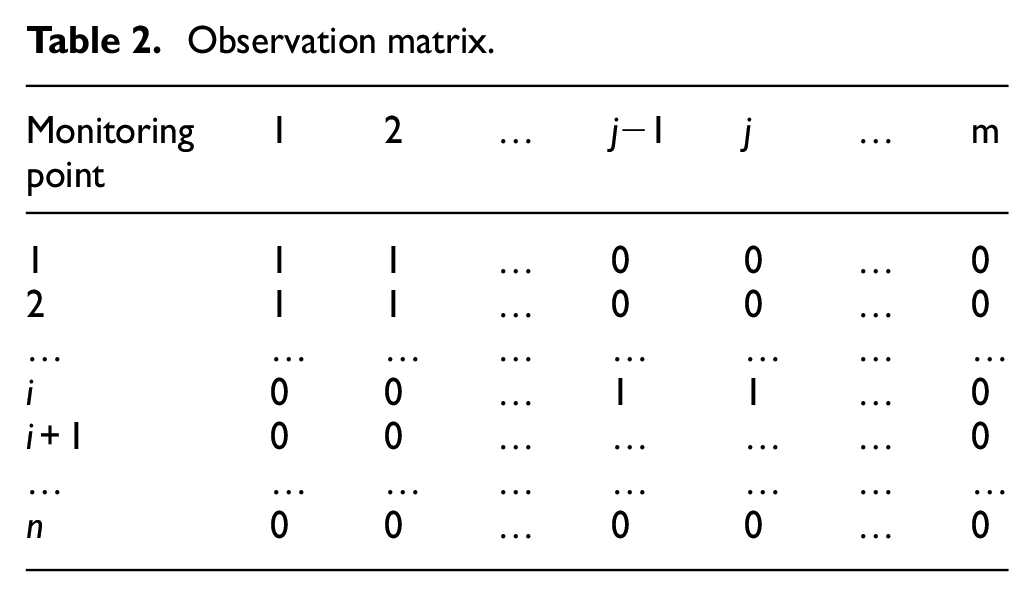
According to the above analysis, the coverage of the grid center point in N (1,2,… i,… N) by the video monitoring point in M (1,2,… j,… M) is encoded, calculated, and solved in MATLAB, which obtains the observation matrix A of the video monitoring point to the target grid point. “1” indicates that the monitoring point in this column can cover the grid point in this row, and “0” indicates that the monitoring point in this column cannot cover the grid point, as shown in Table 2.
Observation matrix.
Modeling
The goal of camera layout optimization is to realize the full monitoring coverage in the working area when the selected video monitoring points are the least. The layout model of station CCTV collection points can be expressed as follows:
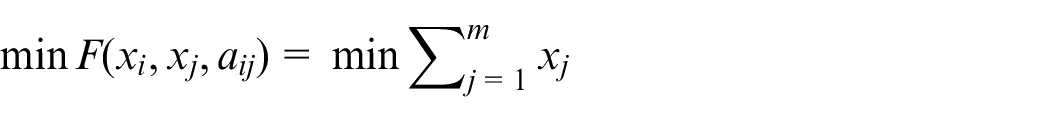
Improved genetic algorithm
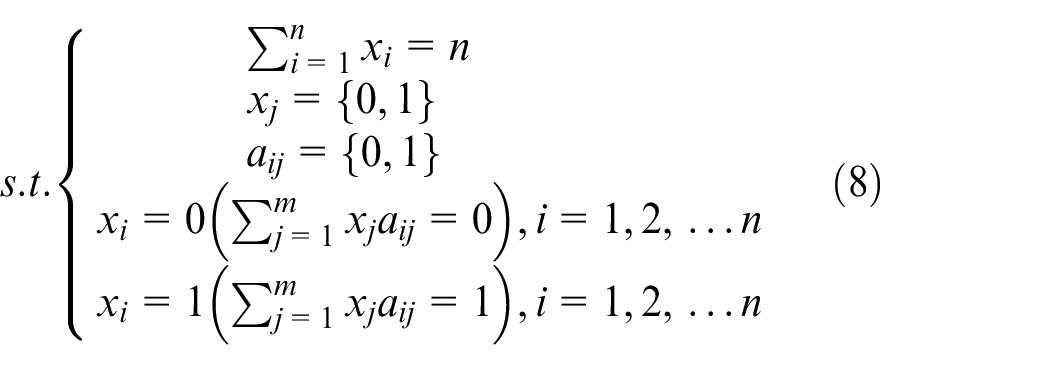
The traditional genetic algorithm generates the initial population randomly and the offspring population through selection, crossover, and mutation operations. The solving process could result in impractical solutions that fall short of the demands for total coverage. In order to ensure that the optimal solution satisfies the constraint of full coverage, this paper makes heuristic improvements after the initial population generation, as well as crossover and mutation. To avoid generating infeasible chromosomes when generating the initial population, we evaluate each newly generated chromosome to check whether it satisfies the condition that n lattices are covered. If the condition is met, the next chromosome is generated; if not, the previous chromosome is discarded, and a new chromosome is randomly generated until the number of chromosomes satisfying the condition reaches the initial population size. It is easy to determine whether the condition of full coverage can be satisfied for a chromosome. If the condition is not satisfied, it is difficult to converge to the optimal solution in the genetic variation. The traditional method reduces the fitness of individuals who do not meet the conditions by abandoning chromosomes or by a penalty function, which impacts population diversity. The most common application is to correct infeasible chromosomes to fulfill the requirement of complete grid coverage. This algorithm uses the grid point sorting of coverage monitoring targets to find more suitable genes to compensate for and improve the compensated chromosomes. The number of monitoring grids covered by monitoring points refers to the number of columns in the set corresponding to a specific gene in the chromosome that covers the rows that are not covered in the chromosome. If the number of columns covered by that column is relatively large, the gene is selected in preference for repair. Therefore, in the population after cross mutation, the formula
Improved genetic algorithm workflow.
BIM visualization
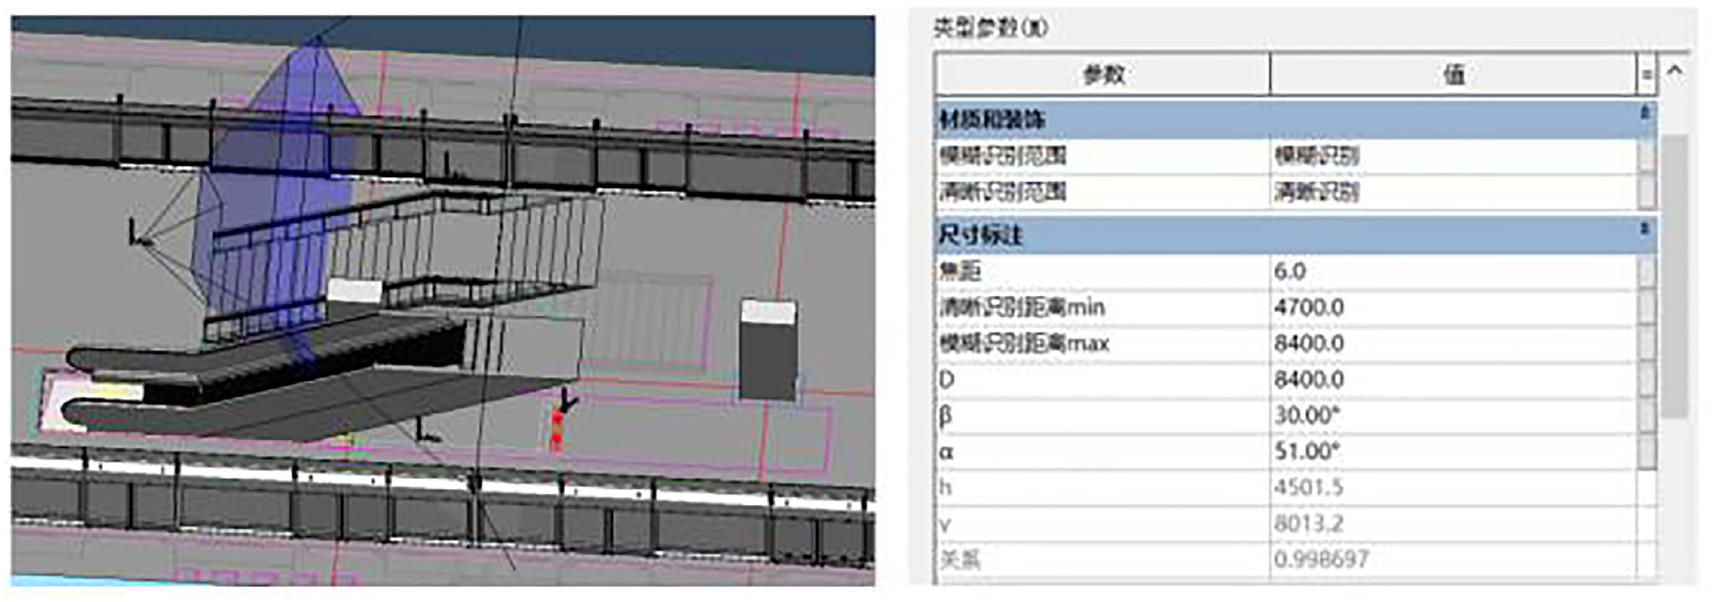
Taking the wide-angle camera deployed in the vast scene space of the station as an example, it uses a 1/3 inch image sensor, the focal length f is 3 mm at the widest angle, and the target surface size is
Vertical field of view:
Horizontal field of view:
It may be concluded that the model parameters are trustworthy because the calculation results are not significantly different from the survey results in Table 1. Determine the boundary line of the imaging area using the camera’s internal and external parameters and the linear imaging principle. When the camera uses a 1080P format image, sketch the imaging area as shown in Figure 7 while taking into account considering the visible area under each focal length.
Imaging area on the reference plane.
Using Revit, create a 3D model of the camera imaging area and add model parameters such as the focal length, horizontal field of view angle, vertical field of view angle, visible length, and so on. It can simulate coverage areas of different focal lengths and form a family of coverage simulation models. Figures 8 and 9 depicts the family model development process.
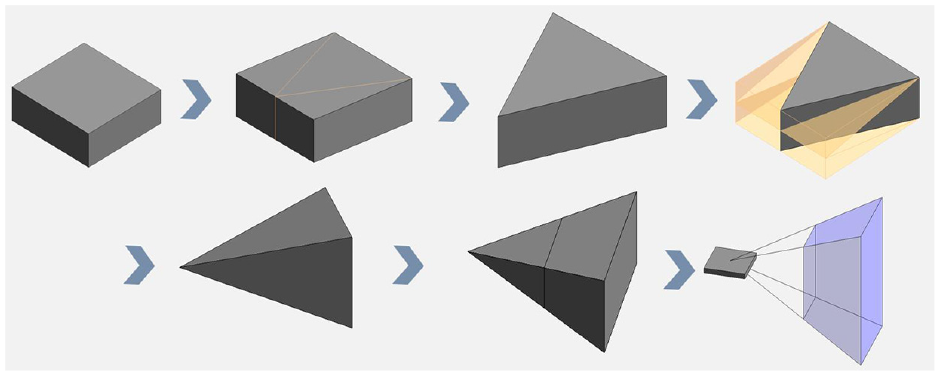
The modeling process of the family model.
Simulation family model of camera coverage area.
Because there are pillars, elevators, screen doors, and other facilities in the station that block the camera coverage range, the family model cannot reflect the actual monitoring coverage effect when occlusion occurs. This paper uses Revit secondary development function to design the occluded area removal plug-in, as shown in Figure 10. Revit API is an application programing interface introduced by Autodesk for developers to develop features in Revit. The API can access the model’s graphical and parameter data; create, modify, and delete model elements; create plug-ins to enhance the UI; and automate repetitive work. 9 The main idea of this plug-in is to create several data sets, which are used to store the simulation model (visual cone) and occlusion model of the monitoring coverage area in the paper. Then measure the position of the occluded part in the coverage area, click the mouse to pick up the central vertices of the required cutting area, and use the function line.CreateBound() connects points to form a line to generate the corresponding cutting figure and specifies the cutting height to form a new cutting family. By calling function InstanceVoidCutUtils.AddInstanceVoidCut() to cut based on the reference level plane. The execution effect is shown in Figure 11.
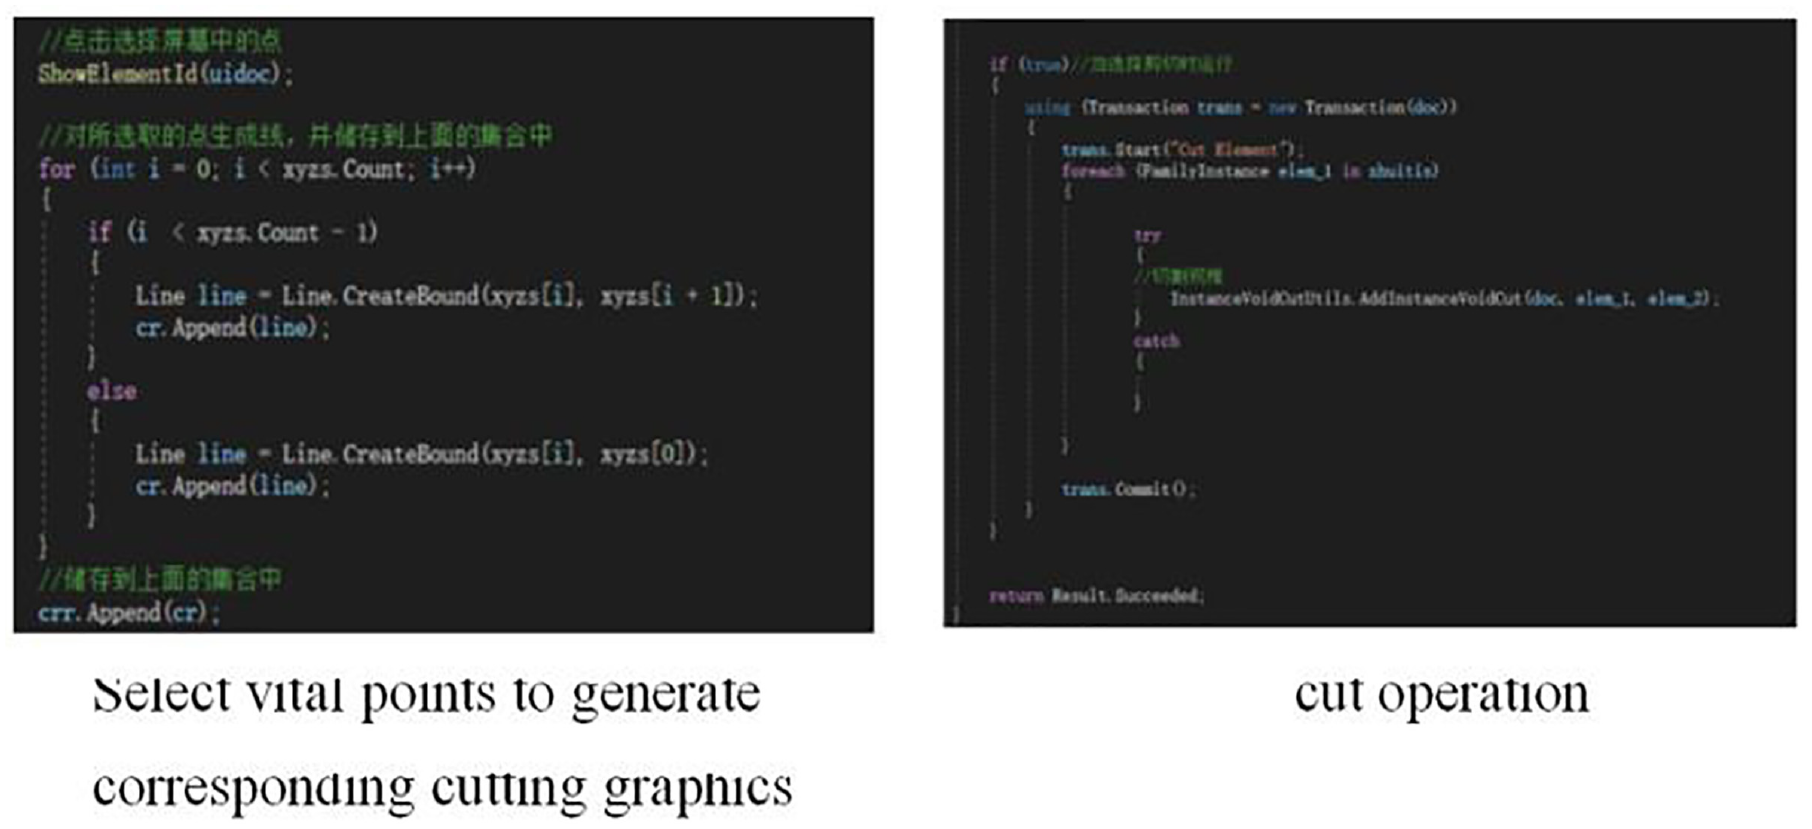
The part code of the secondary development plug-in.
Effect before and after performing occlusion cutting plug-in.
Example analysis
Wuhan Metro Line 5 is the first fully automatic train operation line in Wuhan. The interchange station between Lines 5 and 2 is Jiyuqiao Station, which has fewer station employees and a more complicated passenger flow. This study optimizes the camera location on the platform layer using the Jiyuqiao Station of Line 5 as an example. Figure 12 displays the BIM model for the station. Before optimization, the original layout scheme of the station camera was restored in the BIM model and loaded with the coverage family model. It was discovered that the model reflected that the monitoring blind area of the station was consistent with the actual monitoring effect, demonstrating the effectiveness of the BIM’s camera coverage visualization approach. The process of optimizing the camera placement on the platform level is as follows:
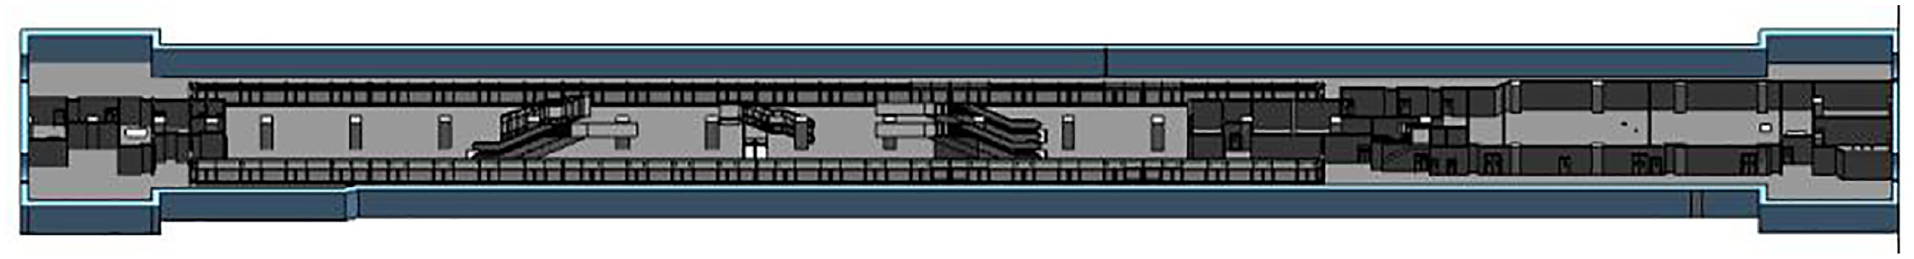
BIM model of the platform layer of Jiyuqiao station.
Firstly, by extracting the information from the IFC file,
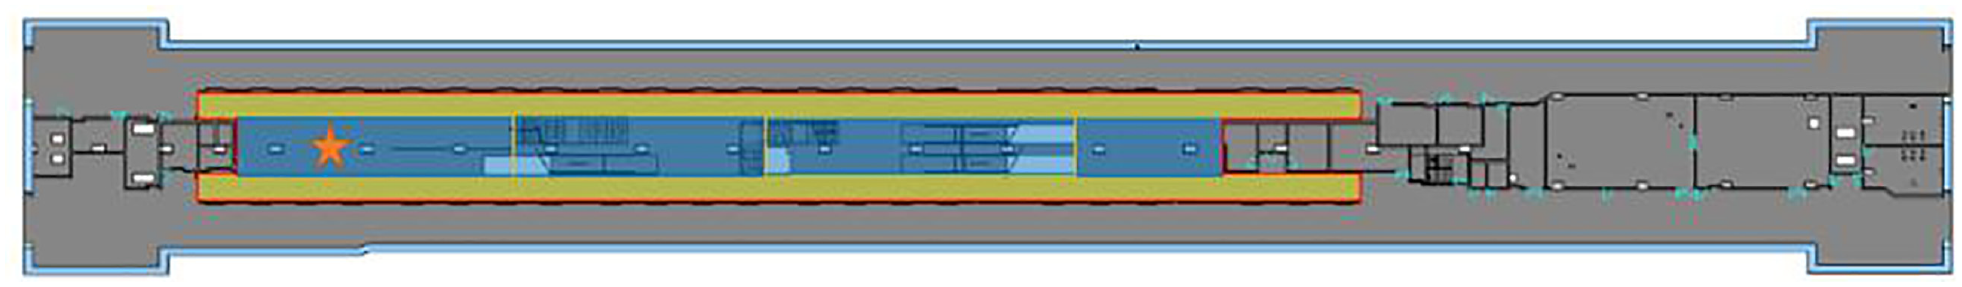
Division area of platform level map.
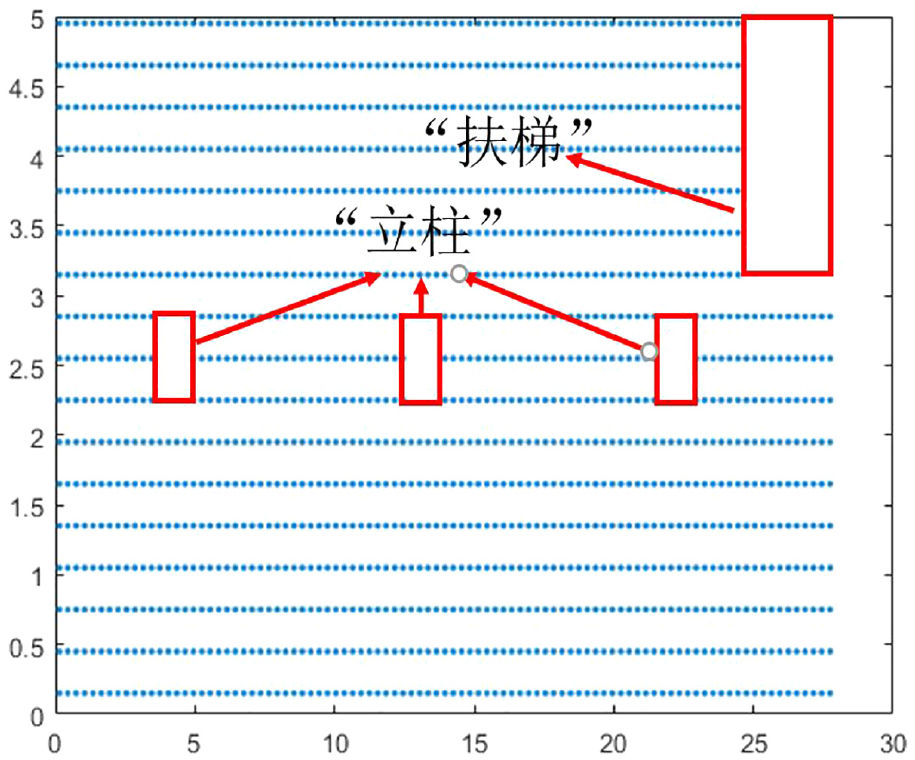
Then, the layout model is established according to the terrain characteristics and occlusions in the area. Then, by setting the objective function and constraints, the improved genetic algorithm optimization model is used to obtain the number and coordinate values of cameras in different areas under full coverage. Take the blue area of the Red Pentagram on the platform floor, as shown in the yellow box in Figure 14. This area has three columns and escalators, so it is necessary to determine the observation points and remove the non-observation points that block the line of sight such as columns and escalators.
The results of the pre-layout optimization algorithm.
The data image divides the yellow box area into
Target point matrix.
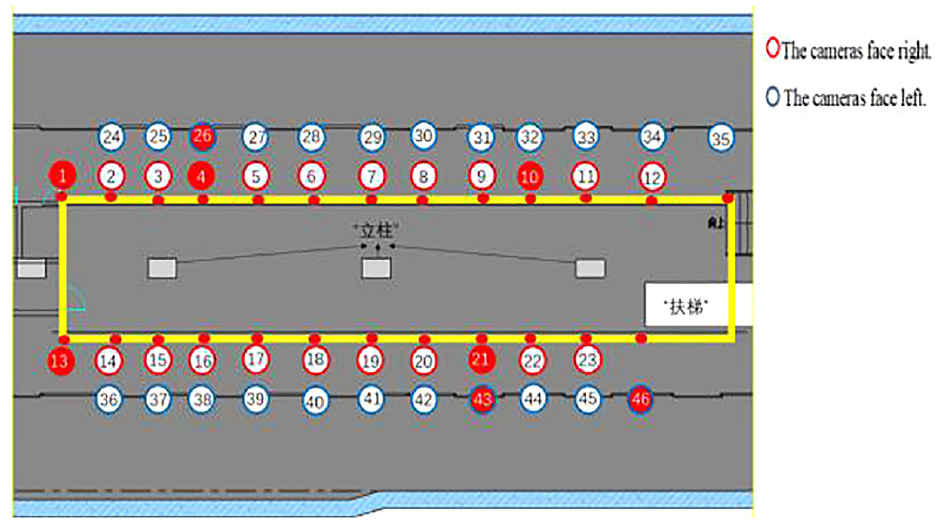
Then, according to the regional characteristics, a camera candidate point is set every 2.1 m, as shown in the red dot in Figure 14. There are two orientations at each red dot, so there are 46 pending observation points. Record the coordinates of each pending observation point and the camera’s orientation, and establish the observation point matrix.
Then, according to the field of view angle and recognition distance of the selected gun camera, considering the occlusion of the column and escalator, the observable range of each camera is calculated, and the camera observation matrix is generated. (The matrix size is
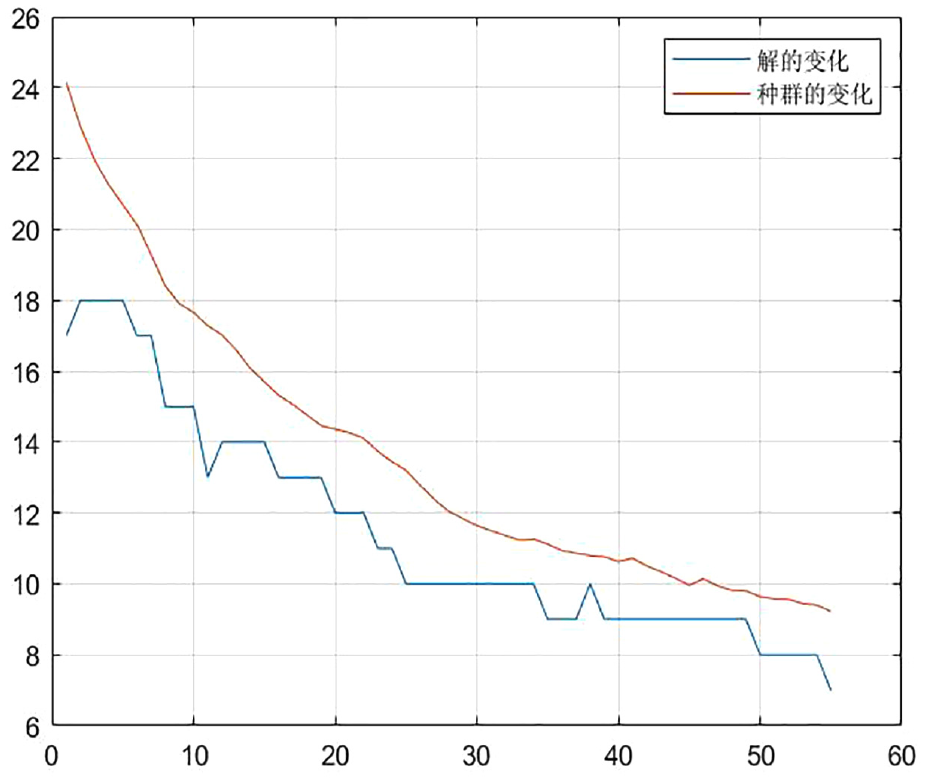
Finally, the observation matrix is brought into the genetic optimization algorithm model to calculate the minimum number of cameras and their numbers required to achieve full coverage in the area. The optimization result is shown in Figure 16. The full coverage of the yellow box area in Figure 14 can be realized using eight cameras. The red-filled circles in Figure 14 are the coordinate position of the eight cameras. Record the coordinates of these cameras as the result of the pre-layout and bring them into the BIM simulation model for verification and fine-tuning.
Optimization results of genetic algorithm.
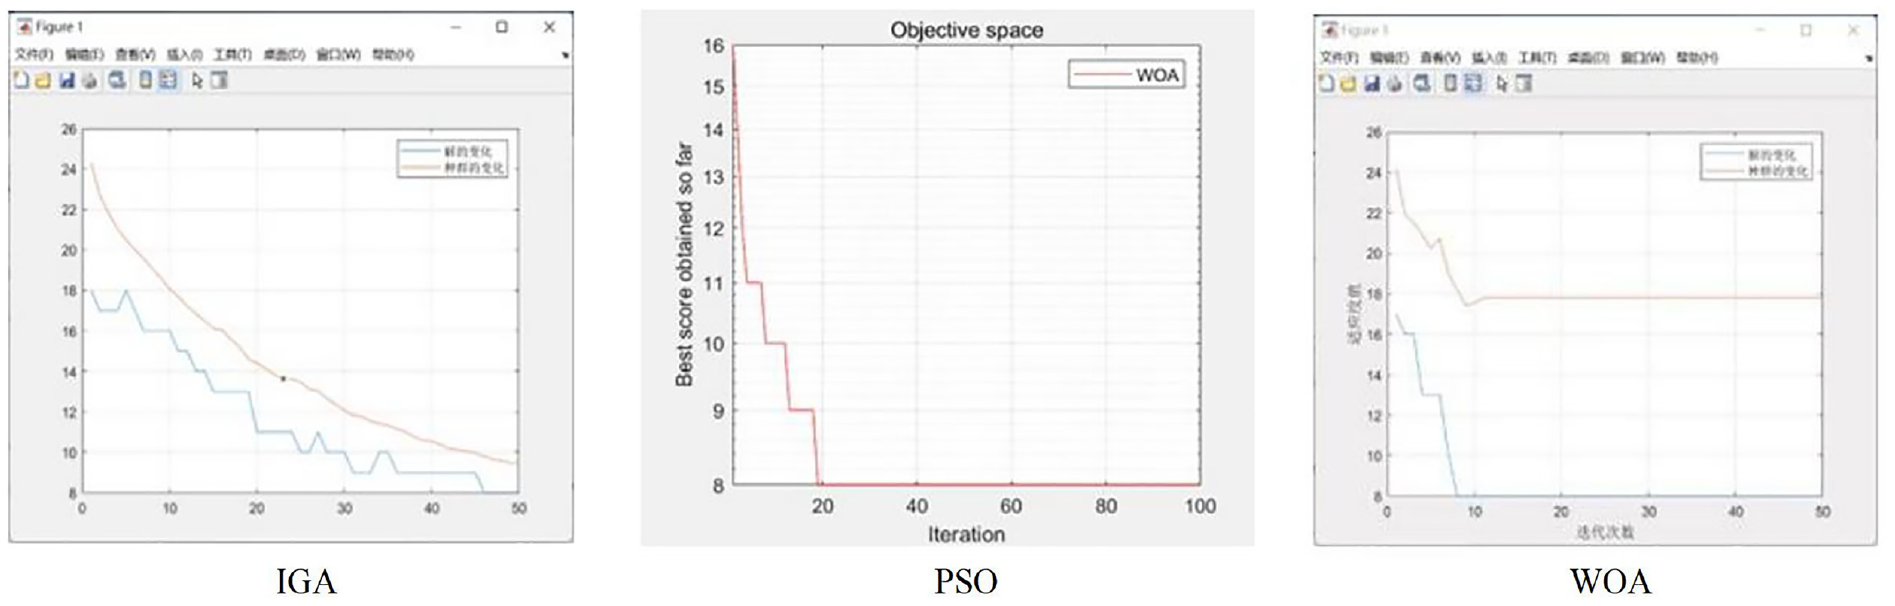
In order to verify the reliability of the improved genetic algorithm (IGA) optimization results, this paper compares this algorithm with particle swarm optimization (PSO) and whale algorithm (WOA). Figure 17 compares the iterative results of three algorithms for the same region. In order to achieve the goal of complete coverage of the camera monitoring range, the three algorithms give the same optimization results. However, the iterative process shows that the genetic algorithm is more suitable for an environment with a small area and is more advantageous in a complex environment. It is not easy to fall into the local optimum; only the operation time is longer than other algorithms. PSO and WOA algorithms are more suitable for austere environments. Regardless of the size of the area, the optimal solution can appear quickly. However, in a complex environment, increasing the number of iterations can only improve the local optimum and cannot wholly avoid the emergence of blind areas at the edge of the region.
Comparison of iterative results of each algorithm.
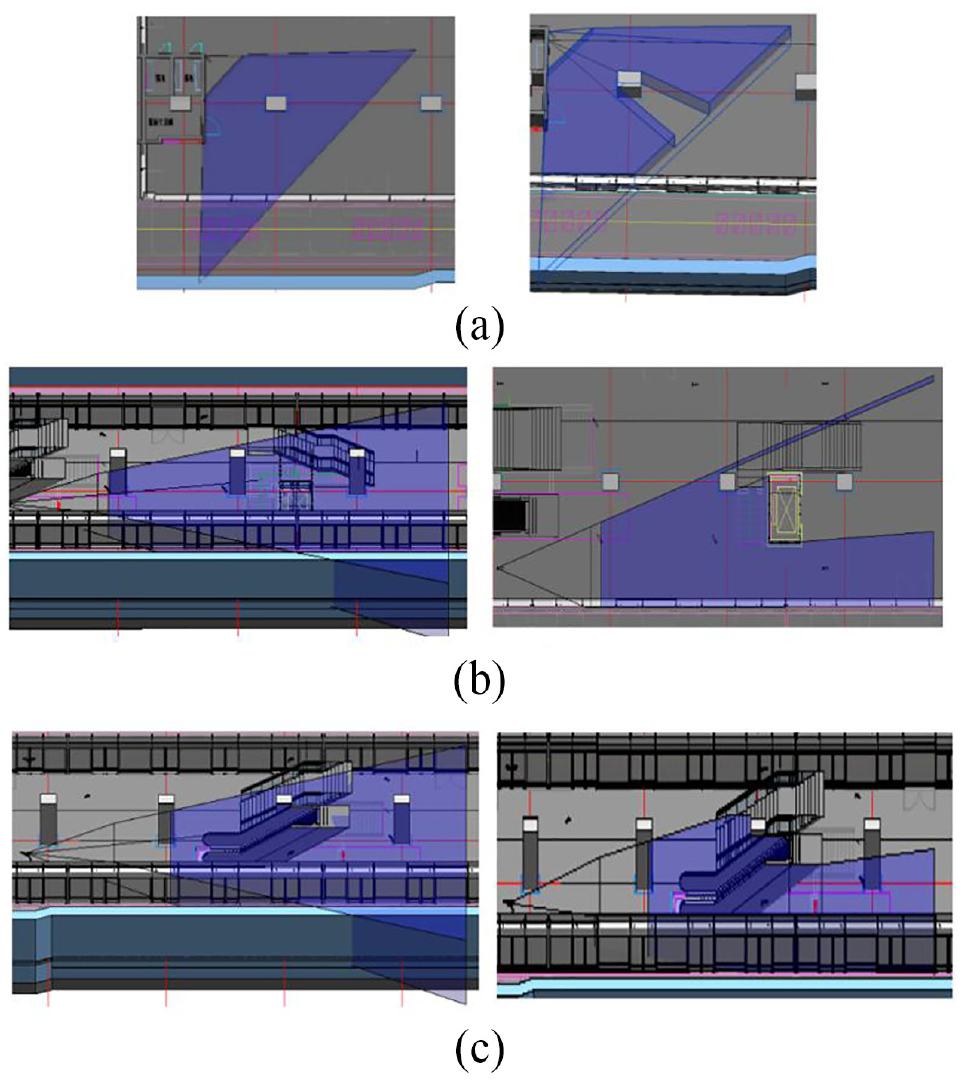
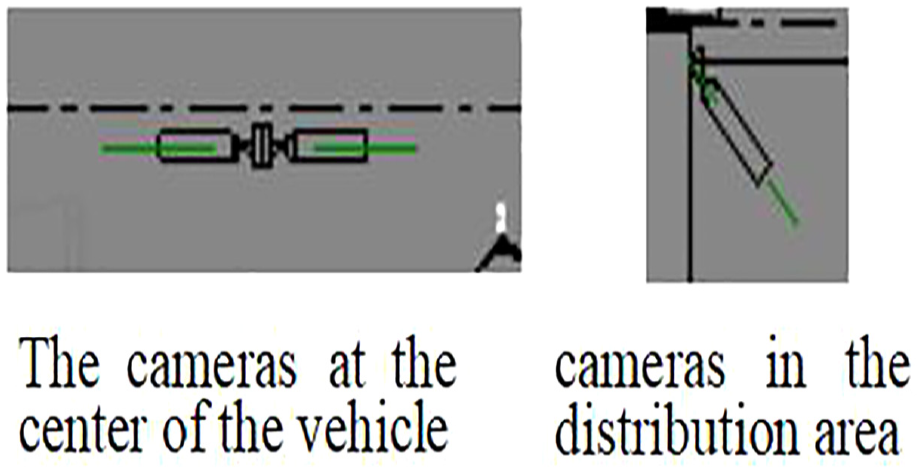
The cameras are deployed according to the calculated deployment locations. The specific coordinates of the cameras can be determined by distance using model lines. The cameras in the passenger boarding and alighting areas are placed in the left and right directions, respectively. The cameras in the distribution area are set along a 45° angle, as shown in Figure 18. Figure 19 depicts the visual effect of camera coverage. Table 3 compares the coverage rates both before and after optimization.
Examples of the camera layout.
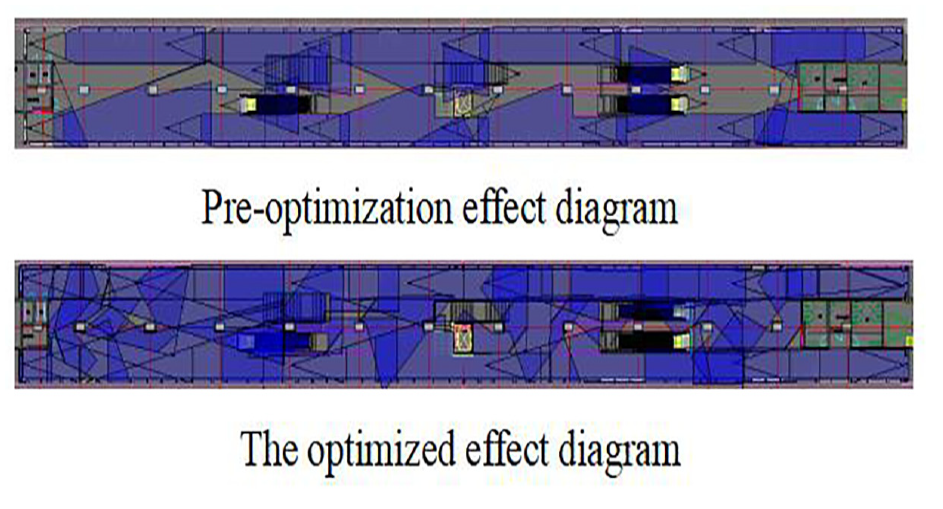
Comparison of results before and after optimization.
Comparison of coverage before and after optimization.
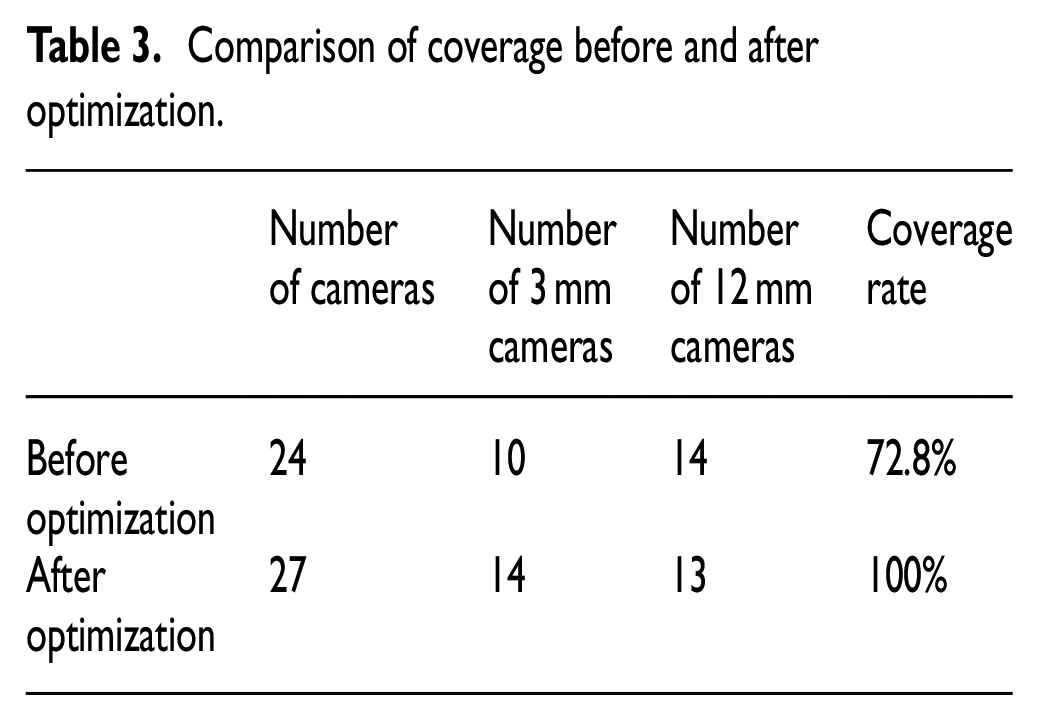
Comparing the effects of CCTV before and after optimization, it is found that the camera focal length before the optimization is generally not fixed. The staff typically chooses the focal length and modifies the angle as needed. There are many blind spots in the distribution area since the focus of CCTV’s standard monitoring is on the passenger flow concentration regions, such as the waiting area, escalators, and stairs. After a precise design by optimized algorithms, the number of cameras (red circles) is increased, and the monitoring angle is adjusted to fully cover blind areas in the distribution area while avoiding the occlusion of the columns and escalators. Adjust the position of the escalator entrance and stair entrance cameras so that the stair and escalator entrance areas that were not monitored before optimization are fully covered (yellow boxes). According to an analysis of the leading causes, more cameras have been added to the optimum solution: the camera layout before optimization relies on manual estimation, and it is not easy to consider the impact of building occlusion. Through the natural restoration of the coverage effect by the BIM visual simulation plug-in, it is found that the existing number cannot meet the design requirements. After the algorithm design, the number of cameras is increased based on adjusting the existing layout to solve this problem. At the same time, the types of cameras have also been optimized to increase the number of 3 mm cameras and reduce the blind area in the distribution area. The number of 12 mm cameras is reduced to avoid unnecessary repeated coverage.
Conclusion
In the future, the CCTV system in urban rail transit will inevitably develop in the direction of integration, intelligence, and three-dimensional, providing users with a unified business interface and multi-dimensional information. Therefore, the disadvantages of single business content based on two-dimensional CAD integration can not meet users’ needs. In this study, BIM technology has been used to create a quantified three-dimensional intelligent distribution system. The Metro CCTV video surveillance system can now be built more efficiently. The foundation for its extensive use has been laid by the system’s optimization recommendations for the layout design of surveillance cameras at the design level.
Footnotes
Declaration of conflicting interests
The author(s) declared no potential conflicts of interest with respect to the research, authorship, and/or publication of this article.
Funding
The author(s) disclosed receipt of the following financial support for the research, authorship, and/or publication of this article: The following fund supports this study. “Optimization and decision making of intelligent transportation and logistics” project of excellent young and middle-aged science and technology innovation team of colleges and universities in Hubei province, project No.: T201828.