
Abstract
In this work, open-loop position tracking using low-cost inertial measurement units is aided by Takagi-Sugeno velocity classification using the subtractive clustering algorithm to help generate the fuzzy rule base. Using the grid search approach, a suitable window of classified velocity vectors was obtained and then integrated to generate trajectory segments. Using publicly available experimental data, the reconstruction accuracy of the method is compared against four competitive pedestrian tracking algorithms. The comparison on selected test data, has demonstrated more competitive relative and absolute trajectory error metrics. The proposed method in this paper is also verified on an independent experimental data set. Unlike the methods which use deep learning, the proposed method has shown to be transparent (fuzzy rule base). Lastly, a sensitivity analysis of the velocity classification models to perturbations from the training orientation at test time is investigated, to guide developers of such data-driven algorithms on the granularity required in an ensemble modeling approach. The accuracy and transparency of the approach may positively influence applications requiring low-cost inertial position tracking such as augmented reality headsets for emergency responders.
Introduction
The ad hoc tracking of humans in global navigation satellite system (GNSS)-denied environments is an increasingly urgent requirement given over 55% of the world’s population were reported to inhabit urban environments in 2018, places that are prone to GNSS signal fading and multipath effects. 1 In narrowband ranging for instance, the received signal in a severe multipath environment will be the sum of multiple carrier signals having different amplitudes and phases, thus distorting the range measurement. 2 For tracking emergency responders, the development of GNSS-independent systems has the potential to save the lives of casualties through enhanced operational efficiency, as well as the lives of responders themselves through improved situational awareness. A shift in reliance from GNSS is also valuable for maritime and aeronautical navigation due to advances in spoofing and disruption caused by personal privacy devices.3,4
While many positional tracking technologies have been proposed to tackle the problem including ultrawideband (UWB), radio frequency identification (RFID), wireless fidelity (Wi-Fi) and vision systems, most are not ad hoc methods, requiring careful deployment and configuration of transmitters and receivers into the tracking space a priori.5–10 Although breadcrumbing, the opportunistic placement of RFID tags upon arrival at the site of an incident, was proposed by Renaudin et al., 11 it has been reported sub-optimal due to the potential destruction of tags during operation and difficulties in retrieval afterward. 12 While visual odometry (VO) systems use cameras to track position using natural features and are infrastructure independent, they suffer from sensitivity to lighting conditions and featureless spaces. 13
Inertial sensors are self-contained sensors that involve creating an inertial element which remains fixed relative to the inertial reference frame, i, a frame fixed with respect to the distant stars. Inertial measurement units (IMUs) typically consist of three mutually orthogonal gyroscopes measuring the angular velocity of the sensor body frame, b, relative to the i-frame, expressed in b, denoted
Strapdown inertial navigation
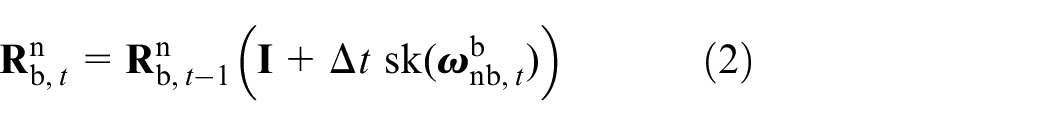
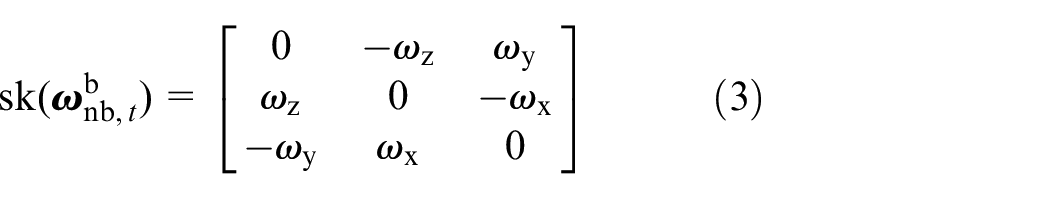
In strapdown inertial navigation, position is estimated relative to a known initial condition by integrating measurements, a process of dead reckoning. 14 When navigating small distances on Earth using low-cost IMUs, the local geographic form of the navigation equations suffice assuming 15 :
(i) The contribution from the Earth’s rotation of ∼15° h−1 is considerably less than the noise and bias stability characteristics of the gyros.
(ii) The transport rate of the navigation frame, n, pointing North, East, and down (NED), over the Earth’s surface is negligible due to traveling small distances compared to its radius.
(iii) Coriolis acceleration contributions are negligible compared to the noise and stability characteristics of the accelerometers.
The navigation frame can thus be treated as inertial such that

where
where
While rotation matrices have been used to parametrize orientation, quaternions are equally applicable and Euler angles may be preferred for maneuvers not exceeding 10° in attitude. 16
Due to drift in the gyros and for initialization, measurements of vector fields induced by gravity and the geomagnetic field are used as cues in an Attitude and Heading Reference System (AHRS) to help converge and maintain accurate
With

Although this approach works well for navigation and strategic grade IMUs, they have noise and bias stability characteristics several orders of magnitude better than commercial IMUs.
20
Thus, despite a well-tuned AHRS algorithm, errors accumulate in
Heuristic approaches
Methods of position tracking that augment the double integration of acceleration with heuristic assumptions are promising alternatives. Two such methods in human tracking include pedestrian dead reckoning (PDR)22,23 and zero velocity updating (ZUPT).21,24 Both take advantage of the periodicity of human gait to better estimate displacement between strides while an AHRS handles orientation. Although they improve on strapdown inertial navigation, bounding the positional error growth linearly with the number of steps, PDR suffers from reduced generality to other types of motion such as vehicular and unconventional motions such as side-stepping and jumping. 25 ZUPT restricts placement of the IMU to the foot, risking damage to the sensor. 26 Furthermore, it also mandates a time-consuming calibration of the IMU’s gyro and accelerometers beforehand such as the method presented by Glueck et al. 27
Data-driven approaches
Given the limitations of the previous methods, data-driven approaches have been explored to replace the numerical integration steps in strapdown inertial navigation with deep learning regression models.
Inertial Odometry Network (IONet), 13 and Robust Neural Inertial Navigation in the Wild (RoNIN) 28 used supervised machine learning, performing sequence-to-one regressions of windowed IMU data from smartphones to estimate more accurate trajectories. While RoNIN regressed velocity vectors in the x-y plane of the navigation frame before integration, IONet directly regressed polar displacement vectors from IMU data. In contrast to the sensor placement restrictions imposed by heuristic approaches, these aimed for competitive tracking accuracy regardless of sensor attachment on the human body. Despite presenting improvements in trajectory prediction over conventional strapdown and heuristic methods, Silva do Monte Lima et al. 29 showed that guaranteeing acceptable model performance across disparate data sets remains a problem. Furthermore, the number of parallel nonlinear steps in neural networks learnt by backpropagation makes them not only difficult to interpret but also vulnerable to adversarial examples. 30 They are thus challenging to certify and implement in safety critical applications.
In this work, a classification approach is applied to estimating velocity vectors from IMU data for a given sensor mode of carriage on the human body. The functionality of the approach and sensitivity to orientation errors are investigated using the Oxford Inertial Odometry Data Set (OxIOD) 31 and the data set from RoNIN. 32 The contributions of this paper are:
(i) A subtractive clustering (SC) Takagi-Sugeno (TS) fuzzy classification approach to mapping IMU data to velocity vectors before integration for trajectory estimation. Unlike other data-driven algorithms that use deeply learnt regression models, the proposed SC-TS method produces a model that is transparent as input-output relations can be visualized in surface plots and membership functions (encoded by a mean and standard deviation).
(ii) A novel optimization approach to data pre-processing showing how IMU and ground truth data (experimental data) can be aligned in heading for consistency between sequences during training and testing.
(iii) A sensitivity analysis by Monte Carlo simulation investigating the loss in accuracy of the SC-TS method with increasing disparity between the training and test modes of carriage. To the authors’ best knowledge, this has not been reported elsewhere and paves the way to the creation of an ensemble tracking approach offering accurate tracking across a range of sensor-body attachments.
The remainder of the paper is structured as follows. Data pre-processing shows how the input and output data were obtained, including the optimization method which ensured their alignment in heading. The SC-TS classification model and its tuning are then outlined. The results show trajectories estimated by the proposed method compared with competitive algorithms, verification on an independent data set and results from the sensitivity analysis. A discussion of the results is presented followed by a conclusion and direction of future work.
Data sets and pre-processing
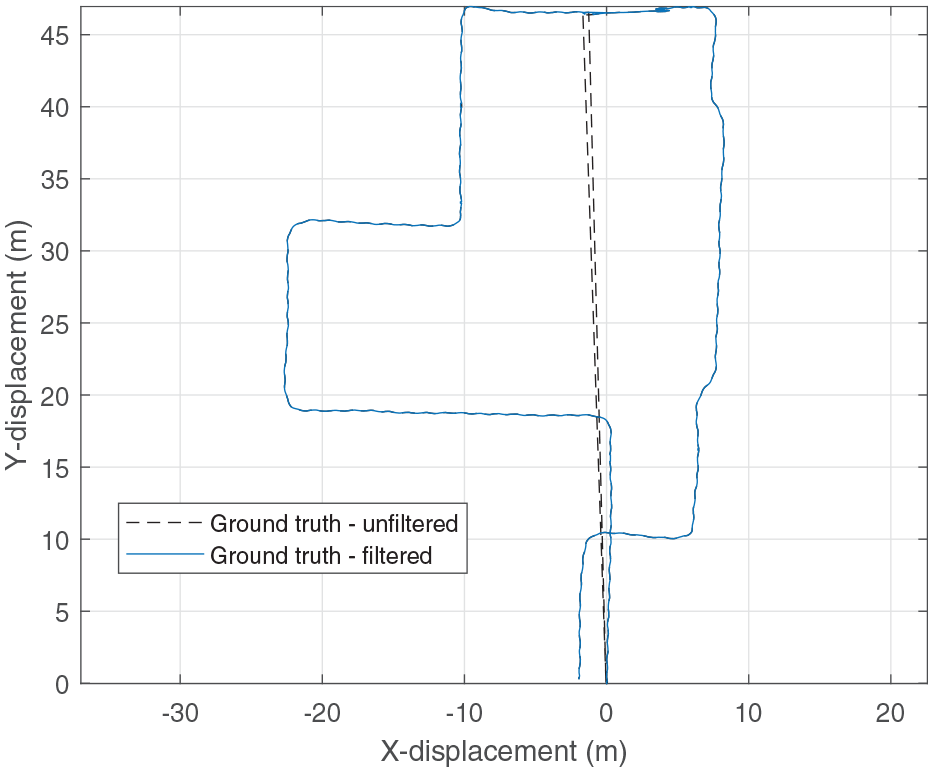
Data used to train the models and evaluate the approach were obtained from the OxIOD data set, containing 158 sequences of smartphone IMU and ground truth data for various devices and modes of carriage. The subset, “large scale,” was used since it featured less repetitive trajectories through a building’s corridors, more consistent with natural human motion. Figure 1 shows the ground truth trajectory for a floor one sequence generated by the visual-inertial odometry system.
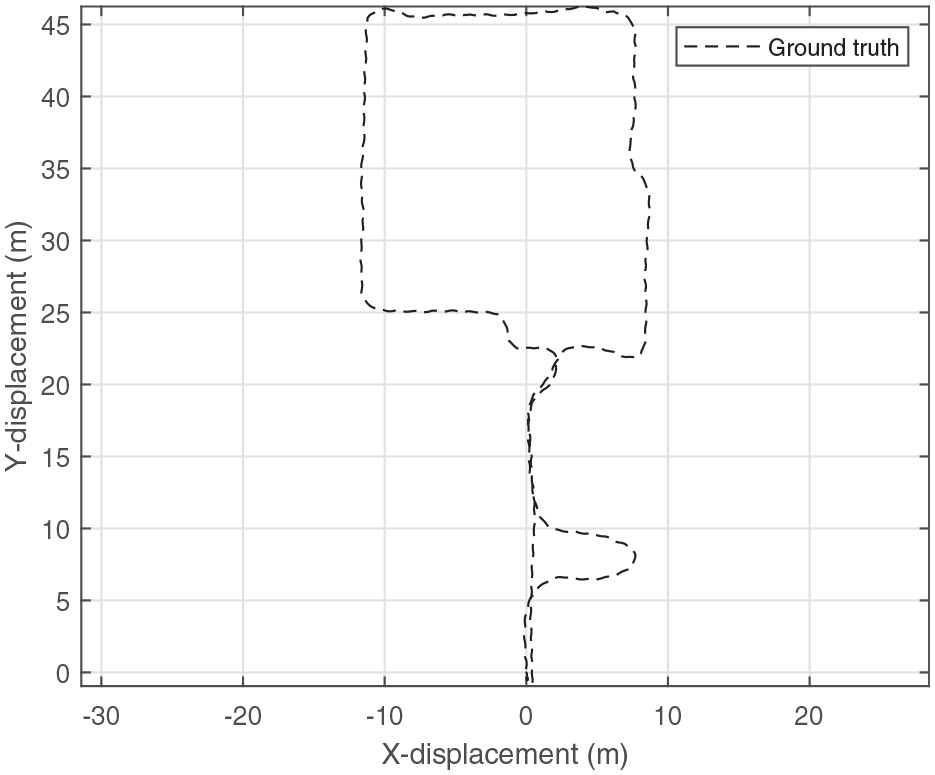
Floor one ground truth trajectory from “large scale” OxIOD data.
Training between various sequences was most effective when input IMU data and output ground truth data were expressed in a common reference frame. The locally-level frame, l, was chosen which is like the navigation frame but free in heading. During training, this frame was defined at the start of the sequence by the ground truth system and IMU input data aligned to it such that both inputs and outputs were expressed in
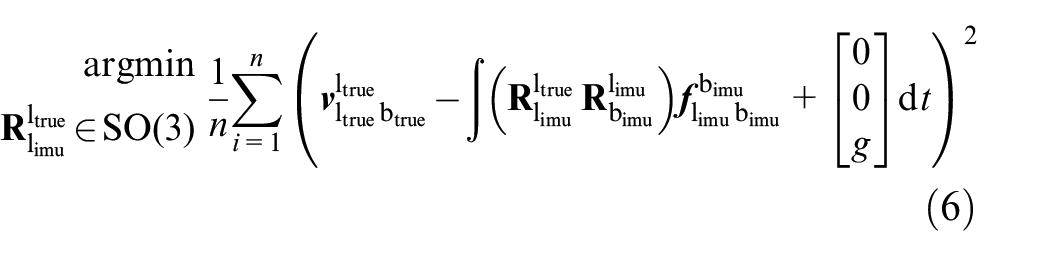
that is:
where

Some portions of
Hampel filter outlier replacement on ground truth trajectory data.
Taking the derivative in equation (8) was noisy so a zero-phase Butterworth lowpass filter was applied with a cut-off frequency of 5 Hz. A non-causal filter was used to avoid introducing phase distortion in the training data which may otherwise affect the accuracy of velocity classification at test time. These filtered velocities were the labels for the classification algorithm to learn for the corresponding inputs.
As in RoNIN, input features were windows, length

where:
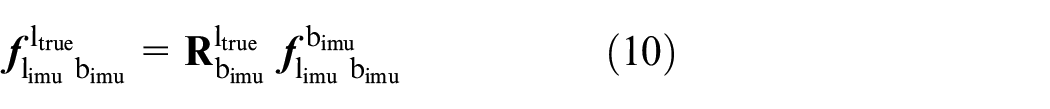

Note that the specific force input in equation (10), is not gravity compensated which represents a departure from the principles of strapdown inertial navigation. It was found that using gravity-compensated specific force reduced the accuracy of trajectory estimated by the algorithm.
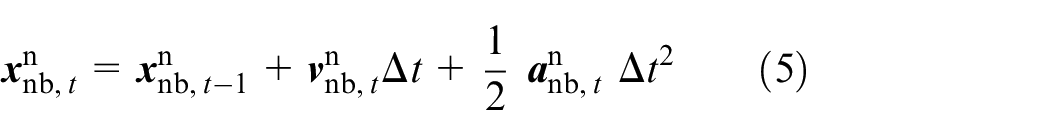
At test time, velocity estimates from the classifier constructed trajectories by the first order numerical integration scheme:

SC-TS velocity classification models
TS velocity classification models were generated based on clusters found by the SC algorithm for a given IMU mode of carriage featured in the data set.
An extension of the grid-based mountain clustering method, SC is a fast method for clustering high dimensional input data.
35
Economou et al.
36
used SC to obtain local models of a skid steer robot’s dynamics over its steering envelope and Muhammad et al.
37
used the algorithm for accurate stance detection of human gait. Unlike fuzzy c-means (FCM) and k-means clustering, SC does not require the number of clusters to be defined a priori but rather a radius of influence,
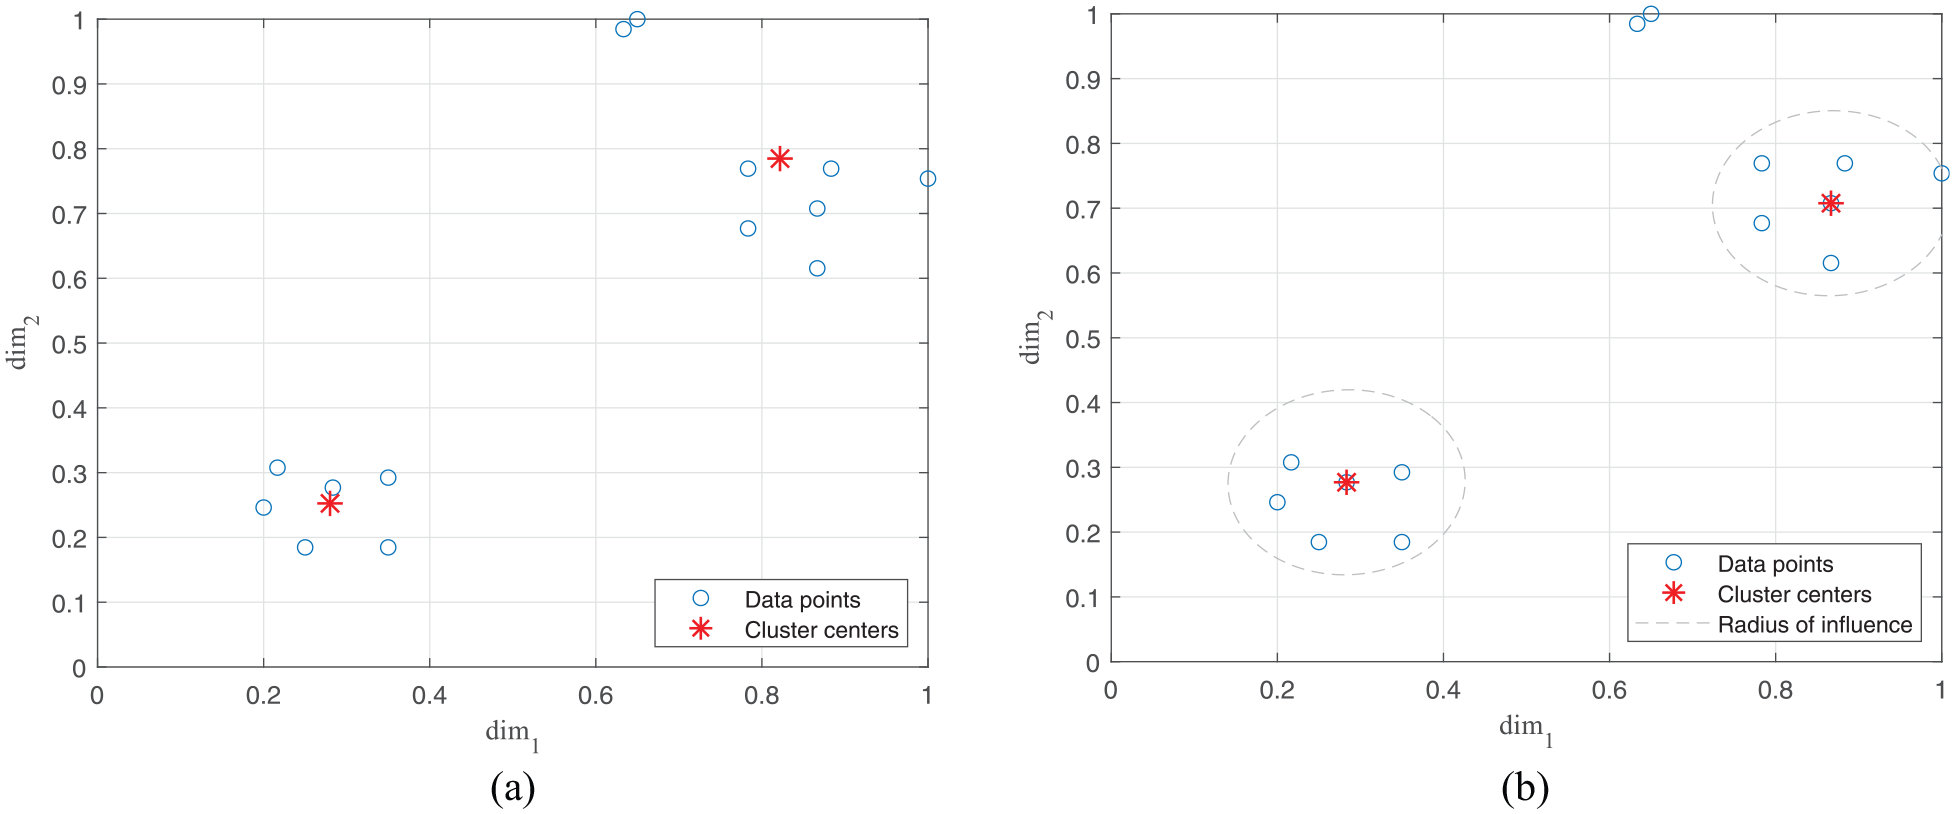
(a) Cluster centers estimated by FCM and (b) cluster centers estimated by SC.
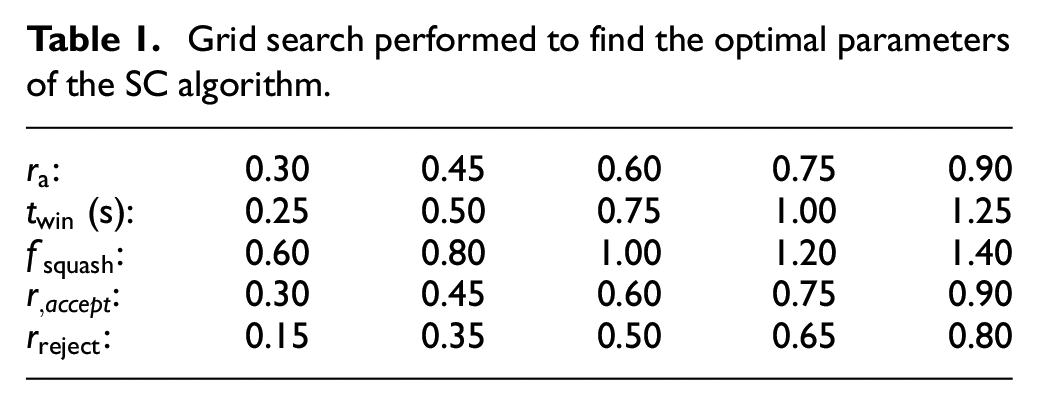
A grid search for the optimal

3125 train and test instances were carried out using combinations of the parameters in Table 1. The lowest MSVE of 0.05 ms−1 was achieved for
Grid search performed to find the optimal parameters of the SC algorithm.
Results
Figures 4 and 5 show examples of cluster centers found by the SC algorithm and a surface plot of the TS fuzzy rule base respectively.
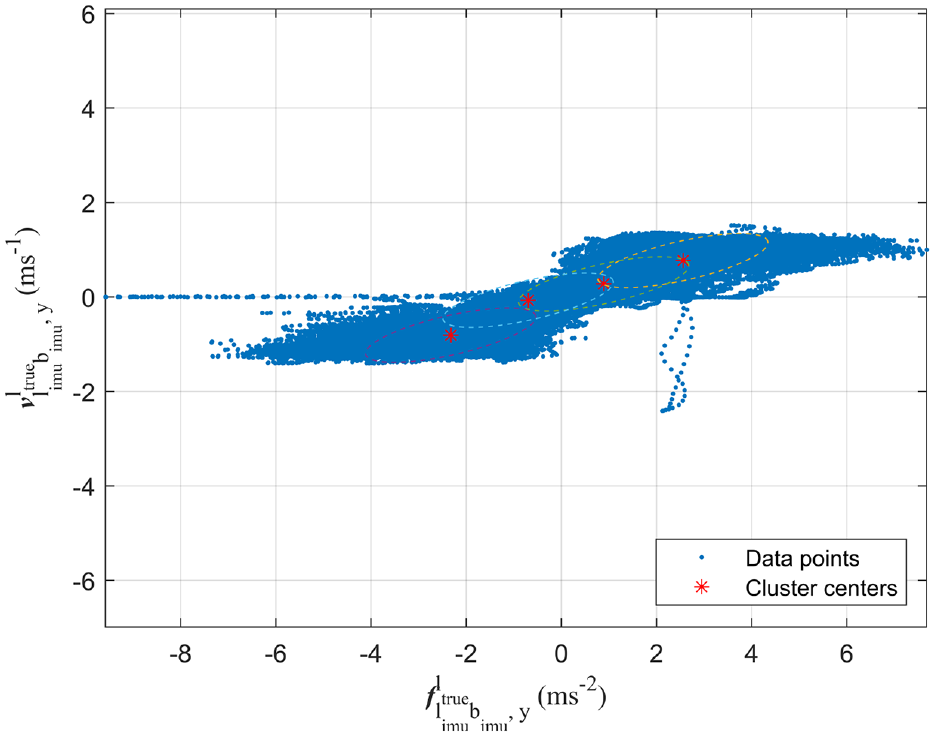
Cluster centers and radii found by the SC method in y-direction specific force.
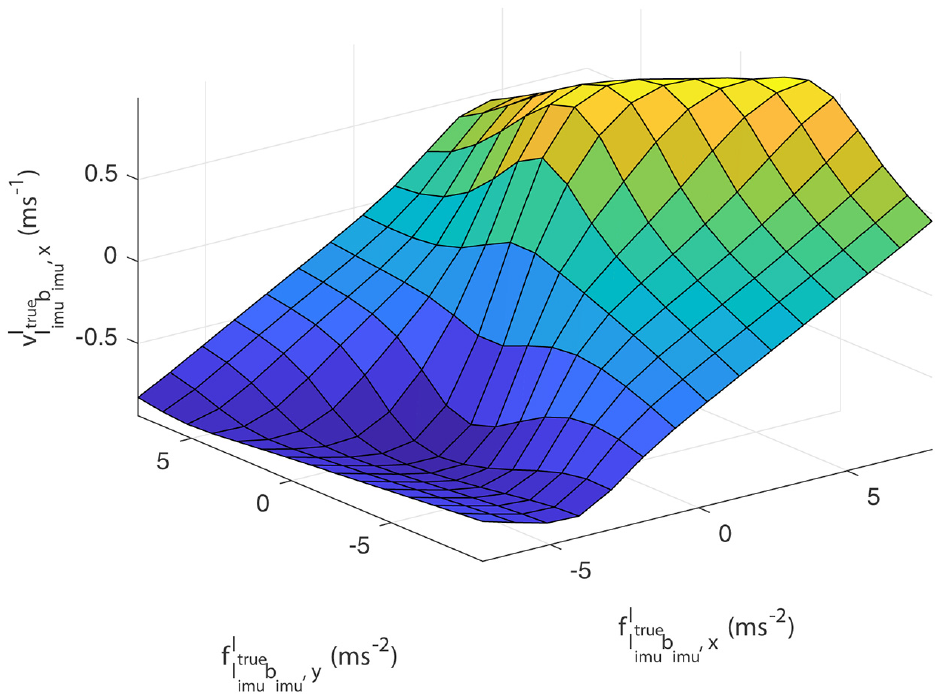
Surface plot mapping x-y acceleration inputs to x velocities.
The accuracy of the SC-TS velocity classification algorithm was tested against four competitive methods reported in literature: RoNIN, IONet, strapdown inertial navigation and ZUPT.
The RoNIN Python code was obtained from GitHub but as the IONet code was not made public, a local implementation was made in Matlab to the authors’ best abilities using details from. 38 The latest gait tracking algorithm from X-IO Technologies was used as the ZUPT baseline with default parameters. 39
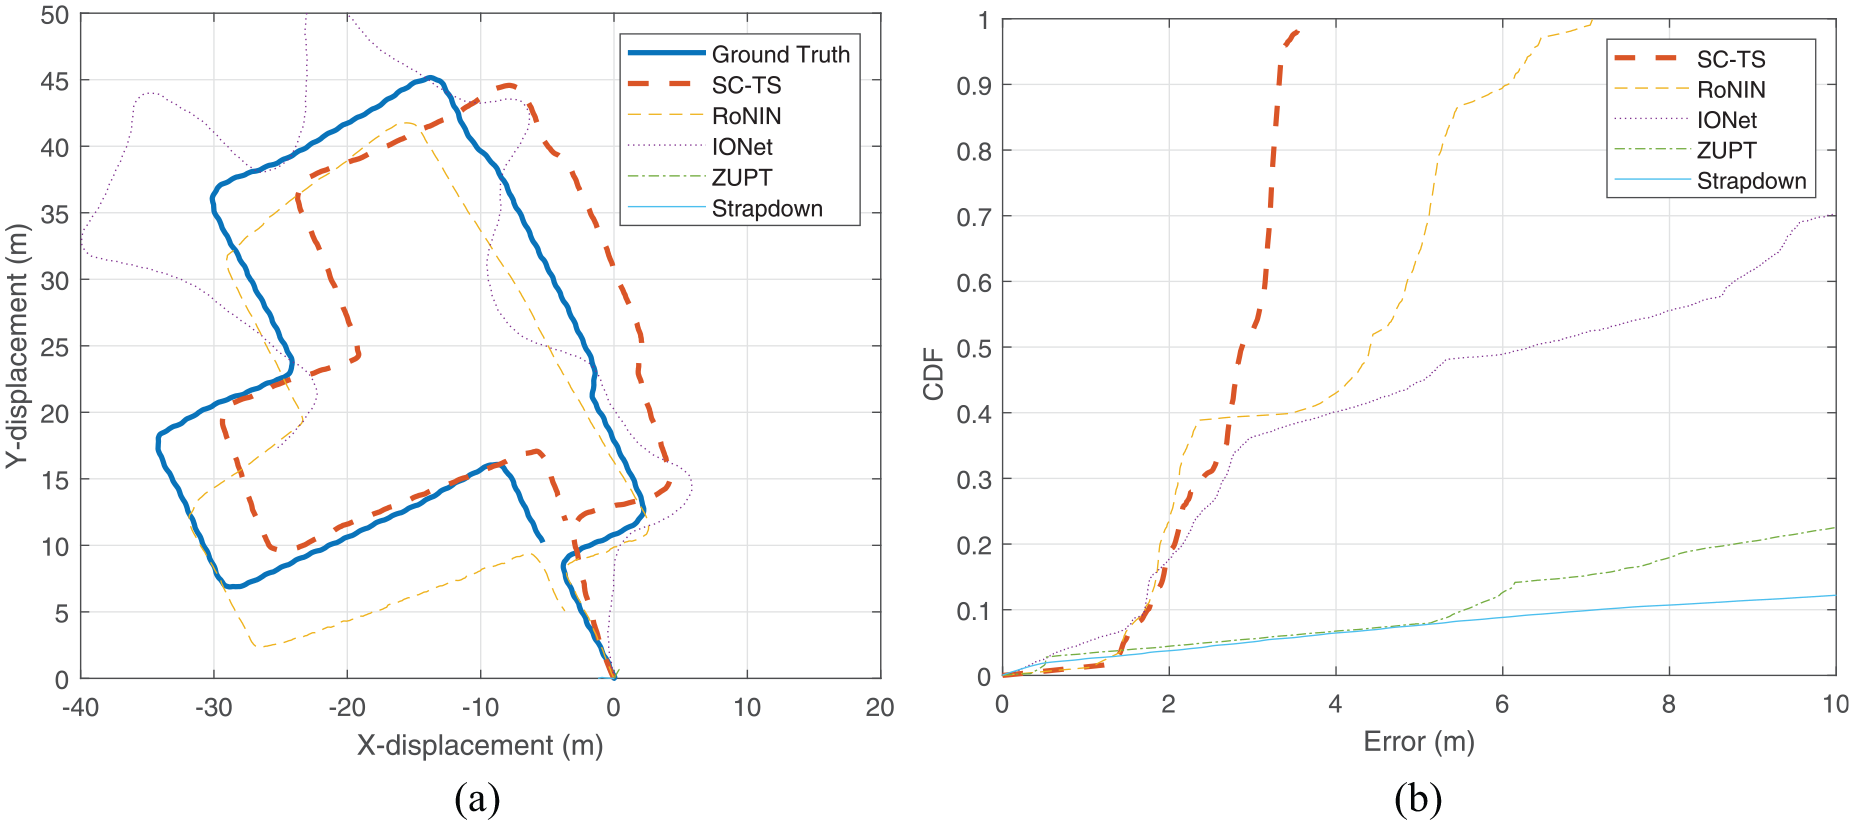
The “large scale” subset of trajectories from the OxIOD data set were used for performance evaluation, having a mean duration of 150 s. Three general IMU modes of carriage were identified by their attitude angles shown in Figure 6(a) to (c). For each sequence and algorithm, the MSVE, relative (RTE) and absolute (ATE) trajectory errors as defined by Strum et al. 40 were used as performance metrics. For the RTE, the same definition implemented in the RoNIN code was used for fairness where it was calculated as the mean root-mean square error (RMSE) for sub-trajectories of length one up to the entire sequence length.
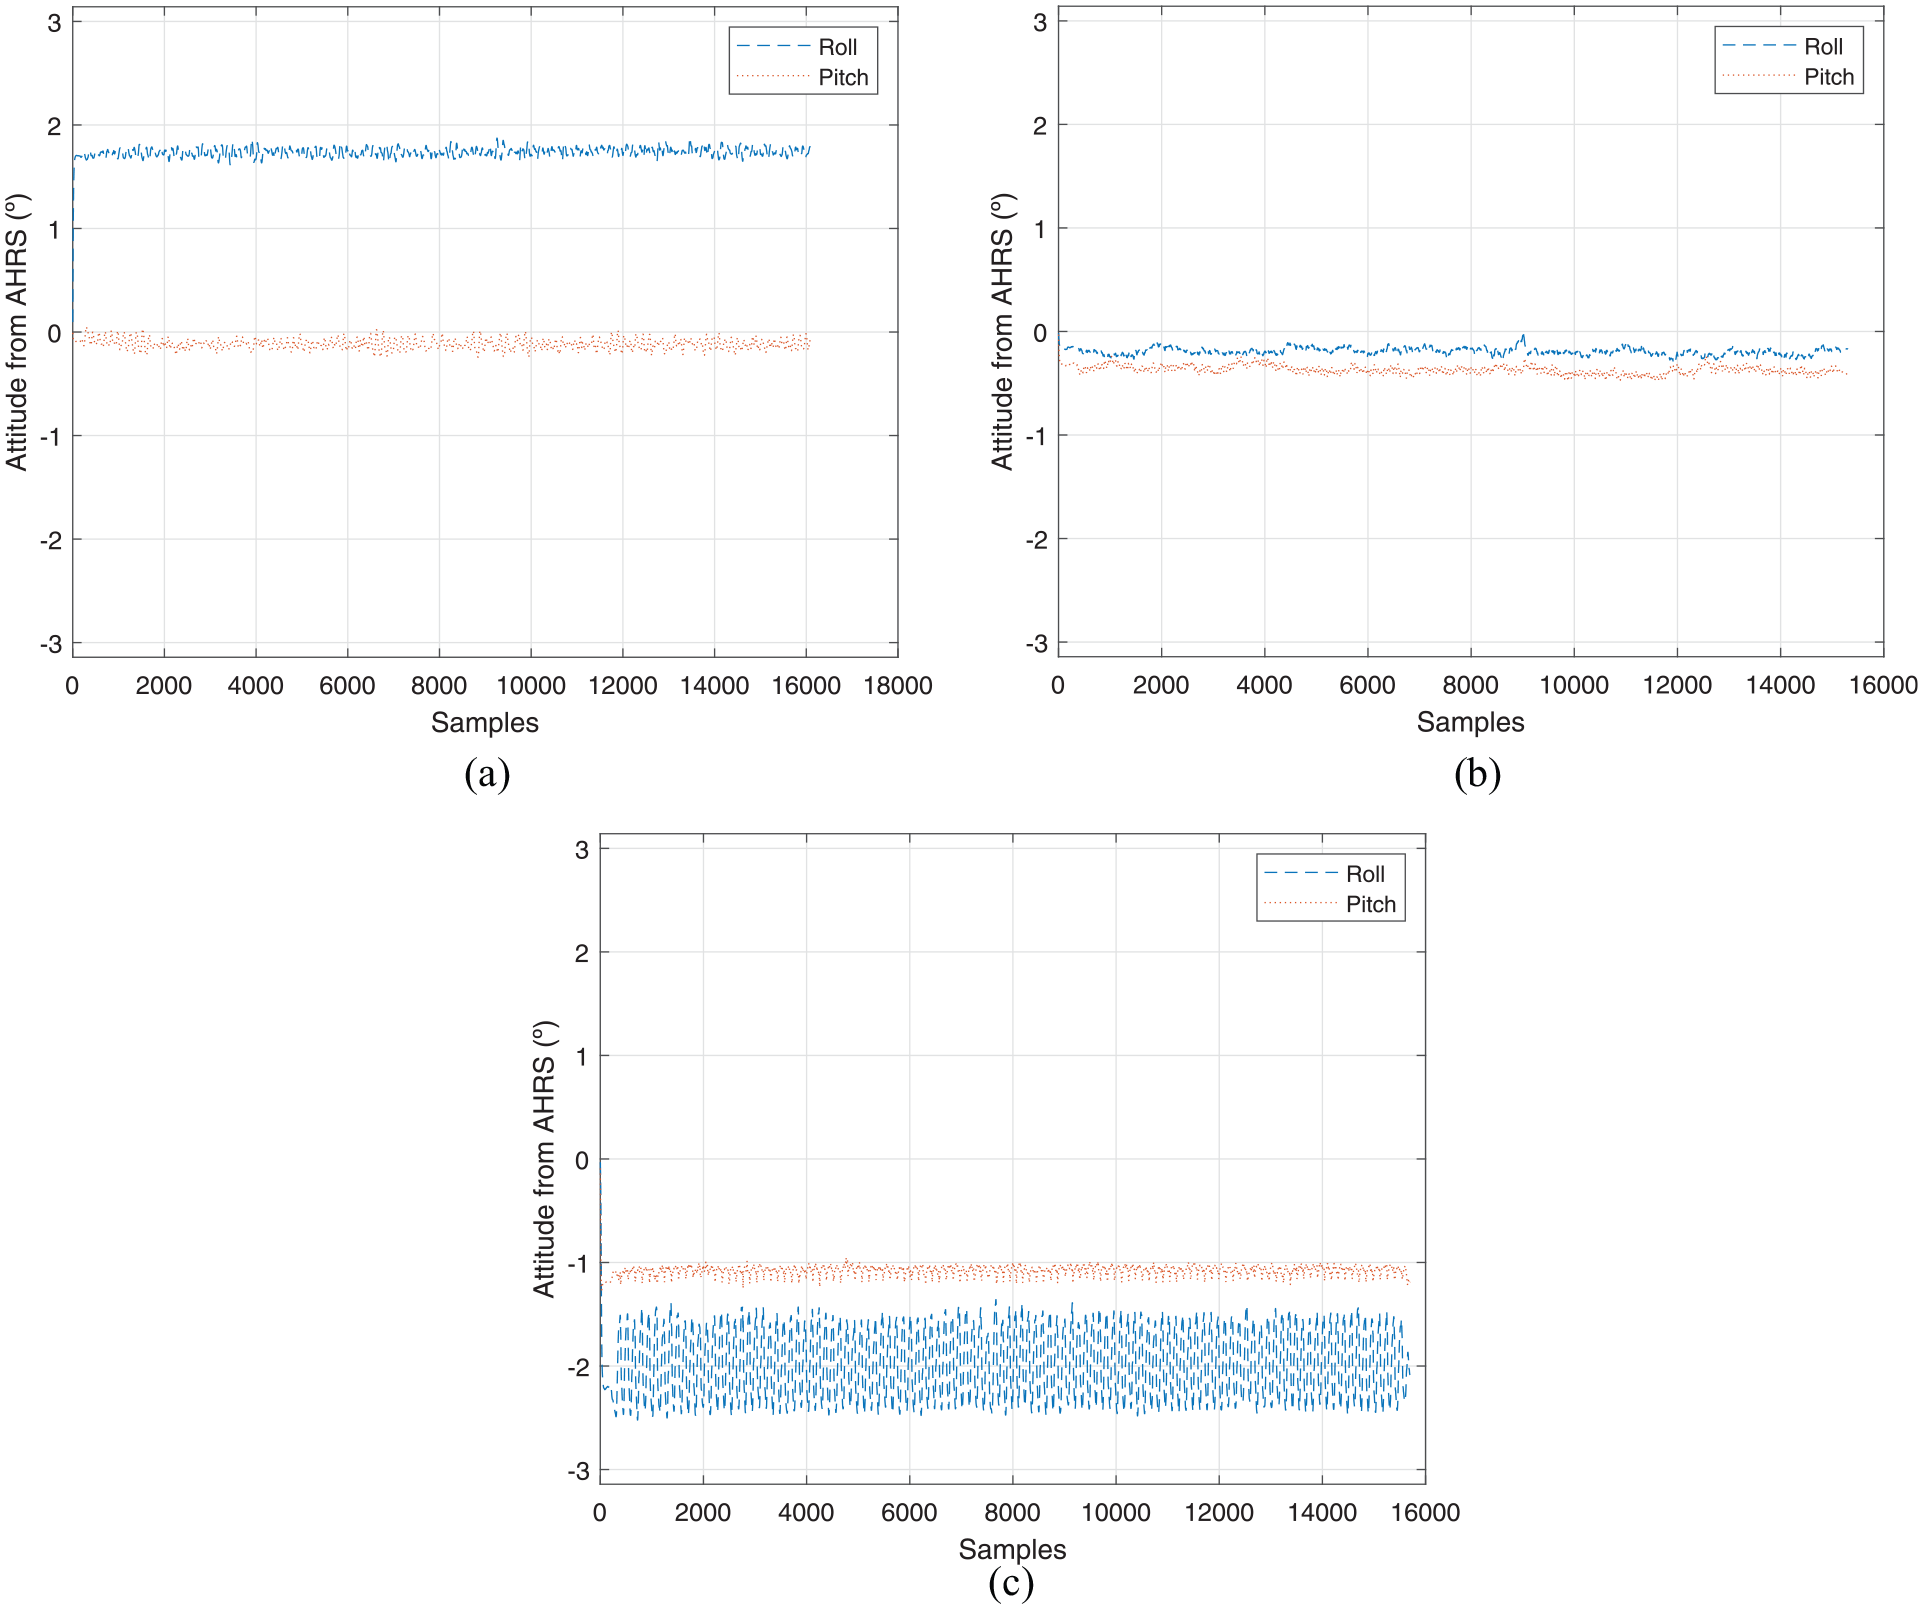
(a) Mode one attitude angles, (b) mode two attitude angles, and (c) mode three attitude angles.
Further tests on the RoNIN data set, were performed to verify the SC-TS method. For this data, the optimization step in equation (6) was not required as this alignment was provided a priori. Figure 10(a) and (b) depict the trajectories estimated for the “a000” and “a010” set of sequences respectively.
The SC-TS method and other data-driven approaches such as IONet and RoNIN initially trained models to estimate vectors for certain modes of carriage of IMU sensor on the body. It was therefore of interest to investigate how the accuracy of velocity and position estimation changed due to perturbations from the orientation featured in the training data.
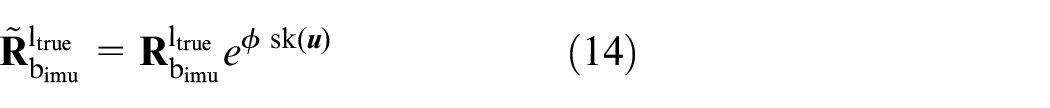
Using the sequence of Figure 9 (mode three test sequence), perturbed orientations,
Due to the randomness in
Discussion
Figures 4 and 5 show examples of clusters found in data and the surface plot of the resulting TS fuzzy rule base respectively. In Figure 5, it can be seen how positive accelerations in the x-direction intuitively map to positive x-velocities in the locally level frame. Observing the gradients in x and y axes, accelerations in the y-direction have less influence on the x-velocity output compared to accelerations in the x-direction. Output velocities in the x-direction are bounded between about ±1 ms−1. The SC-TS model is thus more transparent than other black box models generated by deep learning.
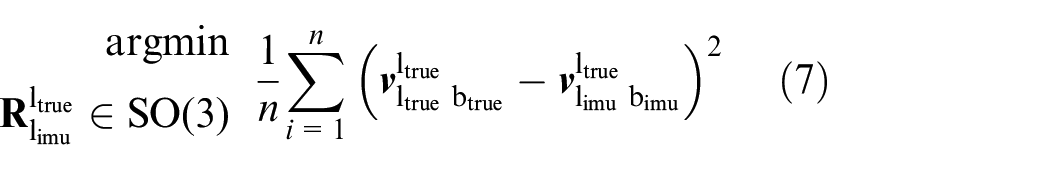
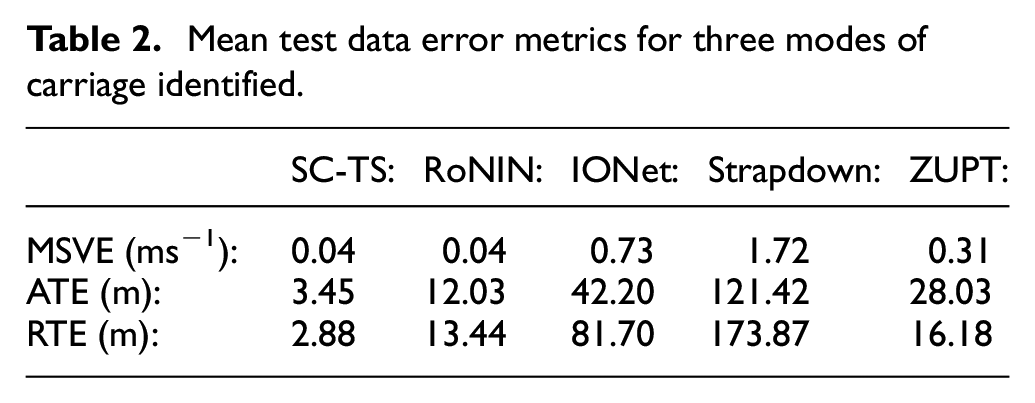
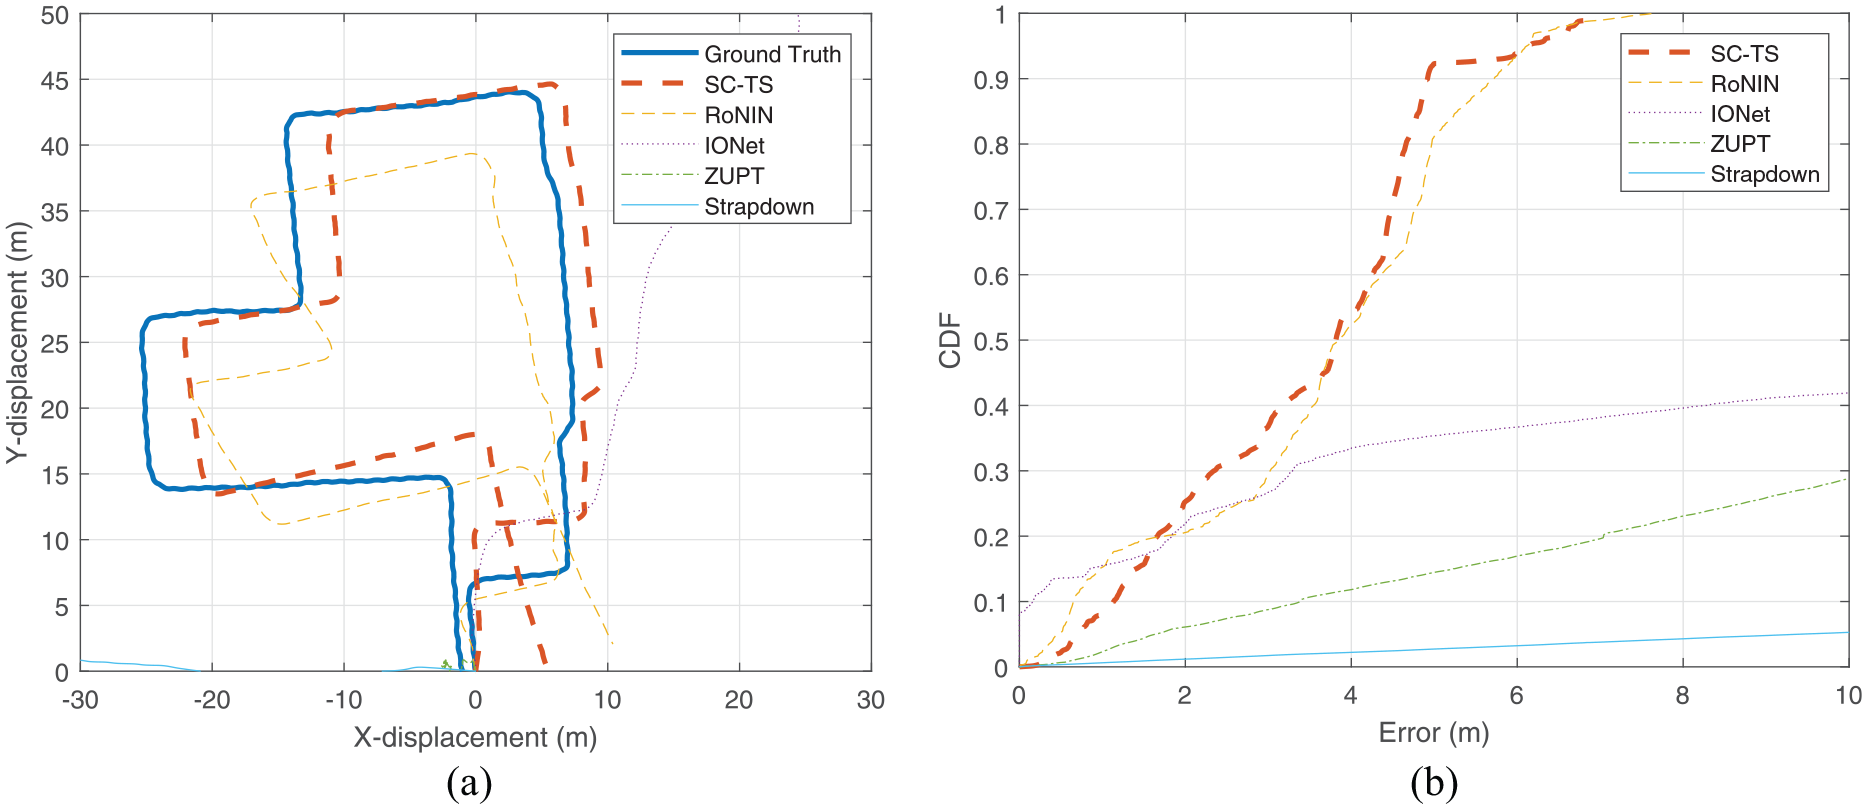
The mean error metrics in Table 2 show how the proposed SC-TS method and RoNIN achieved the same MSVE over the three “large scale” test sequences of the OxIOD data set with the former achieving a more than three-fold reduction in RTE and ATE over the latter. Using the SC method, a mean positional error rate of 4 cms−1 of walking motion can be expected. As both were provided with the same alignment orientation described by equation (7), the TS-SC method appears to have reduced the rate of inertially-derived positional error growth at least as well as sequence-to-one regression methods like RoNIN. The cumulative distribution function (CDF) plots of the absolute positional error in Figures 7(b), 8(b), and 9(b) support this finding. While both SC-TS’s and RoNIN’s input features were specific force and angular velocity projected in the locally-level frame, the superior accuracy in RTE and ATE of the proposed method may have been due to the tuning parameters of the SC algorithm which, found by grid search, helped create a classification rule base that was less affected by outliers compared to a deep learning regression model.
Mean test data error metrics for three modes of carriage identified.
(a) Estimated test trajectories for mode one and (b) CDF of absolute positional error for mode one test trajectory.
(a) Estimated test trajectories for mode two and (b) CDF of absolute positional error for mode two test trajectory.
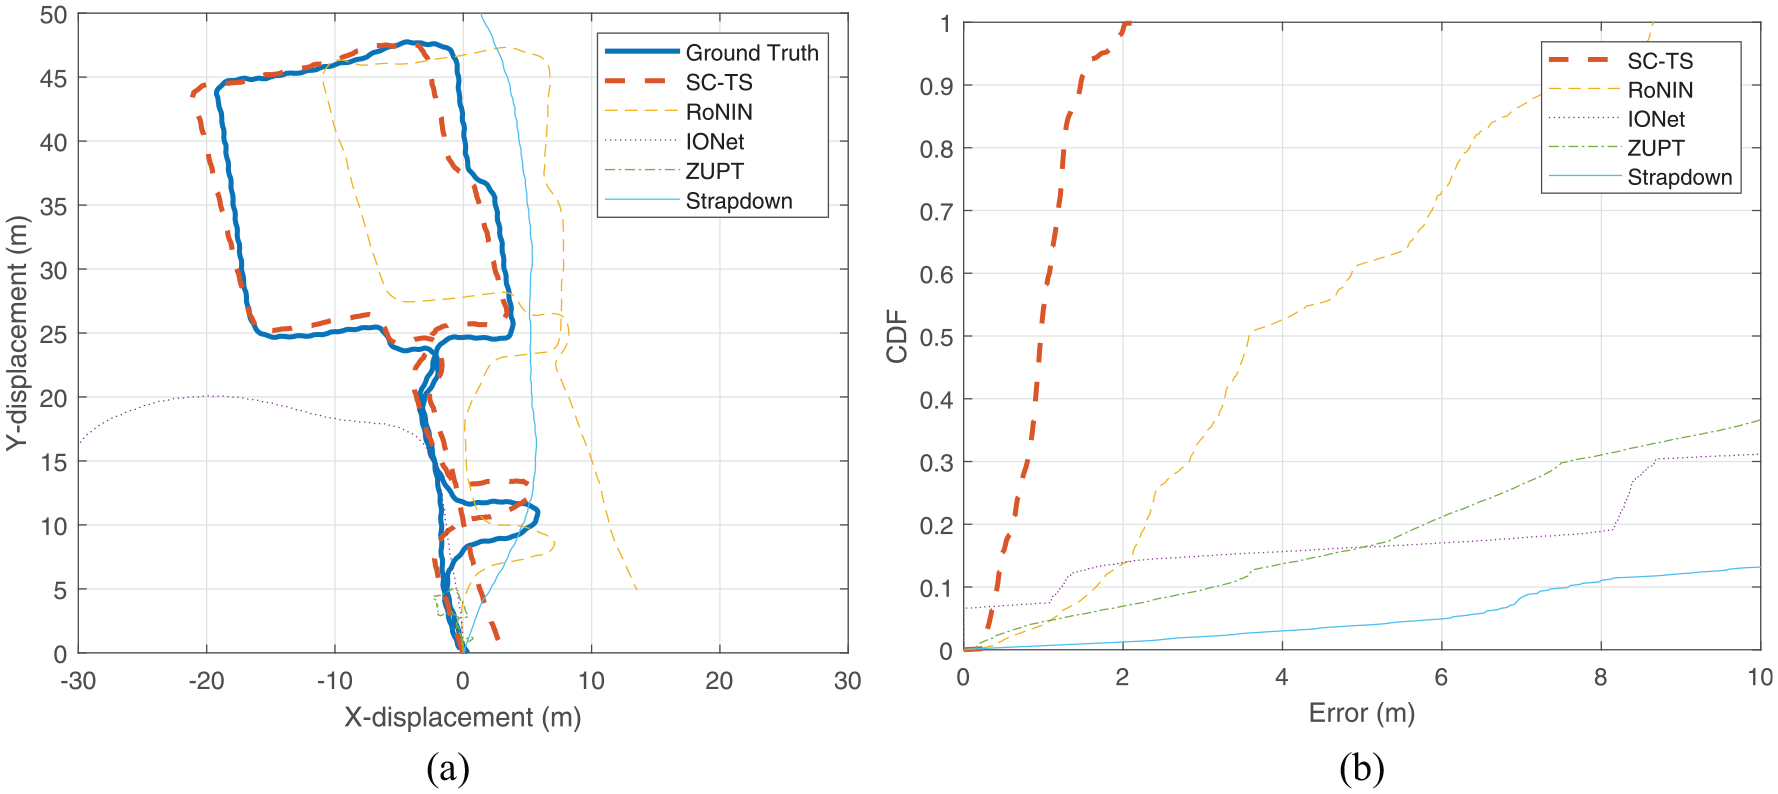
(a) Estimated test trajectories for mode three and (b) CDF of absolute positional error for mode three test trajectory.
The ZUPT baseline was less accurate than the SC-TS method and RoNIN, with a mean MSVE almost eight times larger than the former methods. This was because ZUPT is intended for foot mounted IMUs whereby frequent zero velocity instances provide opportunities for integral drift estimation and compensation. Such instances were not featured in the OxIOD and RoNIN sequences as the IMUs were sampled from IMU-eq15 smartphones carried on the upper body. IONet yielded a MSVE twice that of ZUPT, possibly due to input features being expressed in the b-frame rather than the l-frame, making it more sensitive to disparities in orientation featured in training and test data. Furthermore, since IONet’s output features consist of a distance and change in heading angle, the accuracy of its trajectories is highly reliant upon accurate estimation of the change in heading angle by the deep neural network. A single erroneous heading change will thus be penalized heavily by the error metrics, especially the ATE. Finally, strapdown inertial navigation was the worst performing baseline due to the rapid accumulation of errors in the open loop double integration of gravity-compensated acceleration mentioned previously.
The validity of the SC method was demonstrated by applying it to the independent RoNIN data set. Visual inspection of Figure 10(a) and (b) show how the algorithm captured certain features of the ground truth trajectory but with errors visibly larger compared to the results from OxIOD. This may be due to the insufficient capture of stationary periods by the TS models which resulted in the large translational error seen in Figure 10(a) or the momentary changes in the IMU’s mode of carriage featured in the RoNIN data set which makes it a more challenging benchmark than OxIOD.
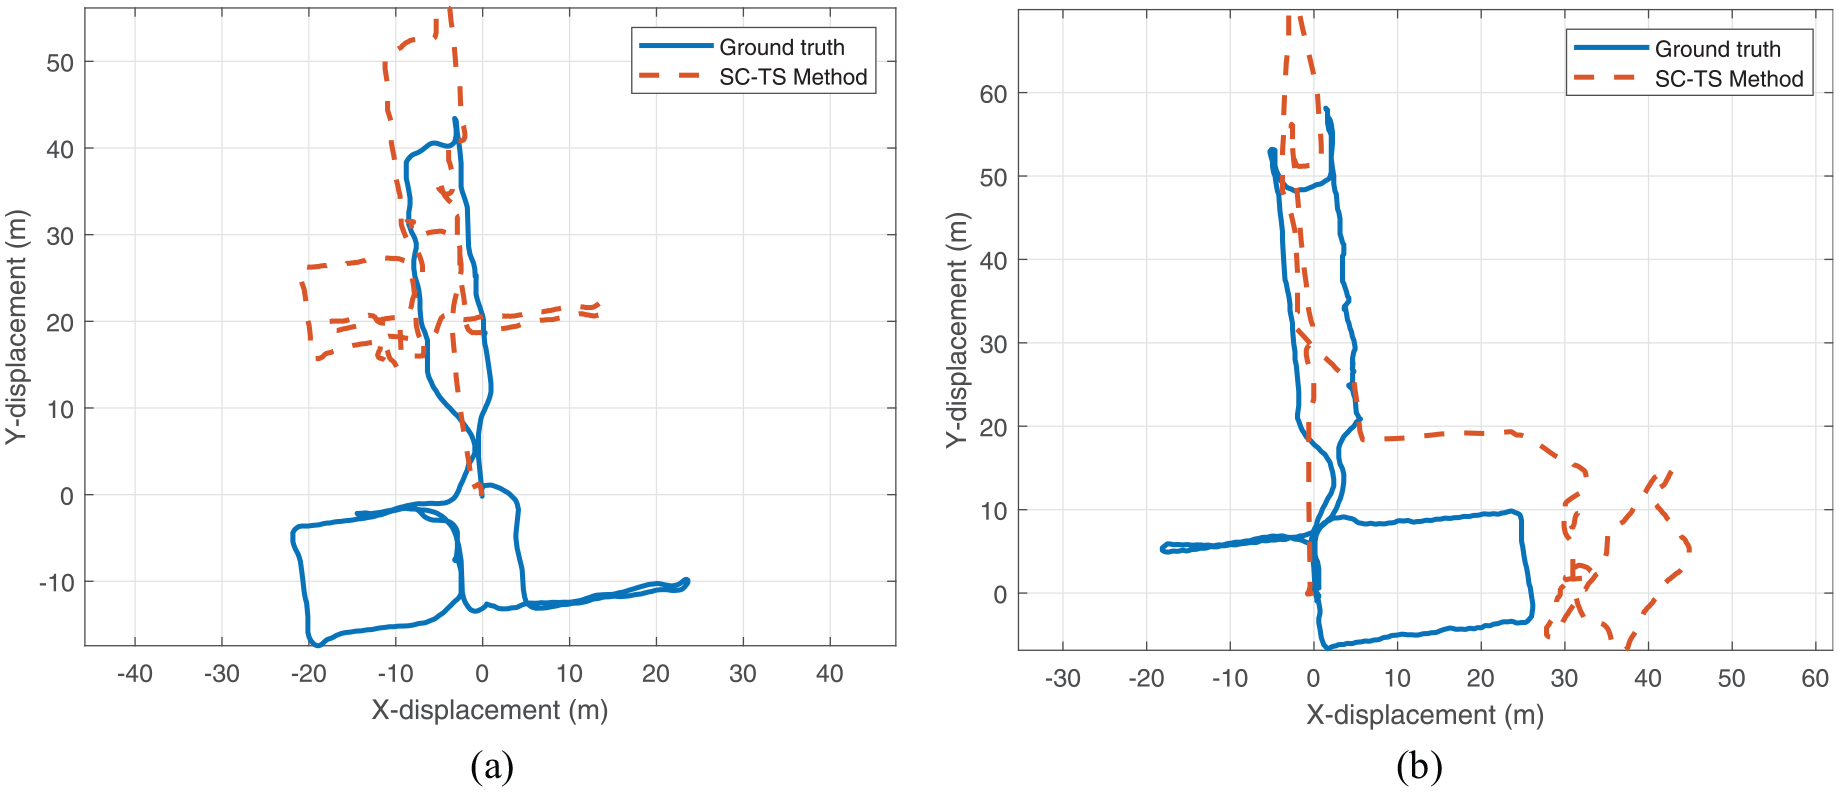
(a) Estimated test trajectory on RoNIN data set sequence a000_3 and (b) estimated test trajectory on RoNIN data set sequence a010_3.
The sensitivity analysis of the SC-TS method presented the increase in the MSVE, RTE and ATE that can be expected with increasing disparity between the orientation featured in the training data and that used at test time. This is useful since to achieve generalization to varying modes of carriage which may occur during natural human motion, RoNIN and IONet both proposed training models for a given orientation and then interpolating between them, akin to an ensemble modeling method. An investigation into the change in tracking accuracy with deviations from the design orientation may therefore help developers decide on the granularity with which the manifold of SO(3) should be covered by their models to meet a required error metric. For instance, referring to Figure 11, if a MSVE no greater than 10 cms−1 is required then the algorithm should train and interpolate between models with a granularity no coarser than 30°. The impact of this design choice on the RTE and ATE can also be estimated from Figures 12 and 13.
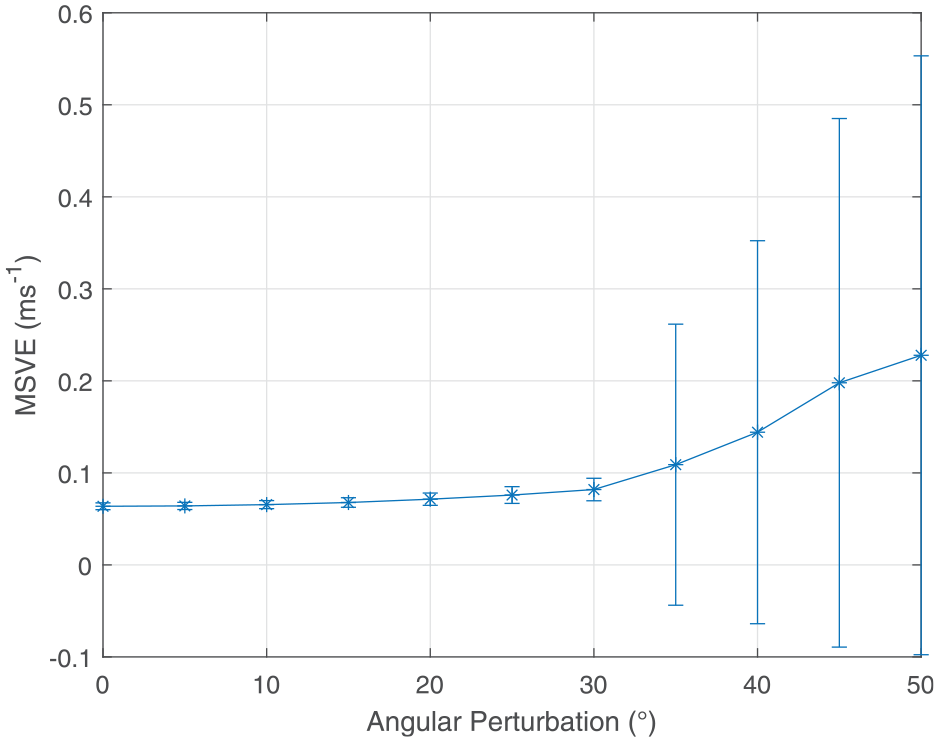
Plot of MSVE with perturbation angle showing 1σ error bars.
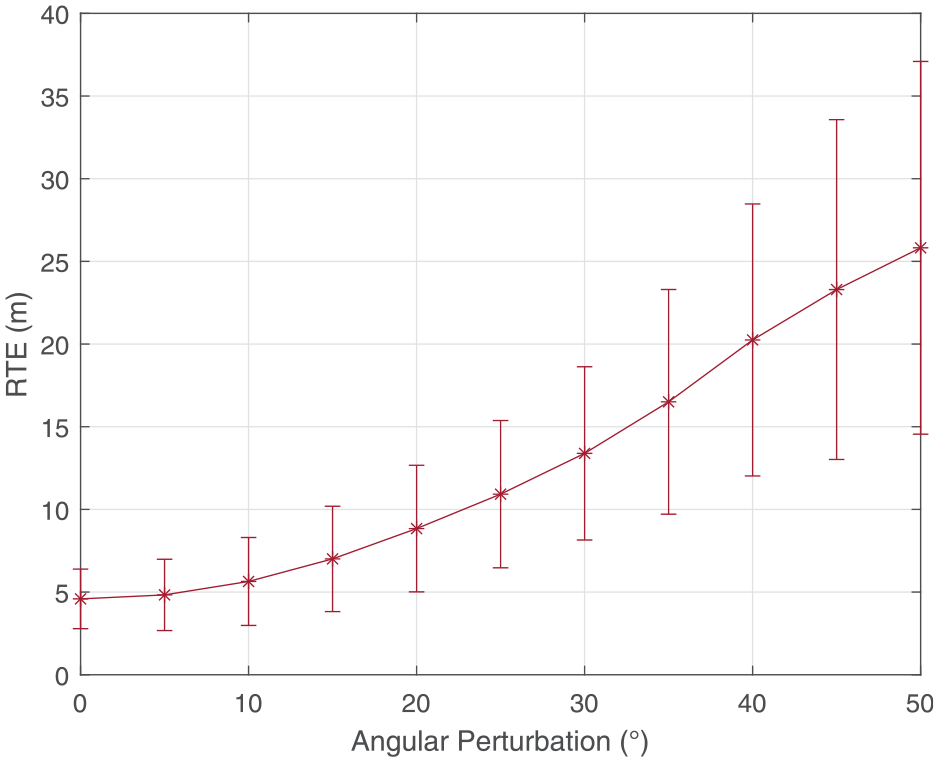
Plot of RTE with perturbation angle showing 1σ error bars.
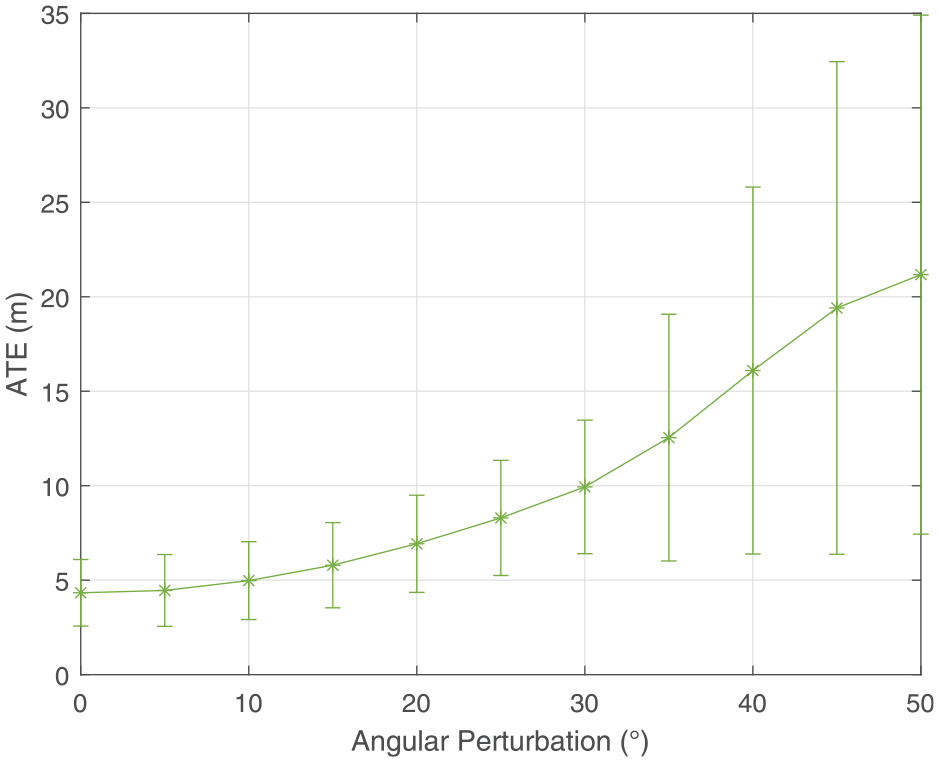
Plot of ATE with perturbation angle showing 1σ error bars.
Conclusion
This work proposed a novel velocity classification method for more accurate positional tracking of humans carrying inertial sensors, contrasting with previous works which used deeply learnt sequence-to-one regression models. The SC-TS algorithm first identified patterns in the input data, projected a priori into a locally-level frame, and encoded the mapping to corresponding velocity vectors in a TS rule base. The integration of gravity compensated acceleration resulting in exponential positional error accumulation seen in strapdown inertial navigation was thus avoided. By solving a nonlinear optimization problem, it was shown for the first time how the misalignment between the locally-level frames defined by ground truth system and IMU can be found and applied to the sequences of the OxIOD data set. While others have used deep learning in their approaches to create black box models, the proposed SC-TS method is more transparent and interpretable. This may be an added benefit when certification of the algorithm is required before implementing in a safety critical application.
In terms of RTE and ATE metrics, the proposed SC-TS method outperformed the other baseline methods achieving mean values of 2.9 and 3.5 m respectively over sequences of about 150 s in duration from the OxIOD data set. This was likely due to the robustness of the SC algorithm to outliers in data, with the optimal tuning parameters being found by grid search. Visual inspection of results on an independent data set confirmed the validity of the method while also revealing its vulnerability to stationary periods and momentary changes to the mode of carriage on the body which could be addressed in future work.
The sensitivity analysis presented the losses that should be expected due to deviations of the IMU’s mode of carriage featured in the training data compared with that used at test time, offering a useful reference for future algorithm developers working toward an ensemble motion tracking model.
Footnotes
Declaration of conflicting interests
The author(s) declared no potential conflicts of interest with respect to the research, authorship, and/or publication of this article.
Funding
The author(s) disclosed receipt of the following financial support for the research, authorship, and/or publication of this article: This paper was sponsored by EPSRC iCASE Grant reference EP/S513623/1 and BAE Systems.
Data availability statement
The data that support the findings of this study are openly available to download from Google Drive via http://deepio.cs.ox.ac.uk/ for the OxIOD data set and in the Federated Research Data Repository at ![]() for the RoNIN data set.
for the RoNIN data set.