
Abstract
In the automotive application for Electronic Control Units (ECU), dynamic models with high-precision to simulate mechatronic actuators are required for various analysis and design tasks like Hardware-in-the-Loop (HiL) simulation. It is known that the modeling of systems with significant friction effects is not accessible. The piecewise-affine (PWA) model has recently attracted considerable interest due to its high approximation capability for modeling systems with friction. Because the model quality depends intensely on the test signal design, a model-free optimized excitation signal design for identifying PWA models is presented in this paper. The presented method is demonstrated with an automotive throttle, and a PWA model is identified with a four-step identification approach. The result shows that the optimization method can achieve a better model quality, which is sufficient for the HiL simulation.
Introduction
Motivation and literature review
Improved fuel efficiency and reduced emissions are steadily increasing in the development and optimization of modern powertrain. If the dynamic system models are available, model-based analysis and design methods can help achieve the powertrain’s improved performance. Hardware-in-the-Loop (HiL) simulation provides a virtual vehicle by modeling the dynamical behavior. Electronic Control Units (ECU) can be developed and tested invariant or extreme real-time driving conditions without real driving risk. Therefore, models with good prediction quality are steadily required under real-time test conditions.
Usually, the mathematical modeling of dynamic processes can be achieved based on physical principles. However, challenges like lack of pre-knowledge or complex parameter estimation methods and conditions should be faced when using such techniques.1–4 This problem motivated the development of data-driven modeling methods, in which precise pre-knowledge is unnecessary, and parameterization is relatively simple. As a typical data-driven method, piecewise-affine (PWA) models have recently become attractive due to their high approximation capability for nonlinear systems. PWA-model is defined by mapping regression space into polyhedral convex regions and establishing affine models in each region. PWA-model can efficiently solve several challenging problems in system analysis, prediction and simulation modeling, and controller design.5–8 Globally, the PWA model can approximate nonlinear systems, and locally, the mapping from the regression to the output space allows the transfer of linear theory directly to nonlinear systems. As an alternative, neural-fuzzy models were also researched in recent years. A typical application is the neural-fuzzy based Hammerstein-Wiener model, which is successfully implemented to approximate complex nonlinear industrial processes.9,10
The identification quality needs to excite the target system in the possible operating range for the data-driven modeling with the PWA model. The excitation signal plays a crucial role in the data information content, which influences the quality of the model.11–14 However, the selection of excitation signal is usually a necessary procedure to obtain system response with high quality so that the multi-model can be precisely estimated in the system identification. Because the measurement in the system identification is time-consuming and expensive, the effort for data acquisition should be kept as low as possible. 15 This problem motivates the design of optimal excitation signals for fast identification with optimized experiment costs. Once an optimized data set contains enough target system information, accurate identification can be guaranteed. Often, a suitable input signal for identifying a nonlinear system is a signal that should try to cover the input space and relevant frequencies with little effort for the target application.13,14 Therefore, the main objective of excitation signal design is to extract as much information as possible from the dynamic system using a “good” input signal, which exposes all relevant areas of the input space and minimizes the variance in the estimated model parameters.15,16
Typical methods of excitation signal design can be categorized as model-based and model-free approaches.16–18 In most of these methods, the main task of excitation signal design is to optimize the parameters of a pre-defined excitation signal according to different criteria. Model-based approaches are often called optimal experiment designs (OED), which utilize pre-defined model structures to optimize the variance of model output or model parameters. Generally, the Fisher information matrix (FIM) is used as the optimization criterion, which is achieved in practice by maximizing the track of inverse (A-optimality), determinant (D-optimality), or maximum eigenvalues (E-optimality) of FIM. On the contrary, the model-free design does not need to assume the model structure. The model-free methods design a uniform distribution of the excitation signal in the input domain. Typical methods are the Latin-hypercube design (LHD), block and factorial, and space-filling designs.
In the case of the first category, many methods are based on D-optimal experiment design. Wang et al. 19 identified a nonlinear physical ship maneuvering model using a D-optimal experiment design. Nevertheless, this work is limited due to its high optimization effort. Hartmann et al. 15 proposed an active learning method called HilomotDoE. A pseudo-random Monte Carlo approach was used to homogenously distribute the samples and minimize the model error of local model networks. However, this method is sensitive to the design parameters and the measurement noise. Suzuki and Yamakita 20 address OED for PWARX (Piecewise AutoRegressive eXogenous) models for hybrid systems. They push the samples toward the discriminating surfaces to optimize the local model region boundaries. A cost function punishes the distance from the surface, and constraints on the input are considered. As the design requires knowledge of region boundaries, alternating OED and identification are proposed. Both works in Deflorian and Zaglauer 16 and Hametner et al. 21 optimized test signals using D-optimal design for the identification of MLP (MultiLayer Perceptron) networks. The main drawback of both works is that this method demands prior knowledge of the target system. In Himmelsbach and Kroll 18 and Kroll and Dürrbaum, 22 a scalar measure of FIM was used to determine the optimum experimental design to identify TS (Takagi-Sugeno) fuzzy models. These works are limited due to the choice of FIM measure, which impacts the computational cost. Based on FIM, Neilsen et al. 23 dealt with the uncertainty in the quantities of interest for an efficient machine learning algorithm in an ocean environment. Nevertheless, more work is required to research the generalization performance of the method.
As for the model-free methods, LHD has been researched intensely in recent years. Several works focused on the global optimization of the distribution using methods like particle swarm optimization, 24 simulated annealing, 25 evolutionary algorithm, 26 geometrically ordered design, 27 or local search algorithms.28–30 It is noted that LHD is time-consuming due to the searching process for such a design. As alternative model-free approaches, factorial methods were also studied: Farzaneh and Akbarzadeh Tootoonchi 30 designed optimal experiments using a three-level factorial method for TS systems and Pontes et al. 31 trained an MLP network using data developed by a complete factorial design. However, factorial methods require rigorous planning at the design phase based on accurate pre-knowledge. Another class of model-free approaches are the space-filling designs. Skrjanc 32 used a supervised clustering algorithm to identify a fuzzy model, in which a pseudo-Monte-Carlo sampling algorithm realized the space-filling design. Gringard and Kroll 33 designed test signals to cover the input space for identifying locally affine dynamic Takagi-Sugeno models. Gringard and Kroll 34 considered the output space-filling technique to identify Takagi-Sugeno models. However, the balance between the design choices and the computational burden should be considered.
Scope of this research
This contribution investigates the design of the optimized excitation signal to identify the PWA model. In the literature above, the optimization procedure to generate an optimal input for the problem uses either model-based or model-free methods, often criticized for their dependency on pre-knowledge and high optimization effort. This problem motivates the development of efficient excitation signal design methods.
This work’s main contribution is a model-free optimized excitation signal design method, which uses an iterative optimization method to reach a sufficient excitation of the whole operation range. In contrast to other methods, which are limited due to pre-knowledge or computational costs, the proposed optimized excitation signal design method can generally be applied to other data-driven applications without prior knowledge or a higher computational burden. Furthermore, because clustering-based identification methods are the mainstream for the PWA modeling, a clustering-based four-step identification approach is conducted for the identification of the PWA model, and the proposed method is applied to automotive throttles for the HiL-simulation.
The work is structured as follows: modeling for automotive throttles with the PWA model is discussed in section 2. Section 3 introduces the new design method. Experiment results with discussion from applying the methods to a typical throttle are recorded in section 4. Section 5 introduced the clustering-based identification method briefly. Conclusion and outlook are discussed in section 6.
Modeling and identification of automotive throttles with PWA model
Description of automotive throttles
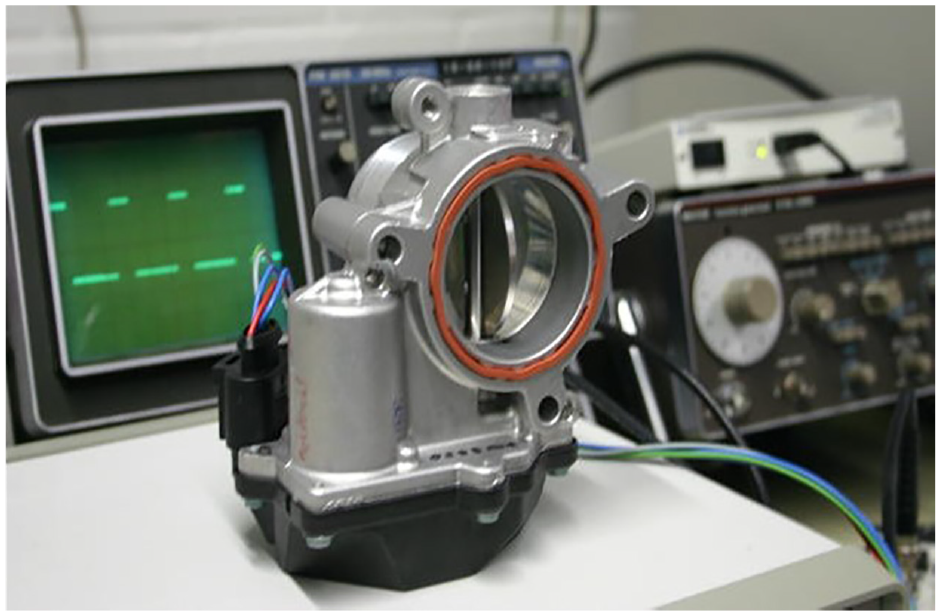
A typical automotive throttle is shown in Figure 1, mainly composed of a DC servo motor, a gearbox, a return spring, a potentiometric angle sensor, and a throttle plate. The DC servo motor drives the throttle plate through the gearbox. The angle sensor provides the measurement of the throttle plate position. The input signal of the throttle is the PWM (Pulse Width Modulation) signal, and the DC-motor is then controlled by varying the duty cycle.
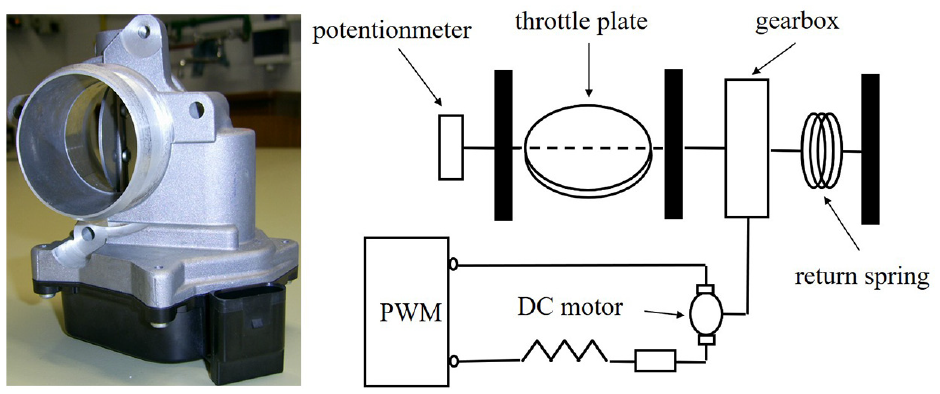
A typical throttle and its technology scheme. 35
It is noticed that the throttle is a typical system with friction, in which the friction occurs in the gearbox and motor shaft bearings. Usually, in physical models, friction is modeled as a nonlinear function of the angular velocity. 35 Unlike physical models, a data-driven identification method of PWA models is discussed in the following section.
Description of PWA model structure
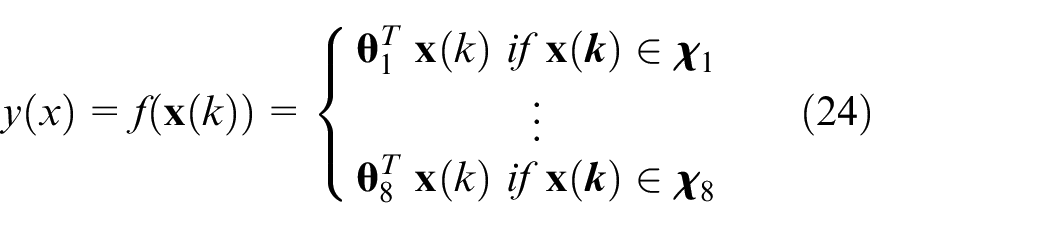
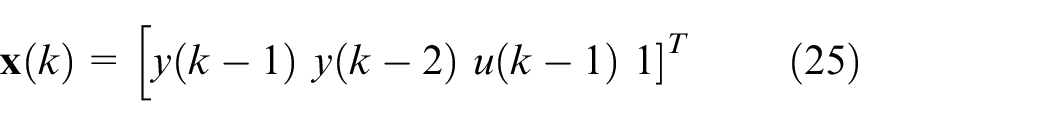
As a typical multi-model structure, the PWA model is used primarily for hybrid systems for simulation and model-based control. This paper will use a standard PWARX model to model automotive throttles. The model is described as follows:
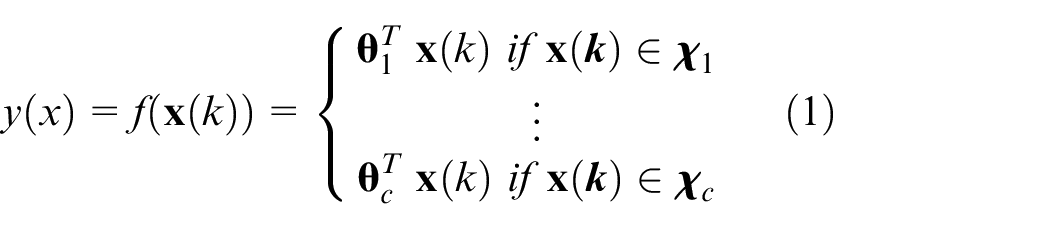
with the regressor:
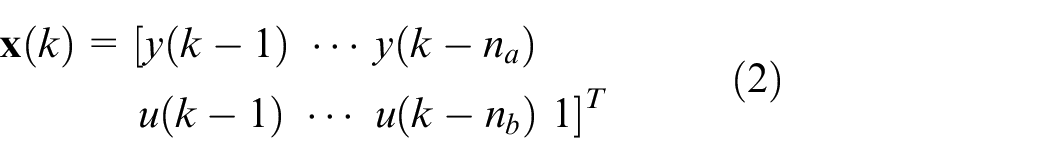
where

With the suggestions in Ferrari-Trecate et al., 5 the clustering-based identification of the PWA system is conducted as follows in four steps:
Selection of feature vectors for clustering. Particular attention should be paid to identifying systems with friction using the clustering-based method. The original regressor in (2) consists of past inputs and outputs, which are unsuitable for capturing effects like friction. Therefore, the proper feature for the clustering will be selected in this step.
Partition of regressor vectors using clustering. The regressor vectors will be allocated to clusters using the standard c-means algorithm. Because the c-means algorithm does not automatically select the number of clustering, several validity measures, and the model quality are used to determine the number of clusters.
Estimation of region hyperplanes. Given the labeled regressor vectors, the region hyperplanes will be estimated using linear classification techniques like support vector machine (SVM).
Parameter estimation. The parameter vectors in (3) are then estimated recursively using a parallel evaluation, in which the predicted outputs are fed back as model inputs.
All local models of the PWA model in this work share the same structure (i.e.
The proposed optimized excitation signal design method will be introduced in the next section. As mentioned before, this method achieves a sufficient excitation of the whole operation range by using an iterative optimization method and generates a uniform distribution in the regressor space, yielding better partitioning for the clustering-based identification of models.
Optimization of the excitation signal
Selection of excitation signal
The selection of excitation signals for system identification is of importance in the case of nonlinear systems. Typically, PRMS (pseudo-random-multilevel-signal), multi-sine signal and random signal are often used to identify nonlinear systems. As mentioned before, an optimal excitation signal should cover the whole operation range of the input space and all relevant frequencies. For the nonlinear dynamic system like mechatronic actuators, an optimal experiment design using the multi-sine signal will be preferred for identification since4,11–14,36:
Multi-sine signal retains as far as possible the advantage of the sine wave, which reduces the measurement time
The multi-sine signal can optimally excite the nonlinear system through optimization of phases and pre-defined frequencies
Multi-sine signal is a deterministic and periodic signal, which is less sensitive against disturbance and leaves no leakage-error
The signal bandwidth can be pre-defined to cover the exciting system bandwidth
The applied periodic multi-sine signal allows an efficient design and offers some advantages for postprocessing the measurement data. Therefore, the multi-sine signal is used as the excitation signal to identify the PWA model, which can be designed and optimized from measurements on an actuator test bench.
Parameterization of the multi-sine signal
As a deterministic, periodic signal, the multi-sine signal can be specified which frequencies to use (from the available frequency grid due to a period signal). Therefore, a multi-sine signal is used, which is formed by summing d harmonic oscillations:
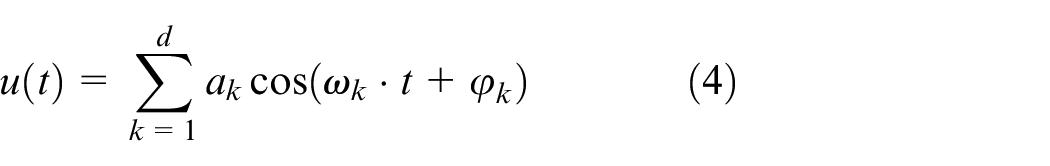
where
Multi-sine signal and the feedback for identification.
The design of the multi-sine excitation signal composes mainly of:
the frequencies
the amplitudes of the individual signals
the phases of the respective signals
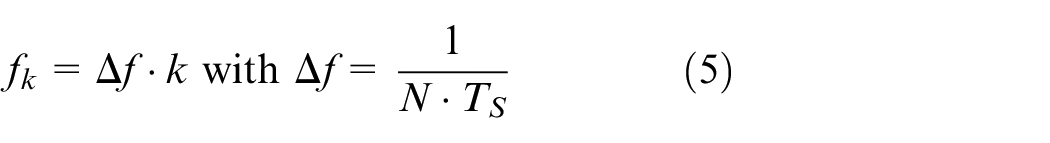
With the Fourier transform, the measurement on the test bench can be performed precisely in the frequency domain, and the required bandwidth of the excitation signal can then be calibrated. Additionally, the transform permits also filtering of noise in the frequency domain.
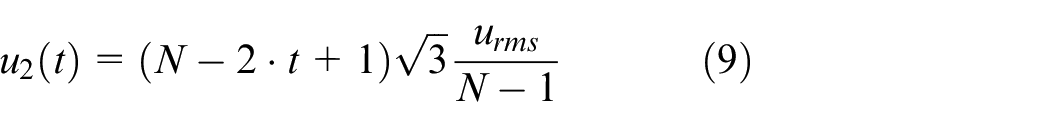
To avoid unwanted nonlinear distortions, the frequencies are suggested by Atkinson and Donev 12 as:
where
For the selection of the amplitudes, it should be noted that, on the one hand, the operation range of the actuator should be sufficiently excited. On the other hand, the restrictions of the test signal due to lower and upper mechanical stops should also be considered. Therefore, the amplitudes will be experimentally determined. It is noticed that all harmonic oscillations now have constant amplitude in this research, which should be optimized in future research.
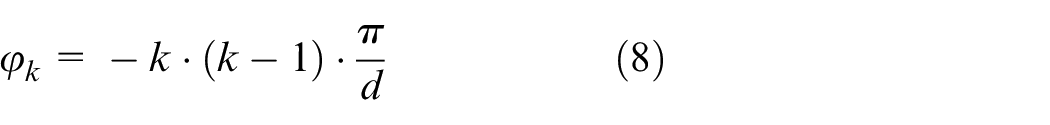
As mentioned above, the measurement should be distributed uniformly over the achievable range. Therefore, the phases of the multi-sine excitations will be optimized according to the following procedure.
Optimal excitation signal design
Inspired by Witters and Swevers, 36 a design process is proposed in this section to guarantee a sufficient excitation of the whole operation range. The proposed optimized excitation signal design method yields a uniform distribution in the regressor space and requires no particular weighting on specific regions. Unlike Witters and Swevers, 36 the proposed design method with Schroeder phases as initial values leads to a better-homogenized distribution than signals with constant or random phases, improving optimization convergence. Furthermore, a convergence-oriented criterion is used, which requires no prior knowledge to evaluate the distribution. The method iteratively optimizes the phase of the excitation signal so that the signal can uniformly distribute in the operation space. In this work, an index Coverage is defined, which measures the homogenization of the signal distribution, which could reach a minimal value. As the initial signal, the Schroeder phases 37 will be used for the iterative optimization. For the evaluation of Coverage, all data points of the test signal (e.g. duty cycle) are divided into intervals, and Coverage is as follows:
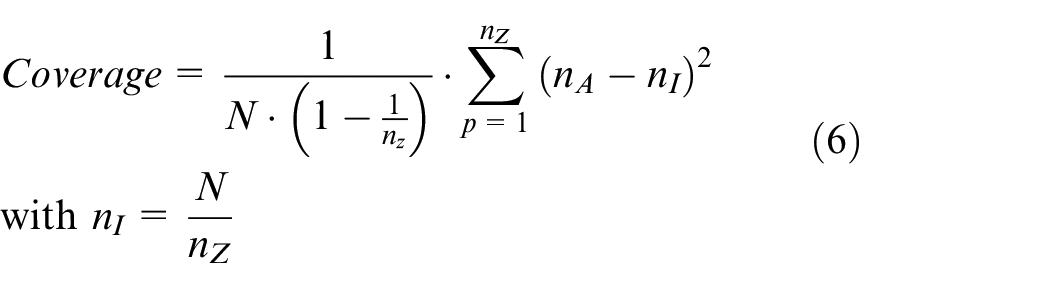
where N is the number of the data points,
The basic idea of the optimization method is the iterative changing of the phases to linearize the inverse cumulative density function (CDF) until the excitation signal reaches a uniform distribution. Starting from the initial Schroeder phases, the phases of the multi-sine signal will then be iteratively altered to optimize Coverage through the following algorithm:
1. Calculate a permutation matrix T, so that

where
2. Generate a new sequence
where
3. A new sequence

4. Calculate the phases
5. Evaluate the distribution of the excitation signal
6. Update
7. Repeat 1–6 until the defined convergence condition is fulfilled.
The convergence is based on the difference between two consecutive iteration steps:

Then, the convergence condition is:

where
Figure 3 shows the clustering with the Schroeder phases (above) and the optimized phases (below). It can be seen that better Coverage of the regressor space has been achieved through the phase optimization method.
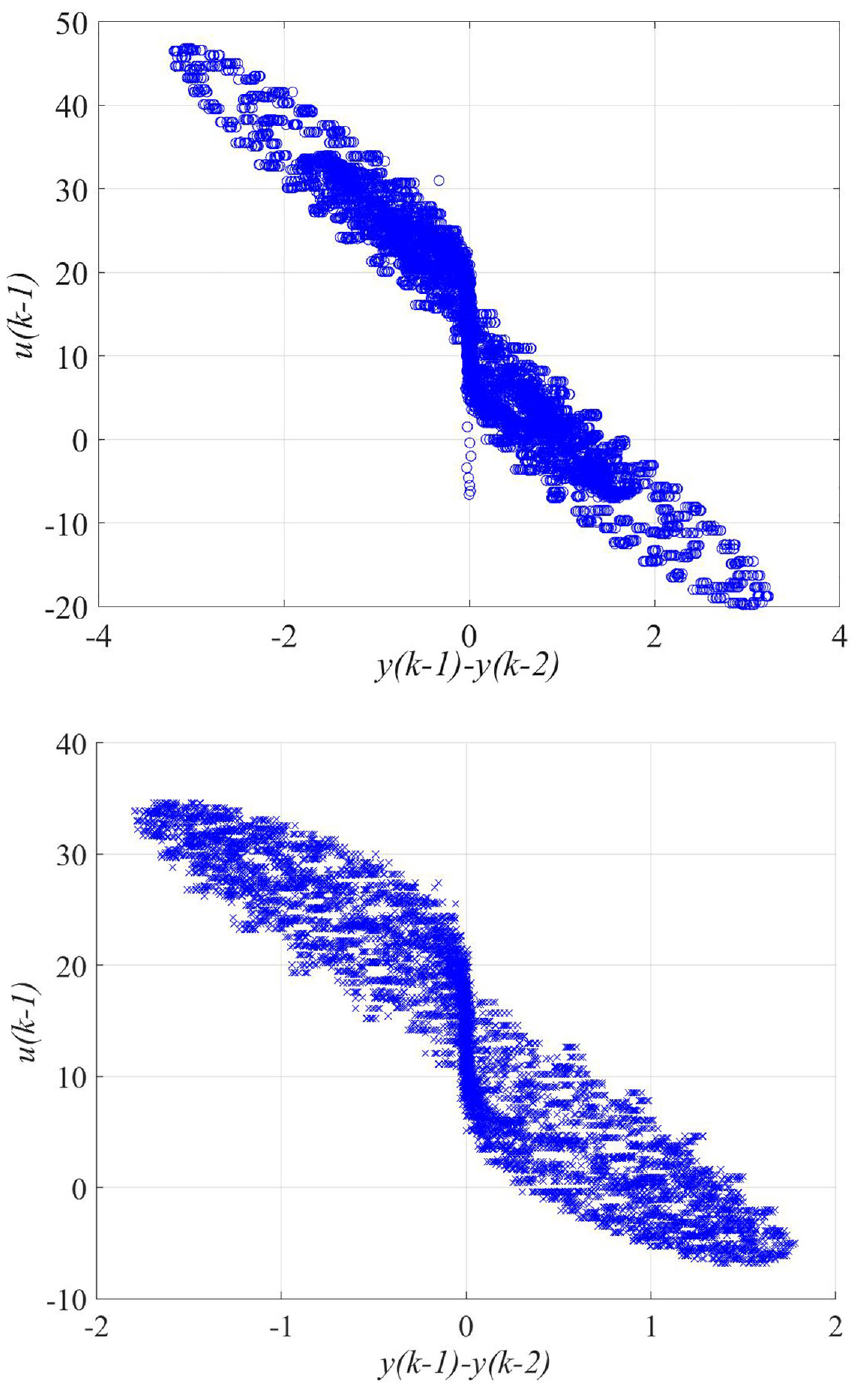
Example of regressor before optimization (above) and after optimization (below).
As shown in Figure 4, the entire value range of the test signal (duty cycle in %) was divided into 21 intervals. For the initial signal with the Schroeder phases, 70% of data points are distributed between 0% and 25% duty cycle intervals. With the iterative homogenization method, the Coverage reaches its optimal value after 90 iterations and data points are uniformly distributed over the whole operation range.
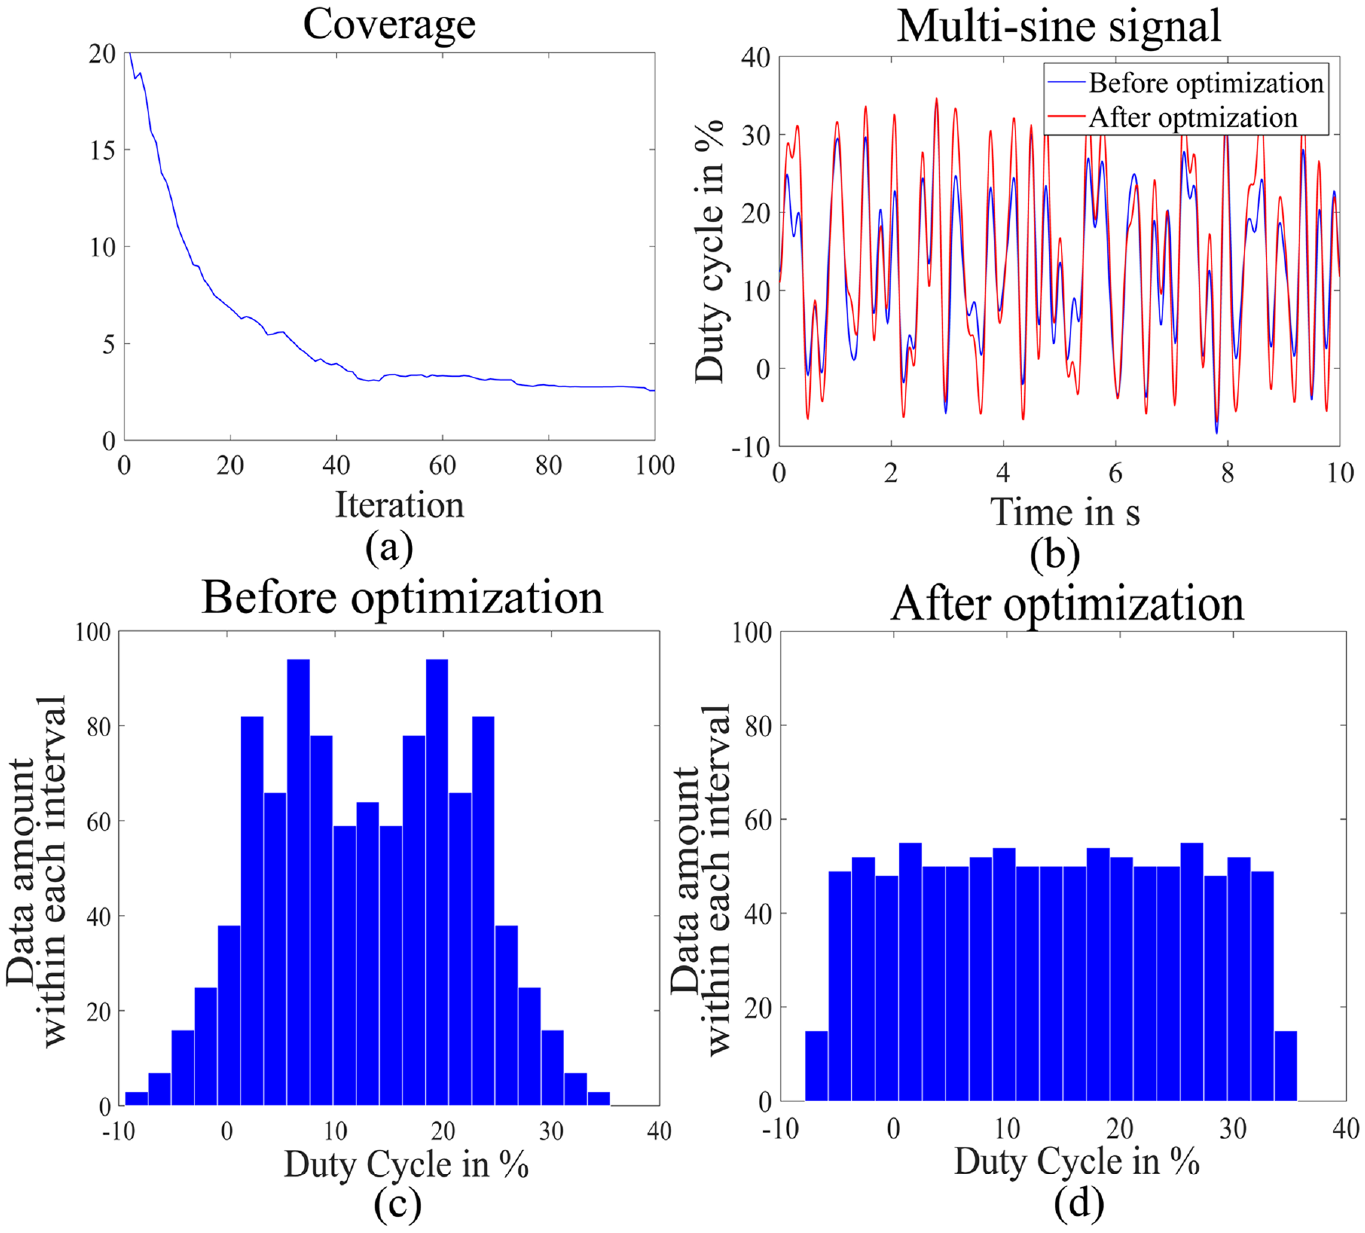
(a) Iterative minimization of the evaluation criterion coverage, (b) initial and optimized signals, (c) data distribution of the initial signal, and (d) data distribution of the optimized signal.
Identification procedure
In this section, the clustering-based identification method is briefly introduced.
Step 1: Selection of feature vector for clustering
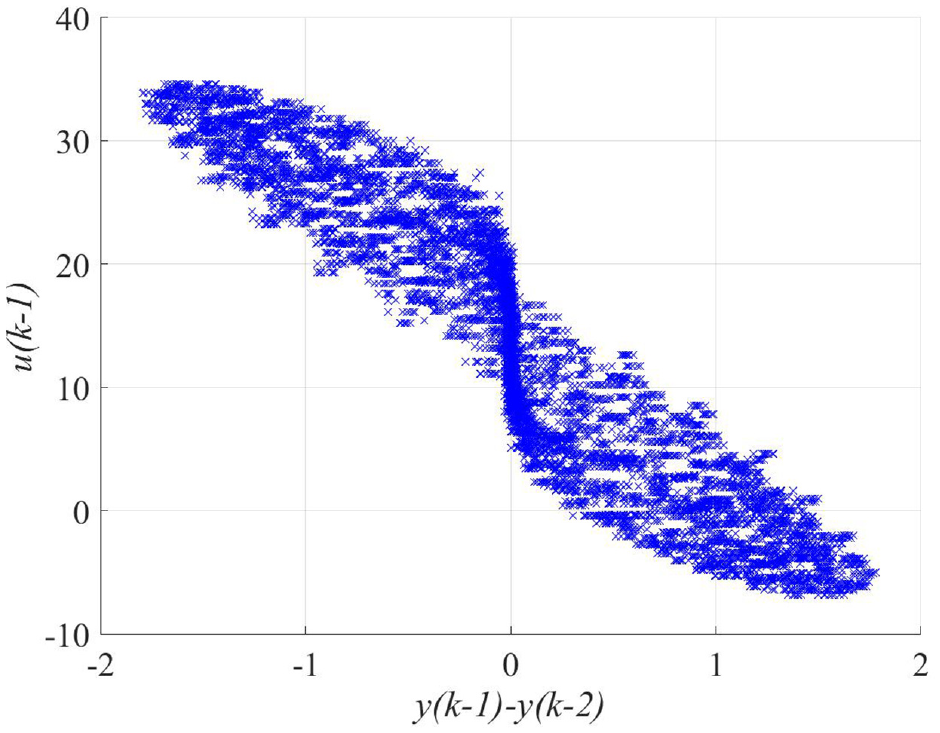
Evaluating the “similarity” of data is essential for clustering-based identification procedures. Appropriate feature vectors should be selected to achieve a better clustering quality. On the one hand, classes should be well separated, and on the other hand, as few features as possible should be used for clustering due to costs and complexity. For mechatronic applications, friction’s nonlinear effects should depend on features. It is noted that the nonlinear effects cannot be easily captured based on the original feature space (see Figure 5).
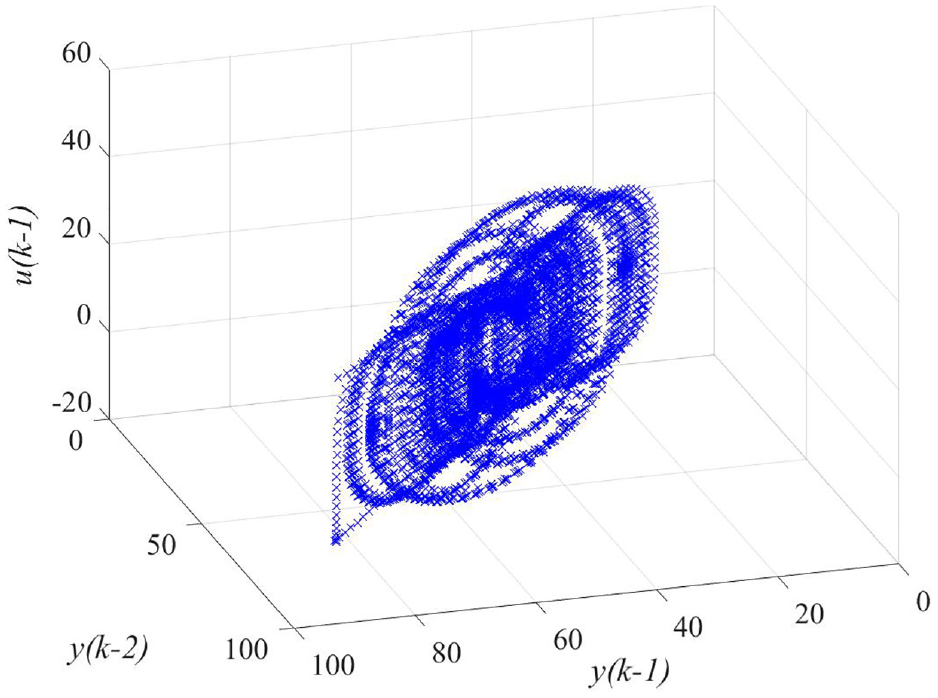
Original regressor space.
Thus, the feature vector should be firstly selected before identification. Literature and insights into the mechatronic throttles have shown that the input and the velocity are the two variables that most influence the throttle response.4,35 Based on the first-order difference equation,
4
the output difference
New feature space.
Step 2: Partition of feature vectors
The main difficulty of the PWA identification lies in the classification problem, in which each data point must be associated with one region and the corresponding sub-model. 5
As discussed above, the next step of the method will cluster the regressor vectors into c disjoint subsets. As an efficient clustering method, the c-means algorithm with Euclidean distance allocates the feature vectors in Figure 7 into c clusters. Each point in the feature space is marked with the index of its cluster (see Figure 7) and will be used to estimate the model partition in the next step. It is noticed that in the following steps, the original regressor
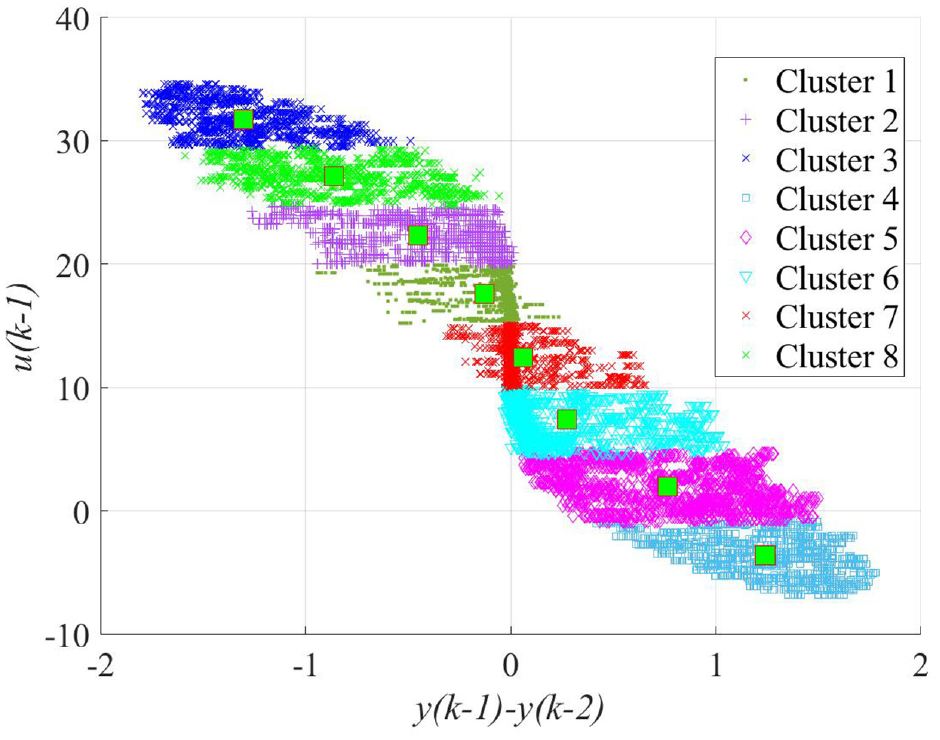
Example of the clustered feature vectors.
Nevertheless, the drawback of c-means is that the number of clusters c should be pre-defined before the clustering. Theoretically, the c-means clustering should identify well-separated and compact clusters. With increased value from interval [cmin, cmax], the number of clusters can be iteratively selected according to cluster validity measures, which provide information about the separation and compactness of clusters. Since none of the available measures can work perfectly alone, four cluster validity measures are adopted: Davies-Bouldin, 38 Calinski-Harabasz, 39 Dunn, 40 and Hartigan 41 index.
The Davies-Bouldin (DB) index is calculated by:
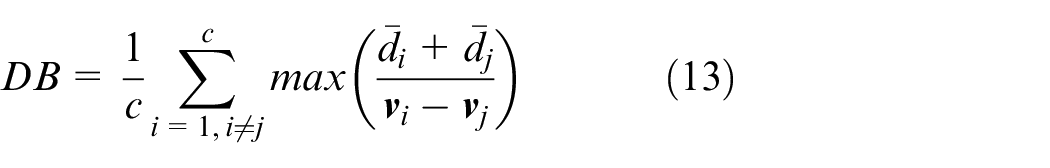
where
The Calinski-Harabasz (CH) index is defined as:
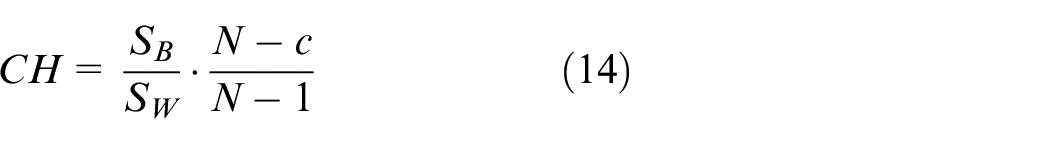
where
The Dunn (Du) index is given by:
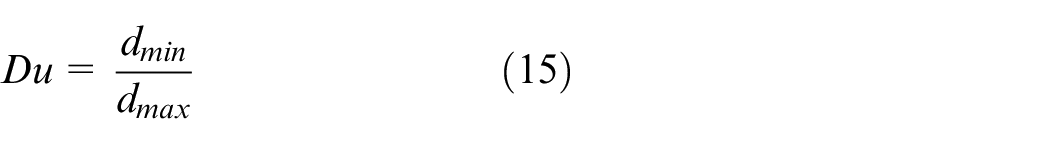
where
The Hartigan (Ha) index is defined as:
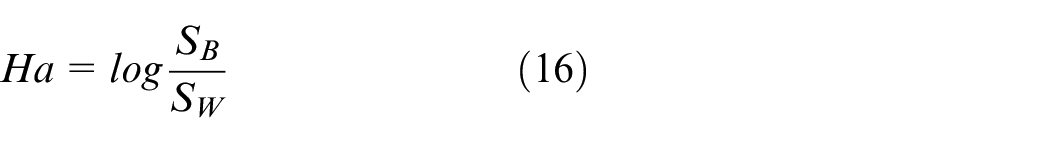
Besides cluster validity measures, a model performance criterion can be combined with those four measures to select c.
In short, this step delivers partitioned regressor vectors to the next step, where the boundary hyperplanes between adjacent regions are estimated using the SVM algorithm.
Step 3: Estimation of region hyperplanes
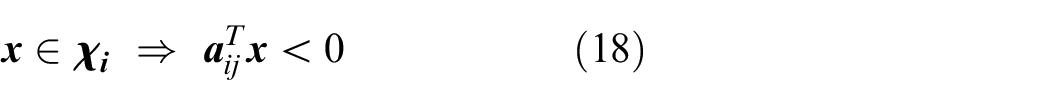
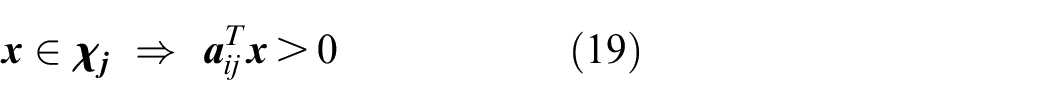
The feature vectors are partitioned in the previous step with the c-means clustering method. With the clustered data, this step aims to estimate the polyhedral regions, which can be viewed as separating c sets of points using linear classifiers (hyperplanes). The separating hyperplanes between two adjacent regions
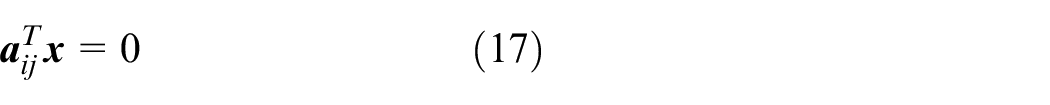
where
Typically, this problem can be solved in the literature by employing the linear classification method like Support Vector Machine (SVM). The SVM algorithm is a supervised learning process which tries to find an optimal maximal margin separating hyperplane between two classes. There are generally two approaches for the multi-class classification: combining several binary SVMs and the Multicategory M-SVM. Compared to binary SVMs, M-SVM has the advantage that it can efficiently estimate all hyperplanes and does not leave “holes” in the regression space. Then, this step provides regions with estimated boundaries to the next step, in which parameter vectors in each region are estimated.
Step 4: Estimation of parameter vectors
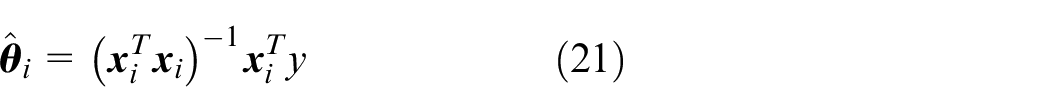
Once the regressor vectors are classified and the boundaries of regions are estimated in the previous steps, the parameter vector
According to Kroll, 4 the parameter estimation can be achieved using “serial-parallel evaluation” or “parallel evaluation” (see Figure 8). The “serial-parallel evaluation” calculates the output from the measurement containing past input and output and can lead to biased non-optimal parameters because the preconditions for an unbiased estimation are rarely met in practice. 4 In contrast, a parallel evaluation estimates parameters recursively in which the predicted outputs are fed back as model inputs. The “parallel identification” calculates the output from the past input and predicted “noise-free” output, corresponding to the simulative usage of a model without measured outputs. The “parallel identification” causes the estimation problem to no longer be “linear in the parameters,” requiring elaborate iterative nonlinear optimization but a higher prediction quality.
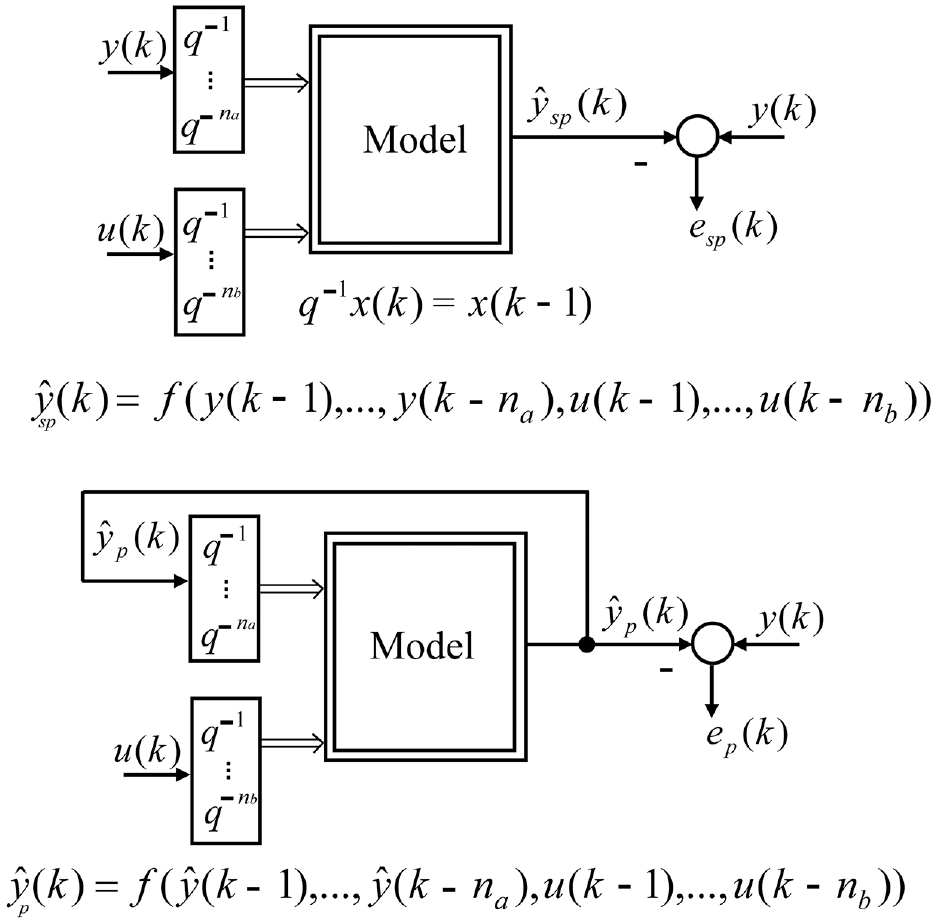
Serial-parallel identification (above) and parallel identification (below). 4
Therefore, a standard optimization method like the downhill simplex optimization approach can be used to optimize the following cost function:
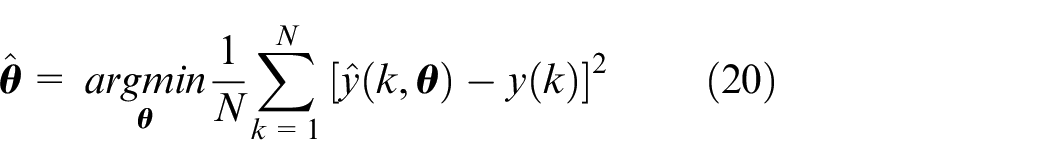
Here
Experiment results
Model quality evaluation
The method mentioned above will be used for HiL simulation. Hence, the model should simulate the throttle position precisely for functional testing of ECU. Two performance criteria are used for the model quality evaluation: the normalized root mean squared error (NRMSE) and the maximum norm of the prediction error
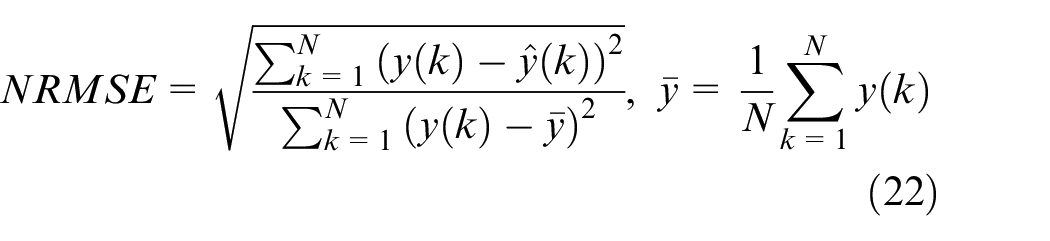

For the current application, it is required that
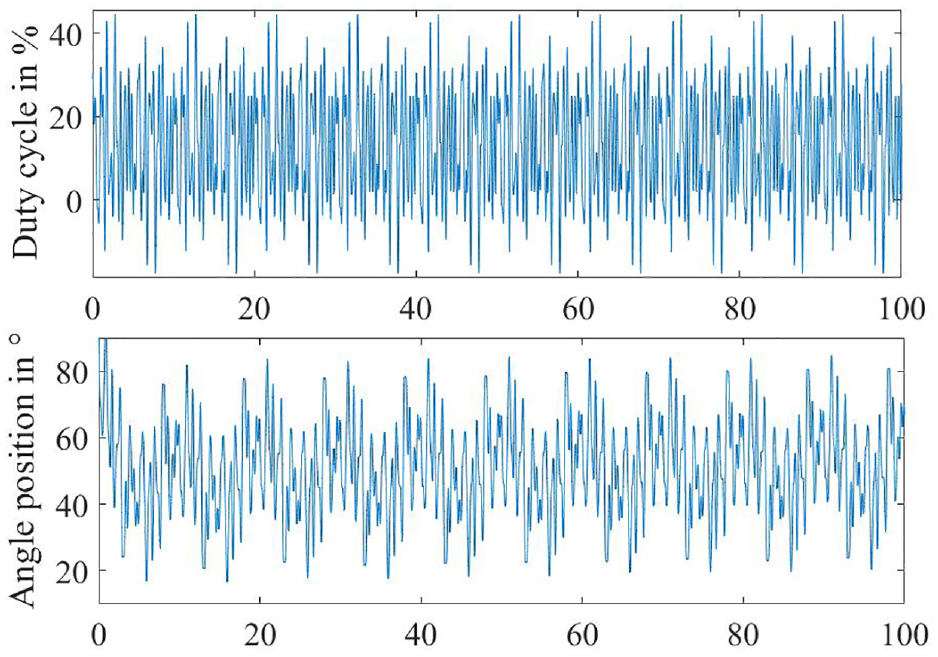
The validation of the models shall be carried out with “fresh” measurement data, which are not used in the identification (see Figure 9). An amplitude-modulated multi-step signal (APRTS) will be used, which was applied for validation in industrial applications and introduced as a benchmark set. 43 This signal was designed to test the modeling performance of the throttle at various operating regions, including the hard mechanical stops. It consists of a series of random pulses of different widths ranging from the input range of the duty cycle from 0% to 100%. Besides, another multi-sine signal with different phases and amplitudes in industrial applications will also be used for the validation (see Figure 10).
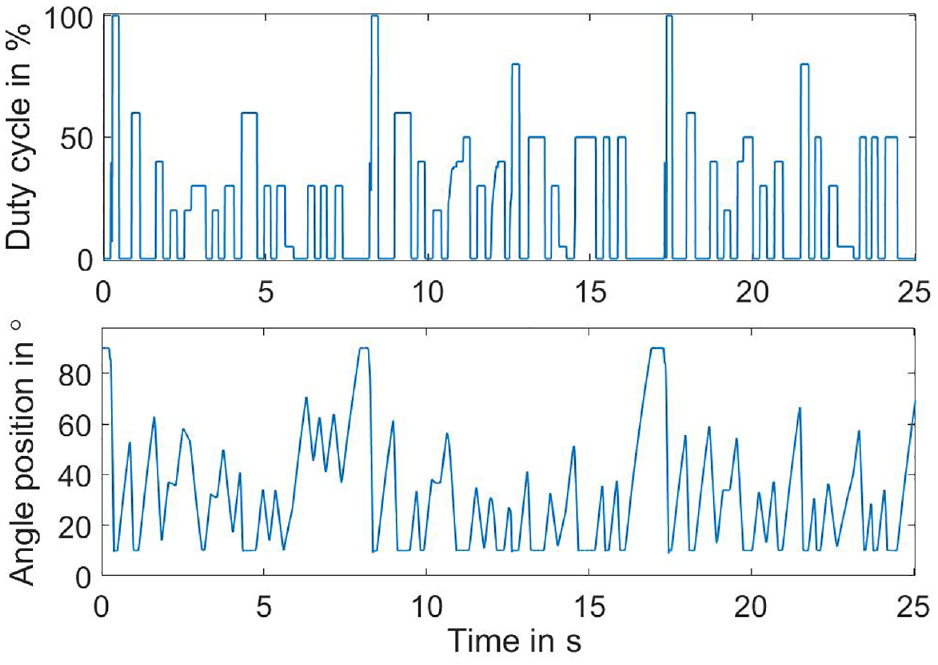
APRTS and the feedback.
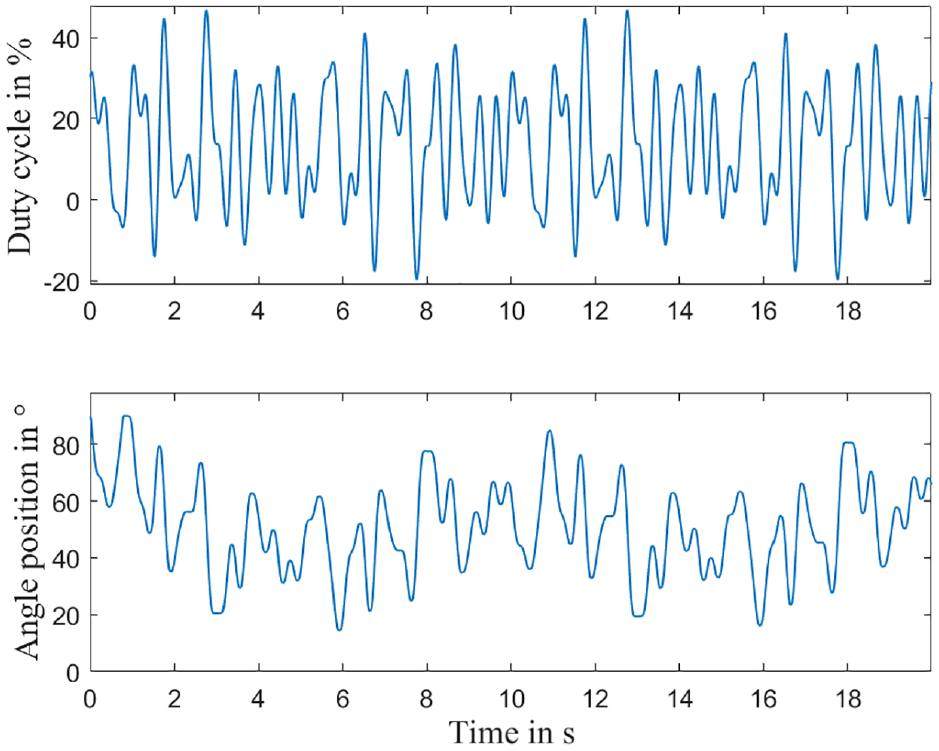
Multi-sine and the feedback for validation.
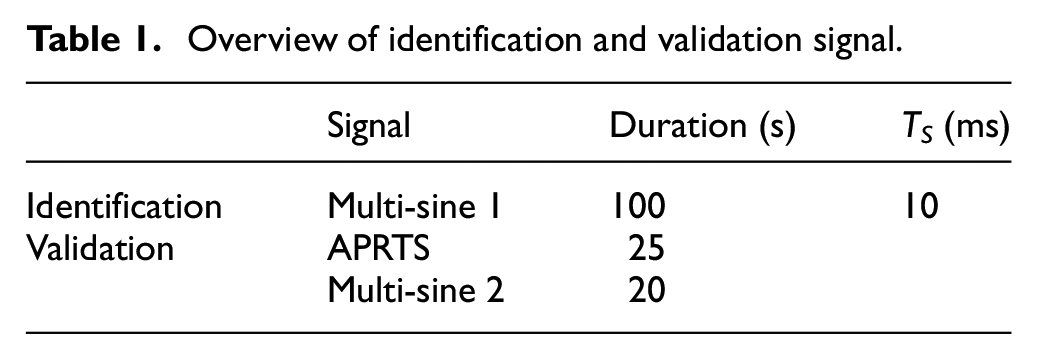
Table 1 gives an overview of the identification and validation signal. In order to distinguish both multi-sine signals, the signal used for identification is named “multi-sine 1,” and the one for validation is named “multi-sine 2.”
Overview of identification and validation signal.
Test stand
A test stand was built for data collection and model evaluation (see Figure 11), and National Instruments products are used as the data acquisition equipment.
Test stand with a throttle.
The data acquisition software was implemented using NI LabVIEW 2017 graphical programming to perform different experiment tasks, including signal generation and measurement recording. The data acquisition hardware is NI USB-6251. After each measurement, two types of data should be collected: the duty cycle as input and the angle position as output. The measurement data can be automatically recorded with a defined sampling time
Results
The presented excitation signal design algorithm and the identification method of the PWA model are applied to a mechatronic throttle in the case study.
Based on the discussion before,
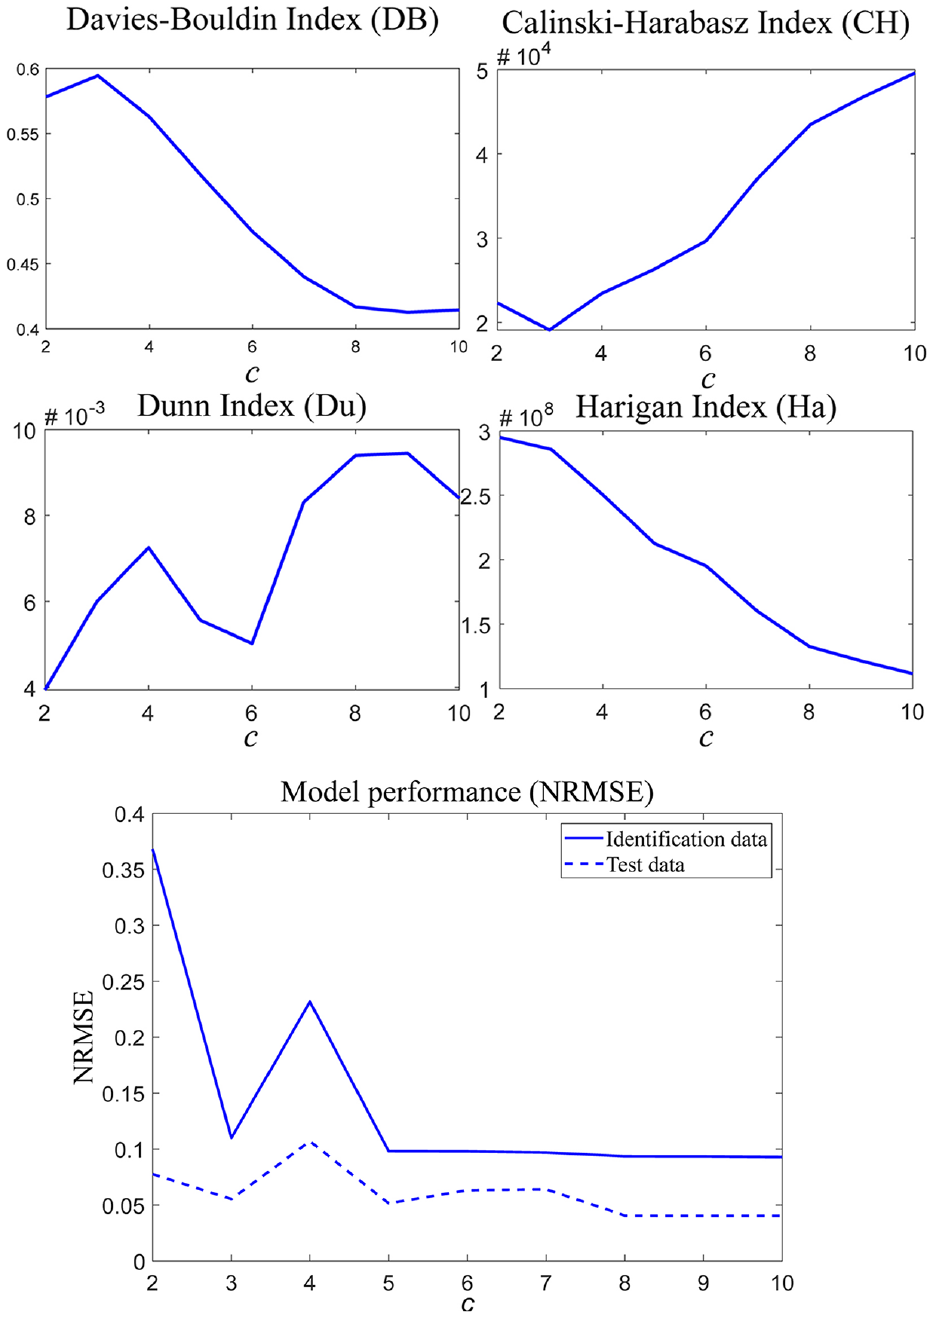
Four cluster validity measures (above) and NRMSE (below) for different numbers of clusters/sub-models.
Finally, the PWA model for the mechatronic throttle is:
with the regressor:
and the parameter vectors:
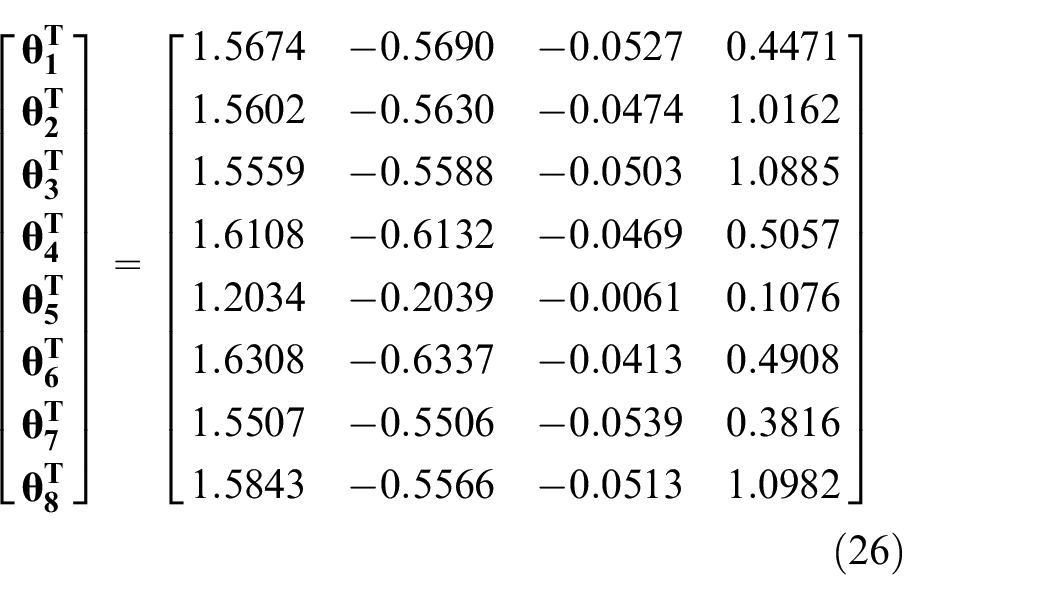
The estimated parameter values
The simulated and the measured angular position of the throttle is shown in Figure 13. The model and the real system are pretty similar, and the PWA model with the optimized excitation signal method can reach a better result than the model before the optimization. To summarize, the presented model captures the throttle’s dynamic and static effects, and the model quality is sufficient for testing motor control functions for HiL simulation.
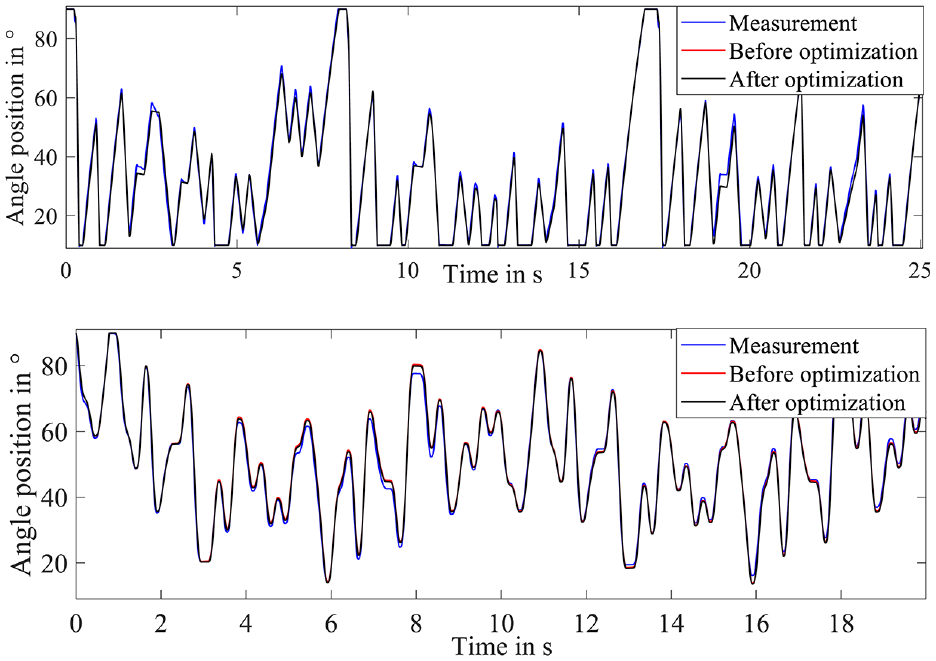
Measurement and model prediction before and after optimization: APRTS (top) and Multi-sine 2 (below).
The model prediction results with identification and validation data before and after excitation optimization are quantitatively compared in Table 2 for the throttle. After the optimization, the maximum absolute error with the identification data is 3.85°, and the validation data (APRTS) is 4.33°. The NRMSE for both models are 0.06°, which means that the PWA model provides the best model quality and the target of
Performance comparison before and after optimization design.
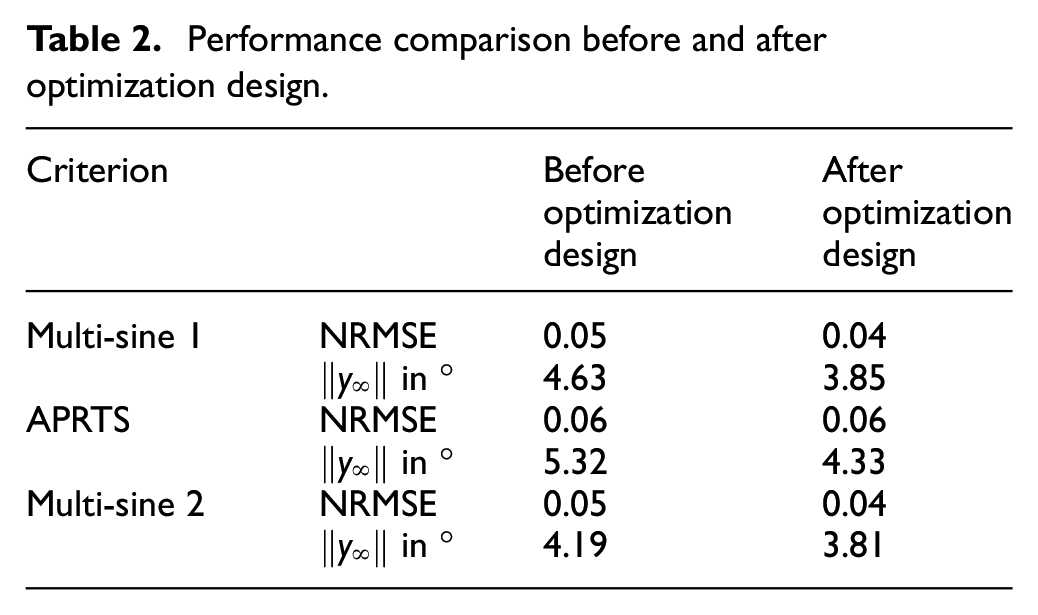
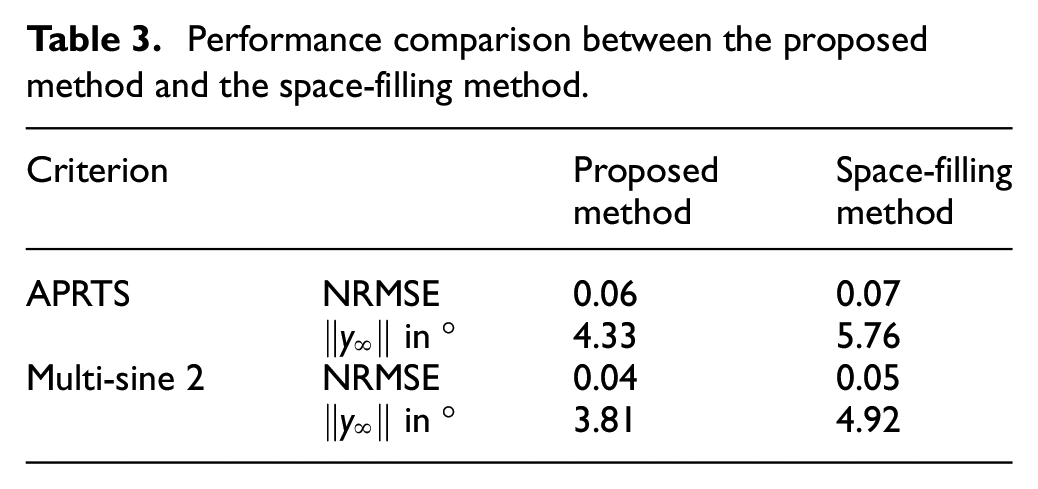
It is noted that the results with these different data sets for identification and validation are not comparable in an equivalent condition since they were submitted to a different number of samples. 44 Besides, the proposed method is compared with other existing methods like the space-filling design, 33 and the performance comparison is shown in Table 3. It is noted that the proposed design method better model quality than identification based upon the space-filling design.
Performance comparison between the proposed method and the space-filling method.
Conclusion and outlook
This work presented a model-free optimized excitation signal design for identifying piecewise-affine models. The presented method was applied for automotive throttles. For the excitation, periodic multi-sine signals are used. The amplitude spectra are chosen to approximate the excitation the throttle experiences in a vehicle when driving in a normal situation. The phases of multi-sine signals are optimized to obtain a uniform distribution of the samples over the achievable working range.
As a typical data-driven model method, the PWA model with the clustering-based identification method was briefly reported, in which friction effects were addressed by a specific feature vector design. Finally, a mechatronic throttle was utilized in the case study to compare the dynamic response with the presented models. Results with the proposed model before and after the optimization showed that the presented method could efficiently provide high-quality models, which is sufficient for the functional tests of ECU in HiL simulation. The proposed methods can also be transferred to other systems with similar effects. Future research will improve the signal amplitude design and the model-based controller design.
Footnotes
Appendix
The estimated parameter values of hyperplanes in (17) are:
Acknowledgements
The author would like to thank anonymous reviewers for carefully reading the paper.
Declaration of conflicting interests
The author declared no potential conflicts of interest with respect to the research, authorship, and/or publication of this article.
Funding
The author disclosed receipt of the following financial support for the research, authorship, and/or publication of this article: This research is supported by the Natural Science Foundation of Shanxi Province, China (Grant No. 20210302123188).