
Abstract
This study aims to analyze the correlation between electrical properties of soil and NPK concentration in the soil. The conductivity and capacitance of soil with various NPK concentrations were measured. The main contribution in this study is to provide recommendations on the use of the corresponding electrical parameters for determining NPK levels in the soil. So far, the measurement of the electrical method generally uses the conductivity value for all conditions, even in wet and dry soil conditions. In fact, wet and dry soil conditions affect the conductivity. Therefore, other electrical parameters are needed that can correct the results of NPK measurements in the soil. Conductivity in relation to capacitance can show better measurement validity. In this study, the linearity of the relation between conductivity or capacitance to the addition of NPK levels in the soil was investigated. Soil samples were prepared by varying the mass concentrations of the elements N, P, and K separately. The conductivity and capacitance values for each NPK variation were measured and mapped. The results showed that the conductivity in dry soil conditions was more linear, with average coefficient of determination of the three elements being 0.81, compared to capacitance with a coefficient of determination of 0.72. Whereas the addition of water to the soil sample resulted in better sensitivity and linearity in the capacitance compared to the conductivity, with each average coefficient of determination being 0.55 and 0.34. These results provide alternative solutions using capacitance as an indicator for determination of NPK content in wet soil. The use of capacitance parameters combined with conductivity in determining NPK content in soil is a novelty contribution to this research and can be applied to the measurement technology in agriculture.
Keywords
Introduction
The real time measurement of nitrogen, phosphorus, and potassium (NPK) levels in the soil is an important issue that must be carried out in modern agriculture.1,2 Technological evolution toward mechanization and automation is one of the factors that help to increase agricultural growth. 3 Through this automation technology, the real time measurements of NPK can be carried out remotely and continuously. Monitoring of NPK levels is important to maintain the supply of fertilizer in the soil for the sustainability of plant growth. Recently, the measurement of NPK content in the soil takes a long time due to the use of chemical reagents in which the reaction rate is determined by the kinetics in the chemical reaction. Therefore, real time measurement is necessary for modern and smart agriculture.
Several attempts to measure NPK levels at the real time have been carried out using various methods such as conductivity measurements, electrochemical methods, and optical methods. 4 The electrochemical methods are reported, to be effective and accurate in measuring NPK in soil. 5 In the corresponding study, the universal soil extractant reagent was investigated using a portable multi-channel photoelectric system. The use of reagents as consumables and measurement in a large area involving a lot of measurement points simultaneously must certainly be considered when using this method. The optical method has also been widely used in the measurement of NPK in this soil.6–14 This method requires several processing steps that take time, is immobile, and require references. A hyperspectral data-based research protocol to quantify variability of NPK in soil and crop at the field scale has been applied 15 ; however, the accuracy and the extent of such maps remain questionable so that their accuracy and uncertainty need further investigation.
Utilization of the electrical properties of soil can be a solution for measurements on a large scale, real time, being portable, and does not require consumable materials such as chemical reagent. The conductivity and capacitance parameters can be used to determine the electrical properties of the soil. Utilization of soil conductivity values has been carried out in several sensor to measure the NPK.2,4,16 The value of soil conductivity is directly proportional to the concentration of soil nutrients. However, several factors that affect the value of soil conductivity must be considered, such as temperature, amount of fertilizer, salinity, moisture content, irrigation, and soil type. 2
On the other hand, capacitive sensors are already used in industry and agriculture and mostly used to identify presence, 17 level, 18 or pressure. 19 Furthermore, the capacitive property has been used to determine the soil moisture measurement.20,21 Aside from its conductivity properties, the use of soil capacitive properties as an indicator of the presence of NPK elements in the soil is not yet popular for use. These electric properties have potentials to be applied in the modern agriculture which requires real time measurement.
In this study, an investigation and analysis of the comparison of the two electrical quantities was carried out. Measurement of conductivity and capacitance values was carried out on several soil samples with variations mapped as a function of the mass concentration levels of each element N, P, and K. The correlation of each of these electrical parameters to the mass concentration levels of each element was compared and analyzed. Through a linear regression approach with deterministic coefficients, the degree of correlation of the two electrical parameters to the levels of each NPK element was measured and compared. The results of this correlation analysis are expected to provide a recommendation for the selection of electrical parameters to be used. Thus, its application in the manufacture of sensors to determine the levels of NPK in the soil can provide better results.
So far, the use of electrical methods in determining NPK levels in soil mostly uses conductivity parameters. Meanwhile, the conductivity value in the soil does not only change due to changes in NPK levels. The water content in the soil also determines the change in the value of the soil’s conductivity. Therefore, other indicator parameters are needed that can complement the results of determining NPK levels so that they are better and more adaptive to changes in water content. Utilization of the capacitance parameter in wet soil conditions, which can be combined with this conductivity, is expected to contribute novelty in this research. The combination of these two parameters is expected to provide more accurate and adaptive measurement results. These results can be applied to improve the technology for measuring NPK levels in the soil, especially in terms of adaptation to environmental factors.
Method
In this study, the measurement of NPK levels in the soil was carried out using an electrical method approach. The electrical quantities used are conductivity and capacitance. The measurement of these two quantities will be carried out in two soil conditions, namely dry and wet. These two conditions are expected to represent the actual situation and can represent the environmental conditions of the soil. Measurements of both quantities in wet soil conditions were made in several levels of wet conditions. This research can be summarized in the research steps as shown in Figure 1.
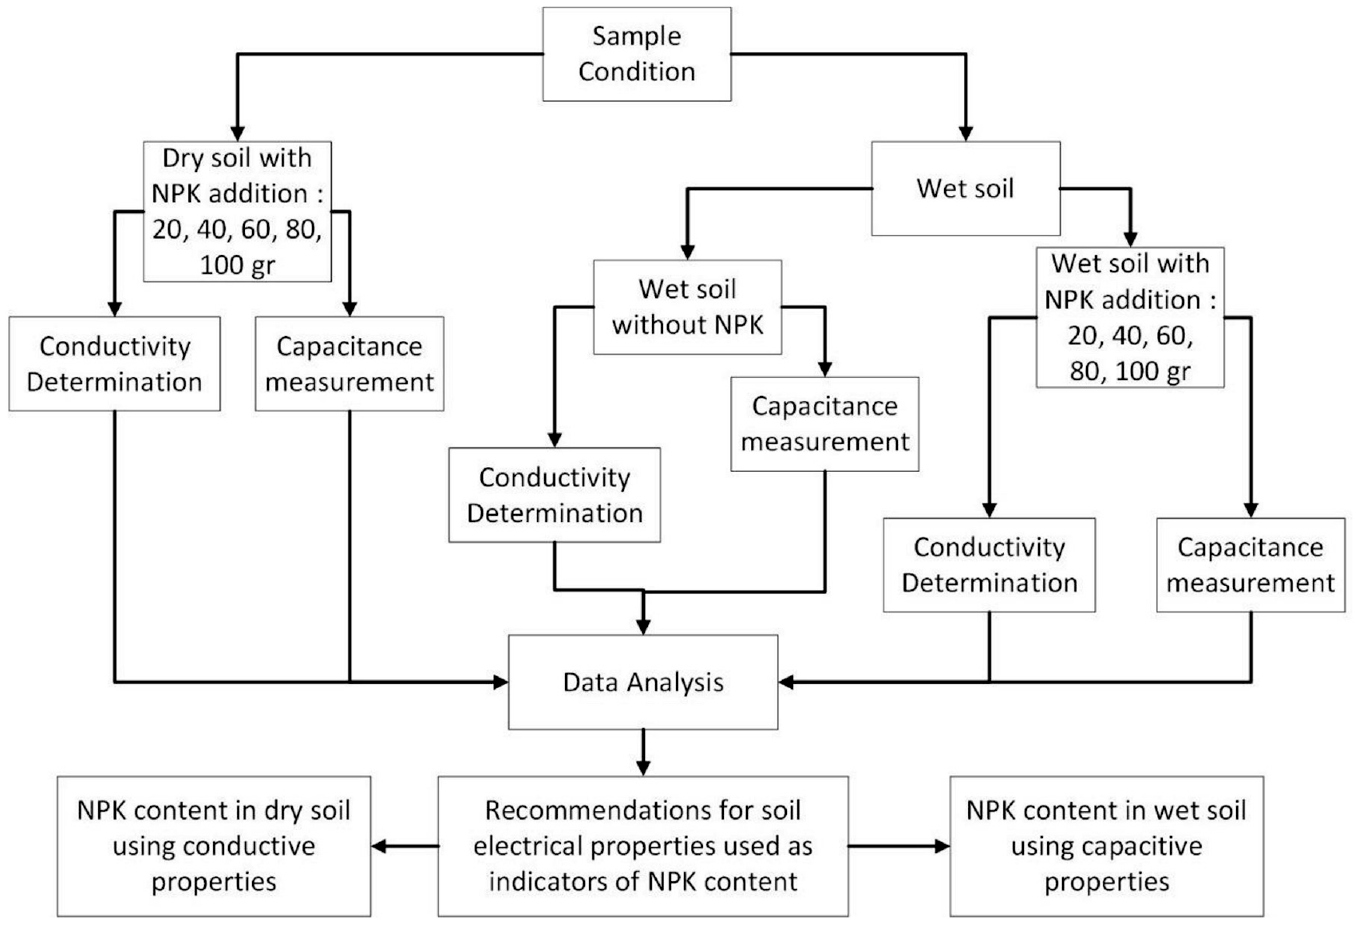
Block diagram of measurement of NPK content in dry and wet soil sample.
Electrical measurement
Capacitance and conductivity of the soil samples were measured using an LCR Meter with the two-point-probe method. The probe used in this measurements system was a cylindrical shape with a diameter of 5 mm, and the probe length penetrates the soil along 8 cm. The distance between these two probes was set up at 5 cm and both ends of the probes were directly connected to the LCR meter. The capacitance is obtained by direct measurement using the LCR meter. Meanwhile, the conductivity is calculated by equation (1), expressing the relationship between conductivity and resistance, with measurement scheme like Figure 2. Whereas the conductivity is obtained from the LCR meter.
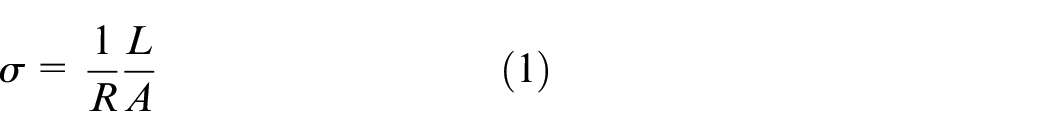
Where:
R resistance (Ω)
L distance between two-probes (m)
A Cross section area of soil (m2)
Conductivity measurement scheme.
Wet and dry soil preparation
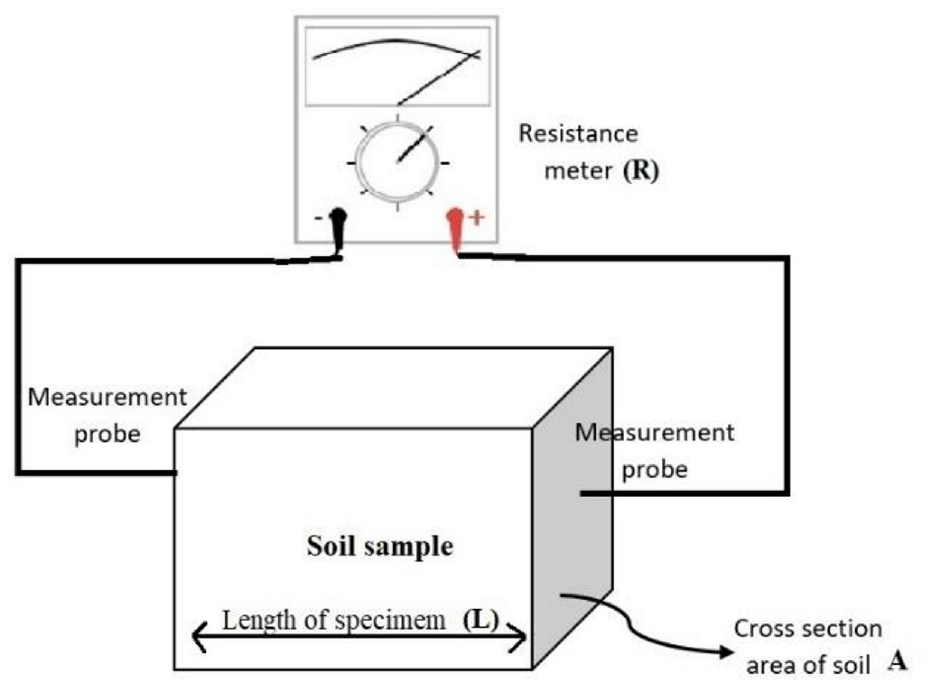
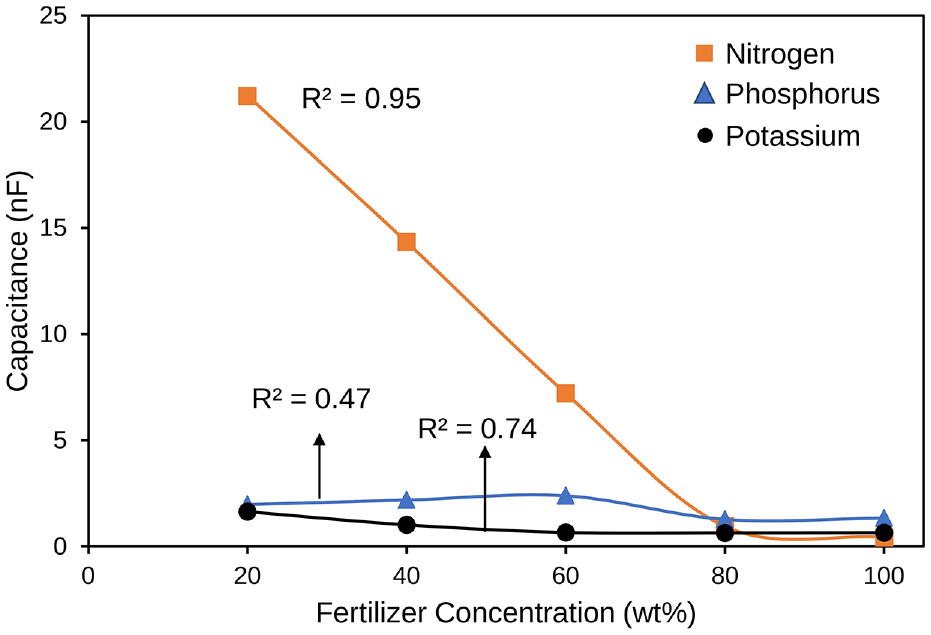
The experiment was carried out in two soil conditions, dry and wet. The type of soil was laterite, taken from the Lembang plantation area, Bandung, West Java, Indonesia. Laterite soil samples taken were dry and gradual, Figure 3. The process of obtaining dry soil is carried out as follows. Each soil sample taken from the field was measured for its water content using a mositure meter and the moisture content was conditioned at 10%. Soil samples, with a certain fixed mass, were put in an oven at 250°C for 30 min. The dried soil sample has been considered as dry soil which is ready to be given a variation of water according to the experimental scheme.
Laterite soil sample with dry and gradual condition.
The soil samples were then placed in 10 × 10 × 8 cm container box. The dry soil was directly taken from the plantation without any further processing, while the wet soil was the same plantation soil with several milliliters of water added. In terms of fertilizers, urea (NH2CONH2, N = 46%), SP-36 (P2O5, =36%), and Potassium sulfate (52%) were used as the sources of nitrogen, phosphorus, and potassium respectively. Moreover, the single fertilizer was then added to the soil for the measurement of electrical properties.
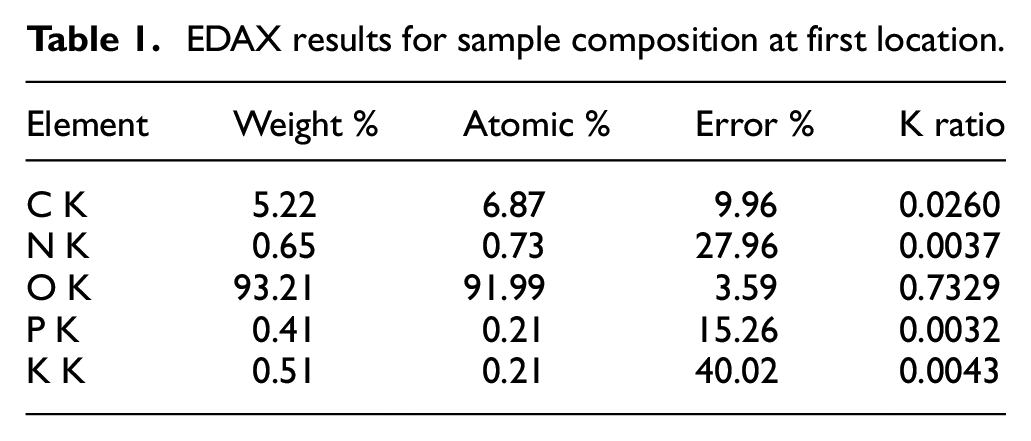
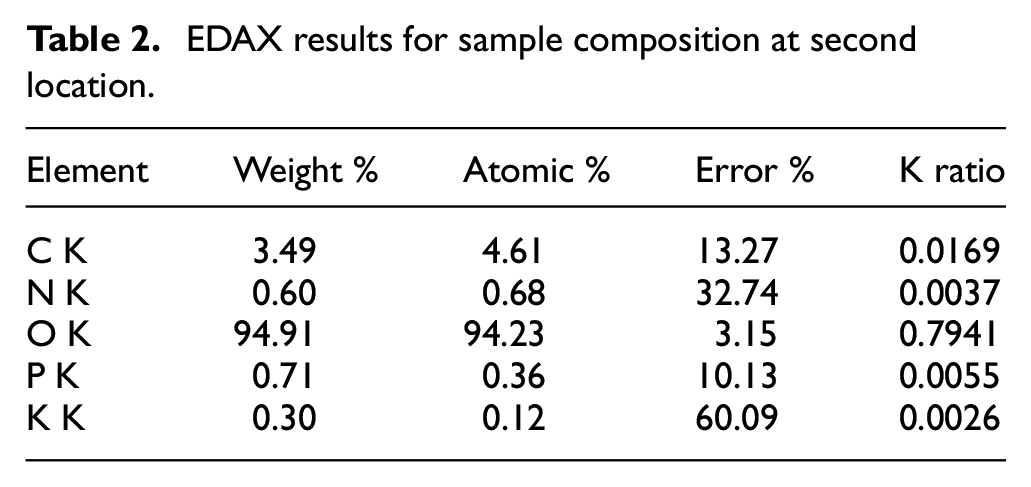
This soil characterization had been carried out by using X-Ray Dispersive Analysis (EDAX) to identify early content and composition of the soil samples. Tests for the initial levels of nutrient composition of laterite soil were carried out at three different sample locations. The test results are obtained as Tables 1 to 3.
EDAX results for sample composition at first location.
EDAX results for sample composition at second location.
EDAX results for sample composition at third location.
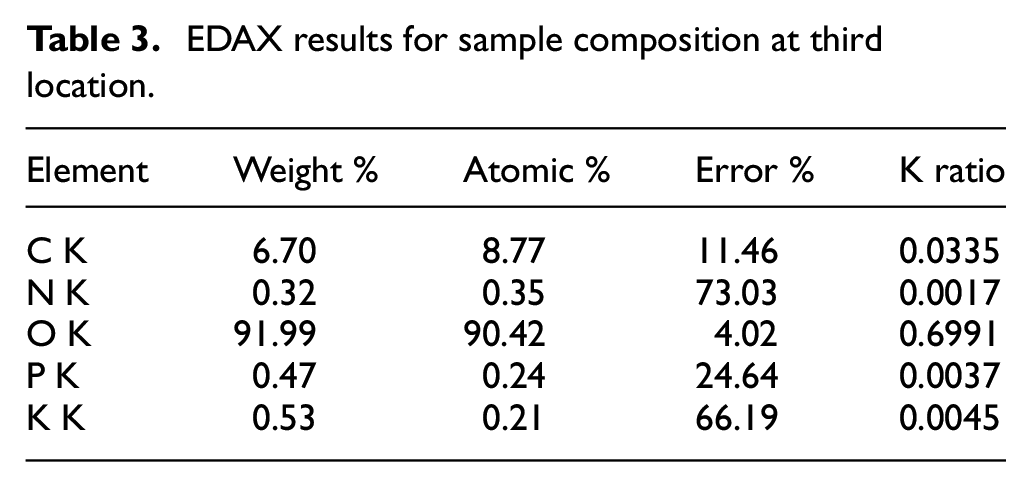
The three tables show the total elemental composition by mass percentage, as well as the atoms in each allocated and unallocated. The average content of N, P, and K elements is indicated by the K ratio values of 0.00303, 0.00413, and 0.0038, respectively. This indicates that the initial content of the lateritic soil samples is quite small. This amount is smaller than the addition of each element when the mass variations of the three are carried out at the experimental stage of measuring resistance and capacitance. Therefore, the initial content of the three elements in the soil sample used can be neglected.
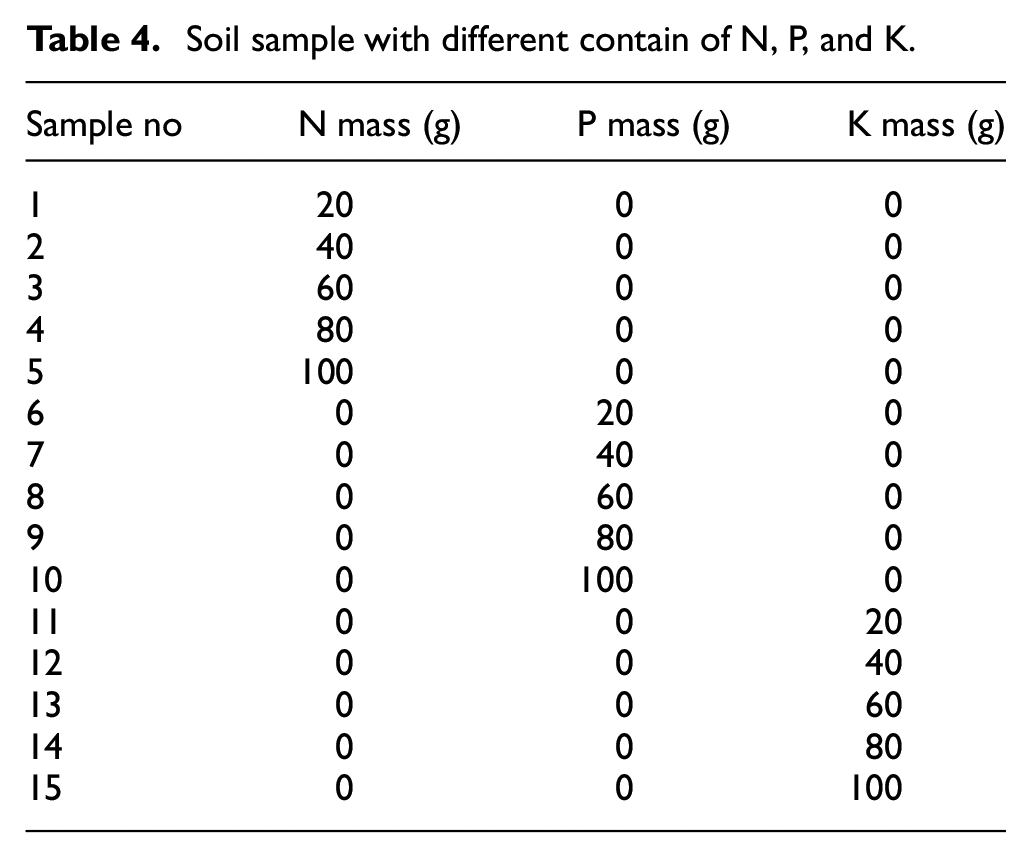
The first experiment was carried out in dry soil conditions. The capacitance and conductivity of the plain soil and soil mixed with each fertilizer (N or P or K) measured. The fertilizer concentration in the soil varied from 0 to 100 wt%. Before conducting the measurement, the fertilizer was mixed with soil evenly. The capacitance and conductivity were measured from 15 different soil samples which are tabulated in Table 4.
Soil sample with different contain of N, P, and K.
The second experiment was carried out on wet soil conditions. The measurement of capacitance and conductivity of wet soil was conducted on the plain wet soil and with addition of fertilizer. The plain wet soil condition was made by adding 20–100 mL of water to the dry laterite soil, whilst the mixed wet soil and fertilizer are obtained by dissolving various weight of the fertilizer in 50 mL of water then pouring it to the dry laterite soil. The mass/volume concentration of fertilizer in the water varied from 0.6 to 3 g mL−1.
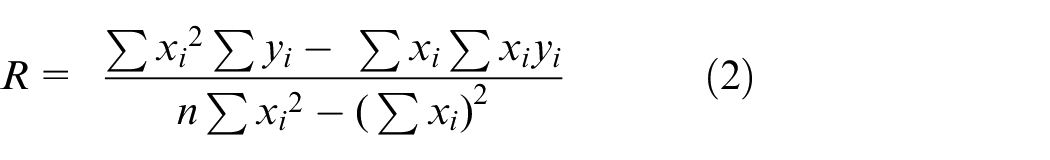
An example of a sample concentration of elements N, P, and K can be seen in Figure 4. After that, capacitance and conductivity measurement are then continued like the previous procedures for the dry soil, as it is shown in the Table 4.
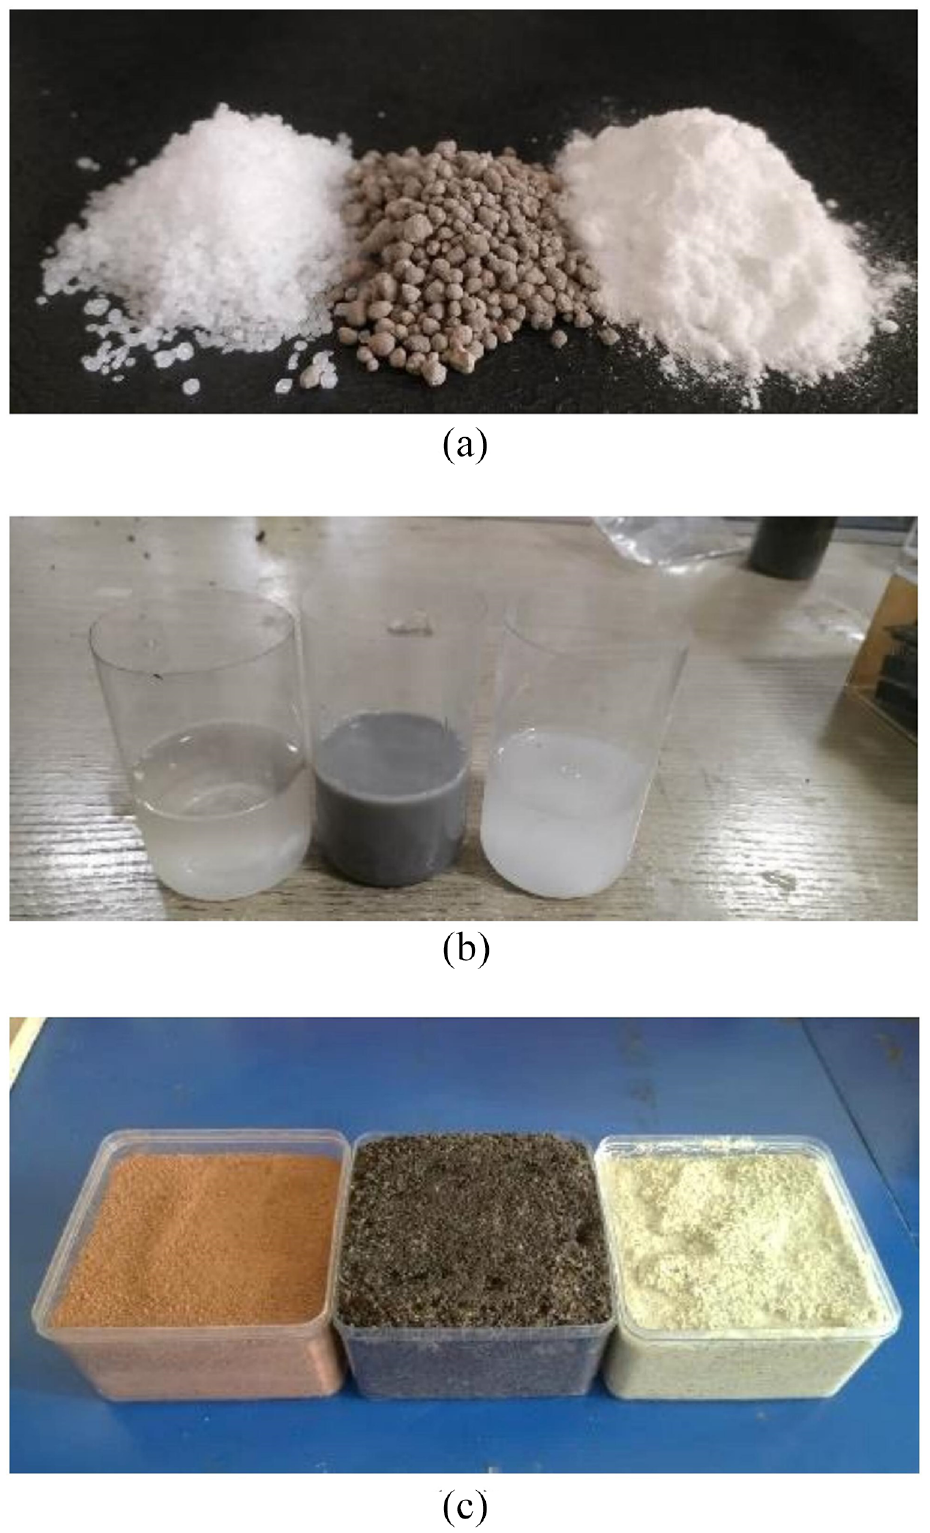
(a) Urea (NH2CONH2, N = 46%), SP-36 (P2O5, =36%), and Potassium sulfate (b) a solution of the concentration of elements N, P, and K to be added to dry soil like (c).
Data processing method
The results of conductivity measurement were then processed to obtain the conductivity by using the equation (1). After all, the electrical quantities, capacitance and electrical conductivity were then mapped in a graph to study the relation of the addition of each element N, P, and K to the capacitance and conductivity obtained during the measurement. The relationship between the concentration of each fertilizer in the soil and its electrical properties is determined through linear regression. The degree of correlation is then expressed by its R square coefficient, equation (2). The R square analysis compares the relationship between the two electrical quantities to the content of each fertilizer in the soil. The results of this analysis provide a recommendation of which quantity is more strongly related so that it can be used as an indicator for measuring fertilizer levels in the soil.
R = determination coefficient
Results and discussion
Effect of nitrogen, phosphorus, and potassium variation on electrical properties of dry soil
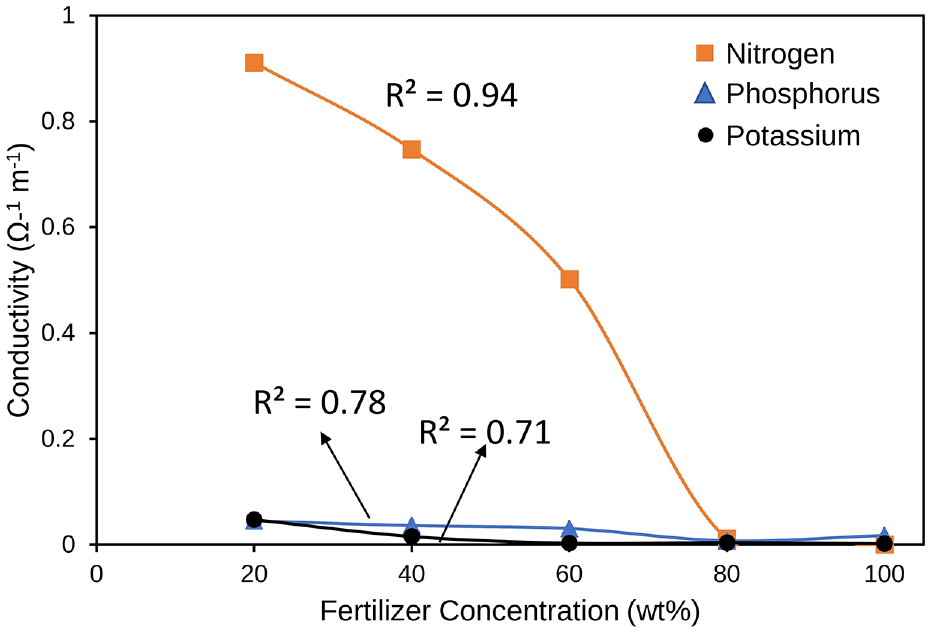
The capacitance and conductivity of plain dry soil were 2.3 nF and 9.5 mΩ−1 m−1, respectively, which are considered as the background capacitance and conductivity. The measurement of soil capacitance and conductivity in dry soil with various concentrations of fertilizer are shown in Figures 5 and 6, respectively. It clearly shown that either capacitance or conductivity of the dry soil decreased significantly as the concentration of nitrogen increased. The capacitance was decreased from 21 to 0.43 nF, whilst the conductivity was decreased from 9.5 to 0.2 mΩ−1 m−1 as the concentration of N was increased from 20 to 100 wt%. In contrast, the conductivity and capacitance of dry soil mixed with either phosphorus or potassium did not change significantly as these fertilizers concentration increased. The coefficient of determination of nitrogen addition was relatively high compared to those of phosphorus and potassium. On one hand, the coefficients of determination of capacitance and conductivity versus nitrogen were 0.95 and 0.94 respectively. In the other hand, the coefficient of determination of phosphorus and potassium from 0.47 to 0.78. This shows that the measurement of capacitances and conductivities in dry soil mixed with either phosphorus or potassium is less sensitive.
Capacitance measurement of various concentrations of fertilizer in the dry soil.
Conductivity measurement of various concentrations of fertilizer in the dry soil.
The low linear correlation and coefficient determination of phosphorus and potassium are due to the oxide form of these fertilizers that has low conductivity. Phosphorus source is obtained from P2O5 powder, whilst the potassium source from K2O powder. However, the conductivity and capacitance have a linear correlation and high coefficient determination with the addition of nitrogen. The source of nitrogen is urea which has a dipole moment and which makes it polar molecule. The polar molecule is easy to polarize under the electric field, 22 so it contributes to the capacitance and conductivity.
Electrical properties of soil with variations in water content
The second measurement was conducted to obtain the capacitance and conductivity in the soil which was added with some water. Water become the agent in the ionic process. 23 As the water concentration in the soil was altered from 12 to 35 wt%, the capacitance and conductivity of the plain wet soil varied from 1 to 3 μF and varied from 0.02 to 1.3 Ω−1 m−1, respectively. It shows that the capacitance increased tenfold compared to the capacitance of dry soil, whereas the conductivity increased almost 1000 times. The capacitance greater linearly than conductivity with the increae of water volume. Some minerals in the soil are fused and distributed into the water, then they become the ions. As the volume of water increases, the more ions is produced. These resulted in the increase of the capacitance and the conductivity of the wet soil.
Effect of nitrogen, phosphorus, and potassium variation on electrical properties of wet soil
The capacitance and conductivity of the wet soil that was added with nitrogen, phosphorus, and Potassium were investigated. The essential plant mineral nutrients in the soil are in the form of ions, it is easier for plant root to absorb the nutrients. 24 The major elements of Nitrogen that can be found in the soil as NH4+ and NH3− ions. Nitrogen can be an ion, for example NH4+, it need some more H atom from water (H2O). The more the water supply is, the more H to ionize the Nitrogen is. The presence of ions is linearly correlated with the capacitance value with a positive gradient while the conductivity value decreases with a less linear pattern.
The similar trend was observed in the addition of Phosphorus to the wet soil samples. Phosphorus as ion should be in the form of acid of H2PO4−, HPO42−, it is briefly stated that H and O elements are ions. The needs of H can be supplied from water, as in this condition wet soil could be the medium for the ionization process. Thus, the presence of phosphorus in the wet water is linearly correlated to the capacitance and conductivity of the soil. The addition of potassium to wet water also gives some contribution to the electrical properties of the soil. In general, potassium could be in the form K+ when it is found the ion. The potassium oxide is reacted with water to form potassium hydroxide, thus the presence of alkali resulted in the conductivity of the soil samples raise during the increasing of the potassium concentration in the samples. As the concentration of potassium becomes greater, it is also supplies high concentration of ion K+. Increases of ion K+ also provides more conductivity in the soil measurement. However, the capacitance is decreased as the potassium oxide concentration increases. The capacitance decreases because the potassium oxide is not completely changed to potassium hydroxide due to the lack amount of water. This explanation is described in the Figures 7 and 8.
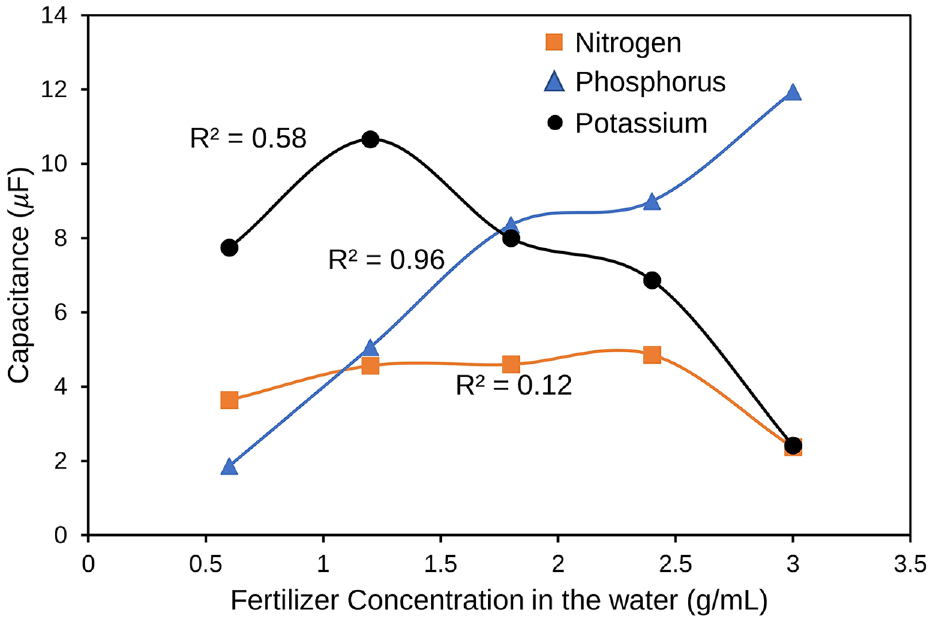
Capacitance measurement of various concentrations of fertilizer in the wet soil.
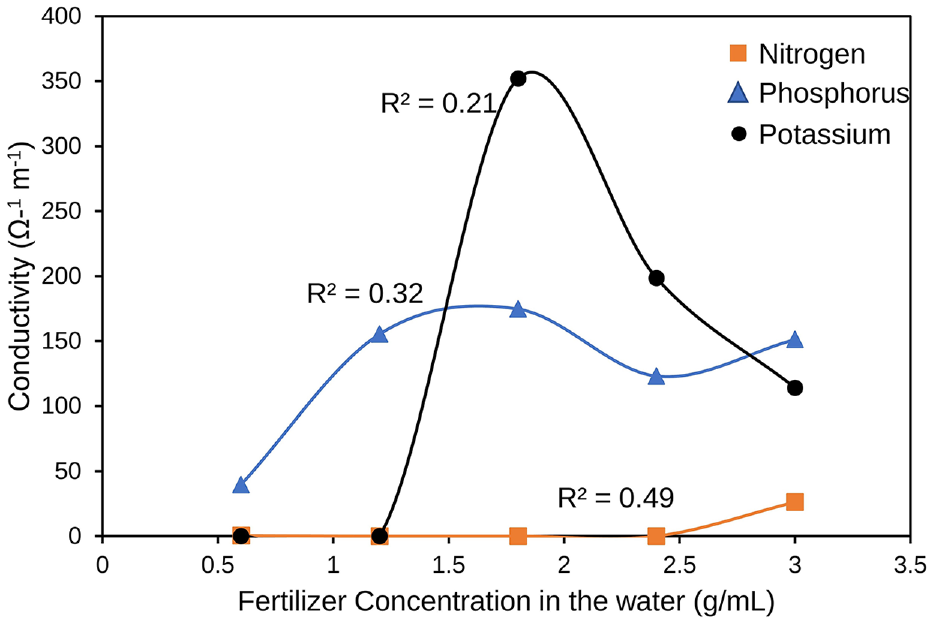
Conductivity measurement of various concentrations of fertilizer in the wet soil.
The results confirm that the supply of ions is the main factor in the electrical properties of the soil, especially for the wet soil samples. The main key in this process is the mobilization of the ions in the soil itself and within the soil solution. The nature of the movement of these ions in the soil and soil solution affects the plant growth, crop yield, and product quality. Lastly, it also affects the measurement of the capacitance and conductivity in the soils. Based on the coefficient of determination, the capacitance value has a better linearity pattern than the conductivity.
The relationship between the levels of each element N, P, and K on the values of conductivity and capacitance of the soil has been investigated. However, in this study, the addition of each element to the soil sample and measurements of the two electrical quantities were carried out separately. While in reality in the field, the three elements can mix and simultaneously affect the value of the two electrical quantities. This limitation becomes an opportunity for further research where the variation of the three elements simultaneously must be investigated for their influence on the conductivity and capacitance of the soil.
Conclusions
The use of conductivity measurements as an indicator shows that the amount of nutrients in the soil is still quite good to be used in dry soil conditions. However, the utilization of the capacitance measurement results has the potential to complete the determination of the amount of nutrients in wet soil conditions. So that, the use of the two electrical parameters simultaneously through the optional technique of soil conditions can be more effectively utilized.
The linearity pattern of conductivity values in dry soil conditions, due to the addition of nutrients, is better than the capacitance with average coefficient of determination of 0.81 and 0.72, respectively.
However, the effect of the addition of N, P, and K elements on wet soil conditions on the capacitance and conductivity values in an average coefficient of determination of 0.55 and 0.34, respectively. This shows that the capacitance has better linearity than the conductivity. Among them N has shown the biggest reflection of electrical parameter.
Footnotes
Declaration of conflicting interests
The author(s) declared no potential conflicts of interest with respect to the research, authorship, and/or publication of this article.
Funding
The author(s) disclosed receipt of the following financial support for the research, authorship, and/or publication of this article: This work was funded by Research Grant Rispro Invitasi, LPDP Kementrian Keuangan, 2020-2022, with the Contract No. PRJ-56/LPDP/2020.