
Abstract
A scheme of detecting magnetic field anomaly is proposed to find local short circuit faults in long stator cores of high speed maglev transit. And a composite magnetic anomaly signal processing method is designed based on wavelet with fractal, screening out a little anomalous data from massive data. First, suspicious data are quickly recognized by applying multiple fractal spectra, then being confirmed by wavelet modulus maxima calculation. The experiment results show that the method is immune to the fluctuation of 8–12 mm suspension gap and its hit rate can be improved by more than 66%.
Keywords
Introduction
According to “National Comprehensive Three-dimensional Transportation Network Planning Outline,” the layout of high speed maglev channels and construction of lines between mega cities are imperative. However, previous studies mainly focused on the suspension, ignoring the important component of maglev track. With the application of high-speed maglev traffic, the importance of track detection and maintenance will become prominent. 1 In Figure 1, unlike traditional wheel track, high speed maglev track is actually a long stator primary of synchronous linear motor, which is an important electrical component of the suspension and traction system in maglev transportation. Unfortunately, the focus of current track detection technology is still limited to geometric characteristics, ignoring its electrical properties.
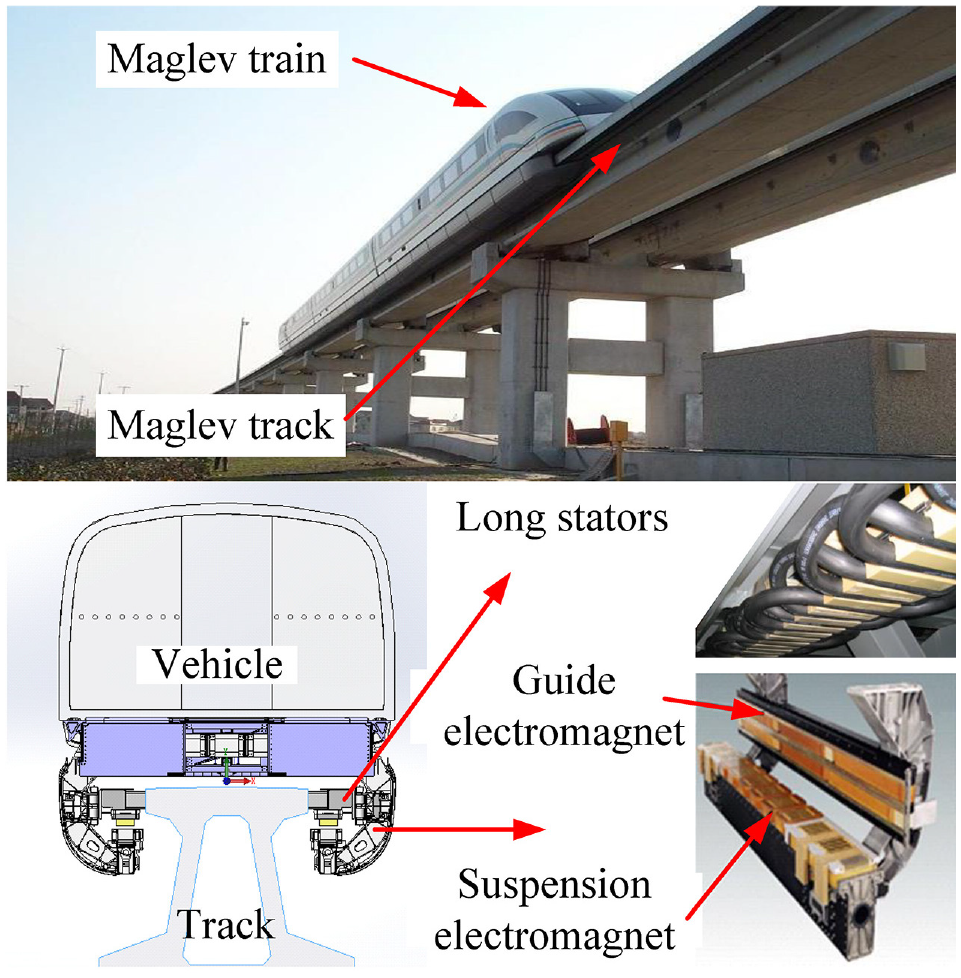
Maglev track and operation mode of maglev train.
Epoxies on the surface of iron core crack and fall off, resulting in short circuit between the silicon steel sheets, which is easily caused by the collision between the vehicle-track or environmental corrosion. If not repaired in time, it will lead to large distortion of traveling wave magnetic field, which directly affects the safety and stability of vehicle operation. 2 The research on this subject has a great significance to improve the operation efficiency of high-speed maglev traffic, avoid major safety accidents, and reduce economic losses.
The research shows the relationship between short circuit fault of cores and main Leakage Magnetic field of Traveling Wave (LMTW). 3 A mounted magnetic field detection system (Figure 2) is designed by National University of Defense Technology to achieve dynamic and efficient monitoring for iron cores. It can efficiently analyze the condition of iron cores by LMTW closed with air. 4 It’s a challenge, picking out the few anomalies from thousands of kilometers of massive data between mega cities. 5
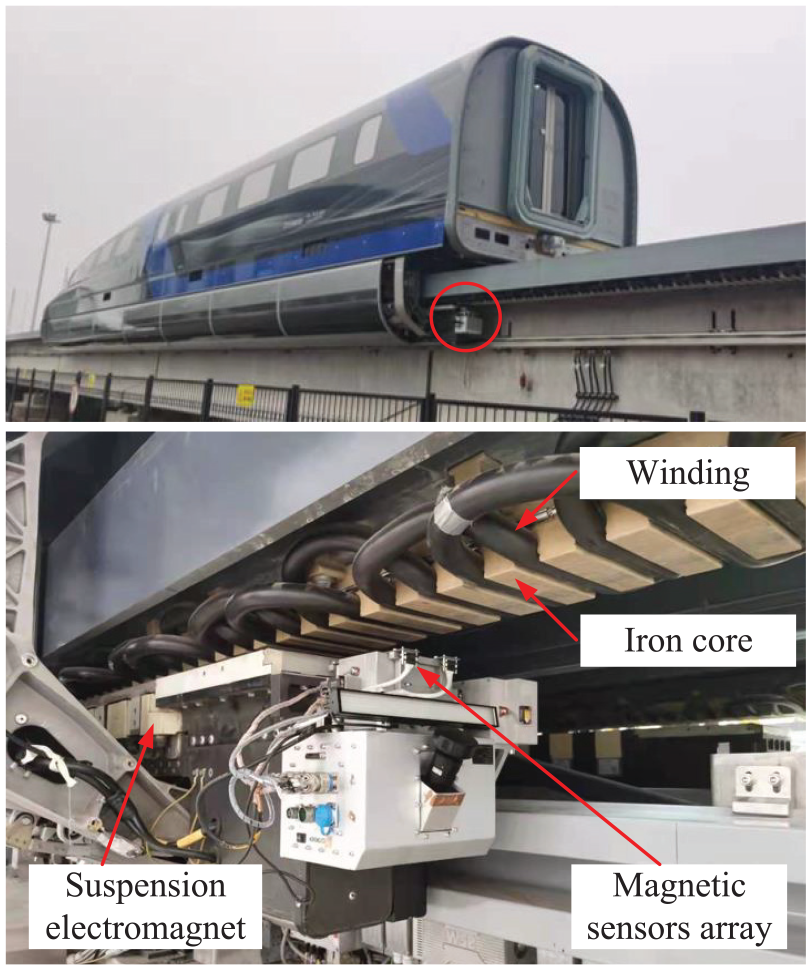
Installation position of magnetic detection system.
Common anomaly detection algorithms are statistics, data-driven and multiscale analysis. Statistics are suitable for detection of outliers. 6 Because the anomaly of LMTW is faint, it’s easy to cause high false alarm. It’s difficult to implement the data-driven method because of the LMTW detection belonging to a typical under-sample problem. 7 Multiscale analysis include spectrum analysis, wavelet analysis, Empirical Mode Decomposition (EMD) and fractal dimension or multifractal spectrum analysis. 8 Spectrum analysis isn’t appropriate to LMTW with wide spectral range and complex interference; EMD has superior performance in filtering and denoising, but its mathematical basis is poor; Wavelet analysis is a time-scale analysis method, which is usually being adopted in signal singularity detection, 9 such as radar target, 10 aviation construction damage. Similarity-based fractal methods has a strong nonlinear representation. Literature 11 analyzed simulation LMTW by Higuchi fractal dimension and proved it’s a typical fractal object. Location of distorted magnetic field can be effectively screened using fractal dimension. However, physical experiment was not involved.
Anomaly detection based on wavelet combining with fractal is a research hotspot in the engineering field. 11 In medical bowel sound and heart sound anomaly detection,12,13 the higher-order statistical calculation based on fractal dimension and wavelet time-frequency analysis have been widely used to detect anomaly from normal signal under different noise levels and detection conditions. 14 In seismic activity detection, Sanchez et al. proposed the EMD-FD algorithm by combining EMD with fractal theory for geomagnetic anomalies caused by low-frequency seismic activity, which uses EMD to remove background noise and combines three fractal dimension of Katz, Higuchi and Box to mine more information. 15 In mineral exploration in surface covered areas, Guoxiong Chen proposed an anomaly extraction and identification method based on wavelet and fractal theory, which provides a new break through direction for identifying hidden ores by using wavelet transform to high light local details and using multiple fractal spectra to the intrinsic structure of the data. 16
The main contributions of this work can be summarized as follows:
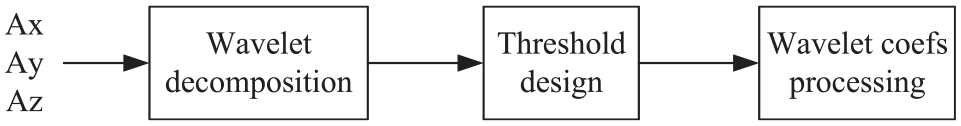
Designed a compound anomaly signal processing method combined with the sensitivity of fractal to the internal law of massive data and the sensitivity of wavelet to local mutation (Figure 3). And it provides an efficient scheme for core fault detection of high-speed maglev track.
Fractal analysis is used to preliminary screening of massive data, and wavelet analysis is used to reinspection of suspicious data, which greatly improves detection efficiency and accuracy on the premise of ensuring the hit rate. The combination method is also suitable for other detection objects with huge amount of data. Constant False Alarm Rate (CFAR) is used to ensure that all anomaly data are detected in the preliminary screening, and the hit rate is improved by appropriately increasing false alarm.
The research also provides a new method for detecting core faults in large motor or damage detection in pipeline.
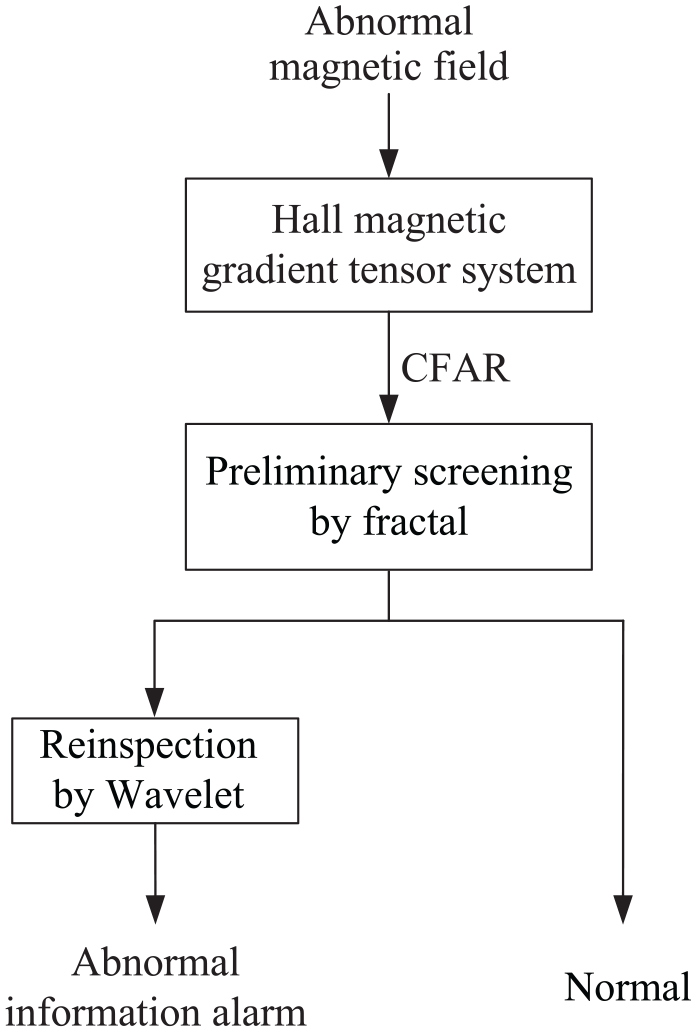
Detection process based on wavelet combining with fractal.
Preliminary screening by multifractal spectrum
Fractal analysis of LMTW
The frequency spectrum of LMTW is analyzed. As shown in Figure 4, the frequency spectrum of
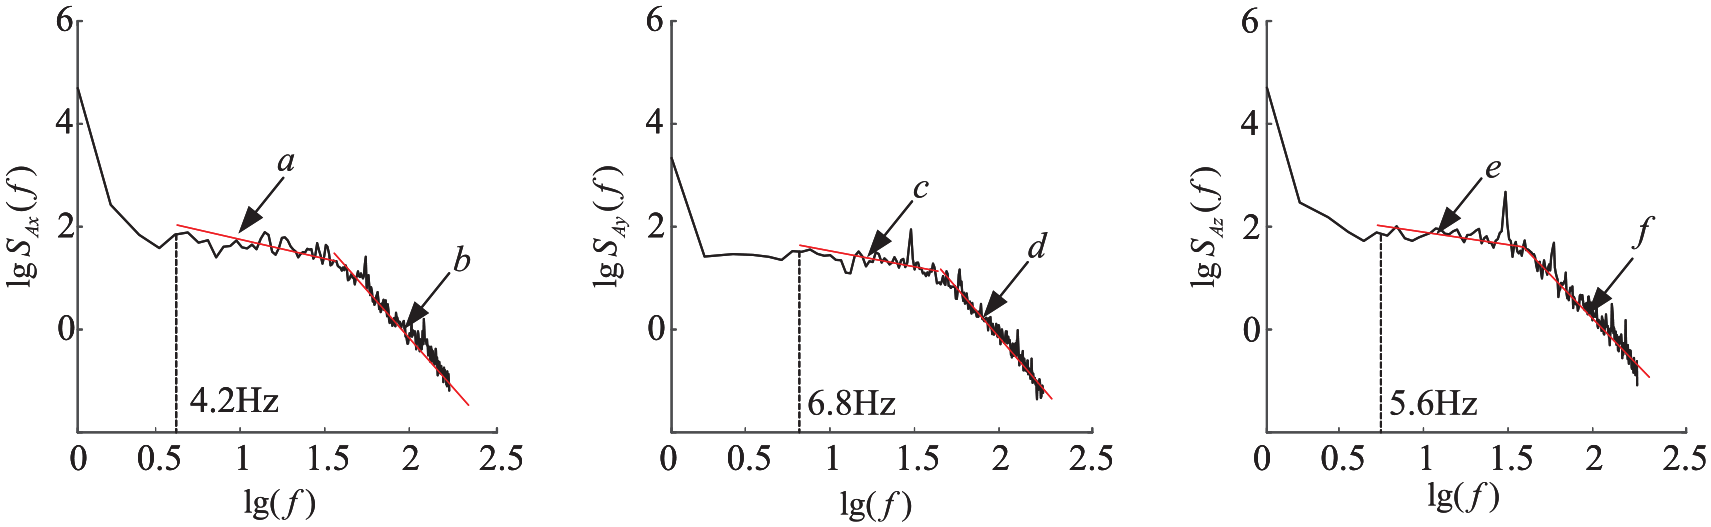
Double logarithm power spectrum of LMTW.
Taking
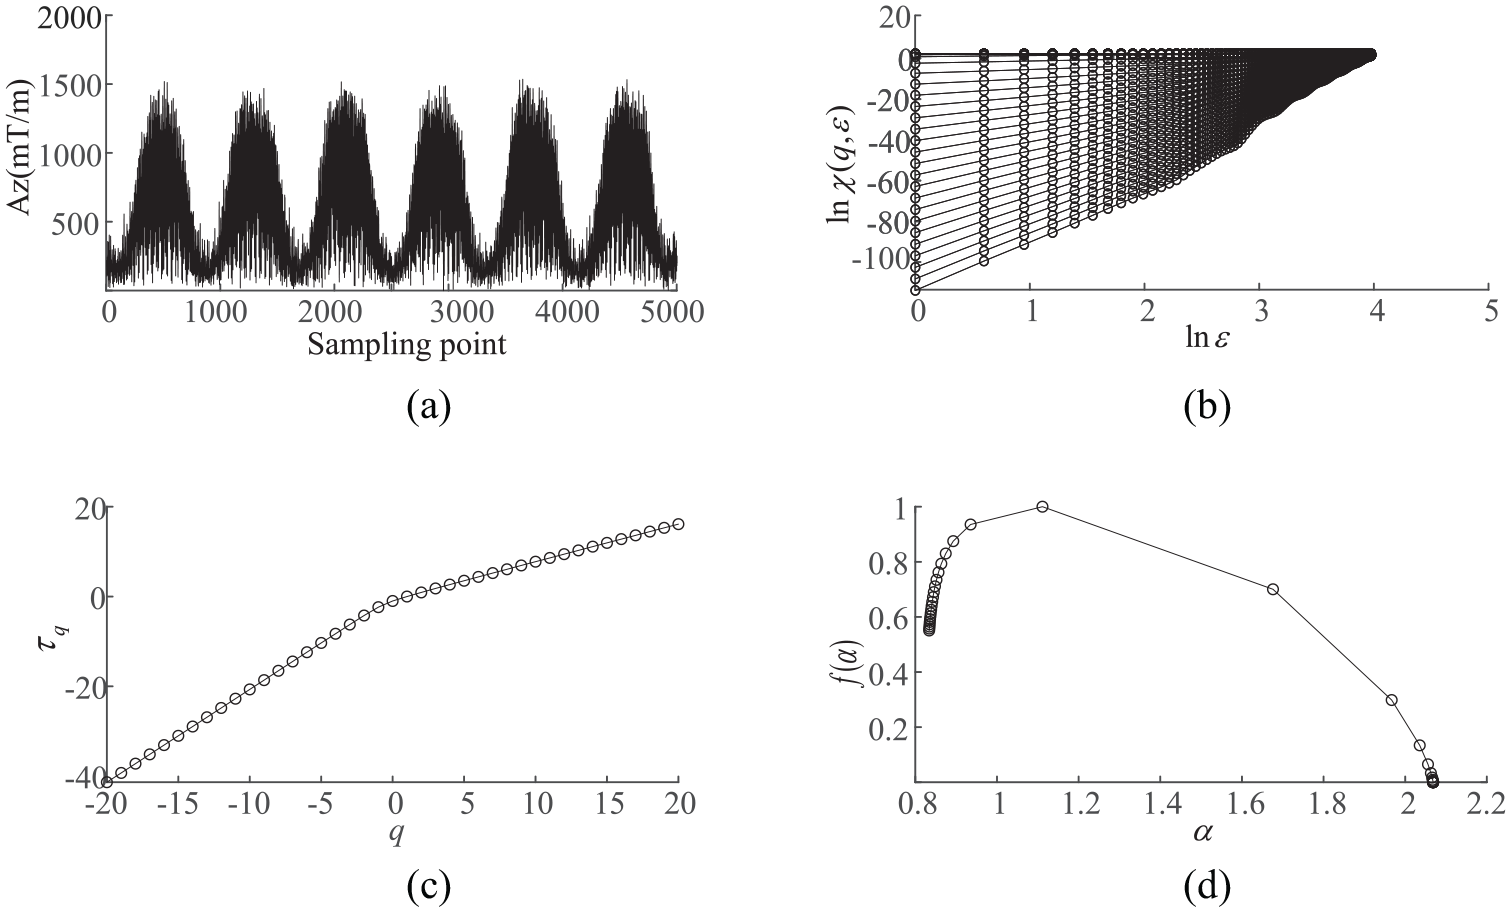
Multifractal analysis results of LMTW: (a) original signal, (b)
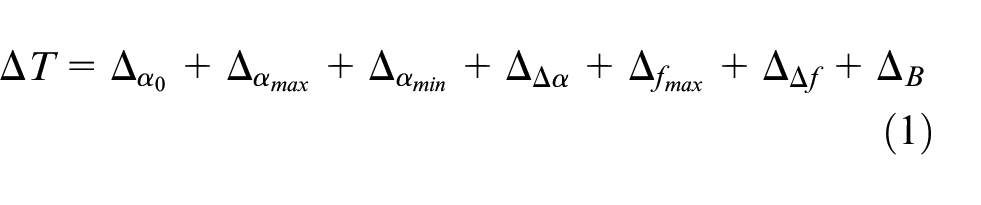
Objective function
The normal and anomaly data are distinguished by the characteristics of each spectrum after obtaining the multifractal spectrum corresponding to the magnetic field data of each track beam. Therefore, feature parameters are used to quantitatively describe the differences and similarities between spectra. The definition of characteristic parameters are as follows 16 :
(a) Spectral width
(b) Max value of multifractal spectrum:
(c) Difference of dimension between max and min probability subsets:
(d) Symmetric parameter:
After the fixed length signal is transformed into multifractal spectrum,
Comparison of algorithms of multifractal spectrum
Using multifractal spectrum to screen massive data requires low computational complexity and strong robustness. Calculation methods include Box-counting, Moment, WTMM, Wavelet Leader and MF-DFA, in which WTMM based on CWT lacks theoretical basis with large computational complexity, 15 and MF-DFA is prone to poor stability of caculation with different segmentation scale. 17 So, Box-counting, Moment and Wavelet Leader are involved in this paper.
Algorithm time complexity analysis: Time complexity, referring to the running time of the algorithm, is usually described by theoretical calculation complexity
Time complexity of different algorithms.
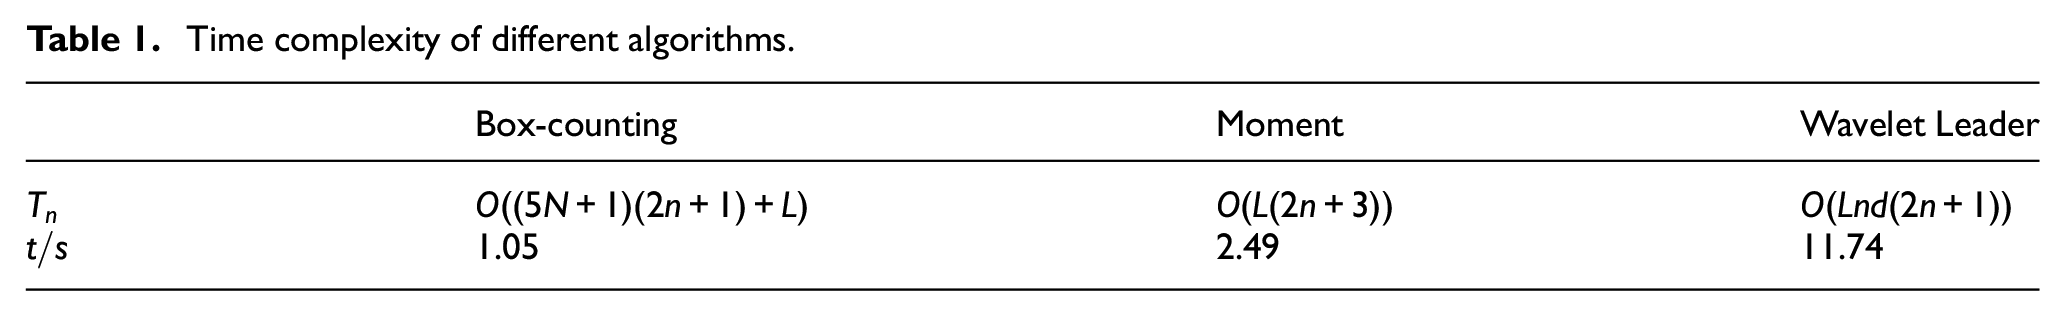
The calculation parameters of
Algorithm robustness analysis: The calculation results of multifractal spectrum are closely related to its components. If the signal is mixed with different degrees of noise or periodic components, calculation results may have various degrees of deviation. The robustness is estimated according to the influence of the mixed components on different algorithms. 18 The standard and mixed components are as follows:
(a) Standard component (1): - signal of normal iron core;
(b) Standard component (2): - signal of short circuit fault (180 mm);
(c) Mixed component (1): - white Gaussian noise;
(d) Mixed component (2): - sin periodic signals.
(1) Multifractal spectrum after mixing white Gaussian noise
After mixing different intensities of noise signal, two groups of fractal spectrum calculated by Box-counting have obvious aliasing, while the fractal spectrum calculated by Moment and the Wavelet Leader have high discrimination. As shown in Figure 6, by calculating objective function, it’s found that the discrimination of Moment to anomaly signals is more obvious than Wavelet Leader.
(2) Multifractal spectrum after mixing sin periodic signals
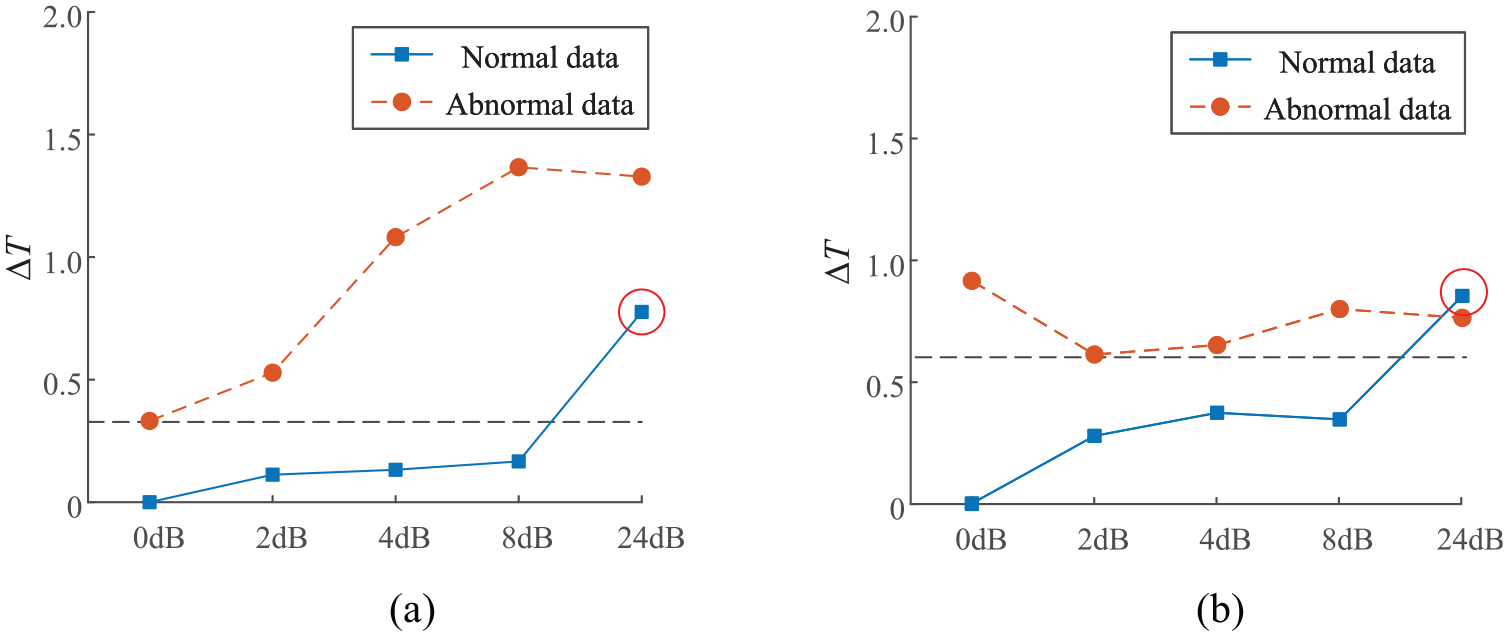
Variation of spectral parameters with intensity of white Gaussian noise: (a) Moment and (b) Wavelet Leader.
When high speed maglev train is moving, the suspension electromagnet vibrates at
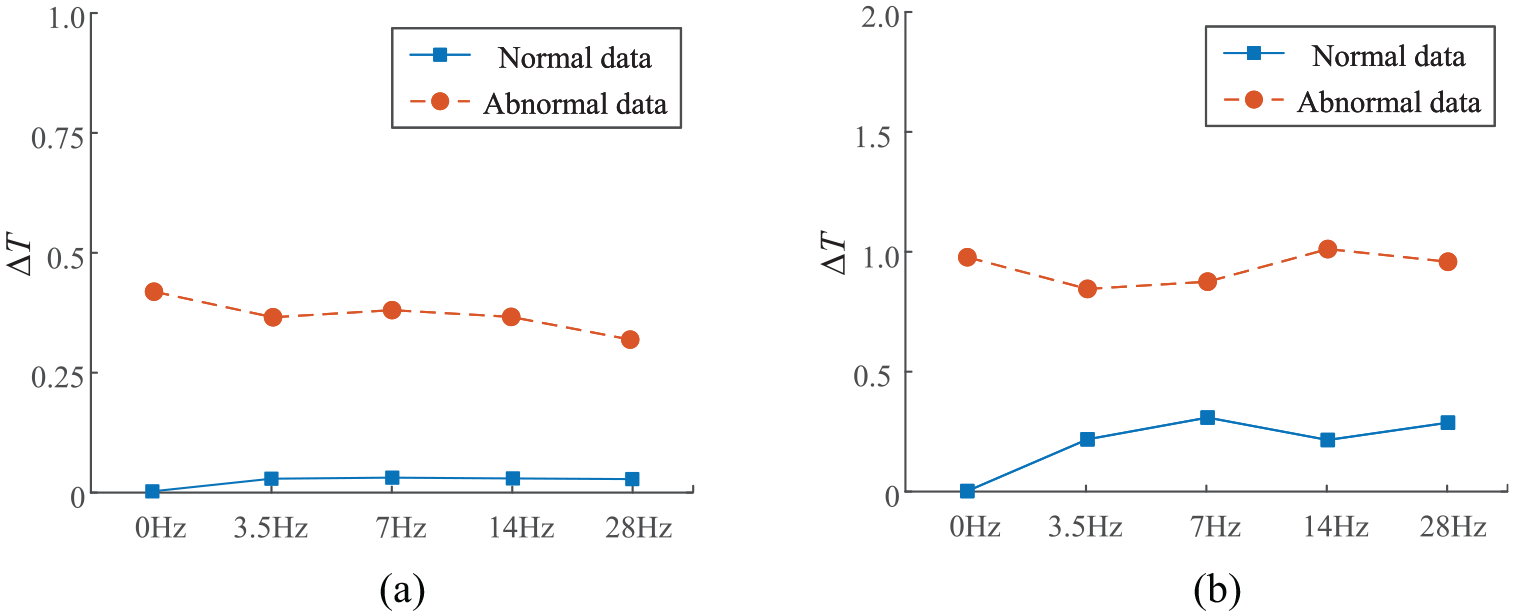
Variation of spectral parameters with periodic signal frequency: (a) Moment and (b) Wavelet Leader.
According to the analysis results of time complexity and robustness, Moment has the same stability as Wavelet Leader, but has significant advantages in computational efficiency. Therefore, Moment is selected to calculate the multifractal spectrum of LMTW.
Preliminary screening mechanism by CFAR
The purpose of primary screening of massive data is to greatly reduce the amount of data sent to reinspection step. The traditional fixed threshold has poor adaptability and is prone to miss rate or false alarm. CFAR used in radar multi-target detection, balances the relationship between “miss rate” and “false alarm” by Neyman Pearson. It can adaptively adjust comparison threshold according to the input to improve hit rate as much as possible within the set false alarm range. 19 Classical detectors include CA-CFAR, GO-CFAR, and SO-CFAR which have similar computational complexity. Among them, SO-CFAR has the largest detection probability for multiple anomaly targets. Therefore, SO-CFAR is selected to detect the anomaly multifractal spectrum in this paper.
Reinspection by wavelet modulus maxima
The LMTW caused by the iron core of short circuit shows an anomaly mutation. To judge whether the iron core is damaged is to determine whether the corresponding magnetic field signal has singularity. Compared with the traditional Fourier transform, wavelet analysis has good time-frequency localization ability. It can filter the noise and retain abrupt components of the signal. To a certain extent, it avoids the blurring of abrupt components by low-pass filtering. Binary wavelet transform (BWT) only discretizes scale parameters and has time-shift invariance. So it’s superior to discrete wavelet transform (DWT) in signal singularity detection and adopted in the Reinspection process. 20
Filtering process of wavelet threshold for LMTW.
Pretreatment process
The object of wavelet analysis is Ax, Ay and Az corresponding to track beam of 24.768 m. On the one hand, the magnetic gradient is calculated by the spatial difference approximation method, which strengthens characteristics of the magnetic field anomaly caused by cores damage. On the other hand, because the gradient is more violent than amplitude, it leads into high-frequency noise. In addition, the magnetic sensor array is installed close to electromagnets. The high-frequency magnetic modulation interference, caused by chopper and the natural noise, seriously impacts on the judgment of anomaly signal and must be filtered.
Wavelet threshold has higher stability, lower computational complexity and stronger applicability to low SNR signals. 21 It’s denoising process is shown in Figure 9. The key lies in the selection of wavelet basis function, wavelet coefs processing strategy and threshold estimation method.
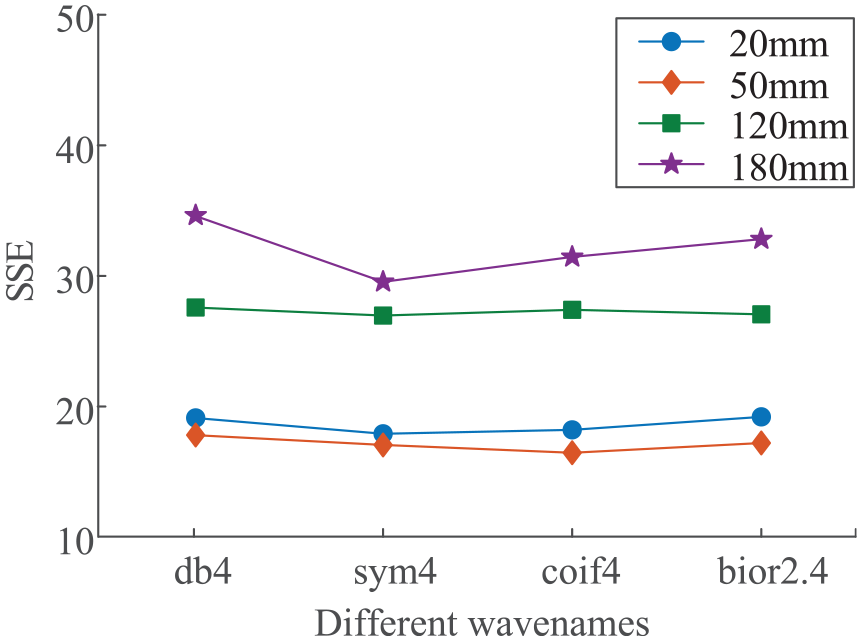
Coincidence degree of different wavelet basis functions for different fault degrees.
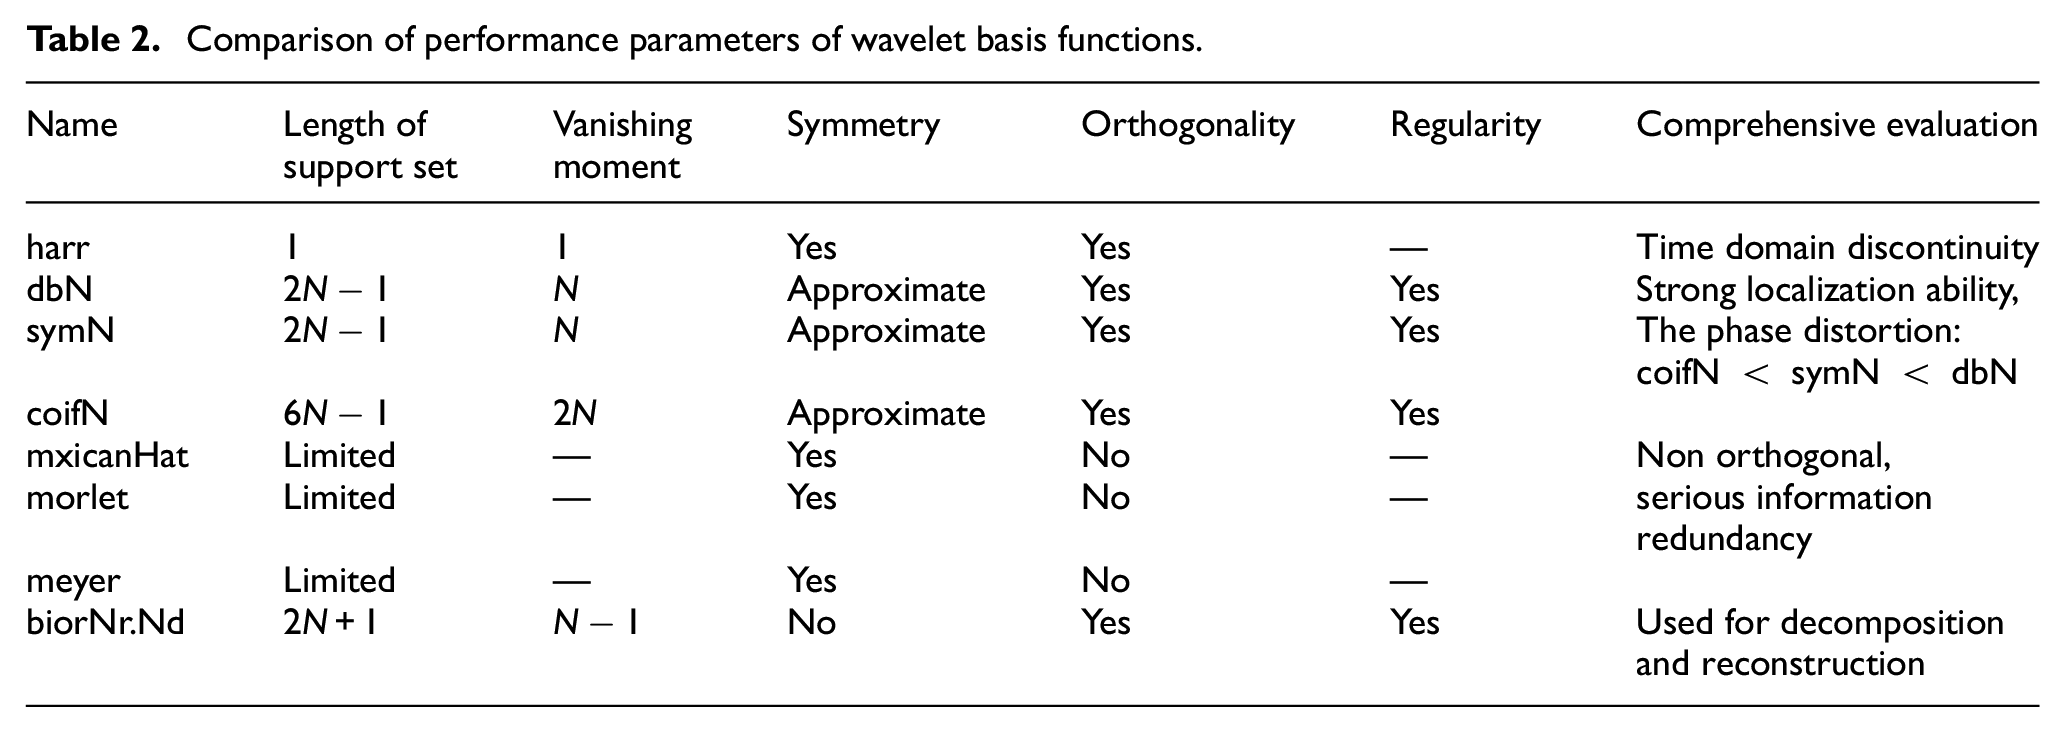
Selection of wavelet basis function: The essence of wavelet coefs is to quantify the similarity between wavelet basis function and signal. In addition, the length of support set, regularity, vanishing moment and symmetry of wavelet basis function all determine quality of wavelet transform. 22 The performance comparison of common wavelet basis functions is shown in Table 2.
Comparison of performance parameters of wavelet basis functions.
Combined with simulation results in Luo,
23
dbN, symN, coifN, and bior with high similarity are selected to analyze the magnetic gradient tensor analytical signal
Selection of threshold and threshold function: In wavelet threshold filtering, threshold and threshold function are two basic elements, which determine the final denoising effect of magnetic anomaly signal. At present, there are three kinds of thresholds proposed: Sgtwolog, Rigrsure, and Heurshrink. In the above estimation methods, the fixed threshold and minimum maximum variance criterion are characterized by “over strangulation,” which can eliminate more noise and may also remove useful high-frequency signals. The unbiased risk estimation criterion and hybrid criterion tend to “over reservation,” and only part of the coefs are set to zero, which is suitable for the situation that frequency distinction between useful signal and noise is obvious and SNR is high.
The threshold function determines the processing strategy of wavelet coefs greater or less than the threshold. Compared with hard threshold, the processed signal of soft threshold is smoother, but it’s very unfavorable to the anomaly detection. Hard threshold can retain more extreme points, which benefits the extraction of anomaly features according to the discrimination of wavelet modulus maximum line.
Therefore, this paper selects fix hard threshold processing method to directly set the wavelet coefs determined to be related to noise, so as to reduce number of extreme points caused by noise as much as possible.
Anomaly detection process of wavelet modulus maxima
Actual signals are often mixed with various noises and expected signals. The anomaly detection based on wavelet modulus maxima can accurately extract the signal from noises according to the different propagation characteristics of noise and signal in wavelet transform. The detection process is shown in Figure 10.
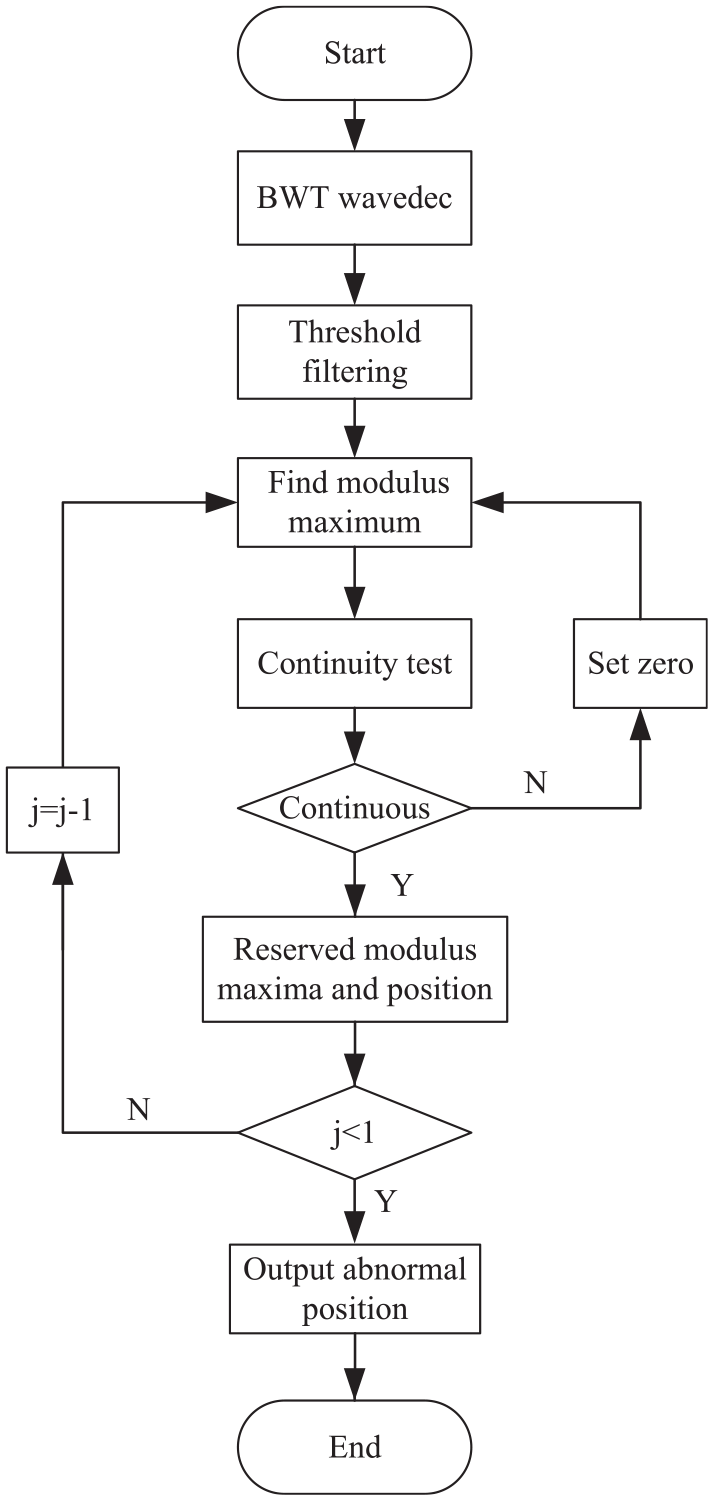
Detection process of wavelet modulus maxima.
For actual signals, not all modulus maxima lines linked to noises will be interrupted, and modulus maxima lines linked to signals are connected. Modulus maxima points linked to signal have higher correlation and more concentrated positions than noises’. In reasonable search range, with gradual reduction of the search range, number of modulus maxima lines linked to signal tends to be stable. However, due to the strong randomness of distribution position of noise’s modulus maxima points, number of modulus maxima lines tends to decrease.
Experimental results
Ground verification device
Based on traveling wave magnetic field is regular, the proposed anomaly detection method can be equivalently verified through transformation model of ground detection and on-board detection data. Figure 11 shows the ground validation device. include five parts: linear motor primary, magnetic sensors array, mobile platform, transducer, and data acquisition module. The transducer is used to excite the linear motor primary to simulate LMTW. The detection distance between the measurement array and the stator is controlled by the vertical moving module, and the horizontal moving module is driven to scan the stator surface at low speed. The magnetic gradient tensor signal is synchronously detected and sent to the upper Computer for storage and display.
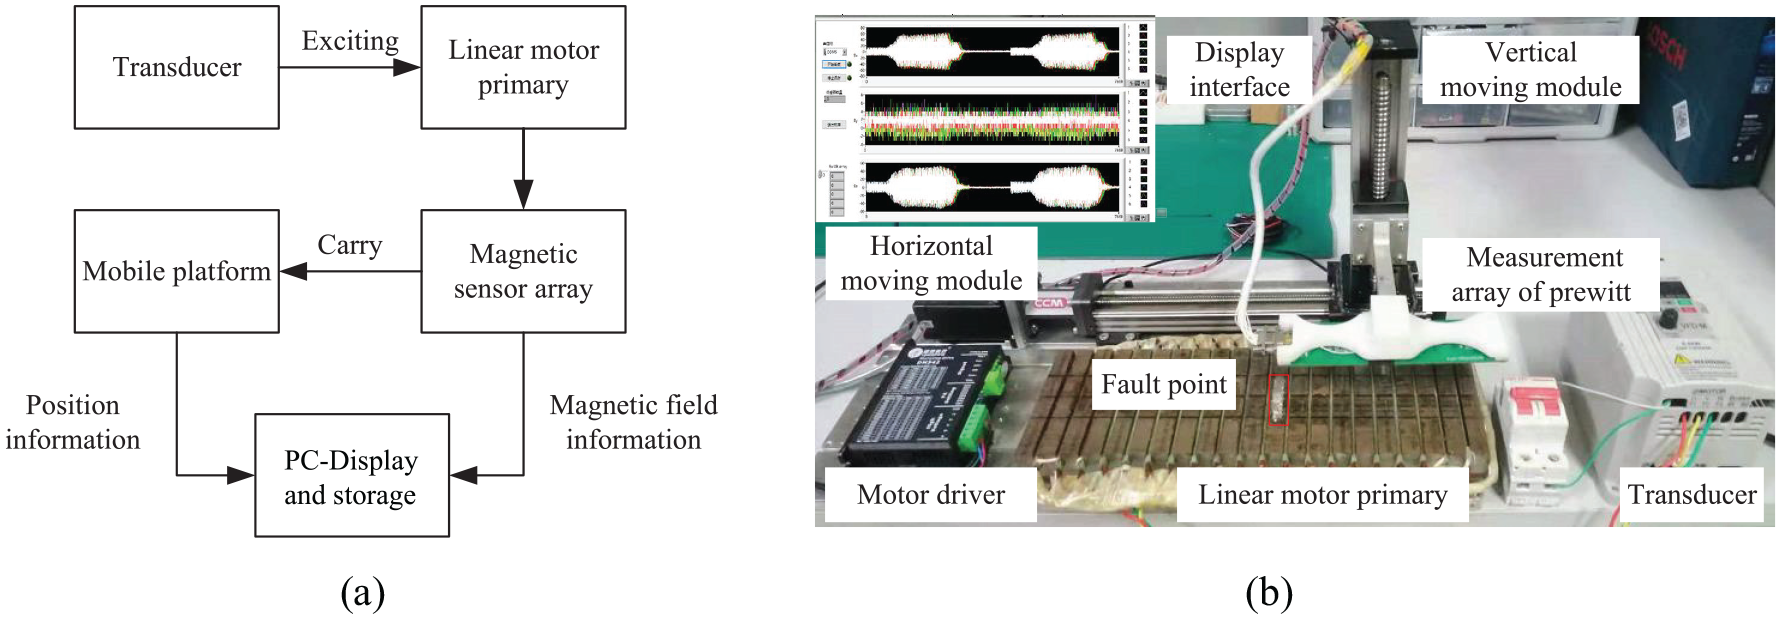
Ground verification device for measuring LMTW: (a) structural composition of verification device and (b) verification device.
Verification of compound magnetic anomaly detection method
In Figure 11, the 12th tooth of linear motor stator is damaged to simulate the short circuit fault of iron core, with the size of about
Preliminary screening results: Respectively collect 200 groups of normal magnetic field data and 5 groups of anomaly magnetic field data at the detection distance of
Standard fractal spectral parameters.
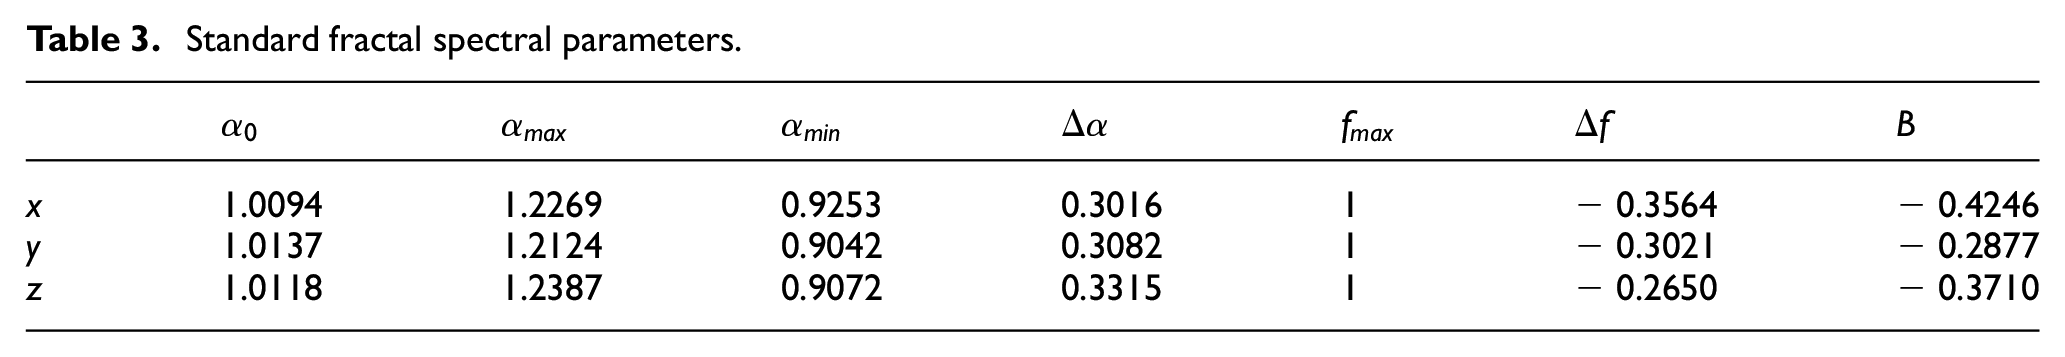
Five position numbers, 146, 76, 124, 164, and 55 are randomly generated, and the anomaly data obtained from different detection distances of
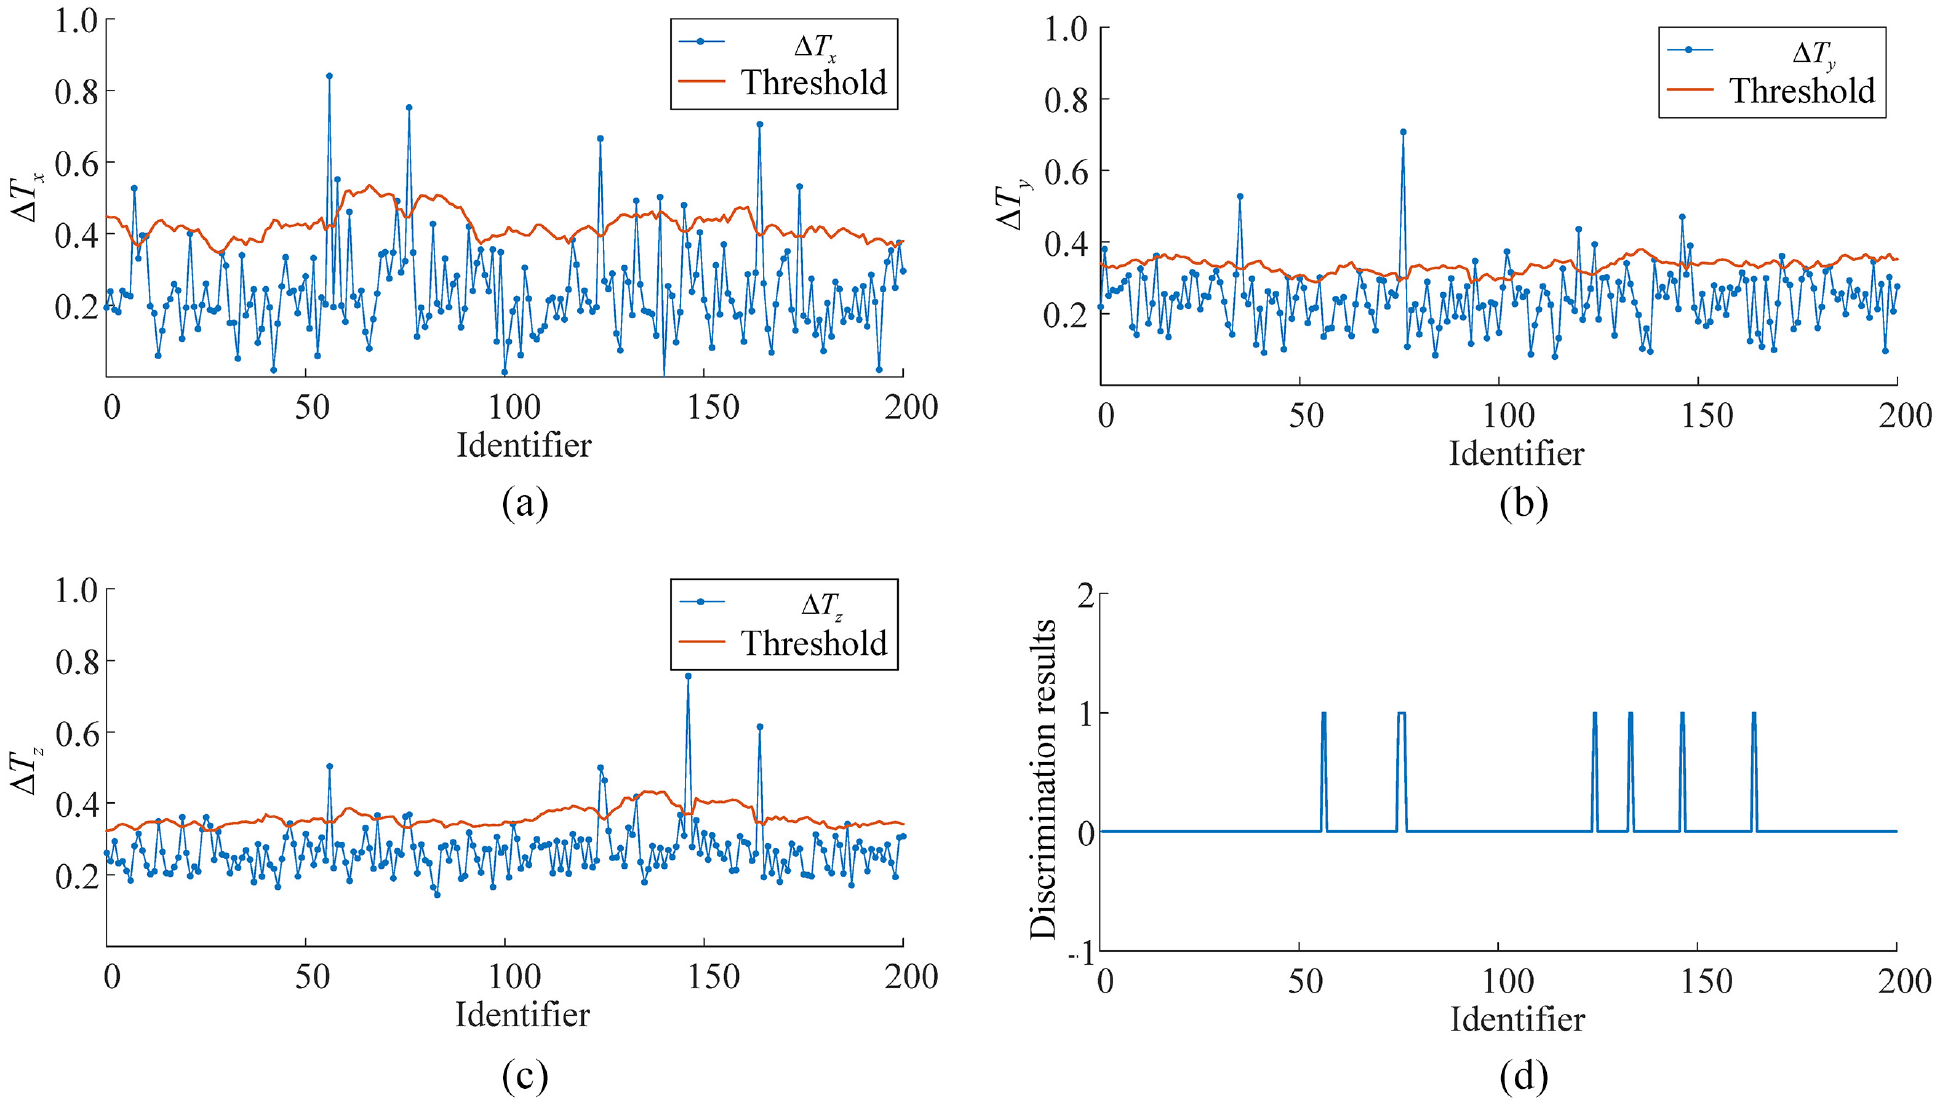
Preliminary screening results of multifractal, and “1” indicates the data contains abnormal information: (a) detection results of x, (b) detection results of y, (c) detection results of z, and (d) comprehensive detection results.
The comprehensive judgment basis: if two or more directions of
Experimental conclusion: the magnetic anomaly screening based on multifractal spectrum can effectively detect the short circuit fault of iron core, and is not affected by the fluctuation of vertical detection distance.
Reinspection results: According to the detection process shown in Figure 3, send the suspicious data to reinspection for review.
As shown in Figure 13, taking
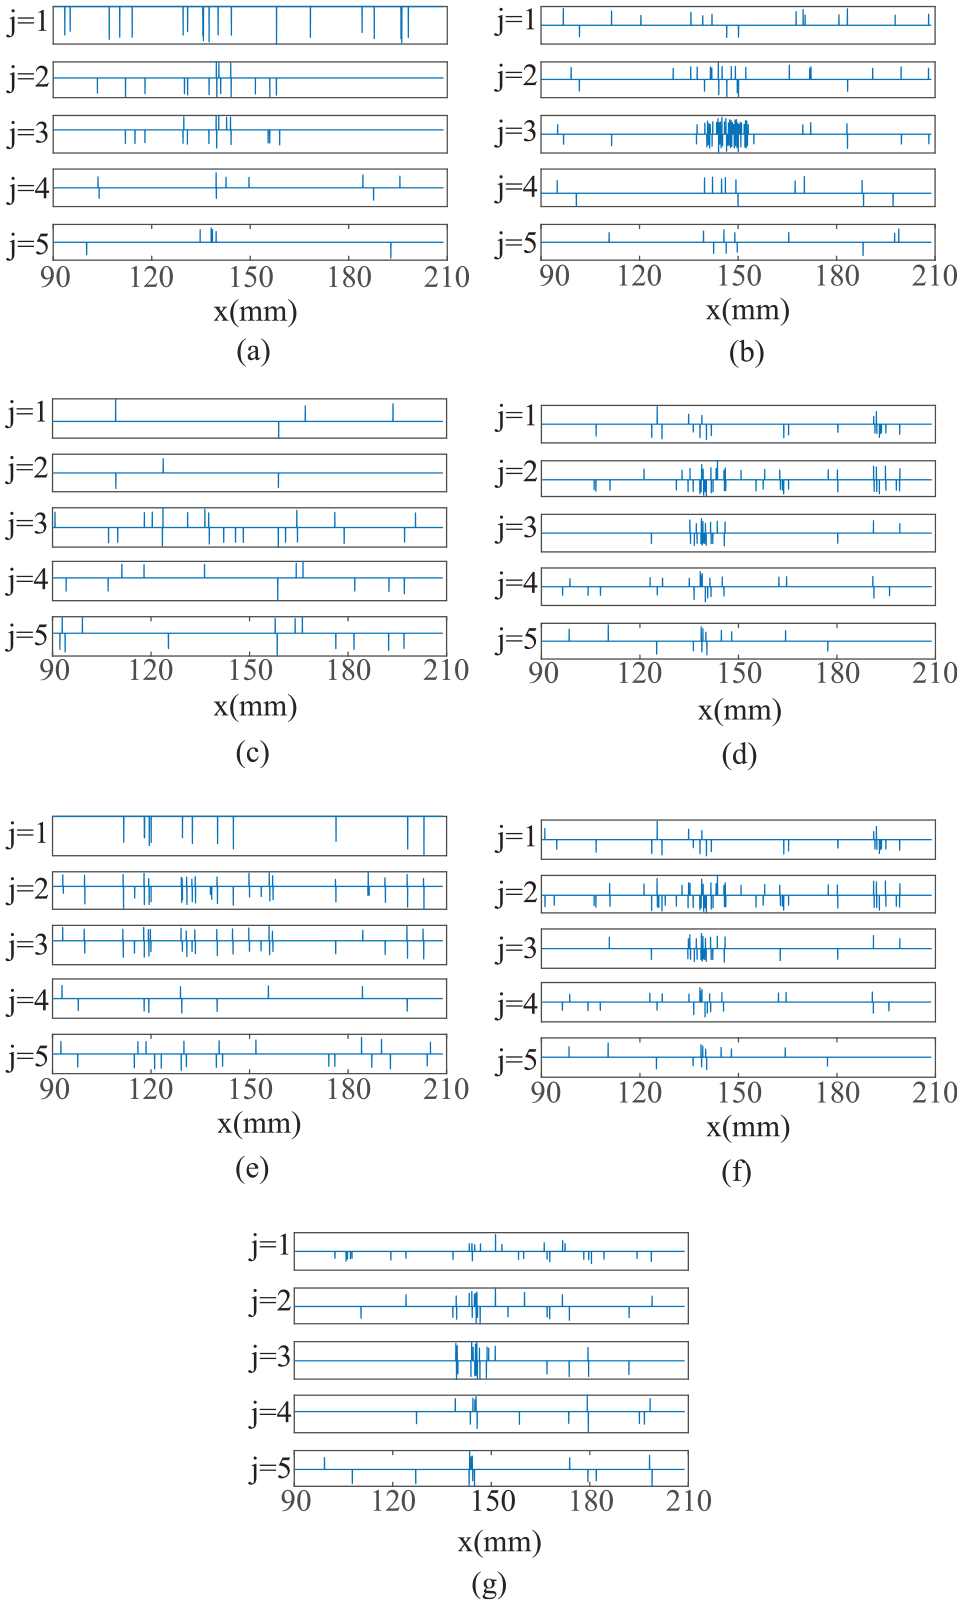
Distribution of wavelet modulus maxima (according to the screening results in Figure 12, the suspicious signals are decomposed by wavelet): (a) No.55, (b) No.76, (c) No.77,(d) No.124, (e) No.133, (f) No.146, and (g) No.164.
As shown in Figure 14, compared with the data of magnetic anomaly signal, the proportion of the number of modulus maximum lines of false alarm data NO.77 and 133 decreases significantly with the reduction of search range, or itself is very small. Set the threshold value to 30%, and synthesize analysis results in different directions. Finally, it can be determined that the data of NO.55, 76, 124, 146, and 164 contain magnetic anomaly information, while NO.77 and 133 are obviously false alarms. At the same time, according to the centralized position of modulus maximum line, it can be determined that the position of short circuit fault is 129–157 mm, the deviation from the position (141 mm) of short circuit fault is within two coggings.
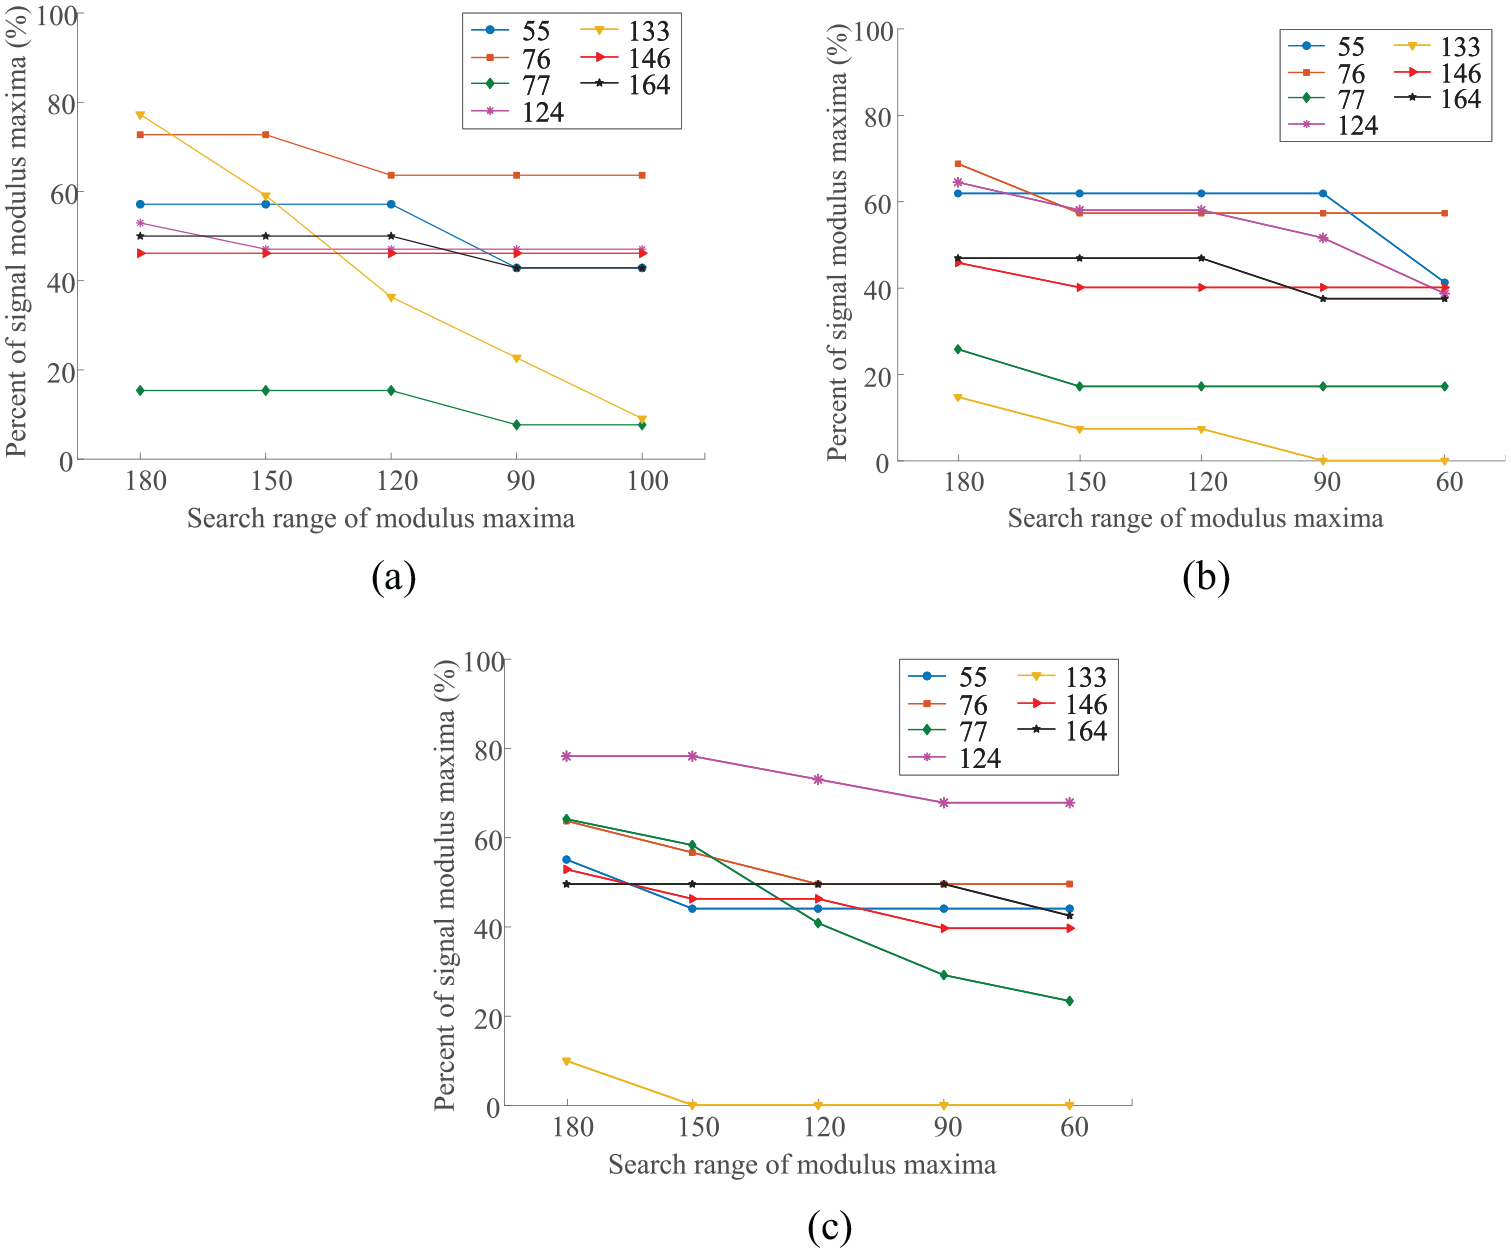
Relationship between the number of wavelet modulus maxima lines and search range: (a) Ax, (b) Ay, and (c) Az.
Experimental conclusion: the reinspection method based on wavelet modulus maxima can further accurately distinguish suspicious data, improve detection accuracy and reduce false alarm. Combining with preliminary screening, it can realize fast and accurate detection of massive data.
Comparative experiment of phase comparison method: Literature 23 proposed a magnetic field phase comparison method. The method is based on sinusoidal periodic distribution of LMTW, calculates the phase by anti-sine, and detects the fault according to the change of signal phase. The principle is shown in Figure 15, The red part is the fault points.
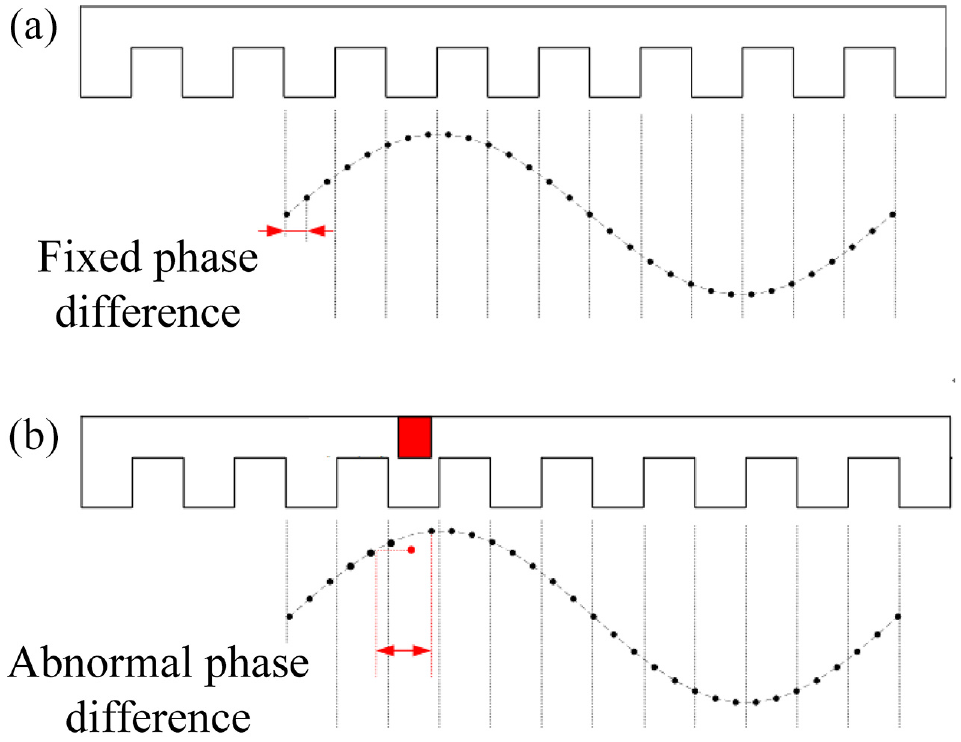
Schematic diagram of phase comparison method using in-line magnetic sensing array: (a) normal condition and(b) abnormal condition.
Using a in-line array composed of 8 Hall magnetic sensors, 200 groups of magnetic field data required by the phase comparison method are obtained on the experimental platform shown in Figure 11. In the same way, the magnetic field data collected in the damage area are inserted in NO.55, 76, 124, 146, and 164. In simultaneous interpreting, the output value of different sensors is sinusoidal trend change. Sine fitting of each group is made. Calculate the deviation phase and standard phase according to the fitting result. The absolute value of the max phase deviation is shown in Figure 16. Because the phase comparison method only focuses on the relative amplitude change between sensors, the normalization operation is carried out before sine fitting.
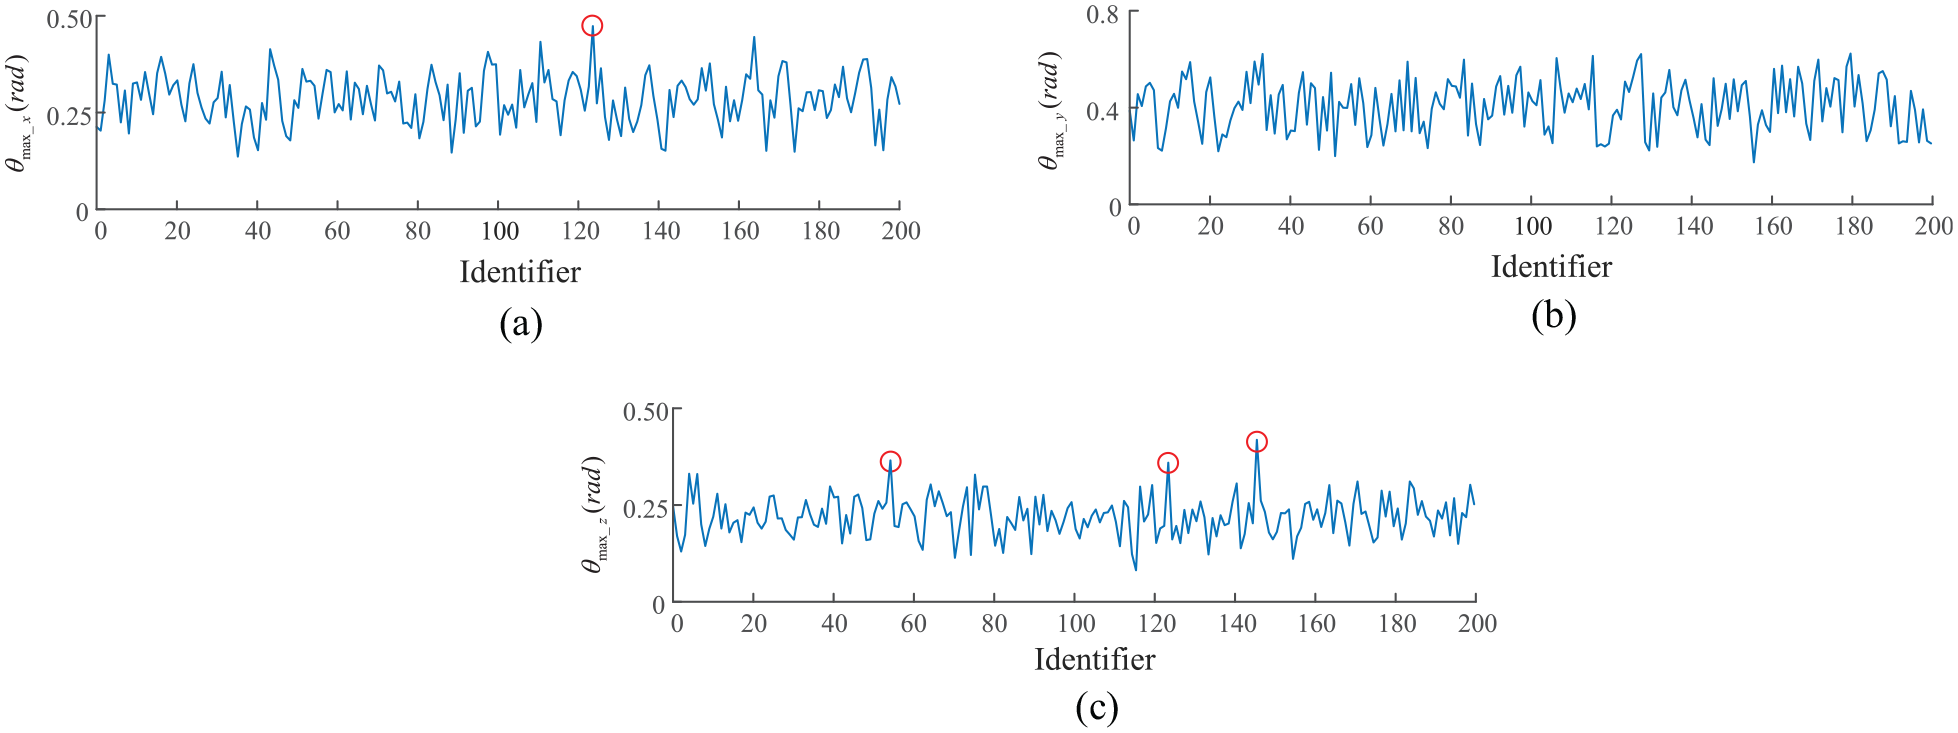
Results of phase comparison method: (a) detection results of x, (b) detection results of y, and (c) detection results of z.
As shown in Figure 16, phase deviation caused by damage of iron core is only obvious in the
Conclusions
Aiming at fast selection of a few anomaly targets in massive data, using the similarity of LMTW, suspicious data is identified through multifractal spectrum characteristics. Using BWT to signal singularity, suspicious data is accurately detected by distribution of wavelet modulus maxima at different scales. The proposed method can adapt to 8–12 mm detection distances, and Its hit rate can be improved by more than 66%. During implementation, three points should be paid attention to:
The spectral parameters should be calibrated with massive data, which determines the hit rate of preliminary screening; Its limitation is that the parameters need to be calibrated according to the actual samples and can’t be directly applied.
The CFAR is inversely proportional to the detection efficiency of the preliminary screening, and the false alarm should be controlled within 20%.
The analysis method based on the similarity of magnetic field waveform can also be applied to the field of large motor fault detection, pipeline detection or geomagnetic anomaly detection.
Footnotes
Declaration of conflicting interests
The author(s) declared no potential conflicts of interest with respect to the research, authorship, and/or publication of this article.
Funding
The author(s) disclosed receipt of the following financial support for the research, authorship, and/or publication of this article: This subject is derived from the key technology research of high speed maglev transportation system in the National Key Research and Development Plan of the 13th Five-Year Plan (2016 YFB1200602-40).