
Abstract
In the process of prediction and health management (PHM) about remaining useful life (RUL) of aero-engine, the state evaluation of aero-engine by constructing health index (HI) plays a very important role. At present, in the research of aero-engine state evaluation, there are still many problems: the analysis of the impact between operating conditions and sensor measurement data is insufficient, the standard for sensor data sequence selection is not established, and the HI construction is not reasonable. Aiming at these problems, firstly, a data reconstruction method is used to standardize the sensor data sequences, so as to eliminate the coupling effect between operating conditions and sensor measurement data. Secondly, different from the screening of sensor data sequences by observing the trend manually, a monotonicity standard is proposed. Then, a HI calculation method based on weighted Hellinger distance is proposed, which can construct HI more reasonably and better characterize the health condition of aero-engine. Finally, based on the standard data set of aero-engine degradation process provided by NASA in 2008, a typical HI construction method based on linear regression mapping and a similarity-based RUL prediction method are selected for comparison to verify performance of this method. The results show that the proposed method has better evaluation performance, and the HI constructed by this method is also better in RUL prediction.
Introduction
Aero-engine is the main core equipment supporting the normal operation of aircraft. Its reliability, maintainability, safety, supportability and testability (RMSST) have attracted much attention. 1 To improve aero-engine performance and reduce maintenance cost, prediction and health management (PHM) technology plays an important role. It is the core and key of PHM technology that PHM for the remaining useful life (RUL) of the aero-engine and guiding the aero-engine maintenance and management, through the data collected by various sensors. The RUL prediction method predicts the running time of the equipment from the current time to the failure time by analyzing the historical performance degradation trend and real-time state data of the equipment. 2 Among them, the state evaluation of building health index (HI) based on equipment degradation data and setting the failure threshold according to experience is the prerequisite process for predicting the RUL, and it is also one of the most important contents in PHM technology. Therefore, an appropriate state evaluation method for calculating HI is of great significance to the daily maintenance and management of aero-engines.
State evaluation judges the health state of the system through effective evaluation methods and complete operation data, to understand its health state in real-time. Generally speaking, state evaluation methods can be divided into three categories: model-based methods, data-driven methods and hybrid methods. 3 For a complex electromechanical hydromagnetic coupling system such as an aero-engine, there are many performance parameters, so it is difficult to establish an accurate physical model. The data-driven method only pay attention to the data and learn from the data to evaluate the health state of the system. At present, most of the research on aero-engine state evaluation focus on data-driven methods.
Data-driven methods can be divided into univariate methods 4 and multivariate methods 5 according to the number of degenerate variables used. In the case of univariate, the output parameters of degenerate models (such as the Wiener model6–11 and inverse Gaussian model12–17) are directly used as HI. These methods only use a single parameter to calculate HI, which cannot objectively reflect the overall health state of the aero-engine and have certain disadvantages. However, in the case of multivariable, a comprehensive HI reflecting the overall health state of the aero-engine is constructed by using the multivariable data after reasonable screening. Although the multivariable data-driven method of state evaluation is still in the development stage, there have been many research results.
In literature, 18 after multiple variables are selected by the relief algorithm, HI is constructed based on principal component analysis. In literature, 19 HI is established by clustering and fusing multiple parameters and used for similarity RUL prediction based on the correlation vector machine modeling method. In literature, 20 a variety of sensor data are used to calculate the comprehensive HI, and a general HI system is established according to the comprehensive HI. In literature, 21 a new data fusion method is proposed to establish a one-dimensional HI by automatically selecting and combining multiple sensor signals to better describe the degradation performance. In literature, 22 a new signal-to-noise ratio (SNR) index is proposed, which can be adjusted according to the needs of degraded signals. Then, based on the new signal quality measure, a data level fusion model is established to construct HI by fusing multiple sensor data based on degradation. Experiments show that the HI can well describe the health status of the aero-engine, and the performance is improved when it is used to predict RUL.
Although the HI constructed by the above methods can well reflect the health state of aero-engine to a certain extent, there are still some deficiencies. First, the interaction between various working conditions and sensor data is not considered. Second, when screening useful sensor data, it is generally through manual selection, and there is no screening standard. Third, when calculating HI, the linear model is directly used to map the sensor data and HI, without considering the different weight of the degradation characteristics represented by the sensor data. Based on the above problems, the main contributions of this paper can be summarized as follows:
A data reconstruction method based on the standard core state is adopted, 23 which can eliminate the influence of working conditions when standardizing sensor data.
When screening useful sensor data, the overall monotonicity of each sensor data sequence is calculated. Then the sensor data sequences with obvious degradation trends are selected according to the monotonicity, which can better reflect the health state of aero-engine and reduce computational complexity.
A HI calculation method based on weighted Hellinger distance is proposed, which can solve the problem of simple linear mapping between sensor data and HI in the above method. Meanwhile, it also considers the different contribution of each sensor data sequence to the characterization of degradation trend.
The main contents of this paper are as follows: Section I is the introduction, which details the research significance and current situation of aero-engine state evaluation, as well as the structural arrangement of this paper. In Section II, the data reconstruction method based on the standard core state is used to denoise and standardize the data. In Section III, a state evaluation method based on weighted Hellinger distance is proposed, and the HI is calculated by using the sensor data sequence screened according to the overall monotonicity. In Section IV, the aero-engine data set provided by NASA is used for verification. In Section V, the work content and results of this paper are summarized, and the next work direction is put forward.
Data reconstruction based on standard core state
In the process of aero-engine operation, different operating states will cause the degradation trend of the sensor data sequence is not obvious, which will have a certain impact on the screening of sensor data sequence. Therefore, two problems must be solved before HI calculation: one is to solve the problem of sensor data difference caused by multiple operating conditions, the second is to select the characteristic parameters that can fully reflect the degradation performance of the system. For the first problem, this section adopts the data reconstruction method based on the standard core state to establish a data reconstruction mode process, which can be applied to single working conditions and multi-working conditions.
Data denoising
The working environment of the engine is very complex, and it is easy to produce errors in data acquisition and transmission. In particular, the data measured by the sensor generally contain some noise. Therefore, to ensure the effectiveness of the experiment, the collected initial data of the sensor should be denoised in advance. The wavelet analysis method is a commonly used denoising method in engineering. Wavelet transform can be considered as a mathematical tool that converts a signal in time domain into a different domain.
A wavelet function, which is a small wave, possesses oscillating wavelike characteristics and concentrates its energy short in time, is needed to implement the wavelet transform. Its main process is: decomposing the noisy signal into various scales after wavelet transform, removing the wavelet coefficients belonging to noise, retaining and enhancing the wavelet coefficients of the signal, and then recovering through wavelet transform to achieve the purpose of denoising. The wavelet transform of a signal
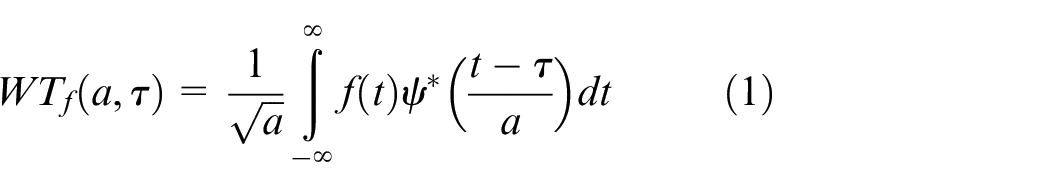
where,
In this paper, Daubechies wavelet function is selected, and there is no analytical expression for this series of wavelet functions. At the same time, the wavelet soft threshold denoising method based on extreme value threshold estimation is selected. The extreme value threshold estimation formula is as follows. 25
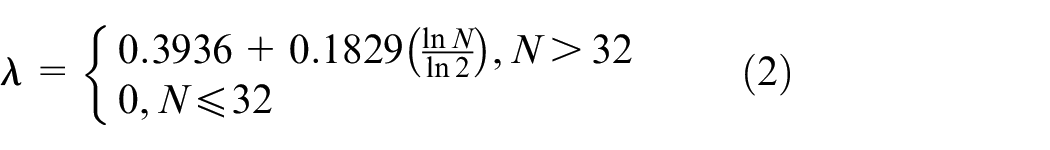
where,
All sensor data are denoised by the above denoising method. Figure 1 shows the comparison of data measured by the sensor #8 of aero-engine #16 before and after denoising. The black curve is the original data, the red curve is the result of denoising by wavelet analysis, and the blue curve is the result of the typical smoothing denoising method.
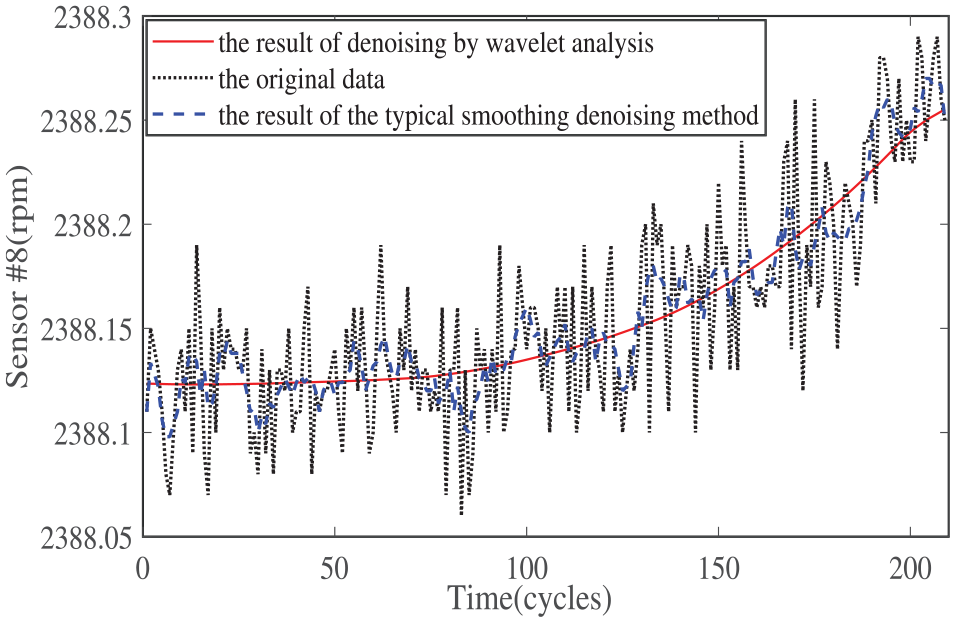
Denoising result of the Sensor #8 in the aero-engine #16.
Figure 1 shows that compared with the typical smoothing denoising method, the denoising processing using the wavelet analysis method has a better smoothing effect. Therefore, before calculating the HI, the wavelet analysis method is used to denoise all the original sensor data in this paper.
Data standardization
Aero-engine data is composed of conditional operating values and sensor measurement data. Different operating conditions make the aero-engine in different operating states, which will cause great differences in the data measured by the same sensor. In order to solve such problems, the data reconstruction method based on the standard core state is adopted to establish a set of data standardization mode process suitable for single working condition and multi-working conditions.
It is assumed that the degradation data of the historical aero-engine go through
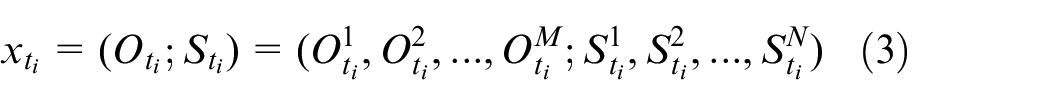
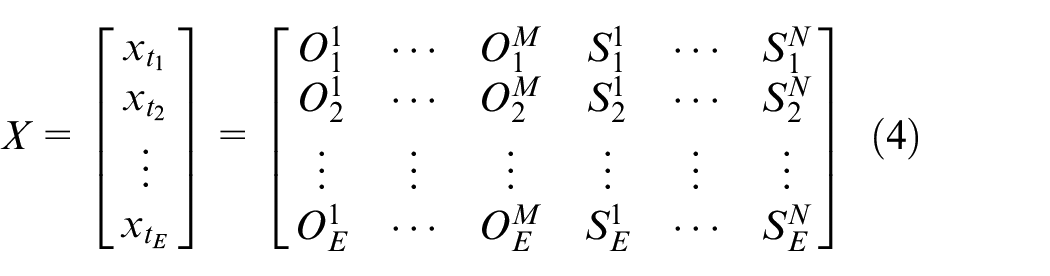
In the original aero-engine data set
where,
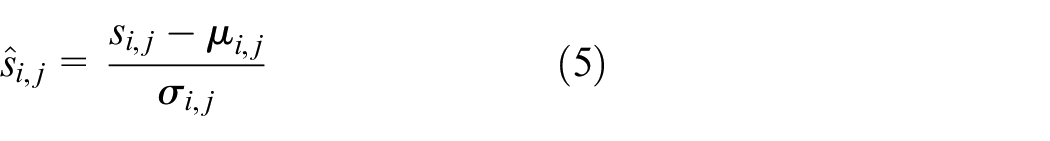
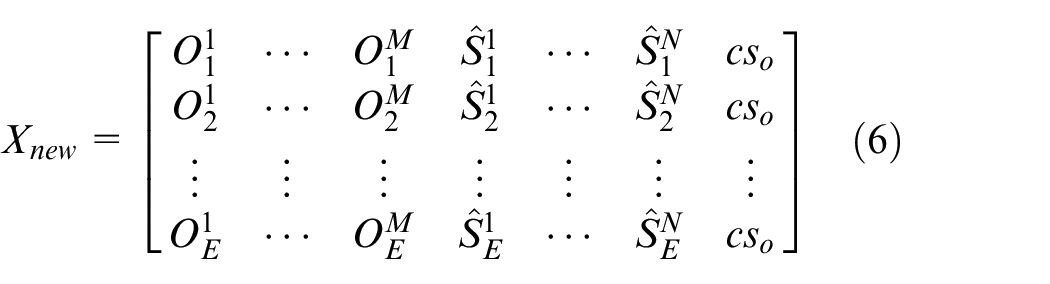
Through the above process, the feature set
where,
HI calculation based on weighted Hellinger distance
Sensor data sequence selection
In the new feature set
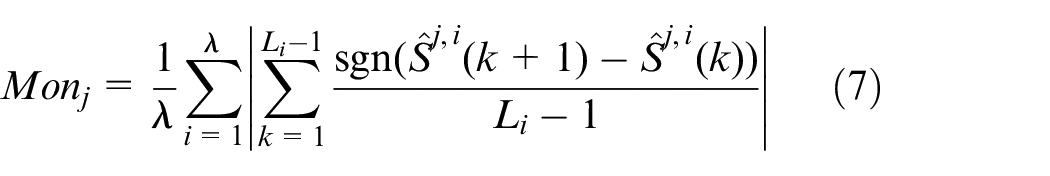
where,
According to the monotonicity of all sensor data sequences, the sensor data sequences are divided into two categories by K-means, and the sensor data sequences with greater monotonicity are selected. The screened sensor data sequences are:

At this time, the sensor data sequences obtained after screening have a certain degradation trend.
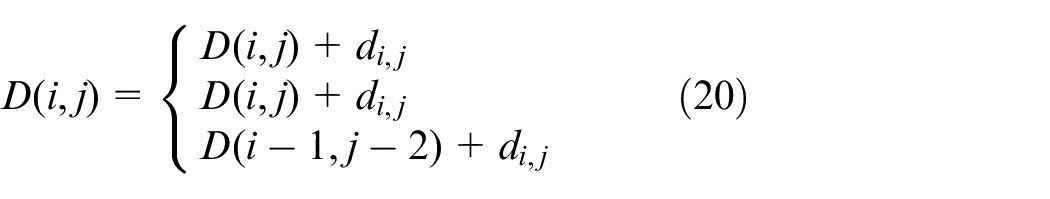
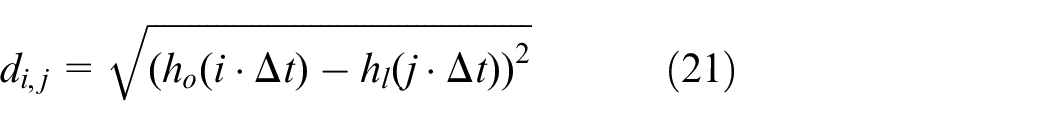
HI calculation
In probability and statistics, Hellinger distance is used to measure the similarity between two probability distributions. Assuming that there are probability distributions
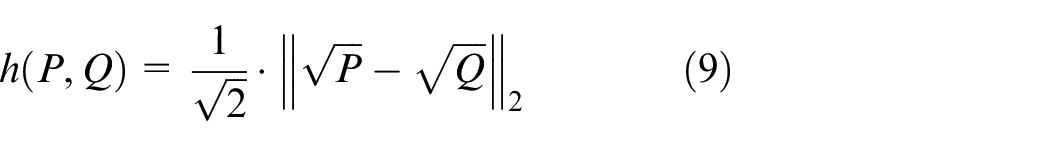
In this paper, Hellinger distance is used to calculate HI. For the screened sensor data sequences
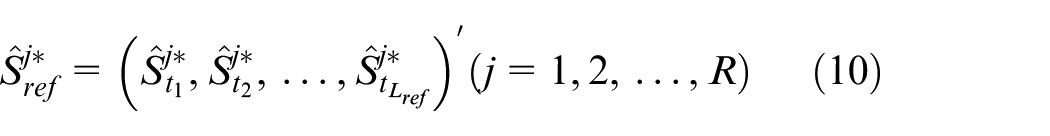
To calculate the similarity between a certain time and the initial time, a sequence with length
The Hellinger distance
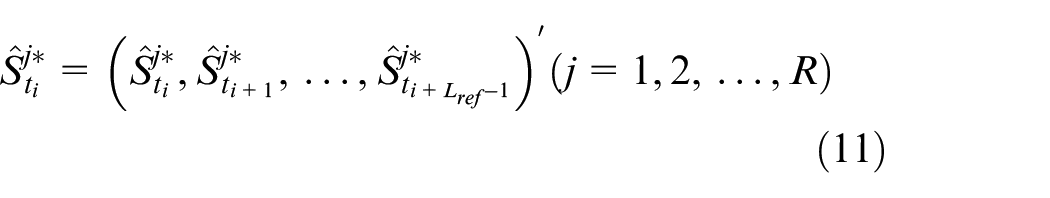
At this time, the reference sequences of each sensor characterize the sensor measurements when the aero-engine is in the initial normal operation state, that is, these reference sequences represent that the aero-engine is in a completely healthy state. Therefore, to obtain the aero-engine health state represented by the sensor data at subsequent times, the sequence at each time can be selected backwards with step 1 and length
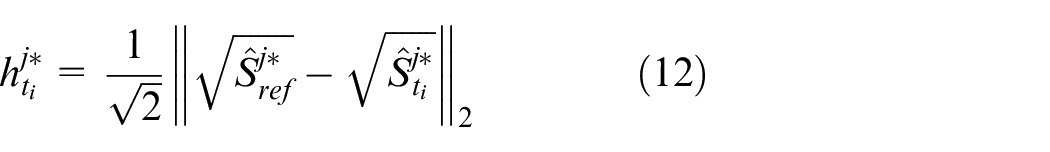
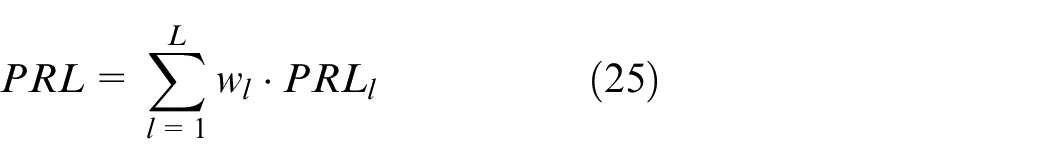
In addition, the data measured by each sensor represents the health degree of the engine at a certain time to a certain extent. Therefore, at each time, the Hellinger distances calculated by all sensors are weighted according to the equation (13) to obtain a weighted value, which is used as a health index
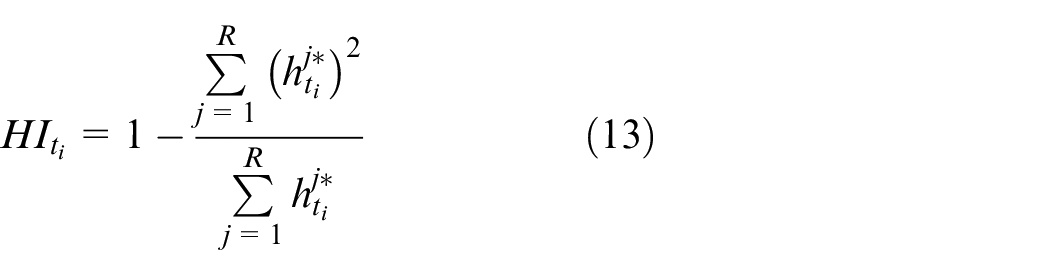
The equations (12) and (13) contain the core idea of the method based on the Hellinger distance for calculating HI.
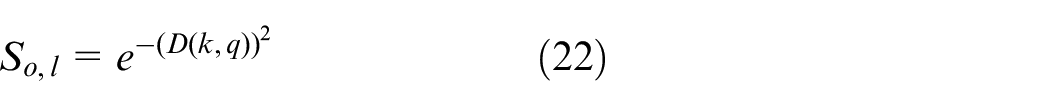
Evaluation index
In order to judge the state evaluation method, the overall fitting trend
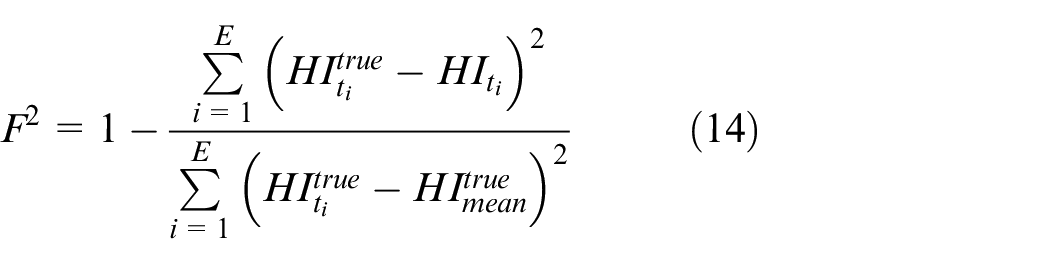
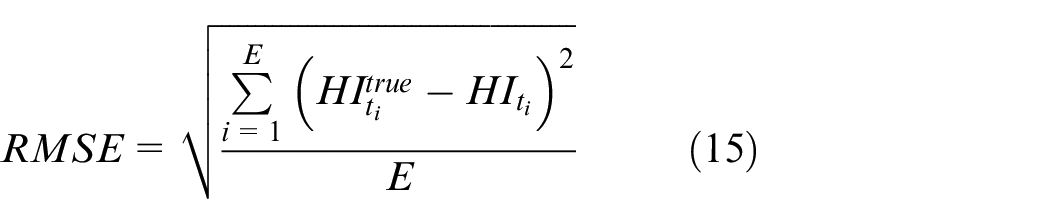
where,
Experimental verification
Data sources
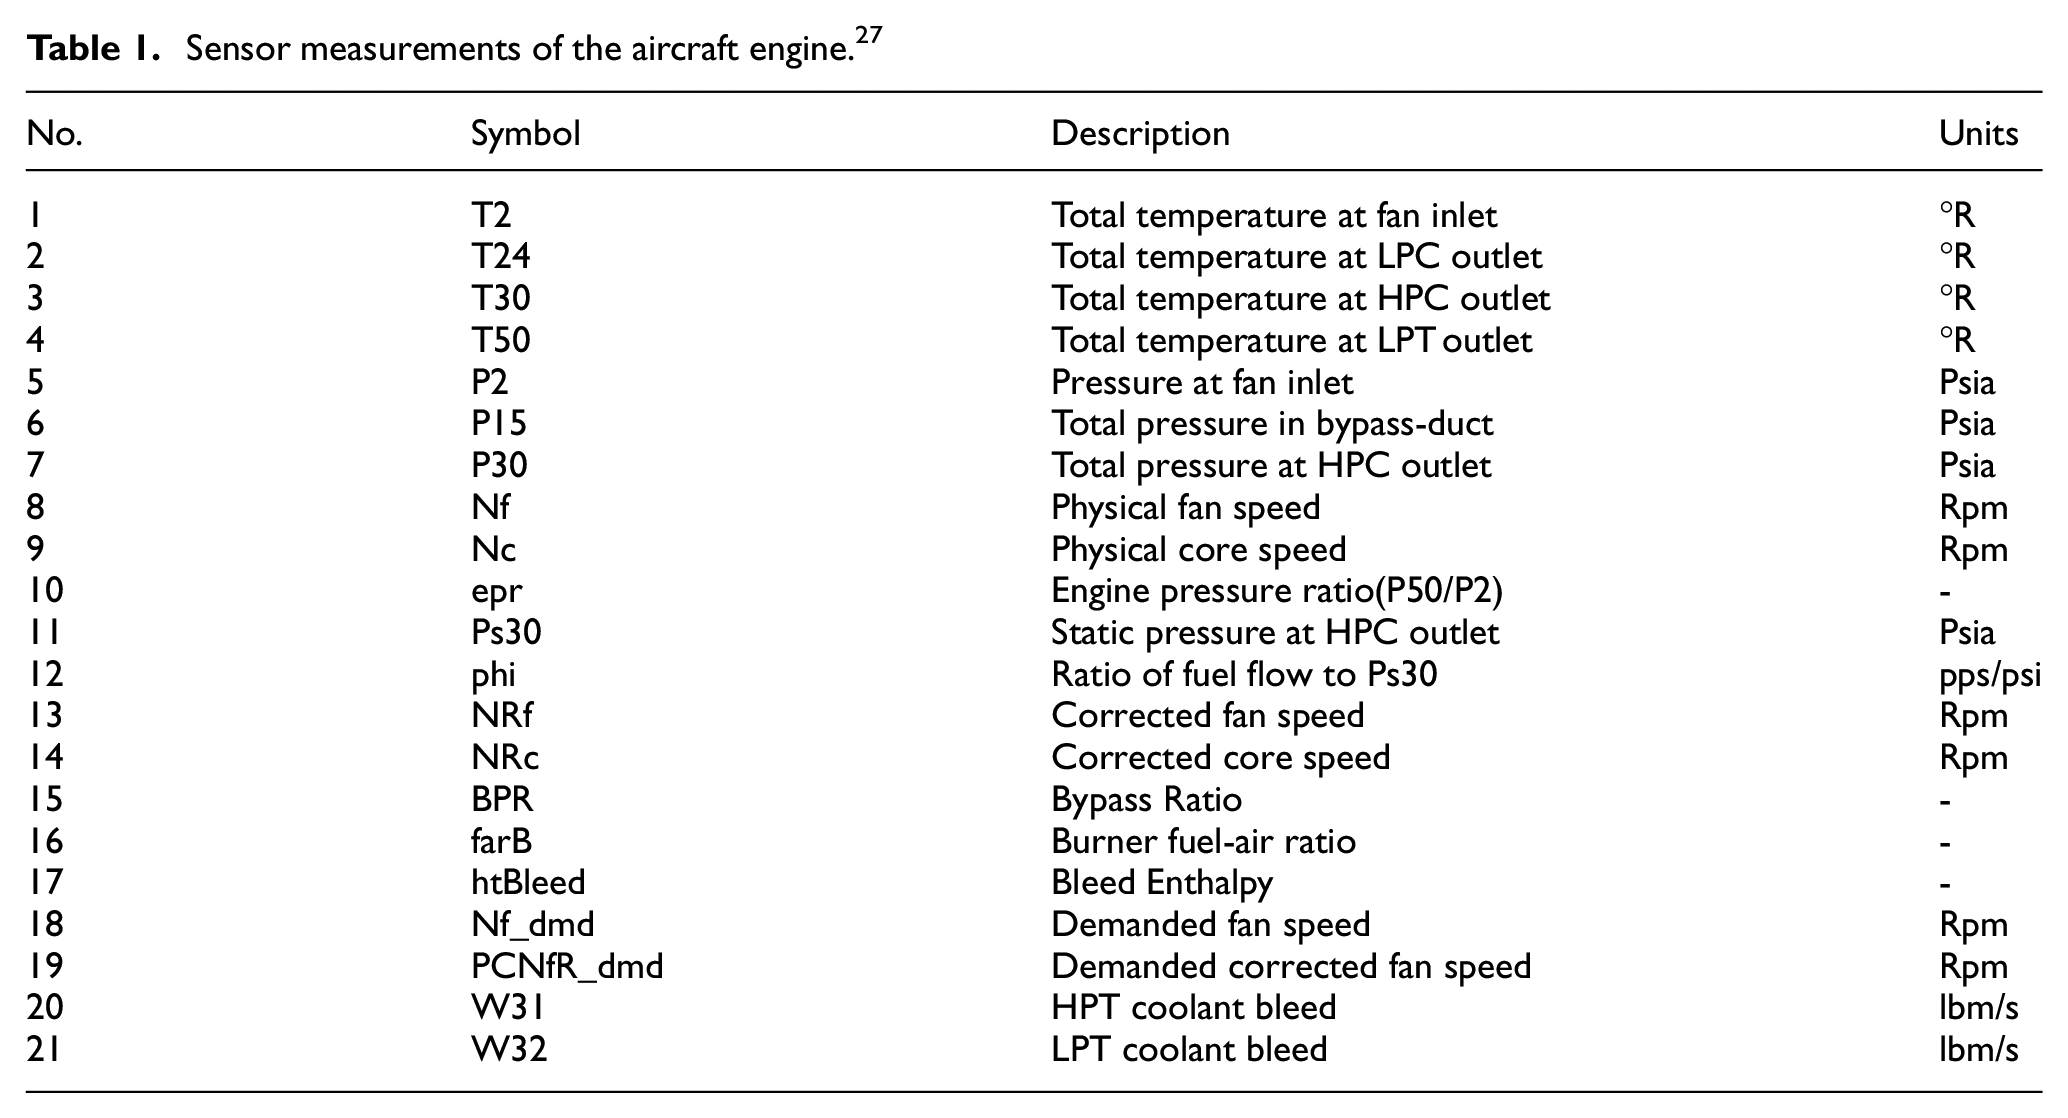
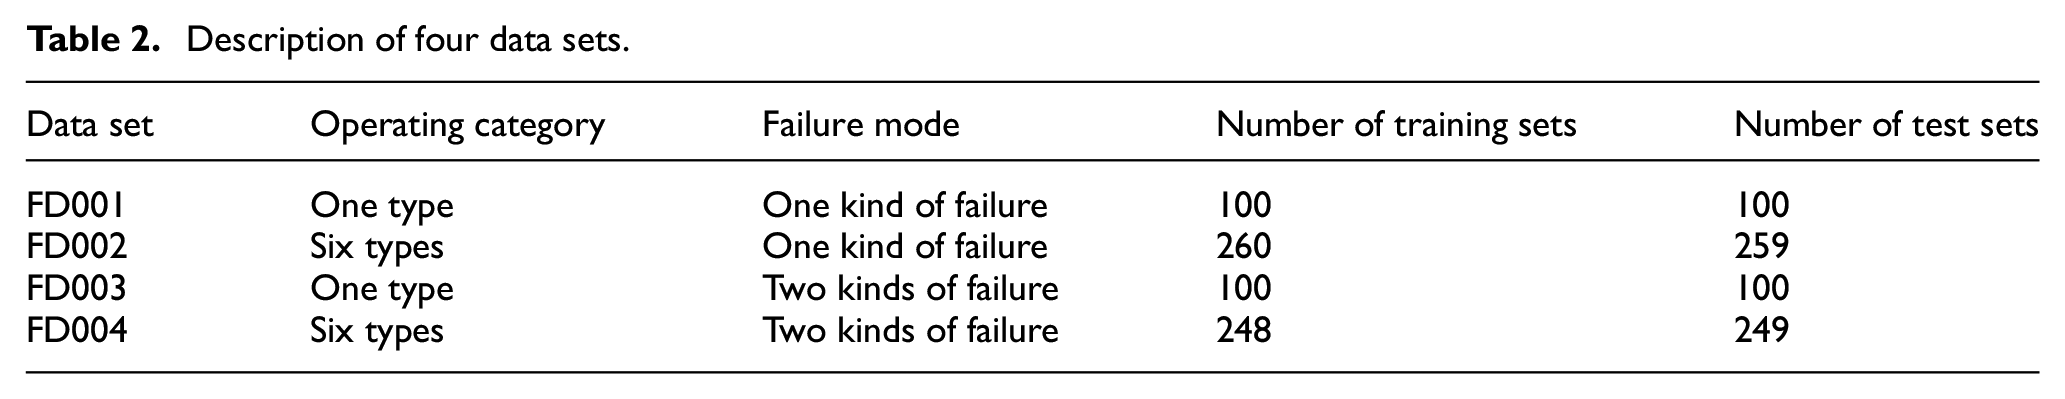
The data in this paper comes from the C-MAPSS aero-engine simulation model of NASA, 27 and the main components of the aero-engine are shown in Figure 2. This data set has been widely used in the field of aero-engine life prediction, and its scientificity and reliability have been fully affirmed in many pieces of literature. Literature28–30 have used this data set to complete the research of aero-engine RUL. The data set records the performance parameters of aero-engine in 24 dimensions of each flight cycle, including 3 operating condition variables and 21 sensor measurement variables (see Table 1). In each operation cycle, the aero-engine experiences the whole process from different normal states to failure, and 3 operating condition values and 21 sensor measurement values are recorded in the whole process. According to the simulated operating conditions, fault types and quantities, the data set is divided into four categories: FD001, FD002, FD003, and FD004, see Table 2 for details. Each data set is further divided into the training set and test set. At the same time, the real remaining life of the test set is given, which can be used to evaluate the performance of the prediction model. In this paper, the FD001 data set is used for experimental verification.
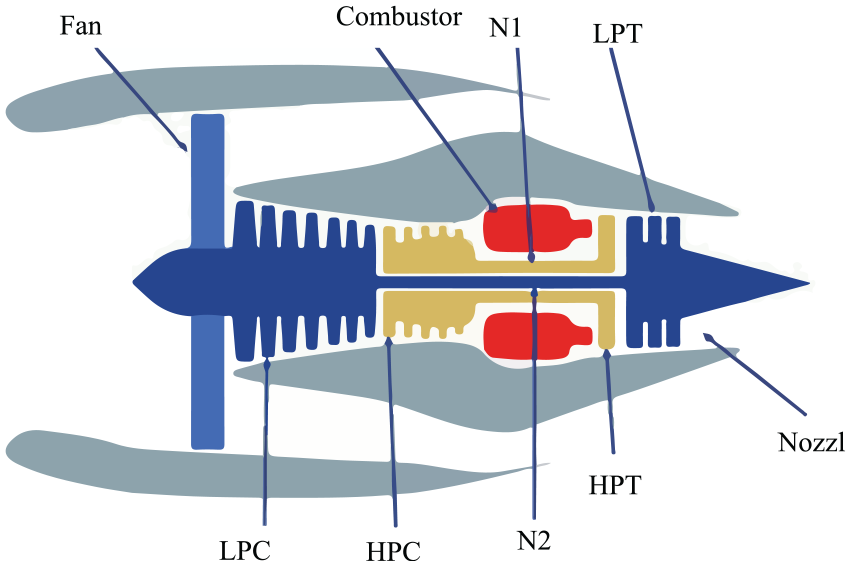
Simplified diagram of aero-engine simulated in C-MAPSS. 31
Sensor measurements of the aircraft engine. 27
Description of four data sets.
Experimental results and discussion
Data preprocessing and sensor data sequence choice
After obtaining aero-engine data, due to the noise interference during aero-engine operation and sensor measurement, it is generally necessary to denoise the original data in advance. According to the previous analysis, the wavelet analysis method is used to denoise the original aero-engine data. At the same time, the data is standardized through the equation (5) to eliminate the impact of different working conditions on the data. Figure 3 shows the original data sequences of sensors #7, #11, and #14 in aero-engines #20, #30, and #40. Figure 4 shows the corresponding sensor data sequences after denoising and standardization.
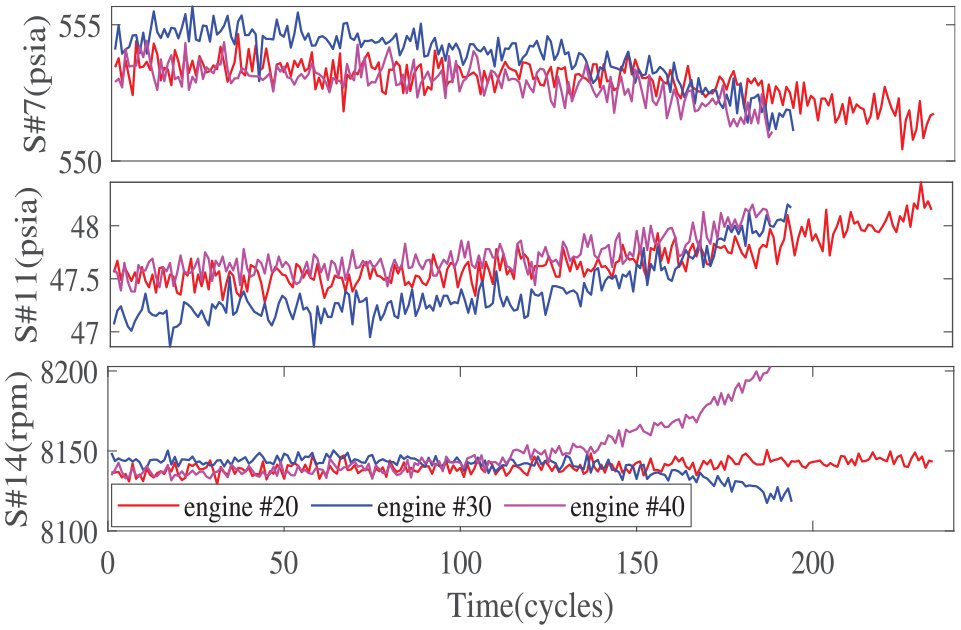
The original data of sensors #7, #11, and #14 in the aero-engine #20, #30, and #40.
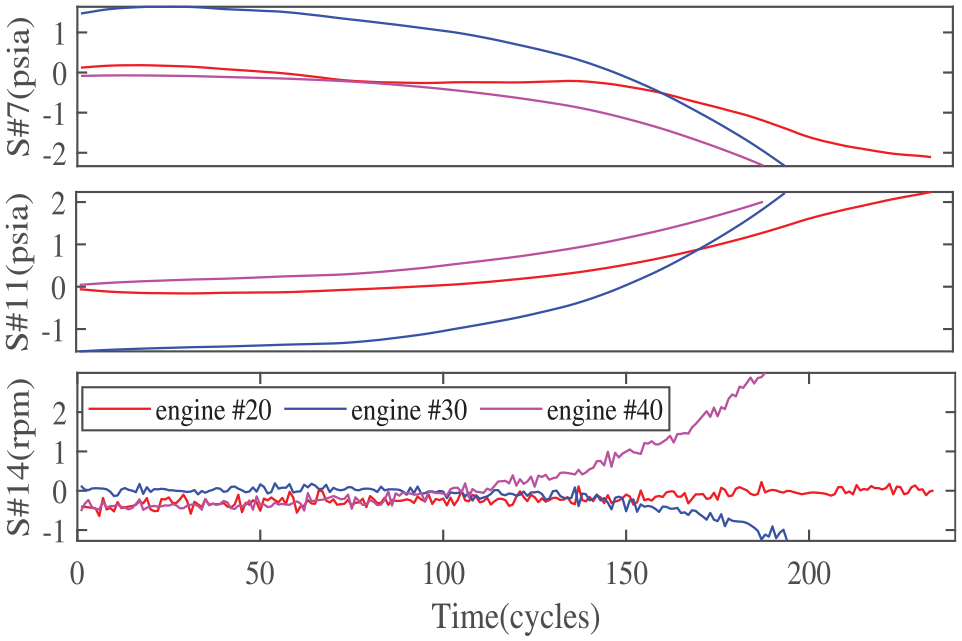
The results of sensors #7, #11, and #14 in the aero-engine #20, #30, and #40 after denoising.
These figures show that the original data fluctuates greatly, and the unit range of each sensor data sequence is inconsistent. After denoising and standardization, the sensor data sequences show an obvious smoothing trend, and the unit ranges are standardized to a certain range. Moreover, Figure 4 indicates that the monotonicity trend of most sensor data sequences is consistent in different groups, but there are also sensor data sequences with large differences in monotonicity trends in different groups, such as sensor #14. Therefore, it is very necessary to calculate the overall monotonicity of the sensor data sequences according to all groups of data and take it as the standard for screening.
For the standardized data, not every sensor data sequence has an obvious degradation trend. In order to decrease computational complexity, it is necessary to select the sensor data sequence with an obvious degradation trend. The overall monotonicity of 21 sensor data sequences are calculated by equation (7), and the calculation results are shown in Figure 5. On the basis of above, using the two-classification method, the sensor data sequences are divided into two categories according to the monotonicity, and the sensor data sequences with large monotonicity are selected as the calculation data of the comprehensive HI. Selected sensor data sequences:
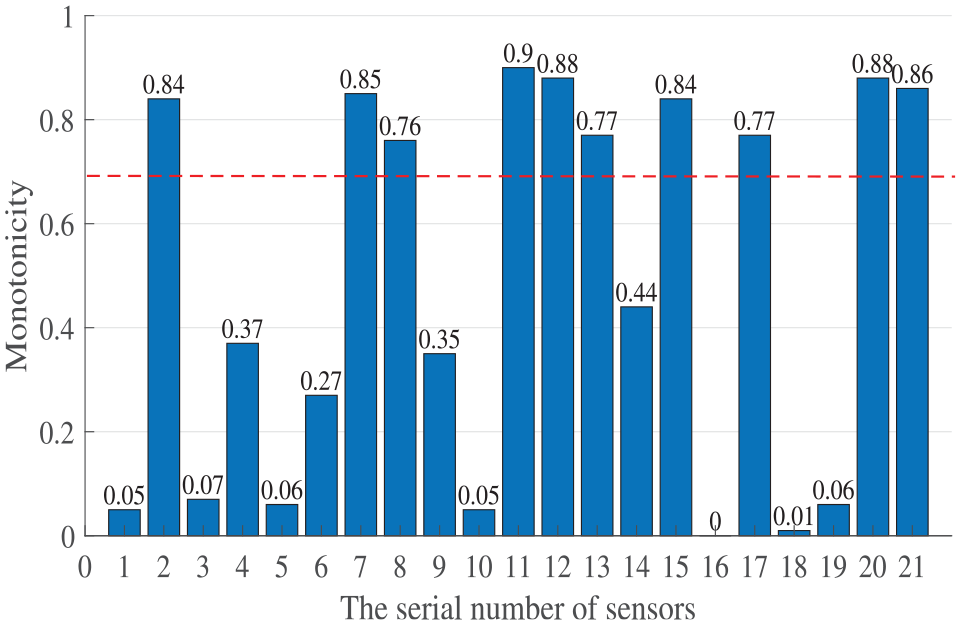
Overall monotonicity of all sensor data sequences.
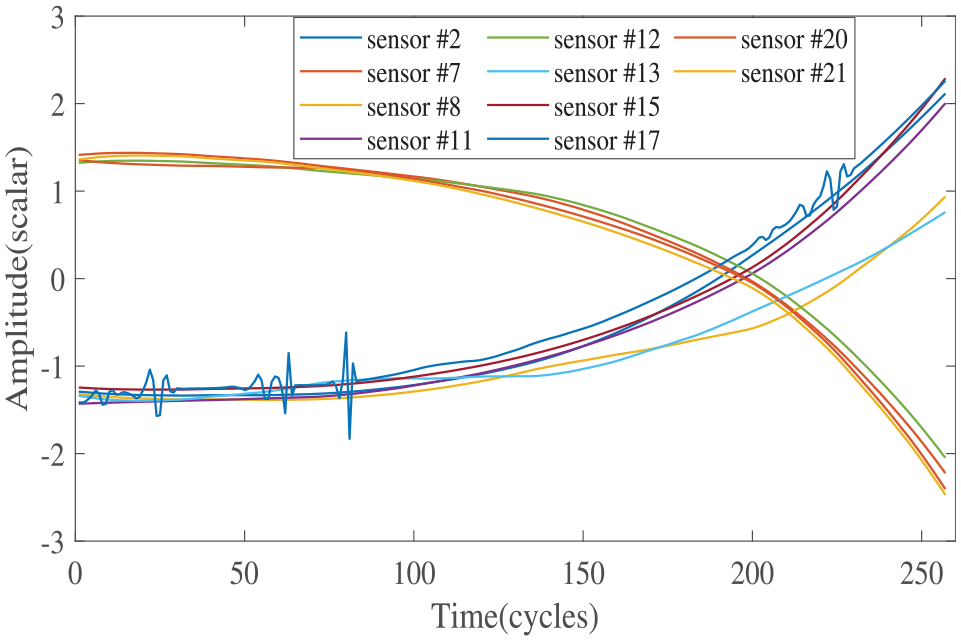
Sensor data sequences selected from the aero-engine #54.
Comprehensive HI calculation and evaluation
There is no real HI data in the aero-engine data set, but according to the existing literature, the general engine degradation trend is exponential degradation. Therefore, in this paper, it is assumed that HI at all initial times is 1, and it is exponentially degraded to failure time according to a certain degradation slope, that is, HI is 0. In this regard, the HI calculated according to the following equation (16) is used as the real HI in equations (14) and (15) to evaluate the HI calculation method based on the weighted Hellinger distance.

where,
At the same time, the method of directly fusing sensor data based on a linear regression model to calculate HI is selected as the comparison. 32 The expression of linear regression model is:
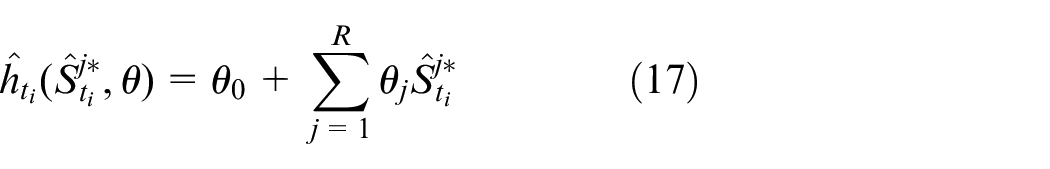
where,
Figure 7 is a comparison diagram of HI (red curve) estimated by the method proposed in this paper, HI (black curve) calculated by the method based on linear regression model and real HI (blue curve) calculated according to equation (16) for a group of aero-engine data. It can be seen that the HI calculated by the method proposed in this paper and the HI obtained by the method based on linear regression model can better fit the real HI curve, which verifies the feasibility of the method proposed in this paper. At the same time, we can find that the HI calculated by the method based on linear regression model at the last failure time of the aero-engine is not zero, indicating that the HI calculated by the method at this time does not well reflect that the aero-engine has degenerated to failure, but the method proposed in this paper has some improvement in this aspect.
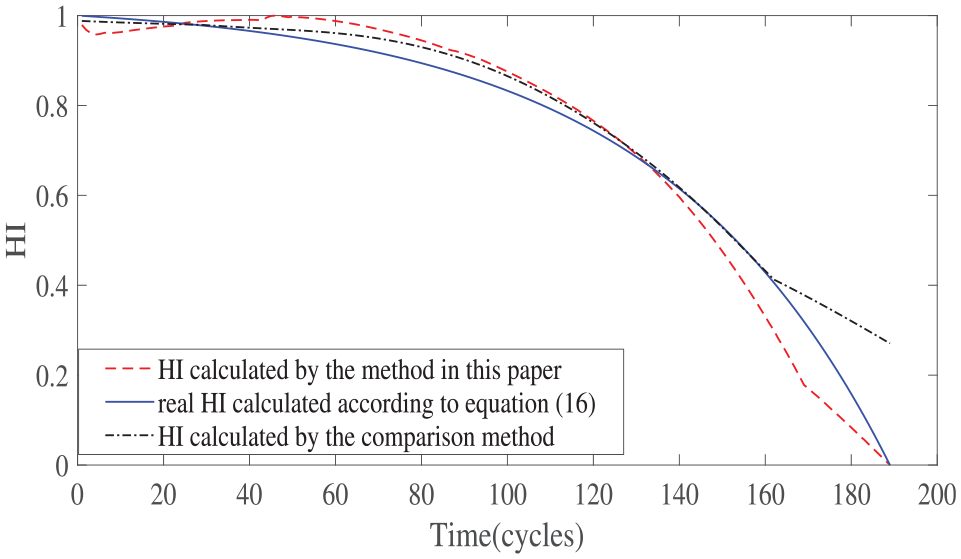
The HI curves are calculated with the data of aero-engine #4.
In addition, using all the training data of FD001, the HI is calculated by the method proposed in this paper and the method based on linear regression model respectively, then the overall fitting trend
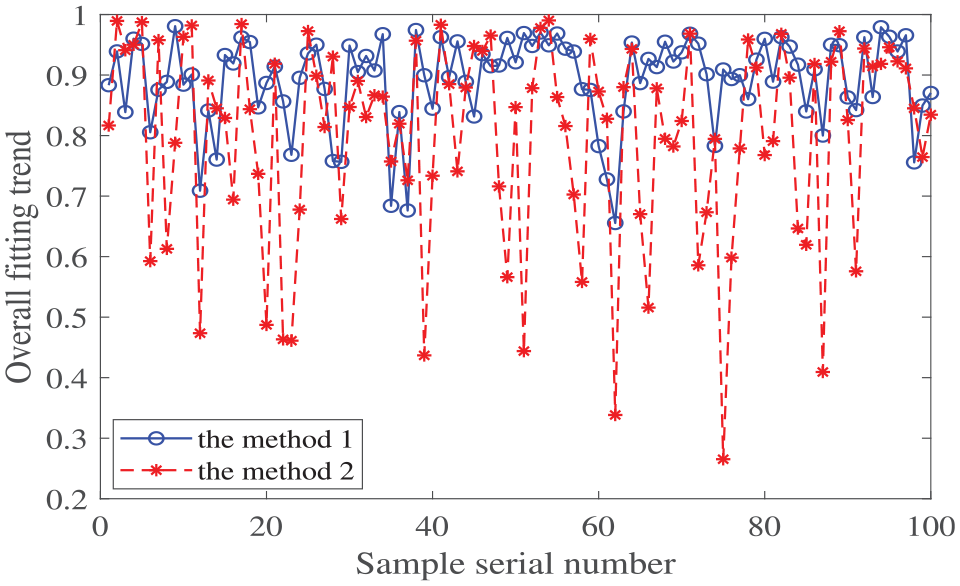
The overall fitting trend
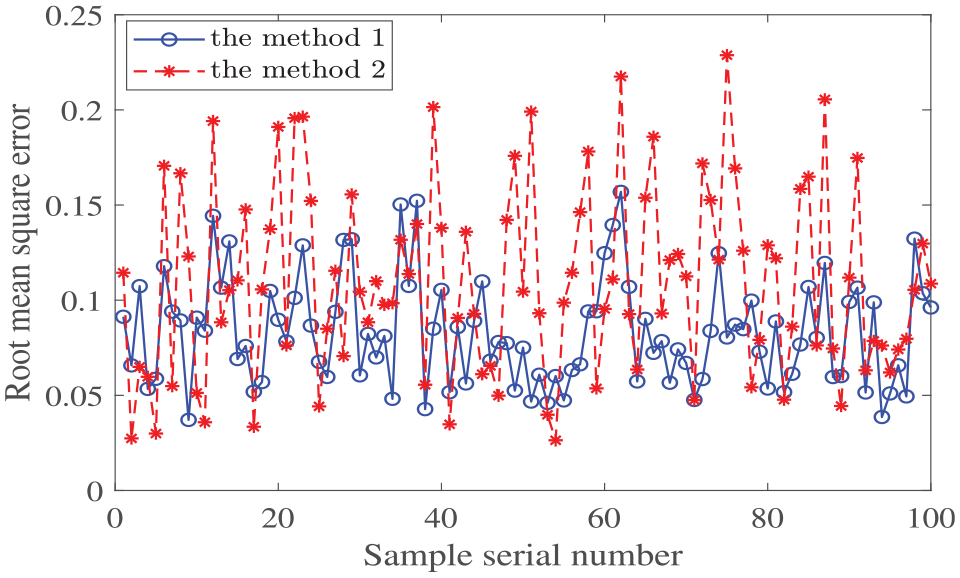
The root mean square error
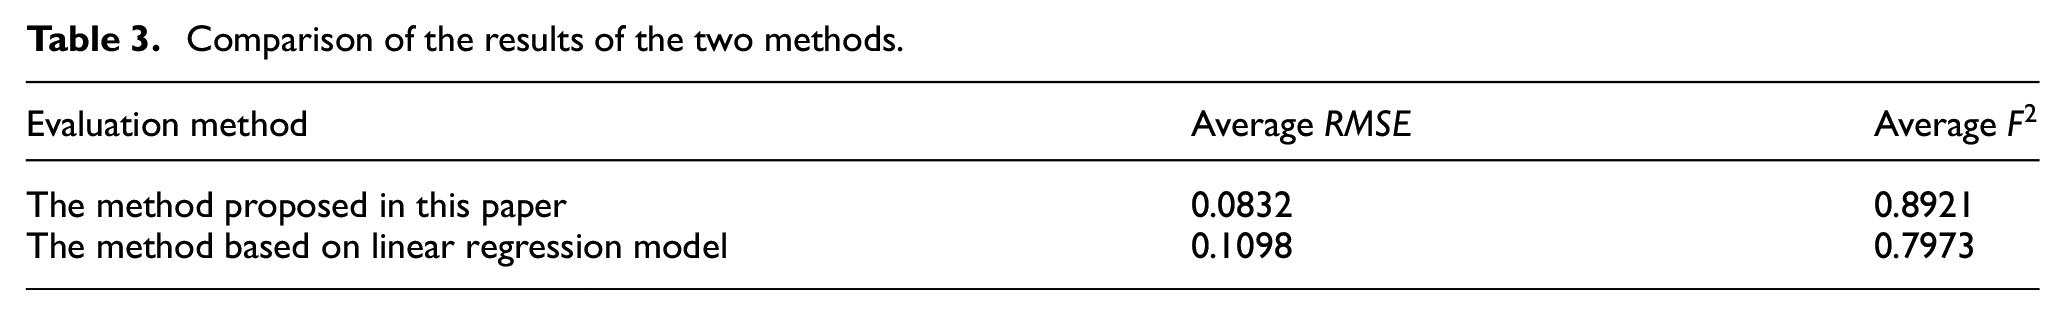
From Figures 8 and 9, in some groups of aero-engine data, the calculated HI is quite different from the real HI at some time, but the rule of overall degradation trend is similar for both HI. At the same time, as a comparison, the method based on linear regression model is used to calculate HI, and the evaluation indexes are shown in the Table 3. On the whole, the state evaluation performance of the method proposed in this paper is better.
Comparison of the results of the two methods.
Further analysis
From the previous experimental results and analysis, it can be seen that the HI calculation method based on weighted Hellinger distance proposed in this paper has good results, and the aero-engine degradation trend can be well fitted by the calculated HI. However, in the PHM of aero-engine, the construction of HI is generally for the purpose of RUL prediction. Therefore, in this section, the performance of HI calculated by the method proposed in this paper is further verified by a set of RUL prediction experiments. In order to test and compare the role of HI calculated by the two methods (the method proposed in this paper and the method based on linear regression model) in the process of RUL prediction, a similarity RUL prediction method based on dynamic time warping (DTW) distance 23 is selected for experiment, and its basic idea is shown in the Figure 10.
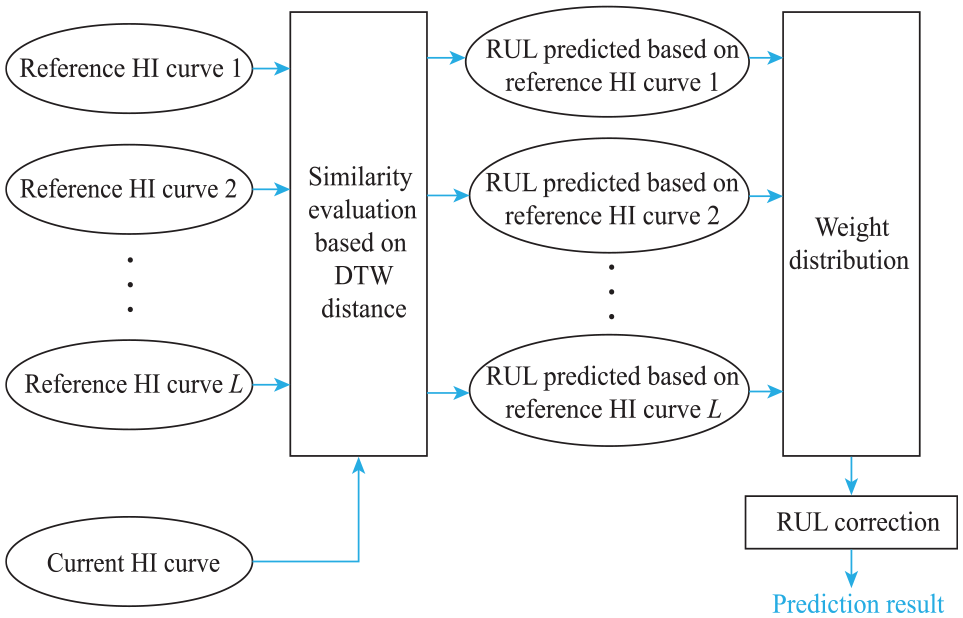
Flow chart of similarity RUL prediction based on DTW distance.
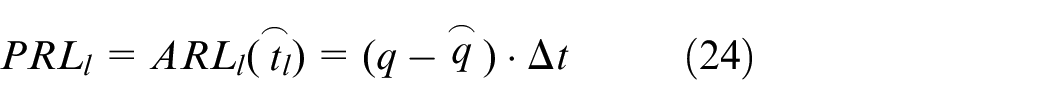
In the DTW-based life prediction, the similarity between the history sample and the test sample is calculated by DTW distance, and the RUL prediction of the test sample is further based on the actual RUL of the history sample. Assuming that the end moments of the test sample and the


where,
To calculate the similarity of two HI sequences, their shortest distance is firstly calculated using the DTW method. The shortest distance
where,
Then, the exponential function based on the DTW distance is chosen as the similarity function to calculate the similarity between the test sample and the
After calculating the similarity between the test sample and the

Therefore, the actual RUL
Finally, weights are calculated based on the similarity between each history sample and the test sample, and the RUL predicted by all history samples are weighted and summed to obtain the final RUL of the test sample.
where,
In the process of RUL prediction, the HI calculated by the two methods are used as the reference HI curves, and the test data set in FD001 is used for experiment of RUL prediction, then the prediction error is calculated. As shown in the Figure 11, the error curves of RUL prediction based on two calculation methods of HI are shown, in which the method #1 refers to using the method proposed in this paper to calculate HI for RUL prediction, and method #2 refers to using the method based on linear regression model to calculate HI for RUL prediction.
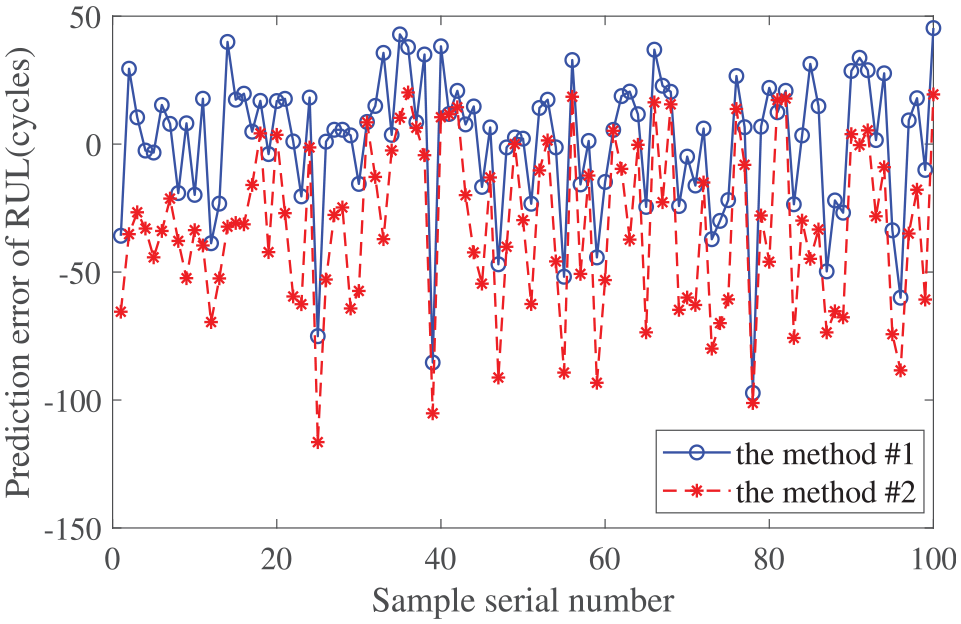
RUL prediction errors of two methods for calculating HI.
In the Figure 11, the maximum error of the method #1 is −97.2337, the minimum error is 0.9597, and the average value is 0.5357; the maximum error of the method #2 is −116.4621, the minimum error is 0.2828, and the average value is −32.8302. By further calculating the root mean square error of the predicted results, it is obtained that the root mean square error of the method #1 is 27.6250 and the root mean square error of the method #2 is 46.3806.
Figure 11 shows that in the similarity RUL prediction process based on DTW distance, the overall effect of RUL prediction obtained by using the HI calculated by the method proposed in this paper is better than that obtained by using the HI calculated by the method based on linear regression model. However, when the HI calculated by the method proposed in this paper is used in the RUL prediction based on DTW distance similarity, there are some cases with large prediction errors of test samples. A possible explanation for this is that in the process of calculating the HI of historical samples, there are cases where the
In addition, through the previous analysis, compared with the method based on linear regression model, the method proposed in this paper improves accuracy in failure prediction to a certain extent. Due to the sensor data screening according to monotonicity, this method also reduces the computational complexity and the cost of condition monitoring. Moreover, considering the influence of different working conditions on sensor data, data reconstruction based on standard core state is carried out to improve the applicability of the method to different working condition situations. And, the HI calculation method based on weighted Hellinger distance does not require the construction of various mapping models between sensor data and HI, which improves system reliability.
Conclusion
Aiming at the problem of aero-engine state evaluation, a HI calculation method based on weighted Hellinger distance is proposed in this paper. Firstly, wavelet analysis denoising and data reconstruction based on the standard core state are used to preprocess the original aero-engine data, so as to eliminate the influence of noise and conditional operation value on the sensor measurement data. Secondly, the overall monotonicity of the sensor data sequences are calculated, and the sensor data sequences with relatively obvious degradation trend are selected according to this standard. Then, the HI is calculated based on the weighted Hellinger distance, which can well evaluate the state of the aero-engine. Finally, the aero-engine simulation data set released by NASA in 2008 is used to verify the feasibility and excellent evaluation performance of the method proposed in this paper.
From the previous analysis, the method proposed in this paper can eliminate the influence of different working conditions on sensor data, and screening data according to monotonicity can reduce the computational complexity, then the HI calculated based on weighted Hellinger distance can better characterize the health state of aero-engine without considering various mapping relationships between sensor data and HI. Of course, there are shortcomings here. First, monotonicity is not the only kind of changing trend of sensor data, and other information should be further explored in order to more comprehensively characterize the health state of aero-engine. Second, the method based on the weighted Hellinger distance is affected by the calculating step and the state of aero-engine at the initial moment, which will also be investigated to improve the robustness of the method in the future.
Footnotes
Declaration of conflicting interests
The author(s) declared no potential conflicts of interest with respect to the research, authorship, and/or publication of this article.
Funding
The author(s) disclosed receipt of the following financial support for the research, authorship, and/or publication of this article: This work was supported by the National Key R&D Program of China Under Grant 2016YFB1200600.