
Abstract
Affected by many factors, the local wind environment on the bridge deck is complex and changeable, and it seriously threatens traffic safety. To accurately evaluate the wind field on the bridge deck, this paper develops a system to monitor the actual local wind environment and applies it to field measurement of the wind parameters at different positions of a complex truss girder bridge. The results show that the wind parameters on the bridge deck, including wind speed, gust factor, and turbulence intensity, are different from the bridge site due to the influence of the ancillary facilities. Also, the wind profile of the local wind field on the bridge deck is more in line with the polynomial distribution, which makes the equivalent height of the wind load much higher than the vehicle gravity. It should be noted that the measured power spectrum of the bridge deck is quite different from the wind spectrum applicable to the bridge site area, so it is not appropriate to use the wind spectrum of the bridge site area to carry out the analysis of the windmill bridge, and a more suitable wind spectrum for bridge deck wind field is proposed.
Keywords
Introduction
As one of the essential factors affecting driving safety, strong wind is easy to initiate vehicle overturning and rollover.1–3 Due to the limitation of longitudinal road gradient, the elevation of the bridge deck is generally high, and the wind speed of the bridge deck is further increased. Accordingly, the uncertainty of driving on the bridge increases,4,5 particularly obvious on bridges in complex mountainous areas in Western China. Thus, it is of great significance to ensure the safe driving of vehicles on the bridge, and enough attention should be paid to accurately evaluate the wind field on the bridge deck.
In recent years, the local wind environment of the bridge deck has been studied, and many outstanding contributions have been made mainly based on wind tunnel tests and CFD.2,6–9 For the problem of the driving environment of vehicles, many scholars studied the influence of different sheltering conditions interference on the aerodynamic characteristics of the vehicle.10–12 He et al. 13 investigated the change of aerodynamic coefficient of container trucks under different wind barriers via the wind tunnel test. The results show that the driving position and the lateral and longitudinal bridge arrangement of vehicles significantly influence the aerodynamic coefficient of vehicles, especially the lateral force coefficient. In addition, the wind barrier’s existence significantly reduces the vehicle’s lateral force coefficient, and the influence degree is related to the ventilation ratio and the height of the wind barrier. Thus, the effect of bridge towers on the aerodynamics of vehicles was studied by some researchers.6,13,14 Argentini et al. 15 study the cross-wind effects on a vehicle crossing the wake of a bridge pylon based on the wind tunnel tests. They found that the wind shielding near the tower makes a sudden change in the sign of lateral force and overturning moment. Wang and Xu 16 evaluated the safety of highway vehicles passing through the bridge tower under cross-winds based on a theoretical derivation. The results show that the bridge tower has a significant effect on the rolling and lateral motion of the vehicle when the vehicle passes through the bridge tower area under the strong cross-winds. Also, the driver needs to take temporary measures to keep the correct driving direction at a large steering angle under this condition. At the same time, the influence effect is related to the vehicle type and the vehicle’s location on the bridge deck. 17 Furthermore, it was established that the aerodynamic force acting on the vehicle was affected by the yaw angle. The wind tunnel test analyzed the aerodynamic sensitivity of heavy road vehicles under various conditions, and the influence of yaw angle on the aerodynamic force acting on the vehicle was determined.18,19 Although the numerical simulation and wind tunnel test are flexible, and the model and test can be adjusted as demand, it is still challenging to reflect the actual wind characteristics distribution and the relationship between the incoming flow and the local wind environment of the bridge deck. Therefore, limited understanding of wind characteristics of the bridge deck by the CFD and wind tunnel test makes it difficult to directly apply the current research findings.2,20,21
In addition, the research on the wind environment mainly by field measurement focused on the bridge site areas, but few on the local wind environment of the bridge deck. Therefore, exploring the wind environment of bridge decks can provide a reference for the design and construction of bridges and advice for vehicle driving safety in complex mountainous areas. 22 This paper, taking a long-span suspension bridge as the study object, carries out a field measurement study on the wind environment of the bridge deck to explore the more field wind characteristics of the bridge deck and the relationship between the wind and the incoming flow. The rest of the paper is divided into four parts: Section 2 introduces the measurement sites and the data sources, including the purpose of the instrument and the setting of the field measurement. Section 3 presents the methods used in this paper to analyze the wind data. Section 4 discusses the wind parameters affecting driving safety and explores the wind speed profile form of the bridge deck and the equivalent wind speed based on the principle of equivalence. Section 5 is the main conclusion of this paper.
Site description and measurement facilities
Measurement sites
This paper takes a long-span suspension bridge as the study object. As shown in Figure 1(a), the bridge is a single-span steel truss suspension bridge with a main span of 1100 m. The upper part of the bridge is monolithic, and the stiffening girder is a steel truss beam. The main truss is 27.0 m wide and 8.2 m high (see Figure 1(c)). The bridge site is a typical U-shaped deep gorge located in southwestern China, with the strong mountain on both sides, a steep cross slope of 30°–50°, and a width of more than 1500 m. Figure 1(b) shows the local topography at the bridge site, it can be seen from the figure that the average altitude of the ridge of the east side is 2 km. In addition, the mountains on both sides of the valley are covered with snow all year round. The bottom of the gorge is warm and dry, belonging to a typically dry, hot valley. The elevation difference between the peak and the bottom of the gorge is more than 3500 m. To ensure the connectivity of the road, the height difference between the design elevation of the bridge deck and the design water surface is 238vm. At the same time, the region is affected by the southeast and southwest monsoon and the cold air of the Qinghai-Tibet Plateau. The vertical climate difference is noticeable, the weather is complex and changeable, and the disastrous weather is frequent, which easily affects the bridge deck driving safety and is very suitable for the study object of the local wind environment of the bridge deck.
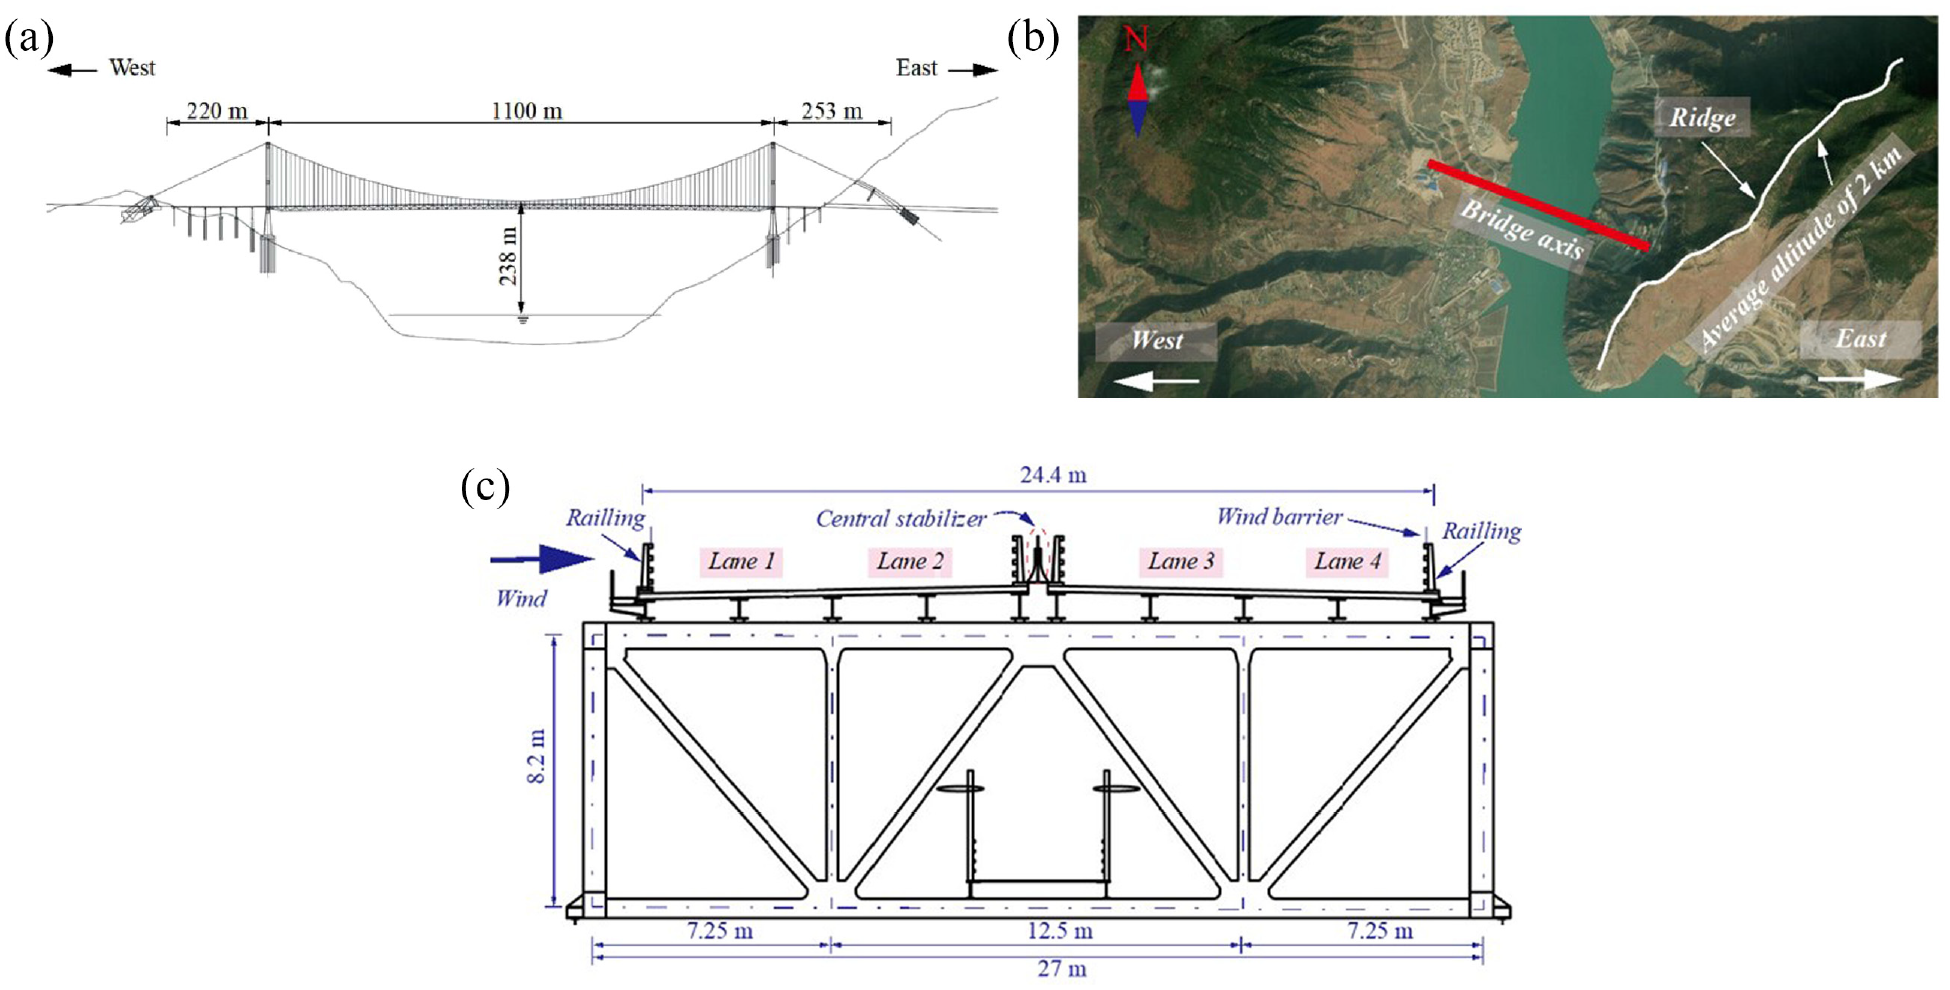
The diagram of the bridge including: (a) the elevation of the bridge and (b) the local topography at the bridge site, and (c) complex truss structure.
Wind data measurement mast
In order to measure the wind speed above the bridge deck, a 5 m high movable wind parameter movable observation tower (MOT) was developed by the author’s team. The movable observation tower (MOT) can be quickly arranged at any position on the bridge deck by manual traction or vehicle traction. In order to further ensure the reliability of the anemometer tower, the base size is a rectangular section with a side length of 1.2 m, the main tower is a round tube with a diameter of 8 cm, and the base and main tower are made of steel. Also, two movable observation towers (MOTs) for measuring wind were built:
One (Figure 3(a)) with a 3D ultrasonic anemometer at the 5 m height is used for long-term monitoring of history samples at a fixed point (referred to as the reference tower), which is fixed on the incoming side of the bridge deck.
Another anemometer tower (Figure 3(b)) installed the propeller mechanical anemometer (to collect the wind speed profile data) every 1 m, and a 3D ultrasonic anemometer (to collect the fluctuating components of the wind) at 5 m height for collecting the wind data of different positions on the bridge deck as required (referred to as the observation tower).
For the convenience of the follow-up study, the reference tower and observation tower can be called the MOT-FS (movable MOT-BD for measuring free stream) and MOT-BD (movable MOT-BD for measuring wind environment above bridge deck). In the early stage, the long-term field measurements at different measuring points such as the bridge site area and catwalk based on different wind observation system have conducted.23–27 Based on the bridge site’s long-term data analysis, it is found that there are two typical gale types in the bridge site area: small-scale climate driven by heat (Type I) and general atmospheric circulation in large-scale range (Type II).23,24 Small-scale local wind (Type I) basically exists every day, but its maximum wind speed is generally small, and the wind speed is generally 5–10 m/s (see Figure 2(a)). This kind of wind has a certain impact on daily driving, but does not control the design reference wind speed of the bridge. Type II wind is mainly controlled by a wide range of atmospheric circulation (gale cooling/winter monsoon), which generally occurs in winter and spring, and the wind speed is large, and the average wind speed in ten minutes can reach more than 20 m/s (see Figure 2(b)). It can be concluded that the design wind speed at the bridge site is mainly controlled by a wide range of atmospheric circulation (gale cooling/monsoon). Based on the analysis of the measured results at the bridge site in December for many years, it is found that the frequency of Type II gale in late December is relatively stable. Therefore, December 23–December 30 was selected to carry out the measured research on the characteristics of the wind field on the bridge deck. Figure 2(c) shows the measured situation in a certain year at the same time as the measured time. In addition, the previous results show that he gorge has an obvious locking effect on the wind direction, and the south wind is dominant.7,9 Therefore, in this measurement, the south lane is defined as the windward lane (Lane 1), and the north lane is the leeward lane (Lane 4), as shown in Figure 3(c). The specific settings of the field measurement are as follows:
The MOT-FS was fixed at 77.5 m from the middle of the span, and it is close to the anti-collision railings on the south side to measure the wind speed, which is not affected by the bridge structure possible.
The MOT-BD was placed on different lanes such as 1/4 span, middle of the span, and 3/4 span for exploring wind profiles at different positions along the longitudinal direction of the bridge.
All the instruments are calibrated before the measurement, and the MOT-FS and the MOT-BD collect data synchronously during measurement.
The sampling frequency of the 3D ultrasonic anemometer (Young RM 81000) and the propeller mechanical anemometer (Young RM 05103) is 10 and 1 Hz, respectively. It should be noted that the relevant parameters can be referred to in the literature. 28
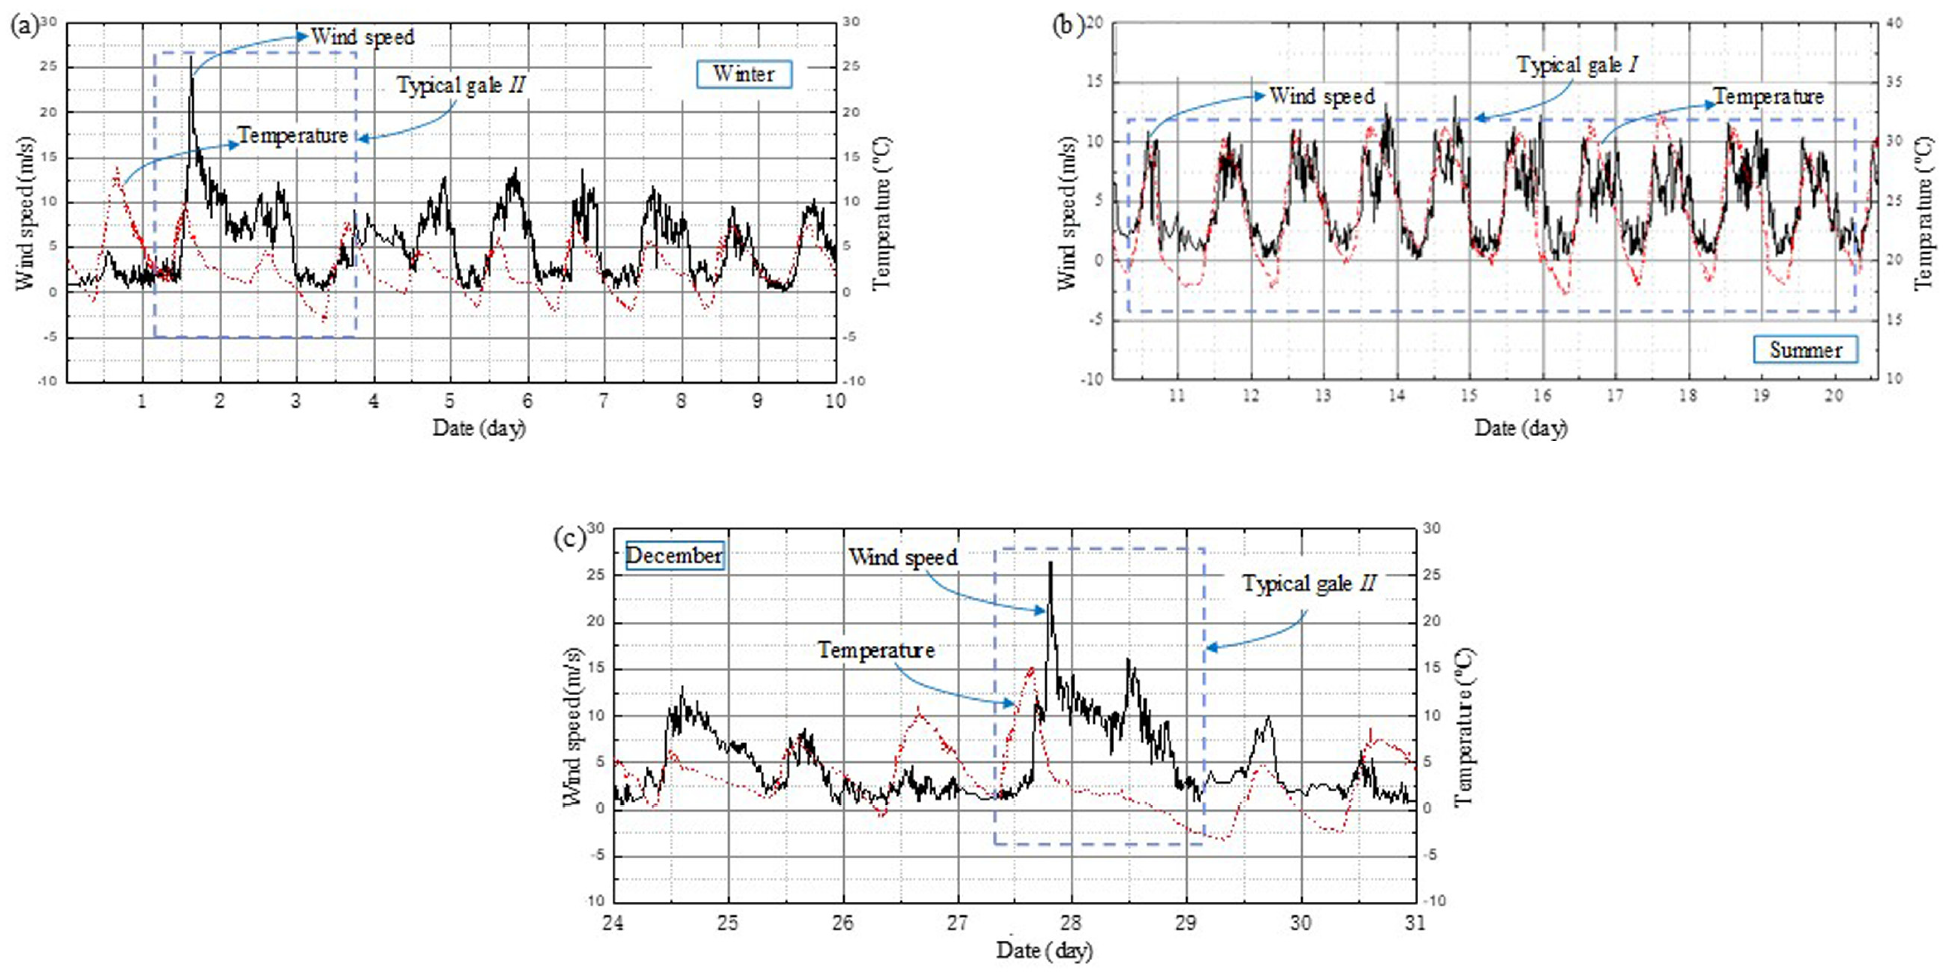
Typical strong winds in different seasons in the bridge site area.
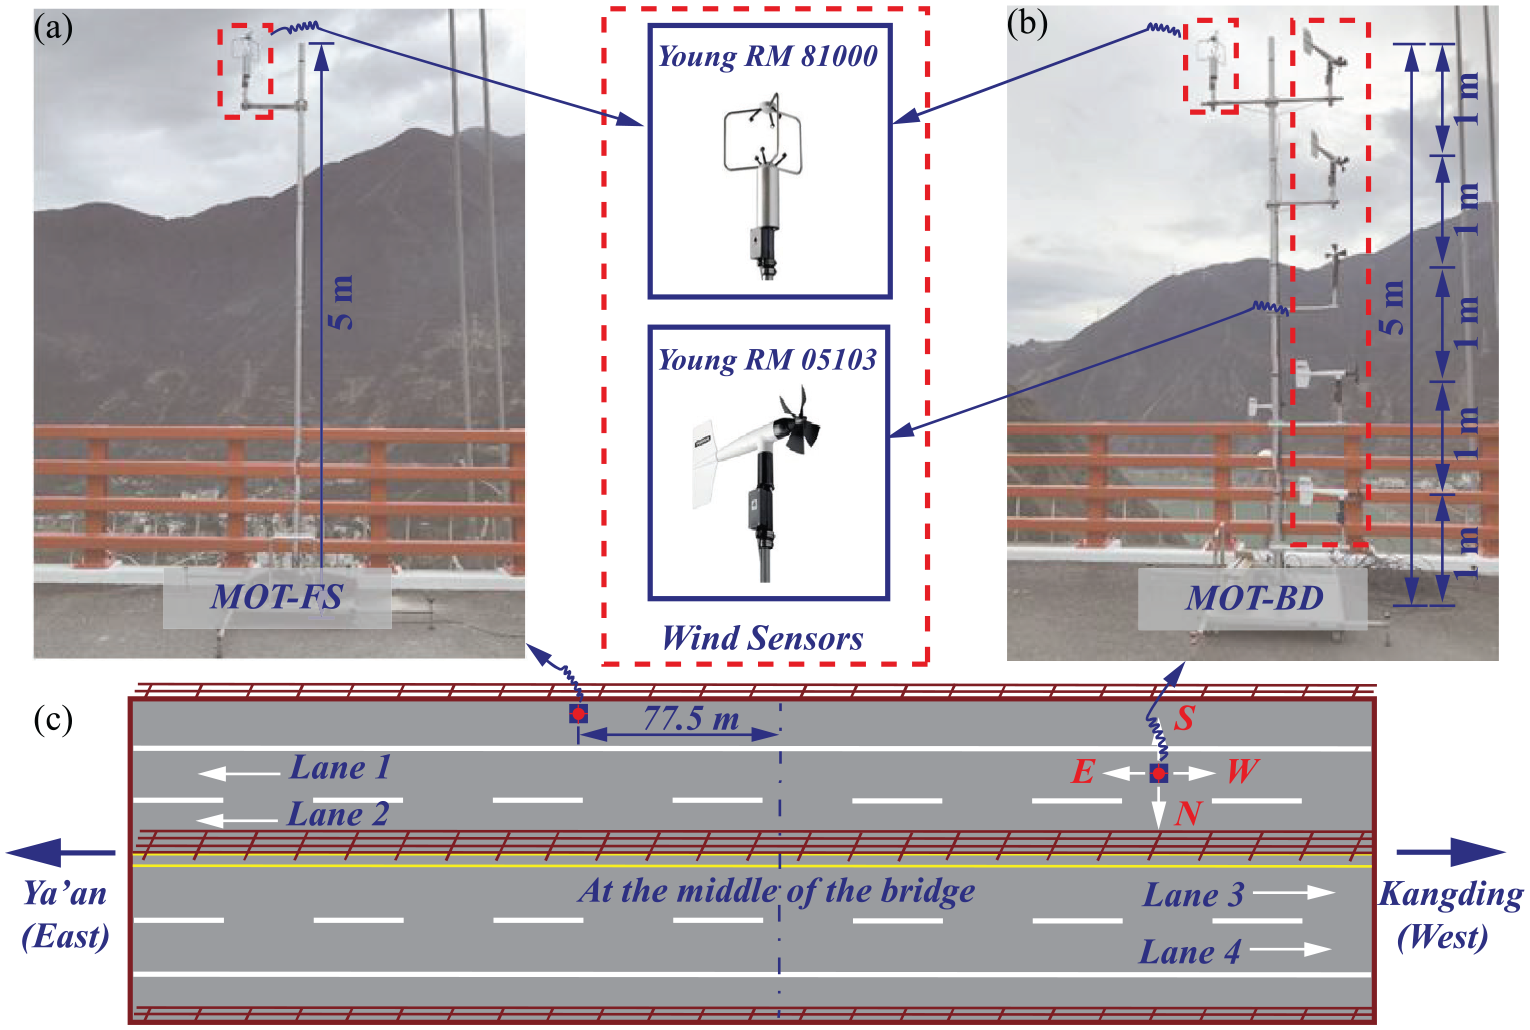
Arrangements of anemometers on the bridge deck (Captured by authors). (a) fixed point monitoring system, (b) mobile point monitoring system, and (c) layout of monitoring points on bridge deck.
The data logger will first process the wind parameter data collected by the wind sensor, and then all data will be transferred to the data center directly (see Figure 4). Based on the measured data, this paper discussed the average wind and turbulence wind parameters, including mean wind speed, wind direction, gust factor, turbulence intensity, and power spectrum, by the ultrasonic anemometer at 5 m height. Furthermore, the wind profiles at different longitudinal positions of the bridge are discussed based on five propeller mechanical anemometers with a gradient arrangement.

Flow chart of data acquisition and transmission.
Methodology
Mean wind speed, direction
As an essential factor, wind speed directly affects vehicles’ running environment on the bridge. The wind speed histories measured by the instrument in three mutually perpendicular directions of north, east, and vertical are indicated by symbols U1(t), U2(t), and U3(t), respectively. Also, each wind speed history to be analyzed is set as 10 min. Thus, the mean wind speed
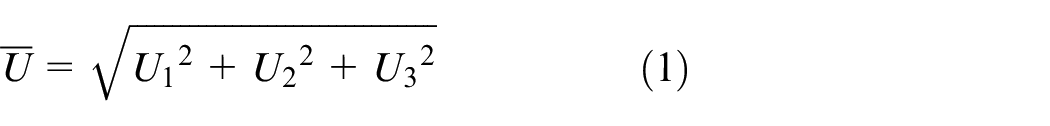
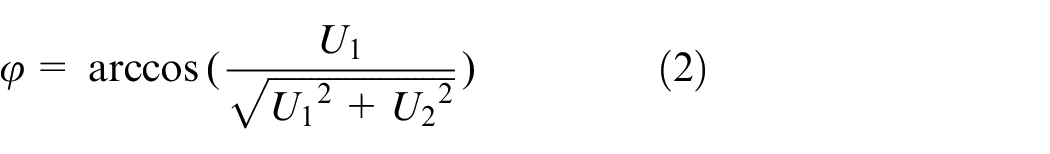
where φ is the wind direction, unit: (°) and 0° represents north, and 180° represents the south, correspondingly.
Gust factor, turbulence intensity, and power spectrum
For the airflow in the atmospheric boundary layer, the wind speed can be decomposed into the 10 min mean wind speed


where
The gust factor, defined as the ratio of the maximum mean wind speed in the gust duration to the average wind speed in the basic time interval, can be used to measure the pulsation characteristics of airflow, which has a noticeable influence on vehicles. Thus, based on equations (3)–(5), the formula for calculating gust factors of the longitudinal
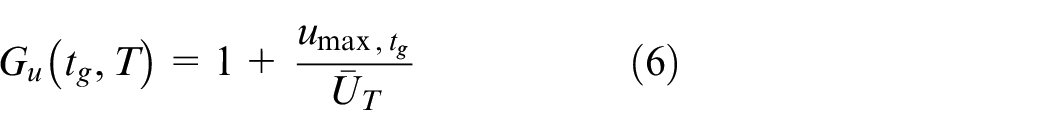
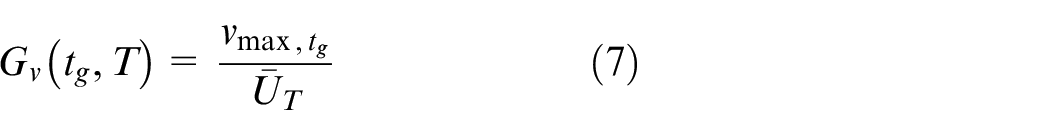
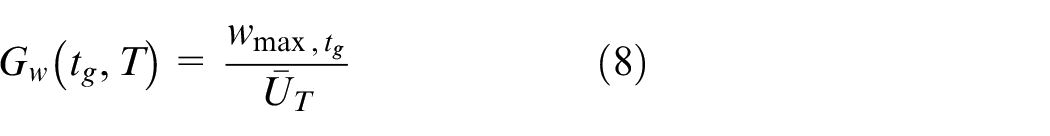
where
The turbulence intensity is an important parameter to judge the wind field and is also a significant factor affecting the safety of vehicles.
31
Turbulence intensity is defined as the ratio of the root mean square (RMS) of the fluctuating wind speed to the mean wind speed
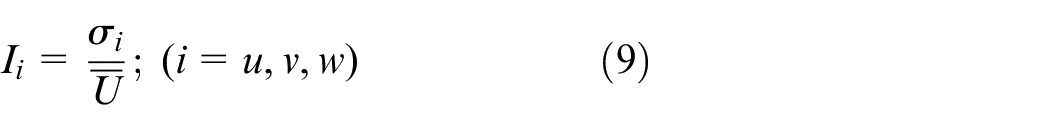
where Ii is the turbulence intensity in three directions, and u, v, and w represent longitudinal, lateral, and vertical turbulence components, respectively. σi is the RMS values of the wind speed in the i-direction (i = u, v, w), and
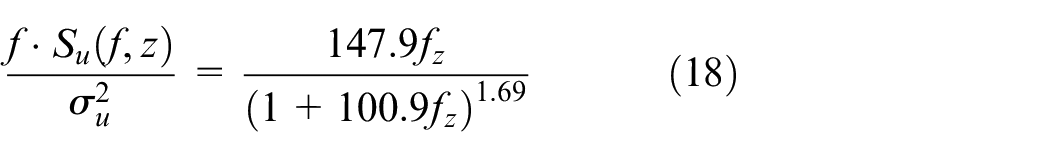
The power spectrum can describe the contribution of fluctuating wind of different frequencies to energy and is an indicator to judge the vehicle driving safety and comfort. Since the 1960s, many scholars have conducted in-depth research on turbulence wind spectrum and proposed different wind spectrum functions based on different conditions. Kaimal et al. 32 proposed a simplified empirical wind power spectrum for the longitudinal component, which was subsequently altered by Simiu and Scanlan, 33 and was recommended by Chinese design specifications:
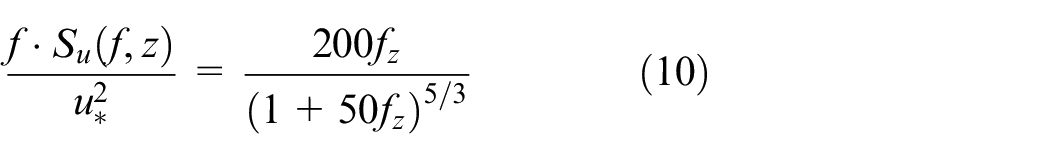
where Su (f, z) is the longitudinal auto power spectrum at height z, f is the frequency (Hz); u* is the airflow friction velocity; fz is the Mourning similar coordinate and
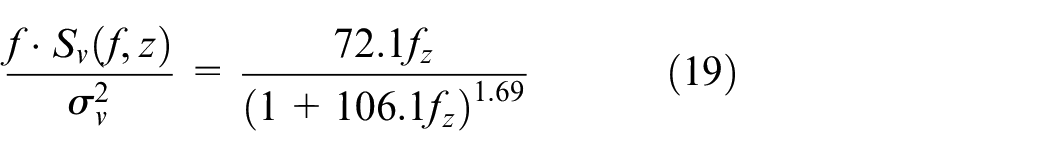
As described by equation (11), the formula for the lateral spectrum was first proposed by Kaimal et al., 32 and then was slightly modified by Simiu and Scanlan. 33
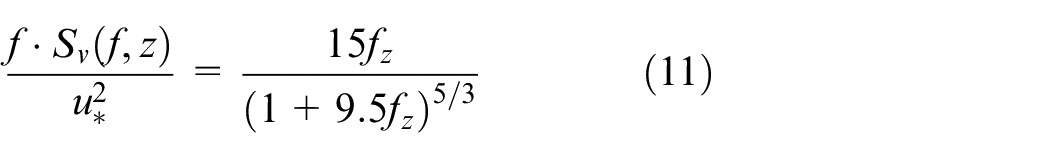
where Sv (f, z) is the lateral wind power spectrum at height z.
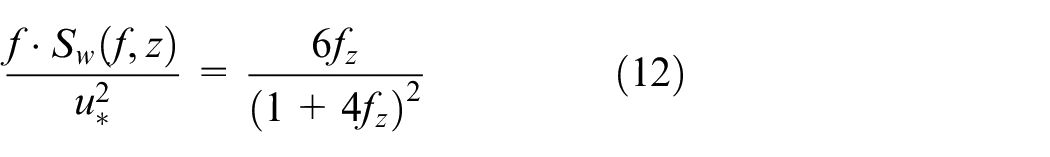
For the vertical turbulence component spectrum of wind turbulence, the following empirical formula proposed by Panofsky and McCormick 34 are mainly used at present, such as Chinese design specifications:·
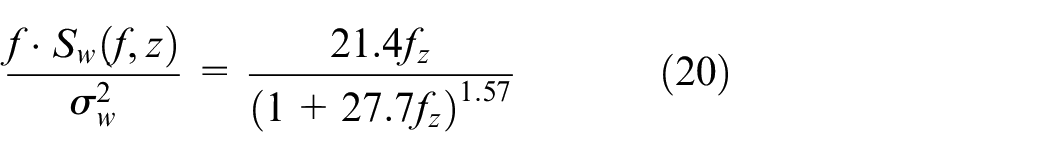
Thus, equation (13) was utilized to fit and analyze the local wind field’s longitudinal, lateral and vertical wind spectrums on the deck based on the equations (10)–(12).
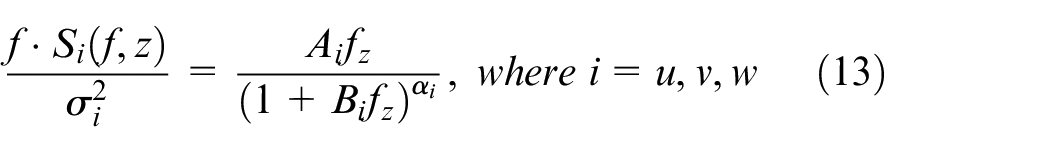
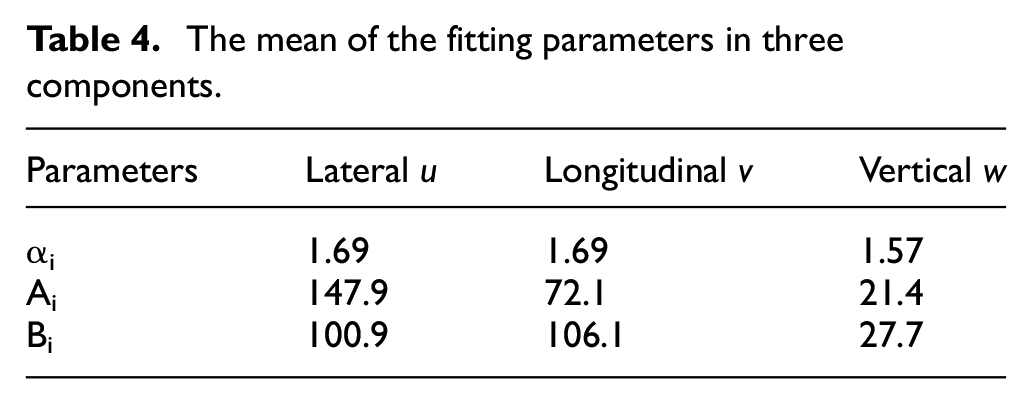
where, Ai and Bi represent the dimensionless parameter to be fitted in the corresponding direction, and αi is the power term to be fitted; σi is the RMS values of the wind speed in the i-direction (i = u, v, w), and u, v and w indicate the horizontal, vertical, and vertical wind direction, respectively. If the power terminal of the wind spectrum is set as
Wind profile and equivalent wind speed
The wind speed profile has a vital reference significance for the driving safety on the bridge deck. According to the data measured on the bridge site, the wind profile in mountainous areas is closer to the S-shaped curve. 36 Based on the finding, this paper intends to use the fourth-order polynomial function (see equation (14)) to fit the wind profile. Considering the wind profile above each lane is observed sequentially, not simultaneously. Therefore, to compare the changes of the wind profile above different lanes, the data samples collected by the MOT-BD were normalized by the wind speed measured by the MOT-FS.
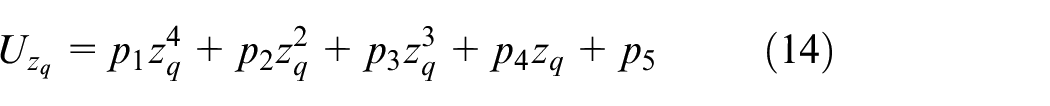
where,
Because it is difficult to directly evaluate the impact of bridge deck ancillary facilities on the incoming flow, only relying on the wind speed profile, thus, taking the station bus and trailer truck as the research objects, the local wind environment of the bridge deck was evaluated by the equivalent wind speed and its reduction factor in this paper. The equivalent wind speed based on the principle of equivalent lateral force (
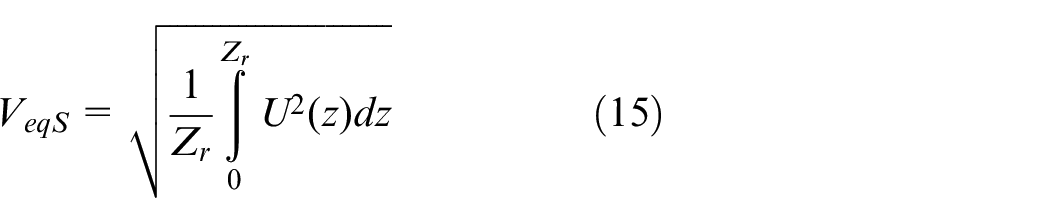
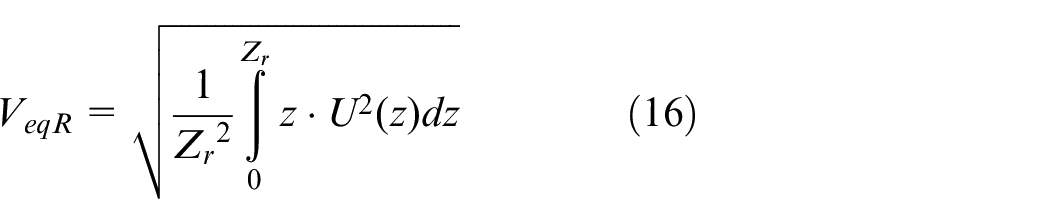
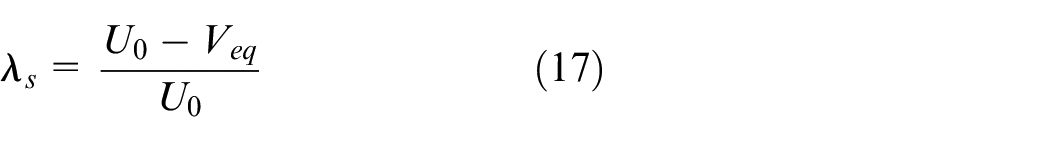
where, U(z) is the normalized wind speed at a height z above the bridge deck.
Coordinate transformation
In order to better reflect the influence of incoming flow on driving, the above results of wind parameters are extended to the case of bridge axis and vertical bridge deck, namely, the coordinate axes are transformed, 39 as shown in Figure 5. Where U1 and U2 denote the coordinate axis of instrument observation and the North is U1; u and v denote the coordinate axis of fluctuating wind, and the composite wind direction of mean wind speed U is u; x and y denote the coordinate axis of the bridge, and the bridge axis is x. It should be noted that the following sections replace x and y with v and u for uniform description. Thus, the u, v, and w represent the lateral, longitudinal, and vertical bridge direction, respectively.
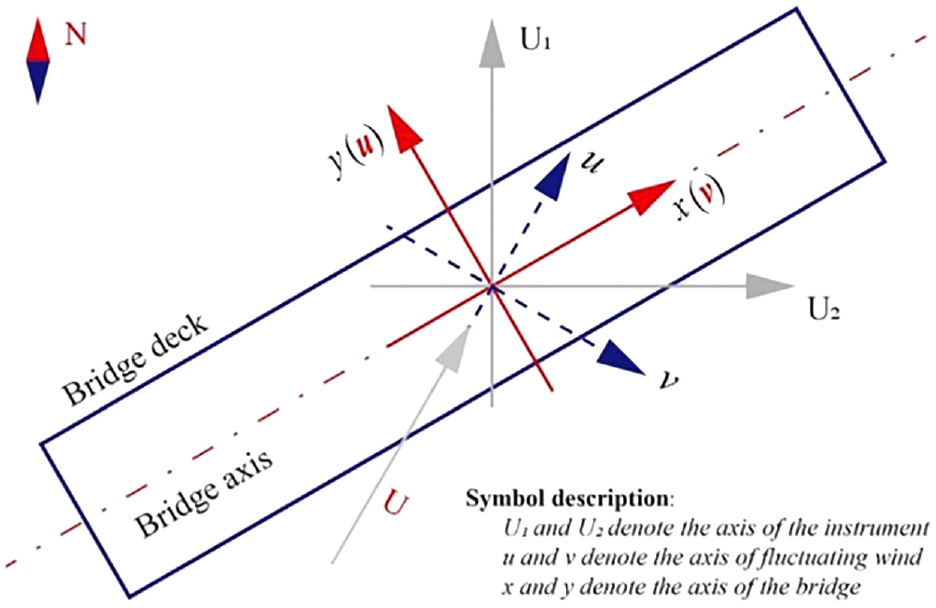
Transformation of the coordinate system.
Results and discussions
Wind speed and direction
In the operation of the bridge, the wind parameters from the bridge deck are easy to obtain, but the wind characteristics above each lane are not clear. Therefore, this paper aims to investigate the ratio relationship between incoming flow and wind speed in different lanes, so that after clarifying the relevant parameters of incoming flow, the wind speed distribution in different lanes can be deduced through this corresponding mapping relationship. It is worth noting that before exploring the clear mapping relationship between the two; thus, the difference between the measured wind speed and direction recorded from MOT-BD and MOT-FS was mainly discussed in this section. Figure 6 describes the measured data above different lanes from three aspects: (1) correlation between wind speed data collected by the MOT-BD and MOT-FS (see Figure 6(a1)–(a4)), (2) probability distribution of wind speed data collected by MOT-BD and MOT-FS (see Figure 6(a1)–(a4)), and (3) probability distribution of wind speed difference between MOT-BD and MOT-FS (see Figure 6(b1)–(b4)). From the aspect of correlation, it can be seen from the figure that there is a strong correlation between the incoming flow velocity and the wind speed on the bridge deck. Therefore, it lays a good foundation for us to clarify the mapping relationship between incoming flow and wind parameters above different lanes.
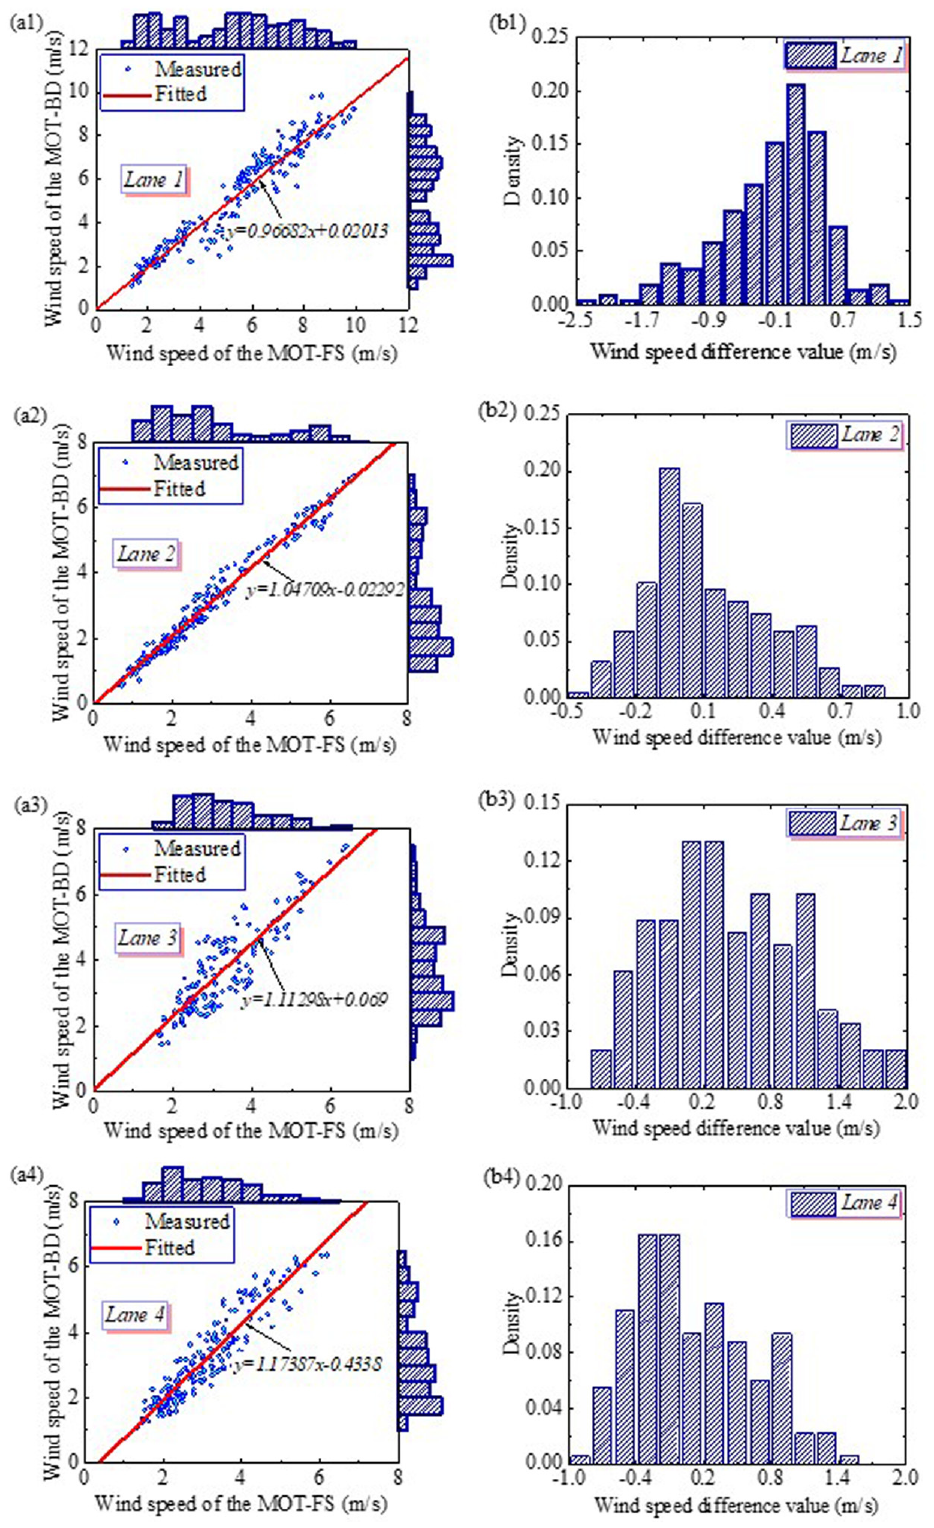
Wind speed distribution of the MOT-BD and MOT-FS on different lanes, including: (a) linear fitting and distribution of the wind speed and (b) distribution of wind speed difference.
Furthermore, the wind speed ratio of incoming flow and different lanes is explored. The results show that the ratios of wind speed to incident wind speed above Lane 1–Lane 4 are 0.967, 1.048, 1.113, and 1.174, respectively. This is mainly because the local auxiliary structure of the bridge deck will increase the wind speed above the bridge deck, and the increase of wind speed will gradually increase as the lane moves to the leeward side. Therefore, when the incoming wind speed is obtained, the wind speed distribution of different lanes can be inferred according to its relevant mapping relationship. Alternatively, from the aspect of wind difference, the totals of the probability of the positive wind speed difference among lane 2 to lane 4 are more significant than that of the opposing wind speed difference. The values of lane 2–lane 4 are 59.9%, 73.9%, and 51.0%, respectively. It can be concluded that the wind speed above the leeward side is greatly affected by the auxiliary structure of the deck, while the windward side is relatively small. From the wind speed distribution, the wind speed from MOT-BD above lane 1 is mainly concentrated between 2–3 m/s and 5–8 m/s, while the wind speed from MOT-FS is mainly concentrated between 1–4 m/s and 5–8 m/s. Contrary to the result of lane 1, the wind speed from the MOT-BD and MOT-FS above lanes 2–4 is mainly concentrated between 1 and 4 m/s.
The wind direction is usually described by an 8-azimuthal or 16-azimuthal map, 40 so the 16-azimuth diagram is used to describe the wind direction in this study. Figure 7 describes the measured wind direction above different lanes from the rose diagrams of a sample number of 2-min mean wind direction and wind speed (see Figure 7(a1)–(a4)). It can be seen from the figure that there is a dominant wind direction even if the lanes are different, mainly between the southeast (ESE) and south (S). As for the windward side, the change of wind direction is not significant, and the wind direction measured by the MOT-BD is highly coincident with that of the MOT-FS. While the local wind field above the leeward side is greatly affected by the affiliated facilities on the deck, especially on lane 3 close to the central stabilizer, the above effect is particularly significant. As shown in Figure 8(a3), the wind speed over lane 3 is generally higher than the control wind speed, and the wind direction shift to the south (S). It is attributed to blocking the airflow in the lower area of the bridge deck and increasing the local blocking rate above the bridge deck, which increases the wind speed in lane 3. However, as the airflow moves downstream, the local compression effect caused by the central stabilizer is weakened, so the increase of wind speed above lane 4 is slight, and its wind direction also shifts to the south (S).
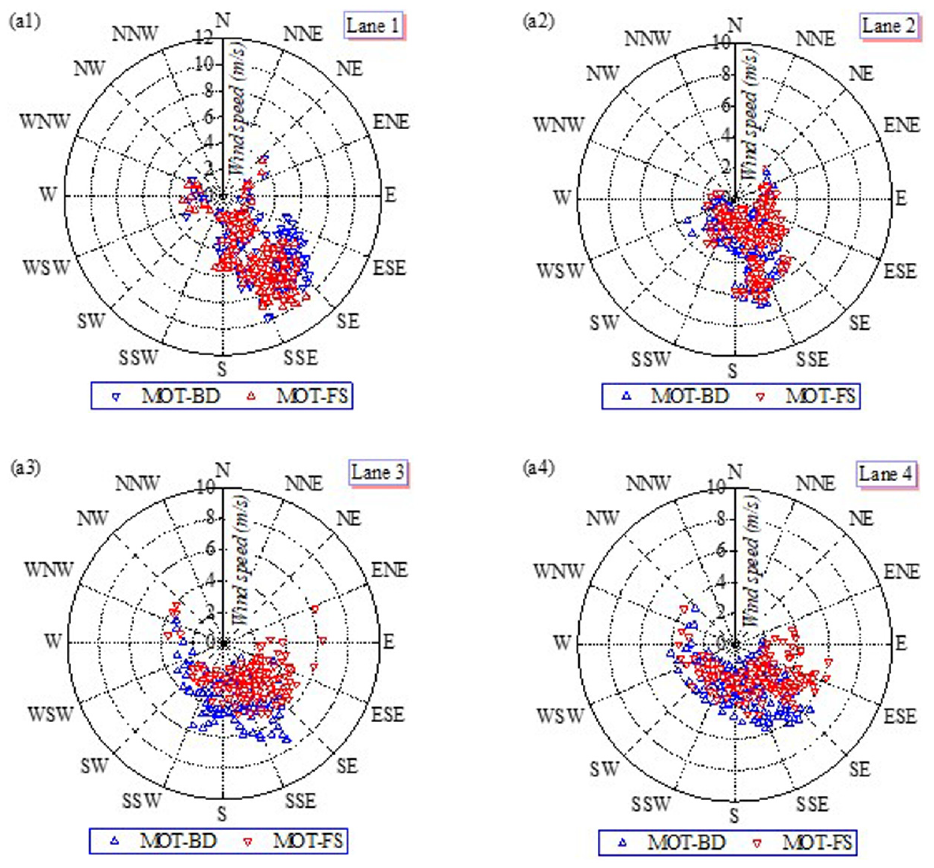
Rose diagrams of a sample number of mean wind direction at different lanes.
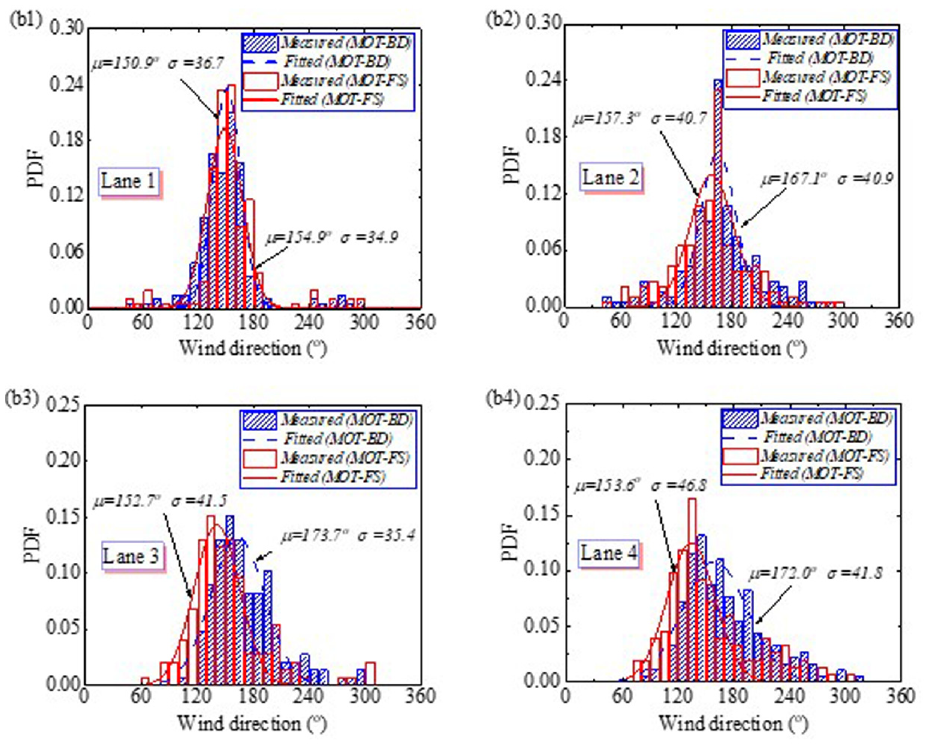
Frequency distribution of sample number of mean wind direction at different lanes.
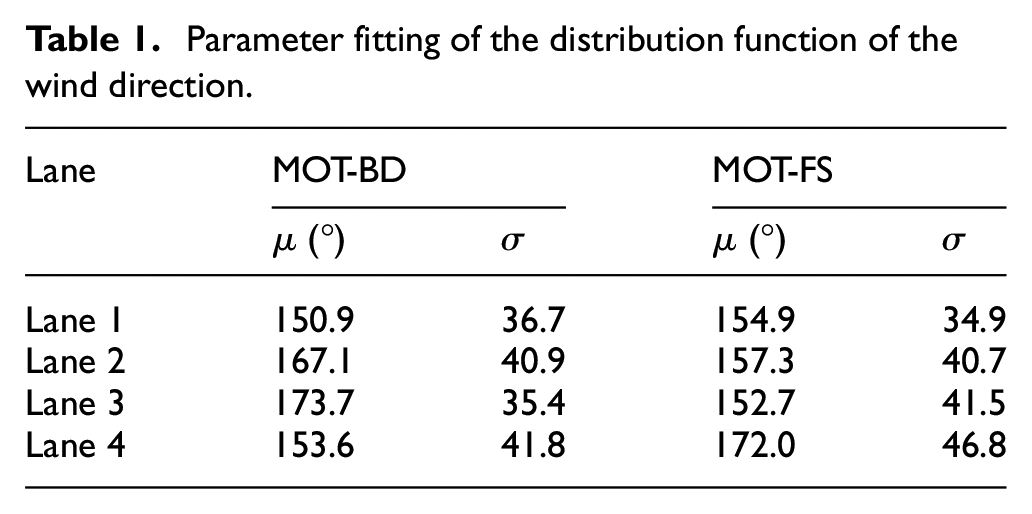
In order to investigate the difference of wind direction between the lane and the incoming more concretely, the frequency distribution of 2-min mean wind direction was plotted in Figure 8(b1)–(b4). Furthermore, many studies have shown that wind direction follows a Gaussian distribution.28,29,36 This paper also attempts to describe the wind direction by Gaussian distribution based on this point of view. The wind direction above the windward side (lane 1 and lane 2) is more concentrated than the incoming flow, while the leeward side (lane 3 and lane 4) is more discrete. The parameter fitting of the Gaussian distribution function of the wind direction is listed in Table 1. These fitted parameters indicate that the affiliated facilities significantly affect the local wind field of the bridge deck.
Parameter fitting of the distribution function of the wind direction.
Gust factor
Figure 9 shows the measured lateral direction gust factor Gu of the MOT-BD and MOT-FS above different lanes from two aspects: (1) the relationship between Gu and wind speed (see Figure 9(a1)–(a4)), (2) correlation between Gu collected by the MOT-BD and MOT-FS (see Figure 9(b1)–(b4)), and (c) probability distribution of Gu obtained from MOT-BD and MOT-FS (see Figure 9(b1)–(b4)). Even if the lanes are different, the Gu decreases with the increase of wind speed, and the value on the leeward side is slightly higher than that on the windward side. Also, the Gu above lane 1 is relatively higher than the MOT-FS, while the Gu above lanes 2∼4 is lower than the MOT-FS. In addition, it can be found from Figure 9(b1)–(b4) that the wind speed above lanes 1, 3, and 4 strongly correlates with the incoming flow, while the correlation of lane 2 is weak. The same results apply to the longitudinal and vertical direction gust factors (Gv and Gw).
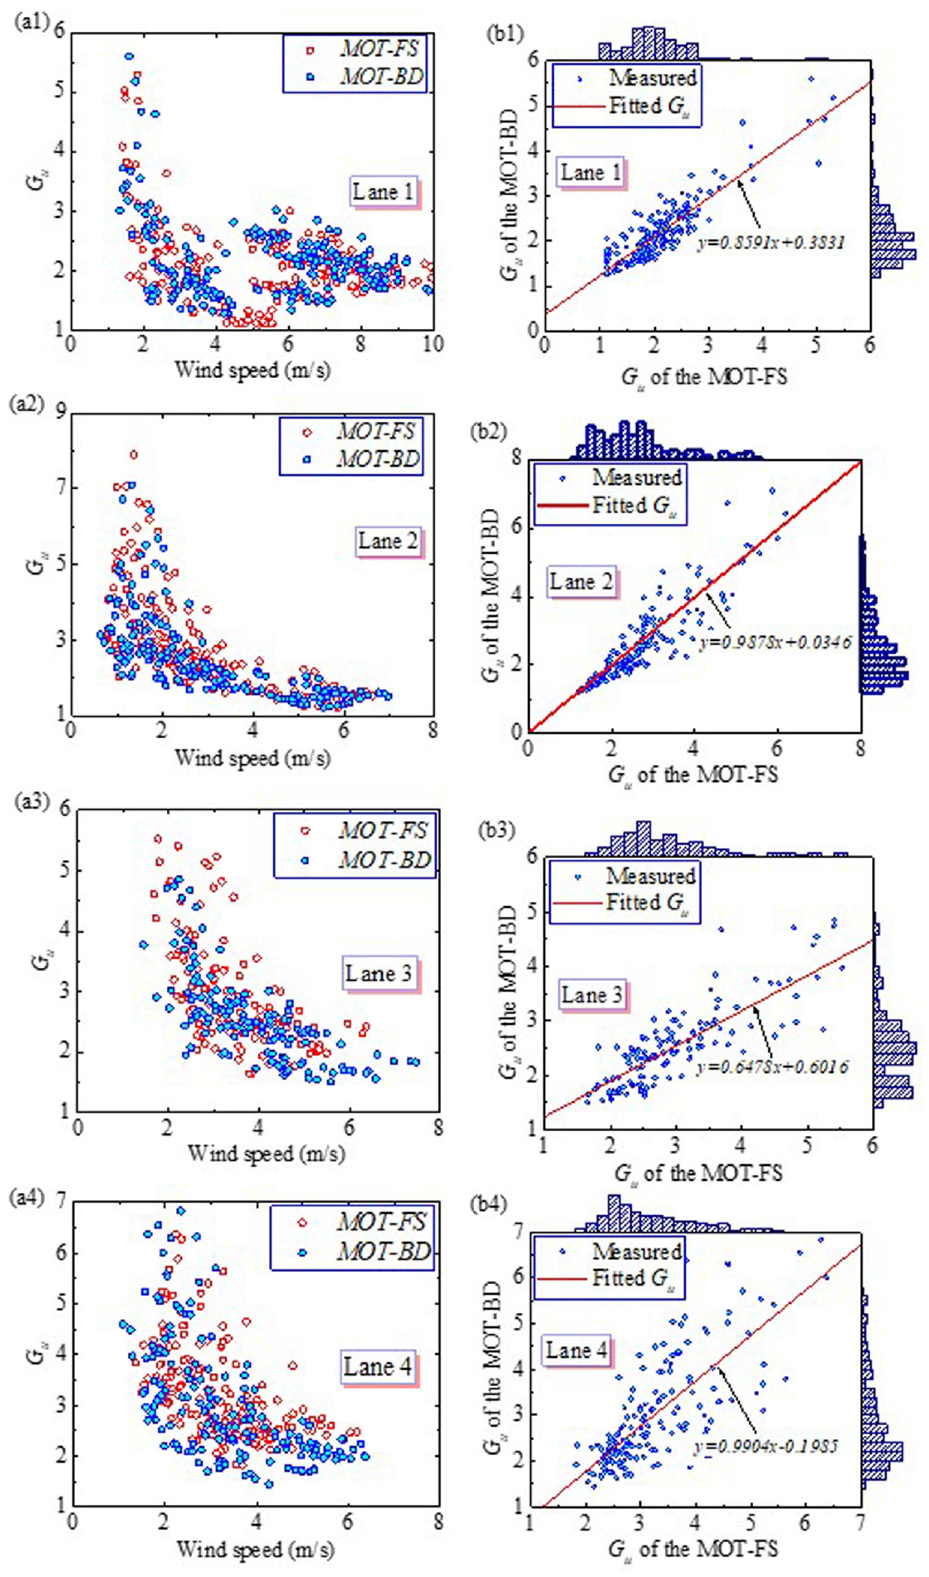
Distribution of the lateral gust factors of the MOT-BD and MOT-FS on different lanes, including (a) the relationship between Gu and wind speed (b) linear fitting and distribution of the Gu.
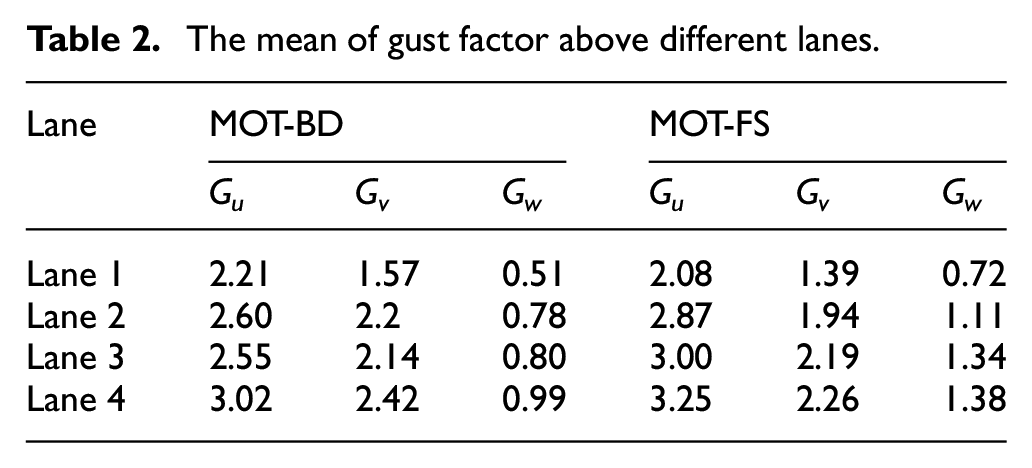
Table 2 shows the mean gust factors of different lanes and different components. The results indicate that the gust factor Gu and Gv of lane 1 have significantly increased because it is closer to the incoming flow side, and the incoming flow is greatly disturbed by the railing and other ancillary facilities. However, for lanes 2–4, the guiding effect of the central stabilizer on the deck has a more significant influence on the gust factor. This explains two phenomena: (1) The gust factors of lane 2 and lane 3 are very close, and the mean values of the three directions are close to 2.57, 2.17, and 0.79, respectively, and (2) the gust factor Gu is lower than the value of the incoming flow, while the gust factors Gv are higher the value of the incoming flow. Moreover, the gust factor Gw on each lane is lower than the value of the incoming flow.
The mean of gust factor above different lanes.
Turbulence intensity
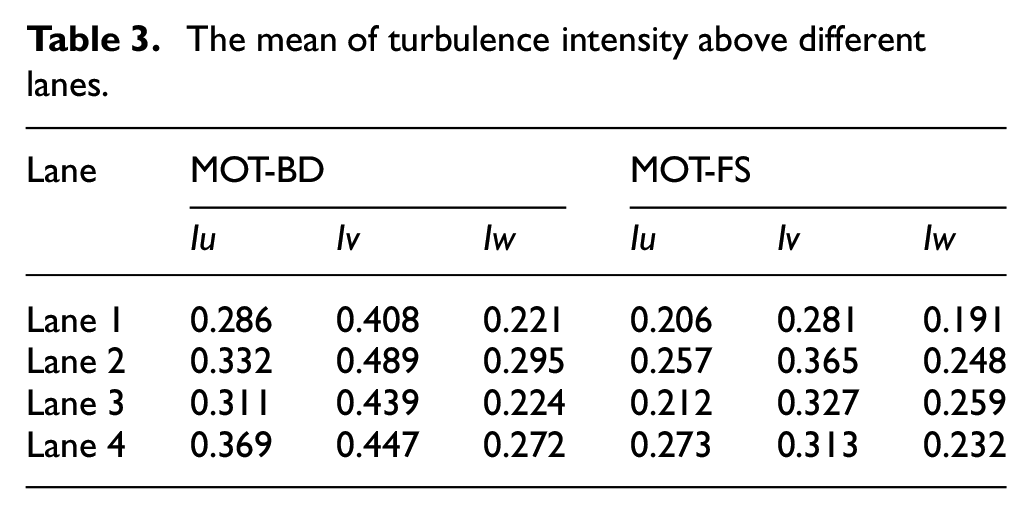
Figure 10 shows the relationship between turbulence intensity Iu above different lanes and wind speed. As seen in Figure 10, the turbulence intensity decreases with the increase in wind speed. Generally, the turbulence intensity above the bridge deck is higher than the value of the incoming flow, and the leeward side is higher than the value of the windward side. Table 3 shows the average value of Iu, Iv, and Iw. In terms of the Iu, the average values above lanes 1– 4 are 0.286, 0.332, 0.311, and 0.369, respectively, while the corresponding turbulence intensity of the incoming flow is 0.206, 0.257, 0.212, and 0.273. Furthermore, for the ratios of turbulence intensity in three components, the mean ratio of Iu: Iv: Iw (lateral, longitudinal, and vertical bridge direction) above lanes 1–4 are 1:1.43:0.77, 1:1.47:0.89, 1:1.41: 0.72, and 1:1.21:0.74, respectively, which is quite different from 1:0.88:0.50 recommended in the specifications.
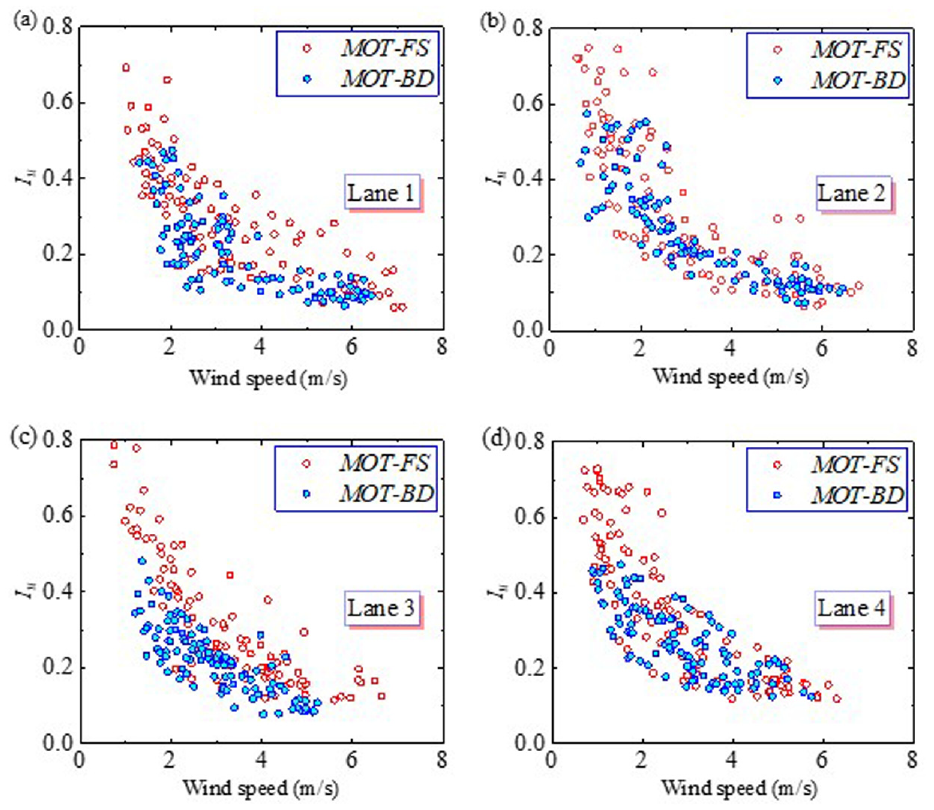
Variation in Iu with mean wind speed above different lanes.
The mean of turbulence intensity above different lanes.
Power spectrum
The periodogram is used to solve the power spectrum of fluctuating wind speed samples, in which the sample length is 10 min fluctuating wind sequence and the sampling frequency is 10 Hz.35,41 Fitting all the measured power spectra in the lateral, longitudinal, and vertical directions, Figure 11 shows the probability distribution of
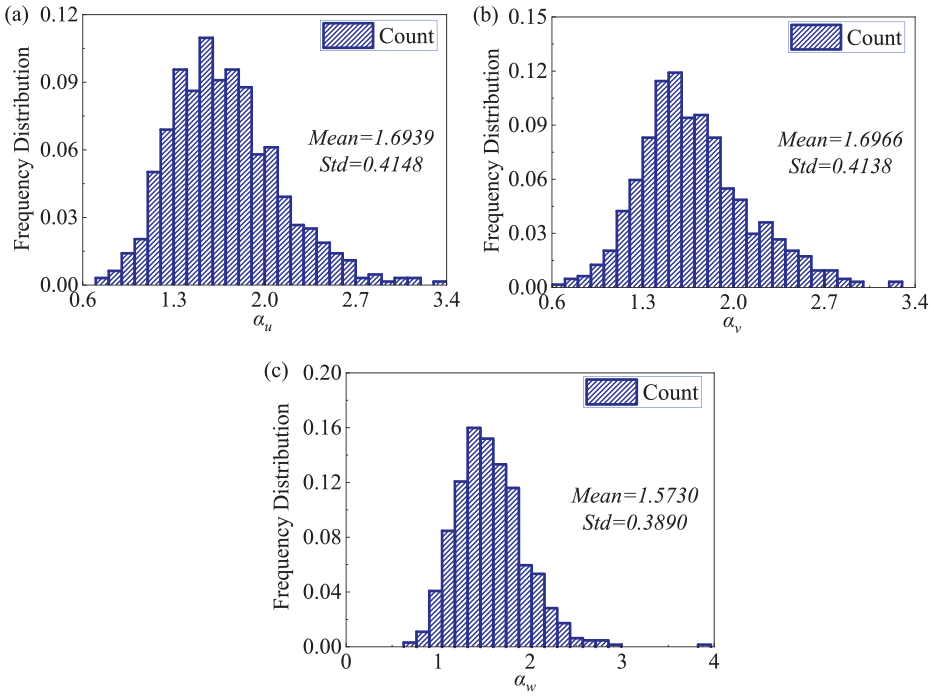
Frequency distribution of α in: (a) lateral, (b) longitudinal, and (c) vertical bridge direction.
The mean of the fitting parameters in three components.
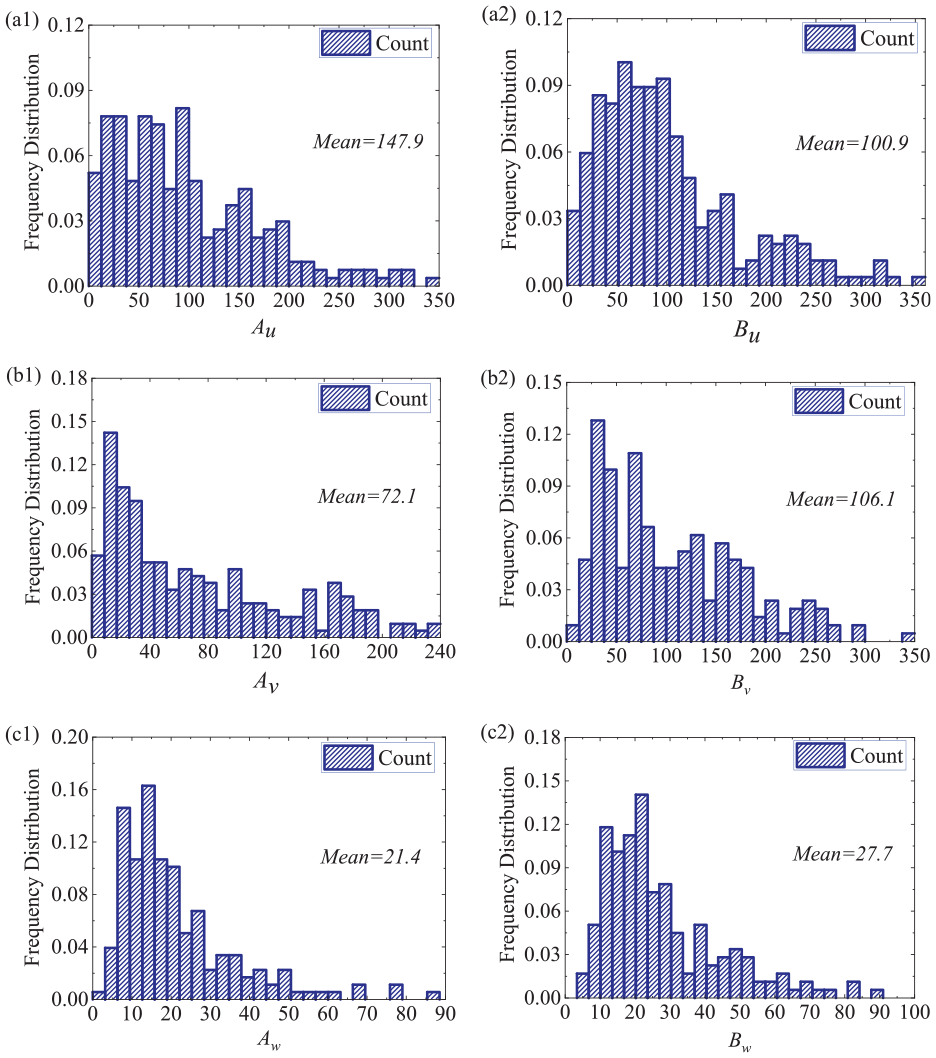
Probability distribution of the fitting parameters A and B in (a) lateral, (b) longitudinal, and (c) vertical bridge direction.
The different power spectrums in three directions of a sample above the bridge deck are described in Figure 13. It can be found that the variation trend of the fitted spectrum is consistent with the measured samples. The values of α obtained by fitting can well reflect the variation trend of the power spectrum. For the fluctuating lateral wind, the fitted wind spectrum can better reflect the variation trend of the power spectrum, but the value of the fitted power spectrum is slightly higher overall. For the longitudinal fluctuating wind, the high-frequency part of the fitted spectrum agrees well with the high-frequency band of the measured power spectrum, but there is a slight deviation in the low-frequency part; For the vertical fluctuating wind, the low-frequency part of the fitting spectrum fits well, but there is a particular deviation in the high-frequency part. In general, the fitted spectra proposed in this paper can well reflect the measured wind spectrum of the bridge deck.
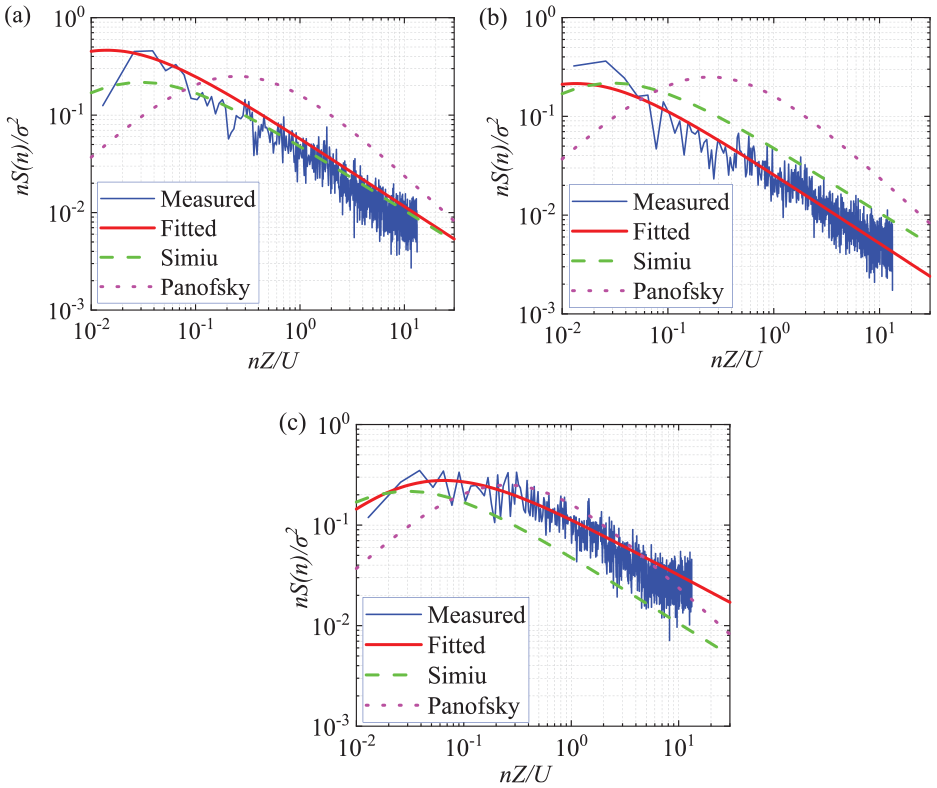
Power spectrums of the measured sample above the bridge deck in: (a) lateral, (b) longitudinal, and (c) vertical bridge direction.
Wind profile and equivalent wind speed
Figure 14 shows the fitting results of wind profiles by the unified fitting method in different lanes and different directions (longitudinal
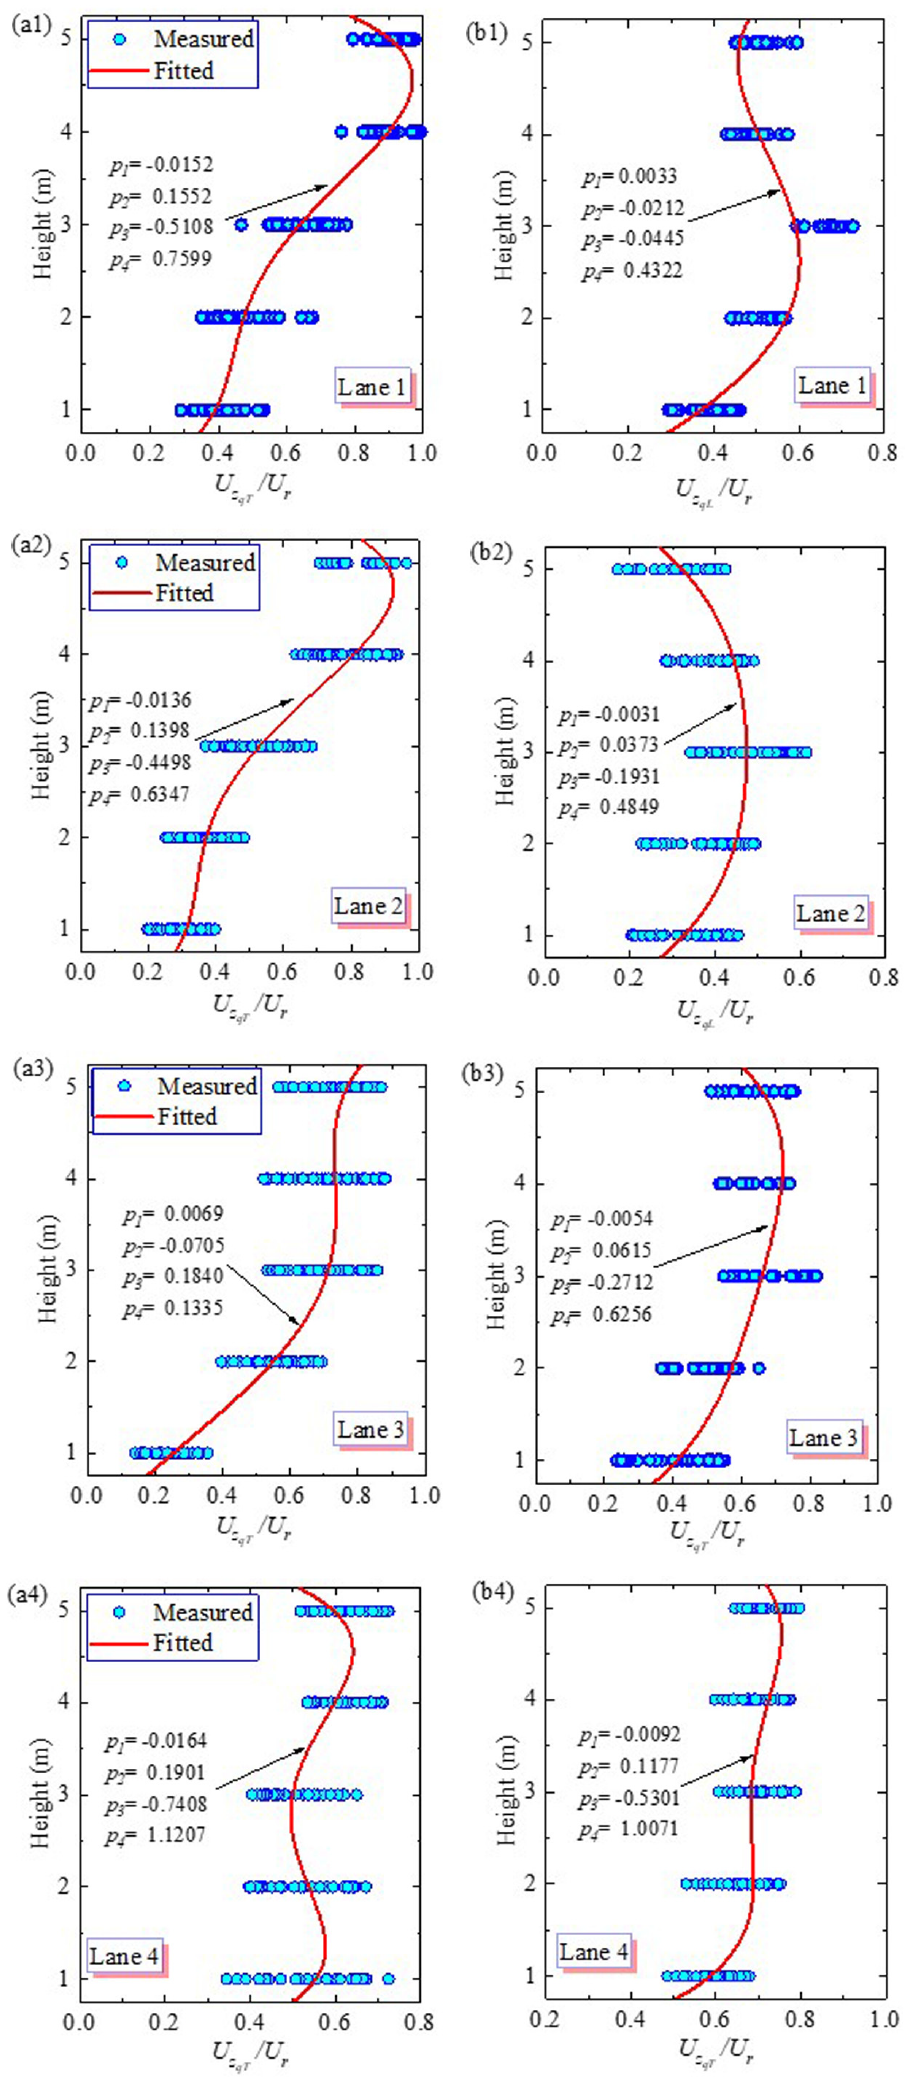
The measured wind profile and the corresponding fitting curves above different lanes in the direction of (a) lateral bridge and (b) longitudinal bridge.
Normalized equivalent wind speed in lateral bridge direction.
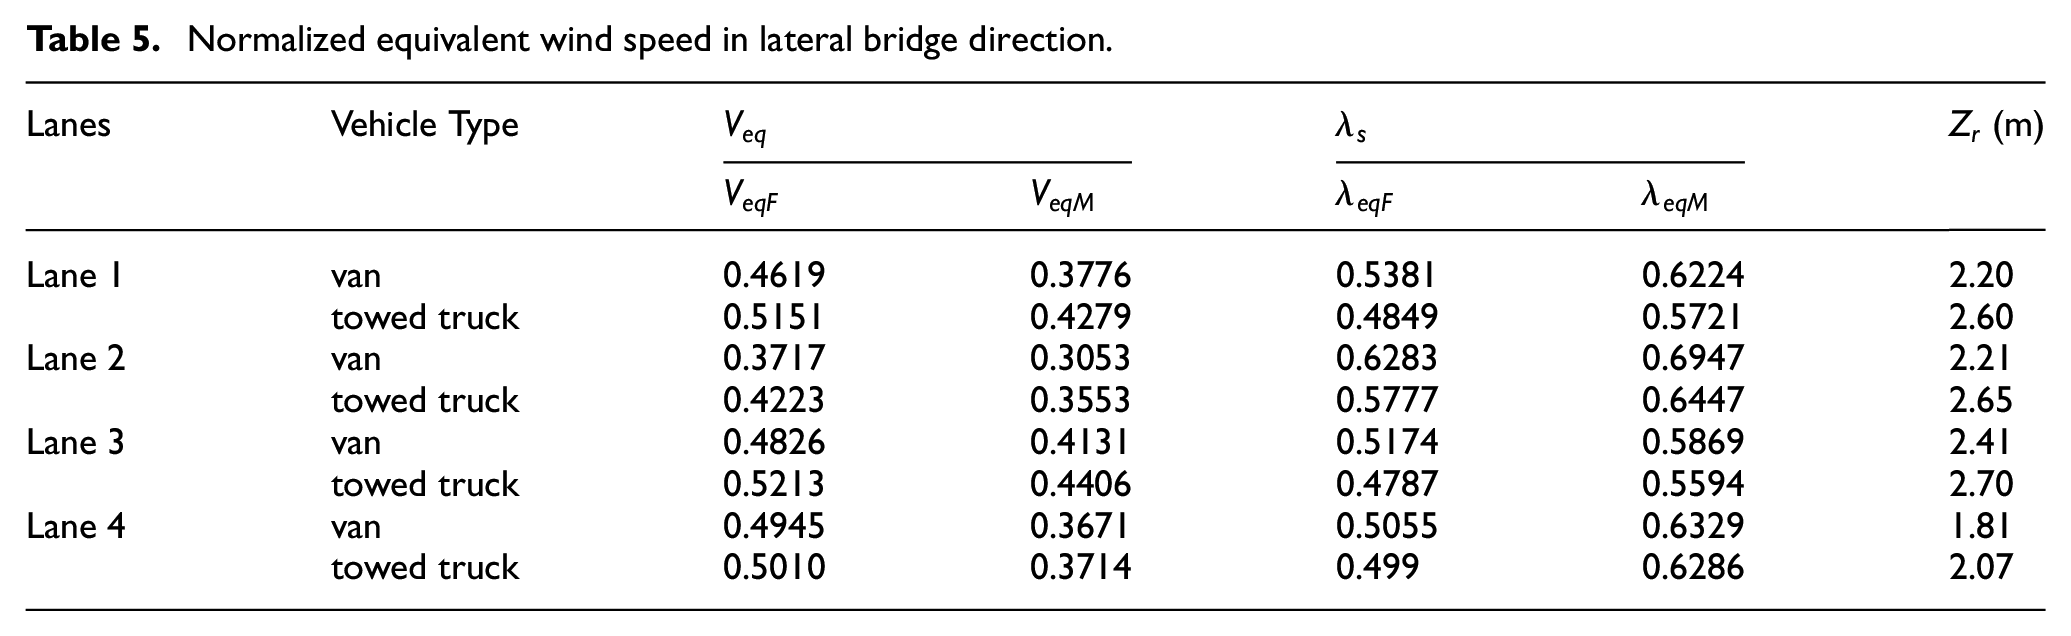
where the heights of vanes and towed trucks are 3.3 and 3.78 m, respectively, and the center of gravity heights are 1.4 and 1.7 m 38.
Conclusions
In this paper, based on a complex truss girder bridge, the wind parameters at different lateral and longitudinal positions of the bridge deck are measured by field measurement. Some remarking conclusions can be drawn as follows:
A set of monitoring systems for the local wind environment of the bridge deck is developed and applied to the field measurement of a complex truss girder bridge.
There is a strong correlation between the wind parameters above the lane and the incoming flow. At the same time, the local auxiliary structure of the bridge deck will change the wind parameters above the bridge deck, and the change range will gradually increase as the lane moves to the leeward side.
The variation trend of wind profiles in different lanes shows a significant spatial nonuniformity due to the interference effect of bridge deck ancillary facilities, and the type of the wind speed profiles at the bridge deck were suggested.
The measured power spectrum of the bridge deck is quite different from the wind spectrum applicable to the bridge site area, so it is not appropriate to use the wind spectrum of the bridge site area to carry out the analysis of the windmill bridge, and a more suitable wind spectrum for bridge deck wind field is proposed.
It should be noted that the system developed in this paper for monitoring the local wind environment of the bridge deck is also applied to other types of bridges. Also, the results of this study can provide a reference for the design of bridges and provide the basis for the research of wind environment on the bridge deck to provide advice for vehicle driving safety in complex mountainous areas.
Footnotes
Declaration of conflicting interests
The author(s) declared no potential conflicts of interest with respect to the research, authorship, and/or publication of this article.
Funding
The author(s) disclosed receipt of the following financial support for the research, authorship, and/or publication of this article: The work described in this paper was fully supported by a grant from the Young Elite Scientists Sponsorship Program by CAST (No. 2021QNRC001), and the National Natural Science Foundation of China (NO. U21A20154).
Availability of Data and Materials
The datasets used or analyzed during the current study are available from the corresponding author on reasonable request.