
Abstract
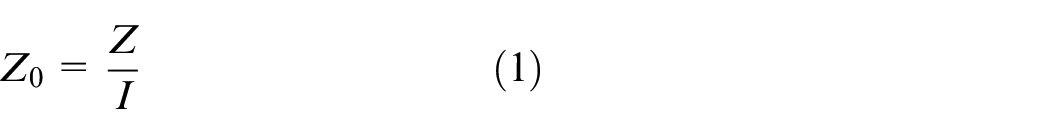
Based on the research background of shallow-ground metal detection under the environment with the interference of steeling structure,a metal detection method based on the transient electromagnetic method is studied. The test platform is built and verified by experiments. Firstly, the loos model of the coil system is established, and the transfer function with the excitation voltage source as the input signal and the induced voltage of the metal conductor as the output signal is derived. The system design of metal detection based on pulse electromagnetic induction is carried out, and a simple and feasible experimental platform is built according to the demand. Aiming at the signal processing problem of metal detection in a complex environment such as steel structure, a detection algorithm based on a hypersphere model and confidence interval is applied. Finally, the experimental verification is carried out. The results show that the designed system is feasible for metal detection, and the applied signal processing algorithm is effective although interfering by steeling structure inthe environment.
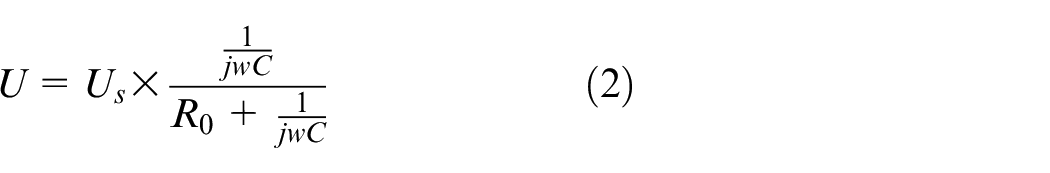
Introduction
Cluster bomb is a kind of weapon that poses a great threat to the airport. 1 After the cluster bombs attacking the airport runway were scattered around the airport, 10%–30% of the sub bombs would not explode normally and some of them were scattered on the shallow surface.2,3 Therefore, in the reconstruction work after being attacked, the primary consideration is the detection of unexploded ordnance. Because the most cluster bomb is made of metal, the detection of unexploded ordnance is similar to that of metal conductor. On the other hand, the airport runway is mainly composed of reinforced concrete structure, metal of which will bring great interference to the detection of shrapnel, and it will lead to the unsatisfactory detection effect of traditional metal detection methods. This paper mainly studies the metal detection interfering by steeling structure of the detected environment.
At present, there are many researches on metal detection. An EEMD-based electromagnetic induction method is promoted for nondestructive testing of buried metal conductors. Although the observed EMI signal is quite complex, the target metal can be detected directly by this method. 4 The high-frequency electromagnetic induction (HFEMI) instrument sensor is using for void and landmine detection, which can reduce false alarms from EMI instruments that detect only the metal.5,6 A method of retrieving metal target position and magnetic polarizability tensor using broadband electromagnetic induction (EMI) data is proposed. 7 An algorithm based on Kalman filter is used to realize metal detection. In this method, it is assumed that the distribution of output data of metal detectors is Gaussian. The detection algorithm has been applied to Minelab F1A4-MIM metal detector. 8 A method that can improve the metal detection sensitivity by properly considering the “shape” of the detection signal is developed and applied to food detection. 9 Mhaisen et al. 10 propose and implement a metal detection module using Terasic spider robot, which is planned to be used for mine detection to detect buried metal at a maximum depth of 7 cm. It happens that there is a similar case, Wan et al. puts forward an initial state estimation algorithm based on Kalman filter (KF) and extended Kalman filter (EKF) for underground metal detection. What’s more, a simulation platform for the underground metal detection is built. However, no experimental verification was carried out. 11 Based on the eddy current effect, a metal detection method using eddy current sensor is proposed by combining two high-frequency sensors and one low-frequency sensor. 12 van Verre et al. 13 studies a new hand-held detector system based on magnetic induction spectroscopy (MIS), which can be used to detect buried metal objects. The dual high metal detector array is used on the vehicle platform to highlight the more likely objects of interest and eliminate unnecessary clutter. 14
In conclusion, many scholars have carried out relevant research on metal detection and achieved good results in many aspects. However, above literature does not involve the metal detection algorithm in the case of metal interference in reinforced structures. Therefore, this paper mainly studies the metal detection interfering by steeling structure of the detected environment proposing an anti-interference detection algorithm based on hyper-sphere model and confidence interval.
Design and analysis of detection system based on transient electromagnetic method
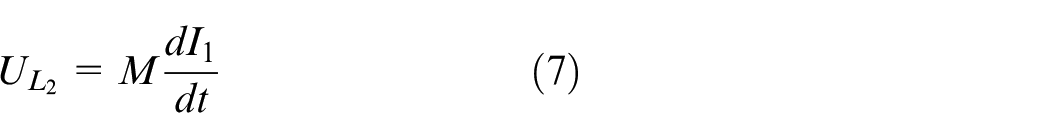
In order to study the performance and parameter characteristics of the system, it is necessary to establish the equivalent mathematical model of the detection system. In Ni, 15 it is considered that a thin metal conductor acted by a primary field can be equivalent to the superposition of infinitely many closed rectangular coils. In addition to the current directly induced by a primary field, each coil can also generate current due to mutual inductance. The formula derived from this principle is very complex, which is not conducive to analysis and calculation. H. R. loos supported that the metal conductor can be directly regarded as an eddy current ring, and the interaction between the detection coil and the metal conductor can be simplified as the mathematical model of the transformer without core, which is called the loos model. 16 Figure 1 shows the loop loos model based on pulsed electromagnetic induction.
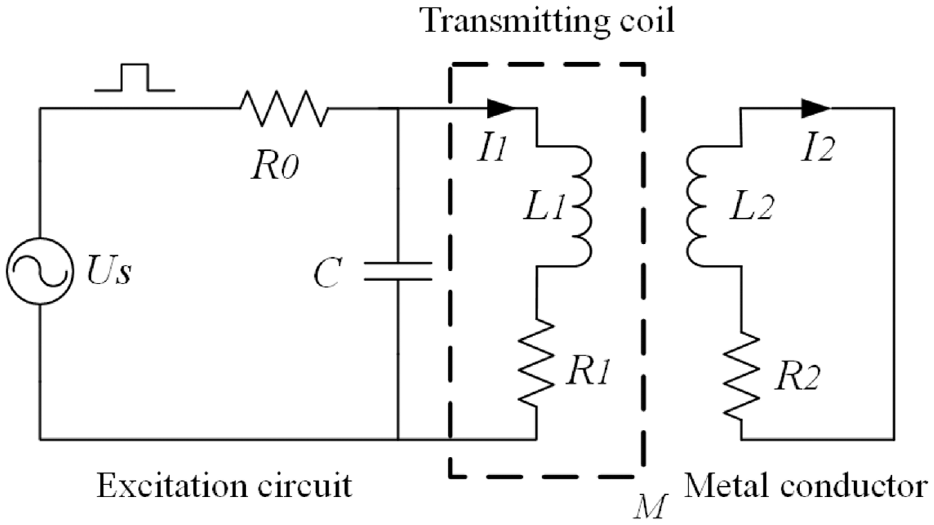
Coil loos model based on pulsed electromagnetic induction.
According to the equivalent circuit analysis and Thevenin’s theorem, the excitation circuit can be simplified as (Figure 2):
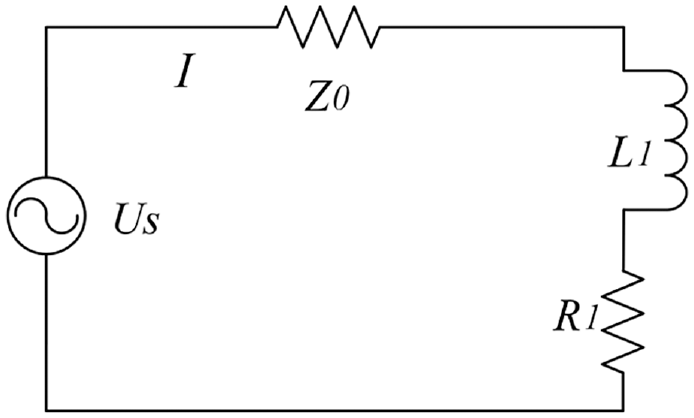
Simplified diagram of excitation circuit.
Then
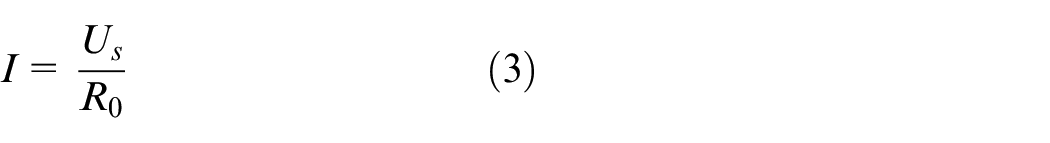
Then
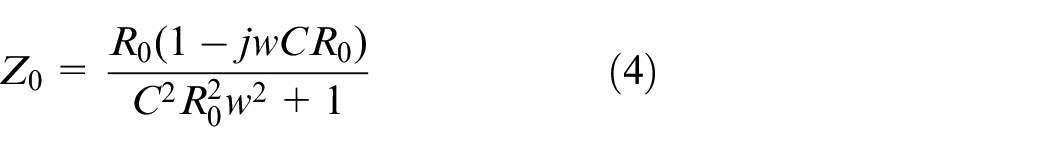
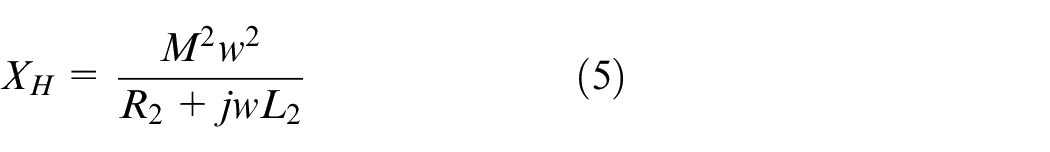
From the above formula, it can be obtained as follows:
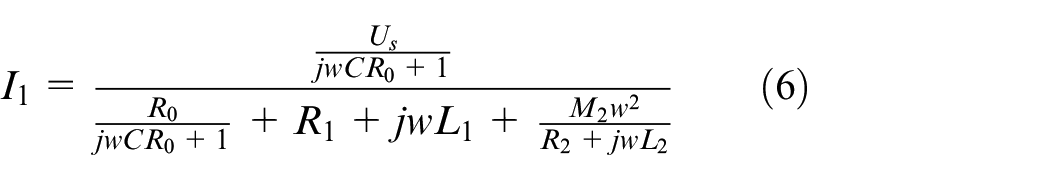
The induced voltage calculation formula of
After Laplace transform, it can be obtained as follows:
where
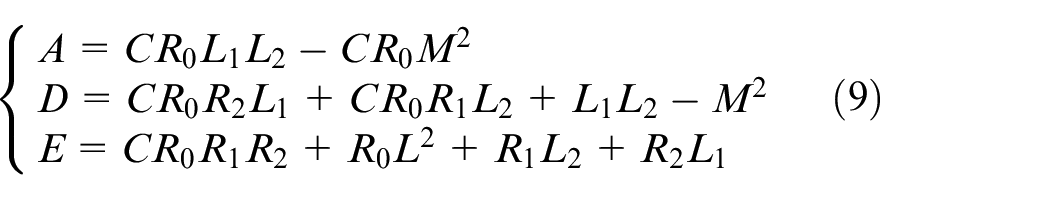
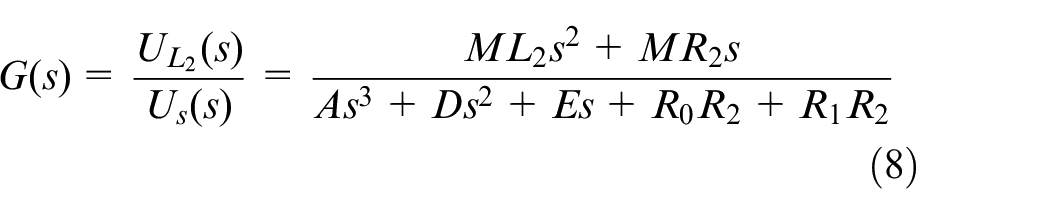
According to the above formula, the transfer function between the excitation voltage
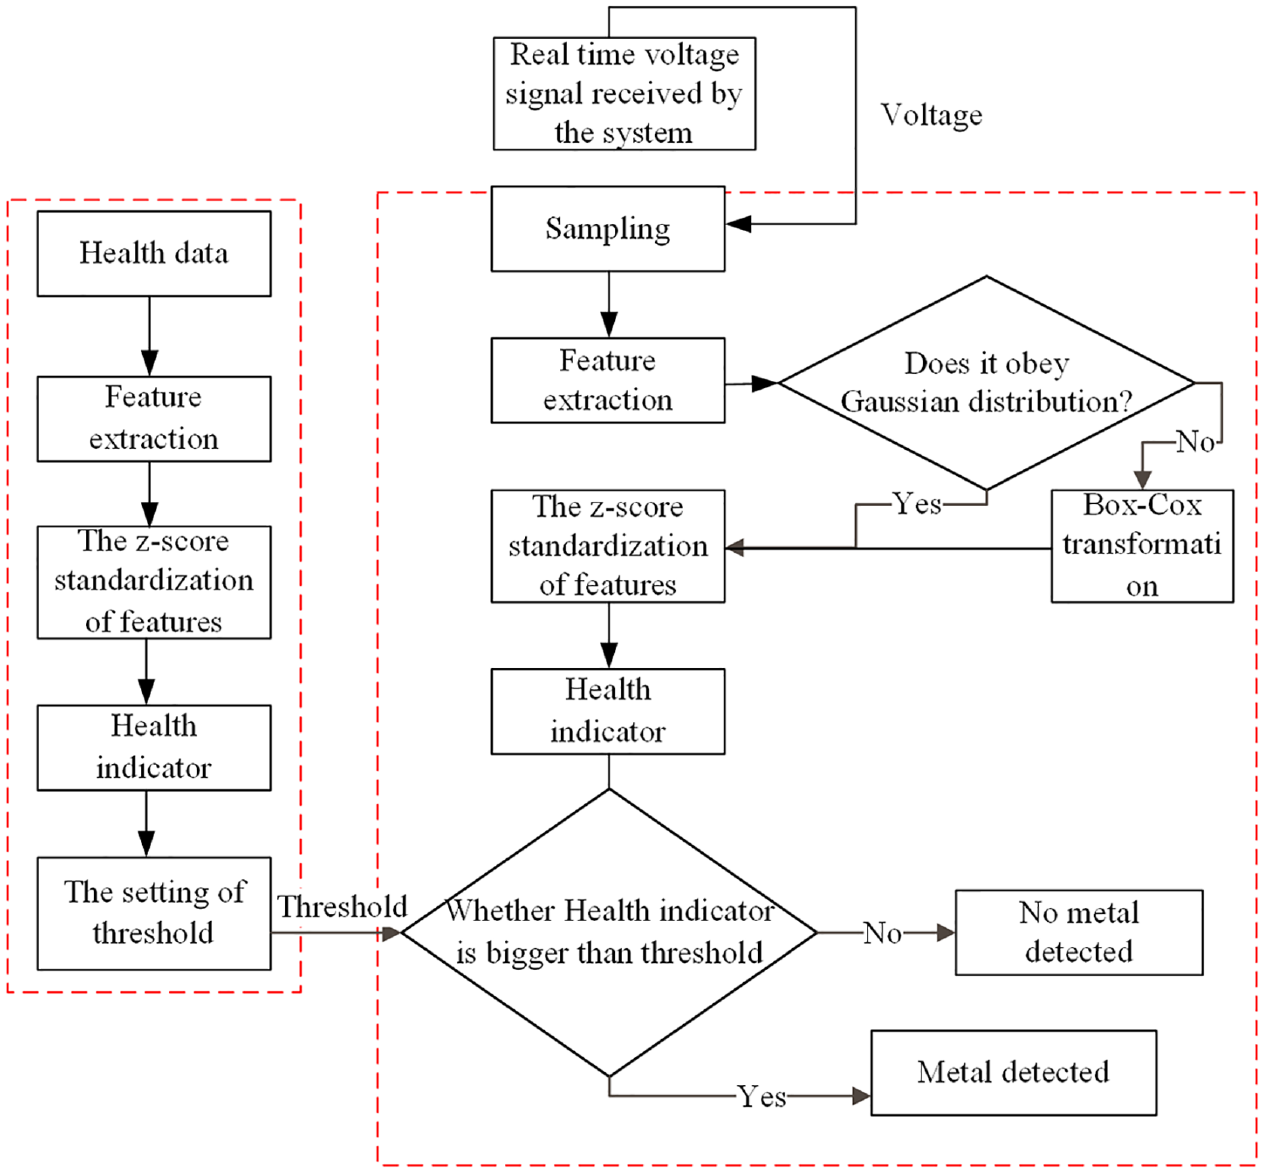
The metal detection system based on pulse electromagnetic induction mainly realizes the long-distance detection of metal by the analysis of signal characteristics. Through signal analysis, it can distinguish whether there is metal with eliminating interference. Around the main task of the detection system, the hardware circuit of the detection system is analyzed, as shown in Figure 3, it is the overall hardware design scheme of the pulsed electromagnetic induction metal detection system. The system generates pulse control signal to control the switch circuit, which controls the transmitter receiver integrated probe. When the transmitting circuit is connected with the transceiver integrated probe, the probe emits electromagnetic field, while the receiving circuit and the transceiver integrated probe open circuit; when the receiving circuit is connected with the transceiver integrated probe, the probe receives magnetic field signal, and the signal received by the receiving circuit is sent to the upper computer through signal conditioning and A/D sampling, which is convenient for signal analysis and processing.
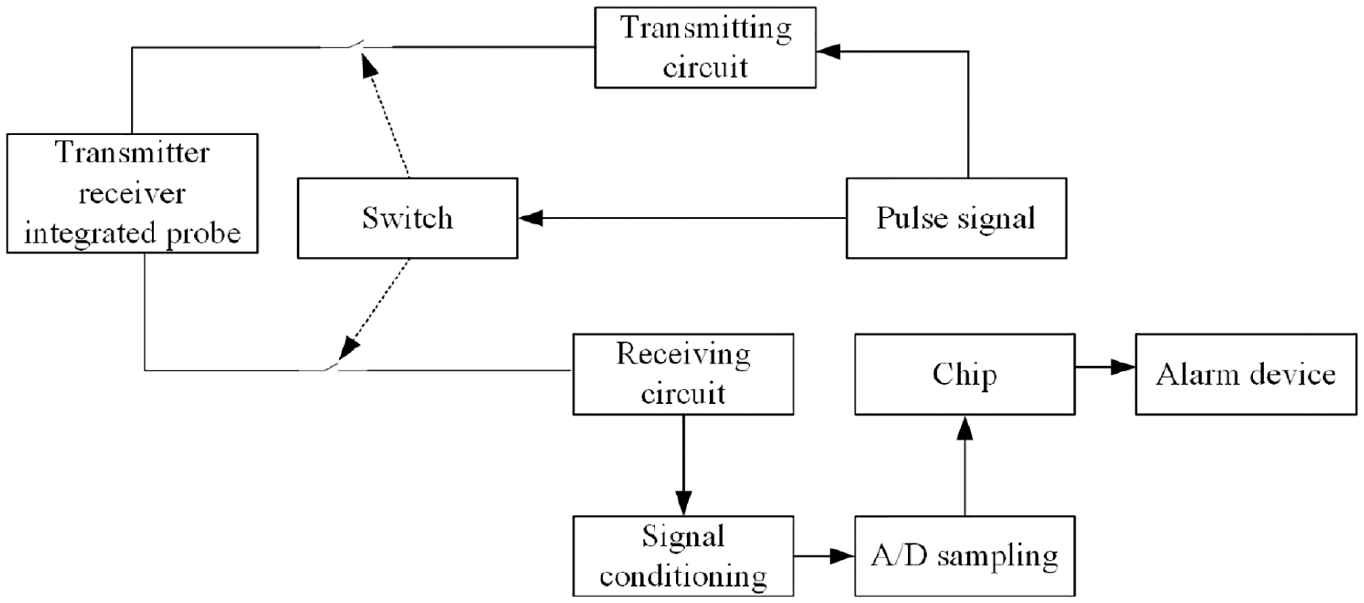
Hardware design of metal detection system based on pulse electromagnetic induction.
Finally, the main experimental devices used in the experiment are pulse power supply, transmitting coil, receiving coil, oscilloscope, and metal iron block, as shown in Figure 4.
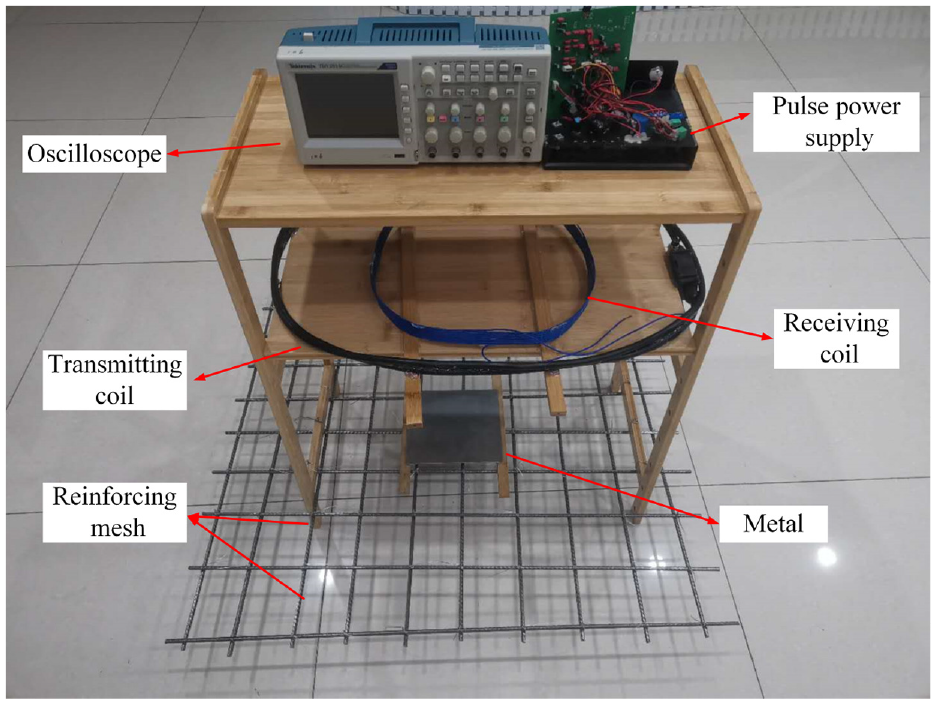
Simple experimental platform.
Using the experimental platform to measure the induced voltage data under the ideal environment and reinforced structure. This paper applies a metal detection anti-interference method based on the super sphere model to processing and analyzing induced voltage data. It can realize the metal detection under both the ideal environment and the interference of steel structure.
Anti-interference algorithm based on hypersphere model
Feature extraction
Signal feature extraction is a key link, which determines the advantages and disadvantages of signal processing algorithm to a certain extent. The original signal has multiple features. Only when the features are used for a specific purpose, the features can be divided into appropriate and inappropriate. When extracting features from the signal for metal detection, the extracted features must be helpful to judge whether there is metal in the detected environment. Feature extraction determines the reliability and accuracy of metal detection system to a certain extent.
The selection of signal features needs to be based on the characteristics of signal physical characteristics. The relationship between induced voltage and distance is analyzed below. For the detection system designed in this paper, the coupling coefficient between coils can be deduced from Neumann formula, and the calculation formula is as follows:
Where
According to Formula (10) and Formula (2), the coupling coefficient K is inversely related to the distance x, and the mutual inductance coefficient M is proportional to the coupling coefficient K. under the same current, the induced voltage is proportional to the mutual inductance coefficient. Therefore, when other conditions remain unchanged, the induced voltage is inversely related to the distance. That is, the farther the distance is, the smaller the induced voltage is.
The data obtained this time is the induced voltage received by the receiving coil. Therefore, in the case of monotonous change of distance, the change of data is monotonous. Therefore, when selecting features, the features that should be selected are monotonic change.
In general, when we study the monotonicity of a variable, we can draw a curve. When the research object changes obviously, we can directly observe it from the curve. However, in this system, especially when the distance gradually increases, these features are actually quite weak and difficult to distinguish directly. It is necessary to quantitatively analyze the monotonicity of features. It is more accurate and reliable to reflect the monotonicity of features through the size of specific values. In fact, Formula (11) can be used to quantify the monotonicity of features.
Where,
The value obtained by this formula is between 0 and 1. If the value is large, it means that the monotonicity is stronger, meaning that the overall trend can be regarded as monotonous and the fewer elements of
Feature standardization
Before the feature standardization, it need to be known whether the feature is Gaussian distribution clearly. While Jarque-Bera method can be used to test the Gaussian distribution of features, as shown in Formula (12). If it conforms to the Gaussian distribution, it can be standardized directly; if it does not conform to the Gaussian distribution, it can use Box-Cox transform to transform the non-Gaussian distribution of the feature into Gaussian distribution, and then standardize the feature. 17
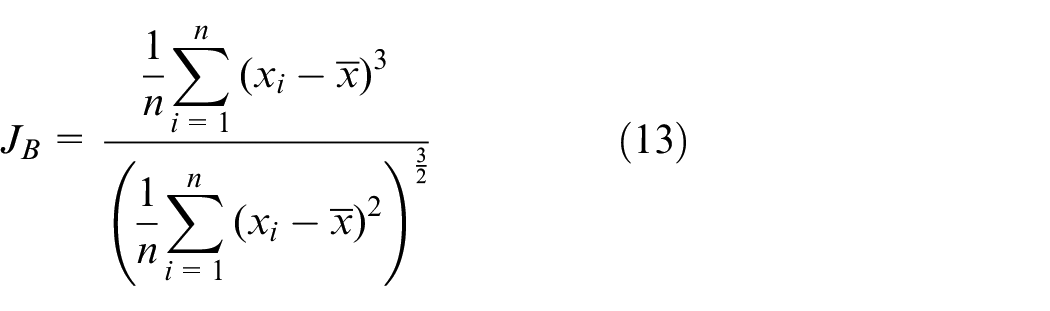
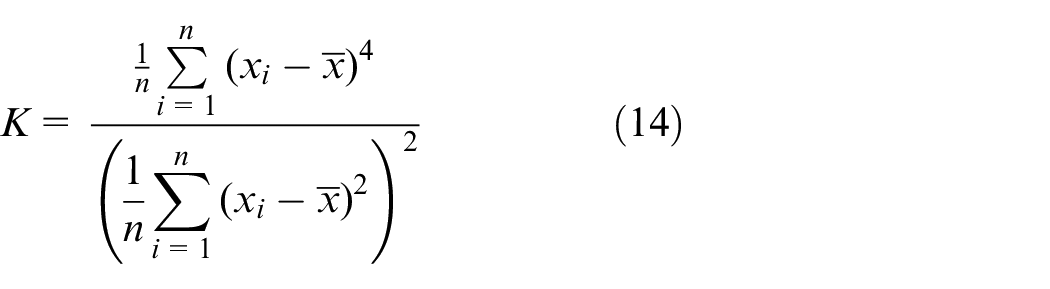
Where n is the sample size, S is the sample skewness, and K is the sample kurtosis. For large samples, the chi square distribution with two degrees of freedom is tested.
The sample skewness and kurtosis can be calculated by Formulas (13) and (14).
Where,
When extracting data features, in order to make the system evaluation results more reliable and accurate, multidimensional data features are usually extracted, and multidimensional data features construct a feature distribution space. Without preprocessing, the feature distribution space will be hyperellipsoid due to the difference of features in the space. 18 As shown in Figure 5, the hyperellipsoid distribution may cause misjudgment. For the convenience of analysis, the two dimensional graph of hyperellipsoid distribution is used. The green ellipse is the feature distribution of no metal near the system, that is, when the feature points are within the green ellipse, there is no target metal near the detection system. The red ellipse is the feature distribution of metal near the system, that is, when the feature points are within the red ellipse, it means that there is target metal near the detection system. Generally, the threshold value is a fixed value, which is represented by a blue dotted circle. In the figure, region 1 and region 2 were originally metal free characteristic regions, but they were divided beyond the threshold value, and the system would judge that there was metal, so there was a false positive evaluation error. Region 3 was originally a characteristic region with metal, but because it was within the threshold range, the system would judge that there was no metal, so there was a false negative evaluation error. In order to avoid the above two kinds of errors, we need to standardize the multi-dimensional data features. After the standardization, the multi-dimensional data features are distributed as hypersphere.
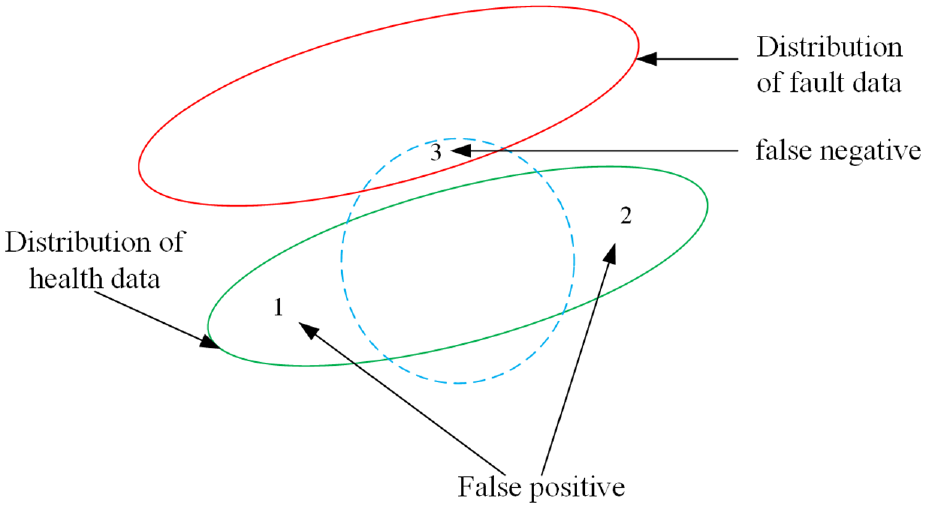
Schematic diagram of evaluation errors caused by hyperellipsoidal distribution.
The great development of machine learning also promotes the innovation of data standardization methods. After a certain period of development, there have been a variety of methods for feature standardization, including linear method, broken line method, and curve method. The standardization method has an important influence on the evaluation results of the system.
Among these standardization methods, Z-score standardization method is the most widely used, and its calculation formula is as follows 19 :
Where,
The setting of threshold
In order to judge whether there is metal, it is necessary to train according to the existing metal free data to obtain the threshold. The threshold value is usually a constant. When the processed test data value exceeds the threshold value, it is considered that the metal is detected. When the processed test data value is lower than the threshold value, it is considered that the system has not detected the metal.
When the features of the data are standardized, they are distributed as hyperspheres. According to the distribution characteristics of the hypersphere, the distance to the center of the sphere can be used to judge whether the sample is the data without metal or the data with metal near the detection coil. As shown in Figure 6, it is the distribution diagram of data characteristic hypersphere. The purple hypersphere distribution represents all the distribution of non-metallic data. When the threshold is set, it means that the samples distributed in the hypersphere model with the threshold radius are the data measured in the environment without metal, that is, the yellow part in the figure; outside the hypersphere model with the threshold radius, it is the data measured in the environment with metal. That is, the white area outside the hypersphere model. In the figure, the red point
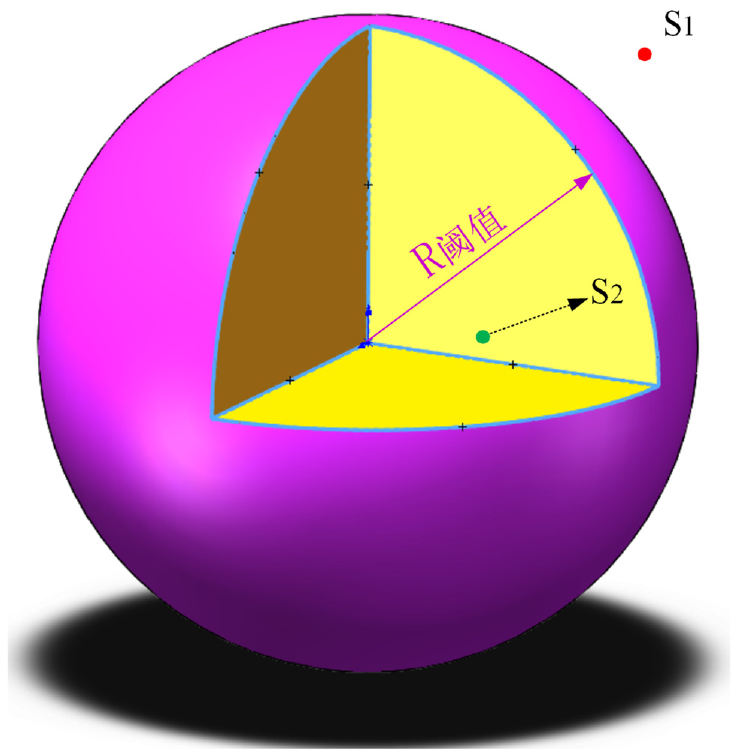
Three dimensional sketch map of hypersphere distribution.
The distance formula used in this paper is as follows:
The selection of threshold has an important impact on the evaluation results of the system. When the threshold is too large, it will affect the detection distance. When the metal is far away from the coil, it is not easy to detect, which affects the upper limit of the detection distance. When the threshold is too small, it will lead to a higher false alarm rate of the system. Therefore, the process of setting the threshold in this paper uses the confidence interval in statistics for reference and Figure 7 is the normal distribution diagram. 20
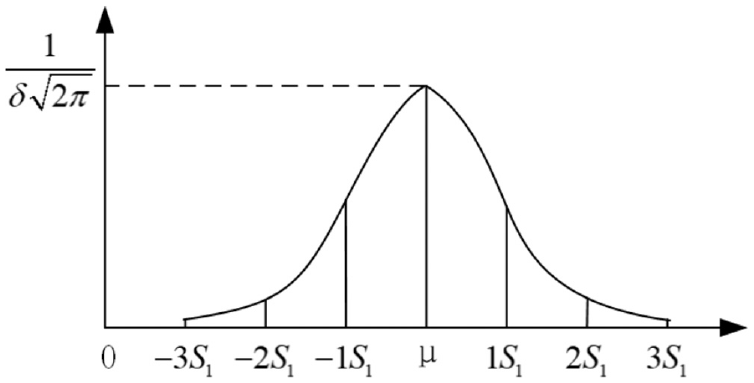
Normal distribution diagram.
The confidence interval refers to the range of the real value that may appear according to the estimated value under the given confidence level, which is usually centered on the estimated value. Since it is impossible to get all the data from the environment without metal, the data used to set the threshold is limited. However, it is necessary to set a threshold representing the total data from the environment without metal using limited sample data. Using the confidence interval thinking, we can freely set the threshold with high credibility according to the actual situation.
Suppose that the confidence level to be obtained is

Where
Suppose the standard deviation of the distance of n samples is
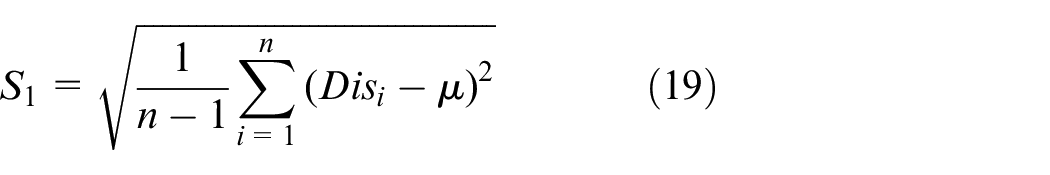
a and b can be respectively expressed as:
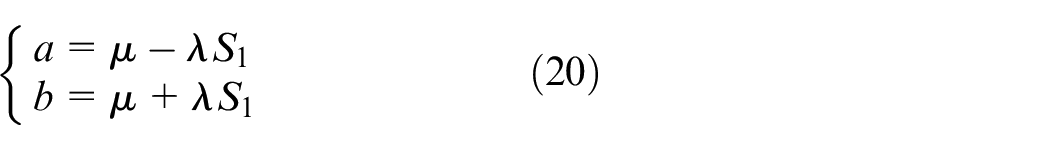
The threshold can be set as follows:

Formula (21) only takes the upper limit of the confidence interval as the threshold. This is because the greater the deviation of the feature points from the ball center, the greater the distance between the features. Therefore, the upper limit of the confidence interval is set as the threshold. Then we can get the decision logic of metal detection system as follows:

Where
Algorithm flow
Figure 8 is the flow chart of metal detection algorithm. The data from the environment without metal in the figure refers to that there is no target metal near the detection system. The threshold value is determined according to the data from the environment without metal, and the indicators of the collected test data are compared with the threshold value to obtain the experimental results.
The schematic diagram of algorithm flow design.
Experimental verification
Experimental test in ideal environment
The source of data
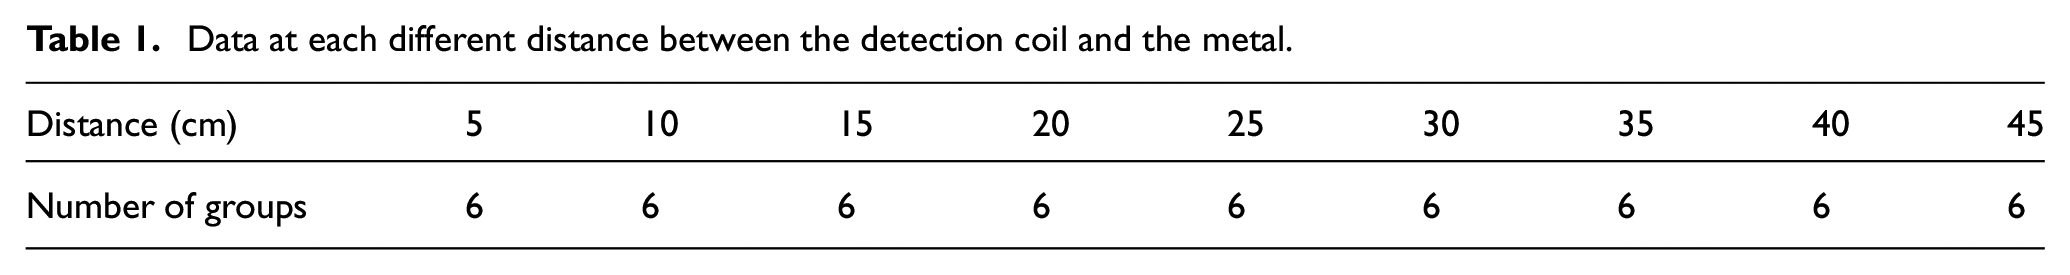
Forty-nine groups of data were collected under the environment without metal. Fifty-four groups of data were collected under the environment with metal, which is repeat sampling six groups at each different distance between the detection coil and the metal, as shown in Table 1.
Data at each different distance between the detection coil and the metal.
The selection of feature
In the third section, eight typical features used to analyze data are introduced, and the metal detection system studied in this paper is analyzed, and a feature selection method is proposed by judging the monotonicity of feature changing with distance.
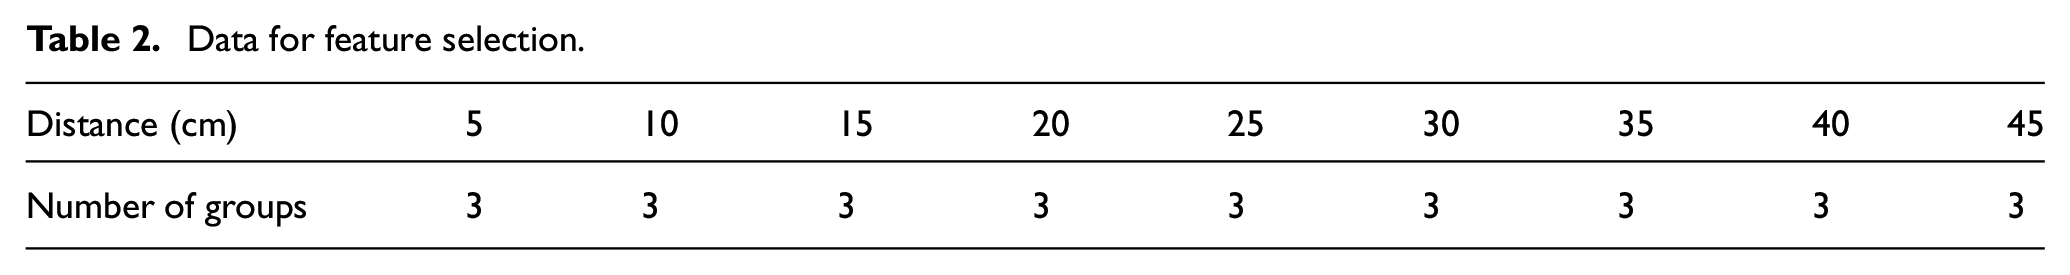
Firstly, from 54 groups of data with metal, three groups are randomly selected from six groups of data at each distance and labeled as Group-A, which is used to select the same features as the monotonicity of signal intensity varying with distance, as shown in Table 2.
Data for feature selection.
In the third chapter, eight typical features used to analyze data are introduced, and the metal detection system studied in this paper is analyzed, and a feature selection method is proposed by judging the monotonicity of feature changing with distance.
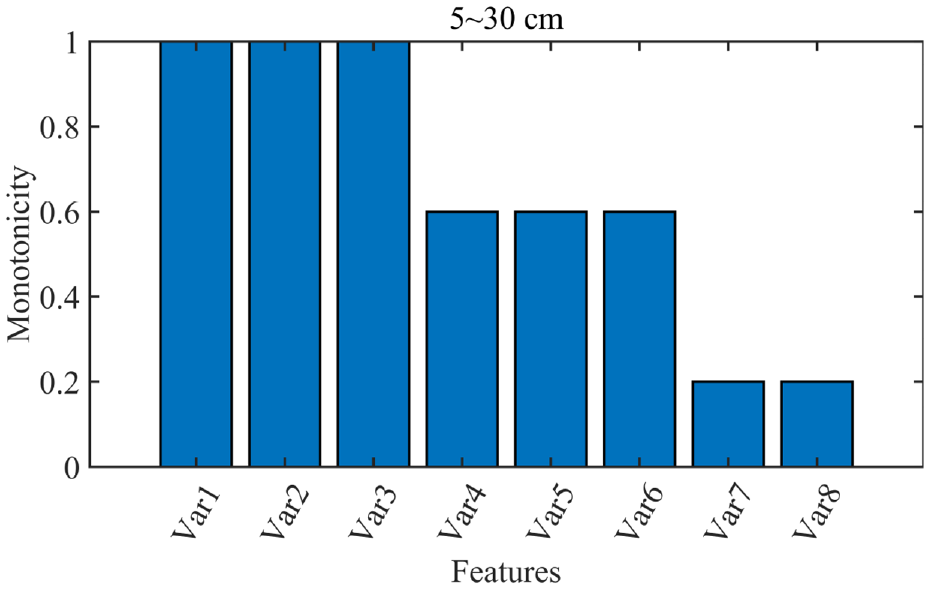
In order to reduce the influence of human factors and other factors as much as possible, we calculate the eigenvalues of 27 groups of data in Group-A, calculate the eight characteristic values of each group of data, and then take an average of the corresponding characteristic values of three groups of data in the same distance. In order to avoid occasional individual cases and comprehensively analyze the monotonicity of each feature with distance, the distance is divided into five groups, which are 5–25 cm, 5–30 cm, 5–35 cm, 5–40 cm, and 5–45 cm. Then the monotonicity of each feature is calculated by Formula (11) and the results are shown as Figures 9–13.
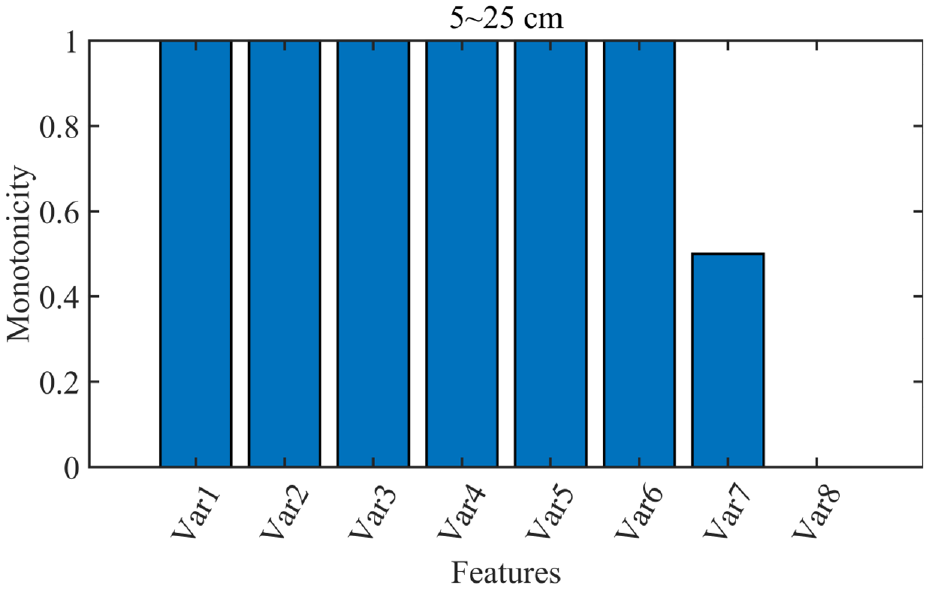
Schematic diagram of characteristic monotonicity measurement when the distance is 5~25 cm.
Schematic diagram of characteristic monotonicity measurement when the distance is 5~30 cm.
Schematic diagram of characteristic monotonicity measurement when the distance is 5~35 cm.
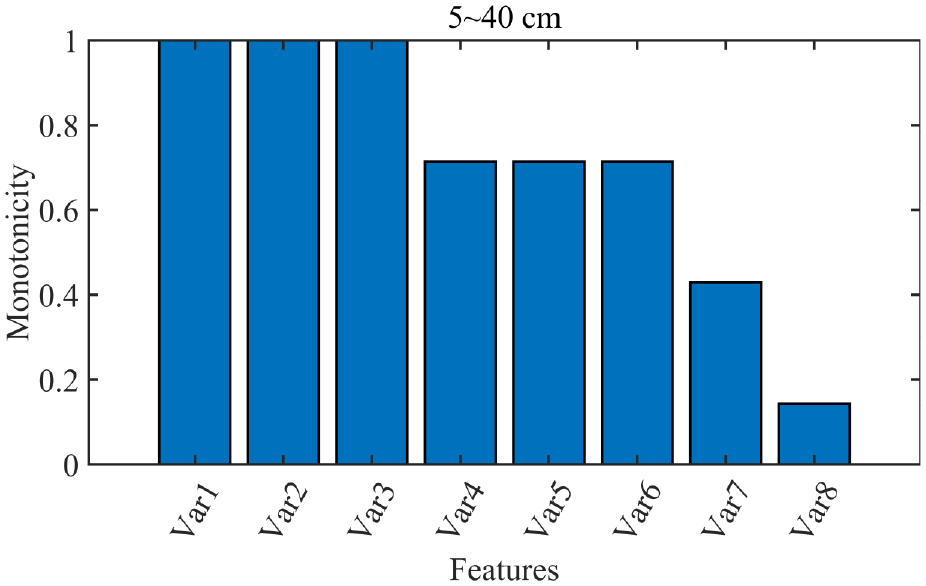
Schematic diagram of characteristic monotonicity measurement when the distance is 5~40 cm.
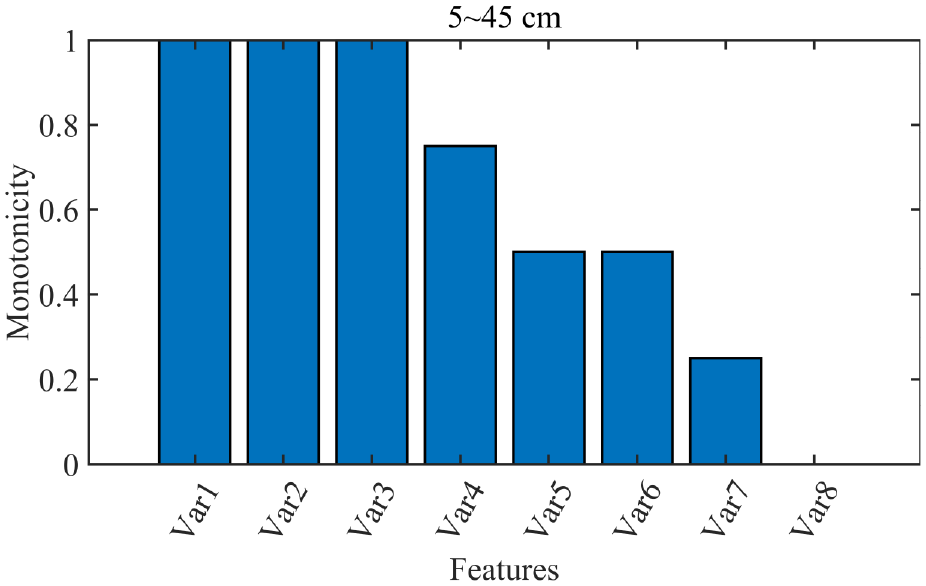
Schematic diagram of characteristic monotonicity measurement when the distance is 5~45 cm.
Var1, Var2, Var3, Var4, Var5, Var6, Var7, and Var8 respectively represent Standard Deviation, Root Mean Square, Variance, Mean, Minimum value, Maximum value, Range, and Peak-magnitude-to-RMS ratio.
The main characteristics of strong monotonicity are standard deviation, root mean square and variance, followed by average value, range and minimum value, then maximum value and finally peak factor. Because of the wave crest factor, in the five cases of the above analysis, the monotonicity measure value is 0 in three cases, that is, the change with the distance is not monotonic at all, and it is not 0 in two cases, but the monotonicity measure value in these two cases is low and the smallest of all features. Therefore, the feature of wave crest factor is eliminated. Therefore, the final feature selected for the analysis of data is seven features in addition to the peak factor.
The standardization of features
The feature selection has been completed according to the monotonicity measure of the feature. Therefore, the next step is to extract the selected data features. There are 49 groups of data from the environment without metal and 27 groups of Group-A data, in total 76 sets of data. Seven features of each group of data need to be extracted. The curve is drawn with the value of feature as ordinate and the serial number of data group as abscissa. It should be noted that when drawing, in Group-A data, the average value of three groups of data corresponding to each distance is taken as the characteristic value of the distance data. Therefore, when drawing, the graph is drawn by 58 points.
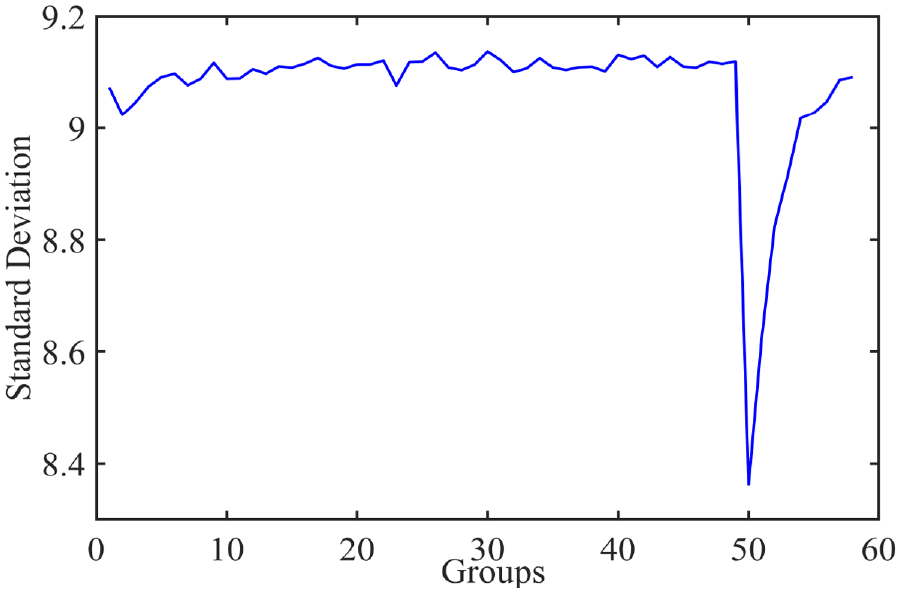
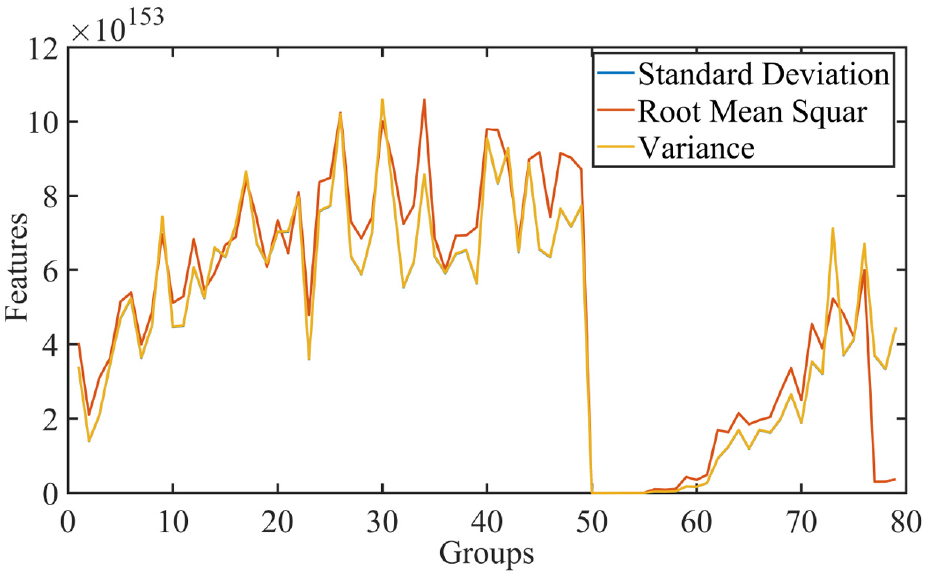
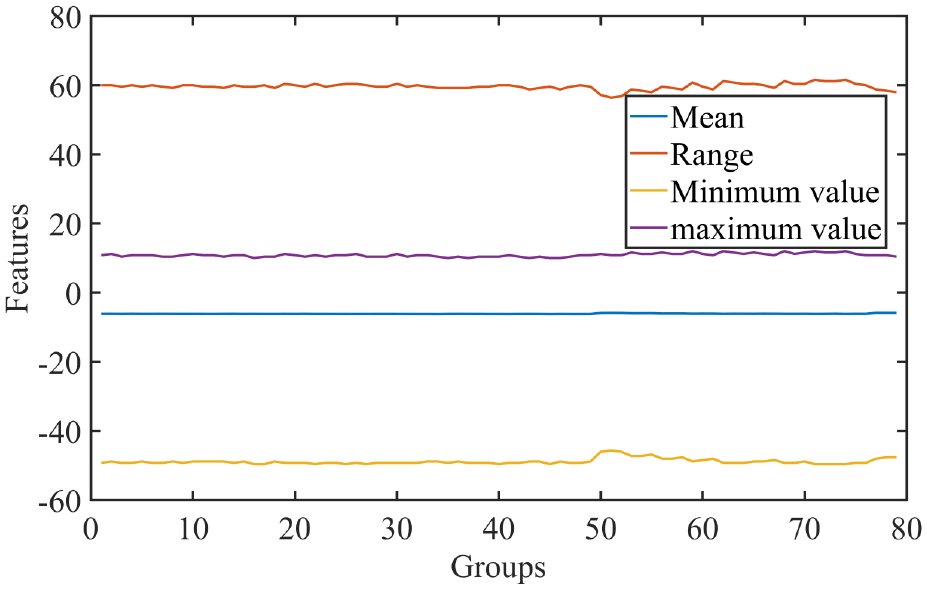
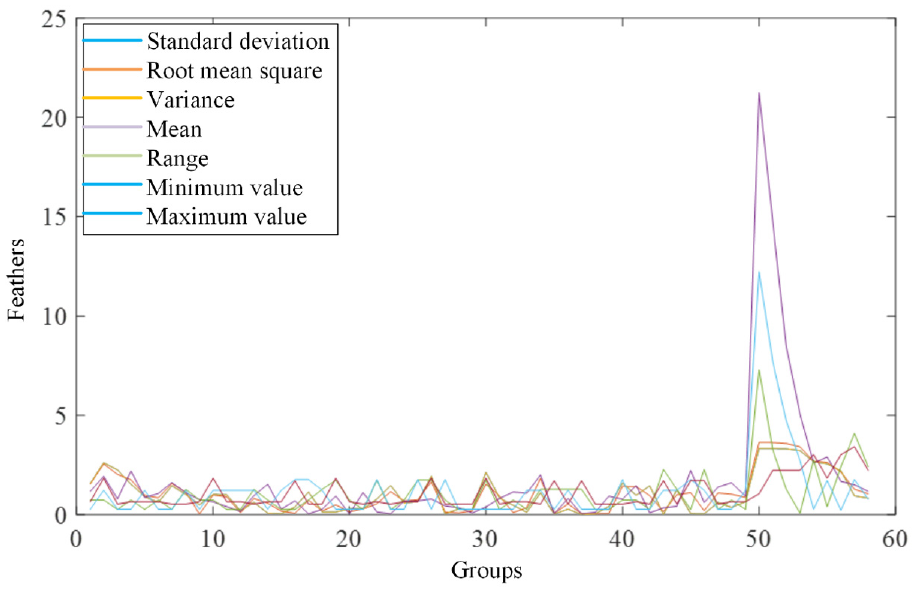
Figures 14–20 respectively describe the value size of each feature corresponding to each group of data. Combined with the graph and numerical analysis, we can know that the distribution range and variation range of the values of standard deviation, root mean square, and maximum are relatively consistent, but they are quite different from the other four features or among the other four features.
A schematic diagram of standard deviation.
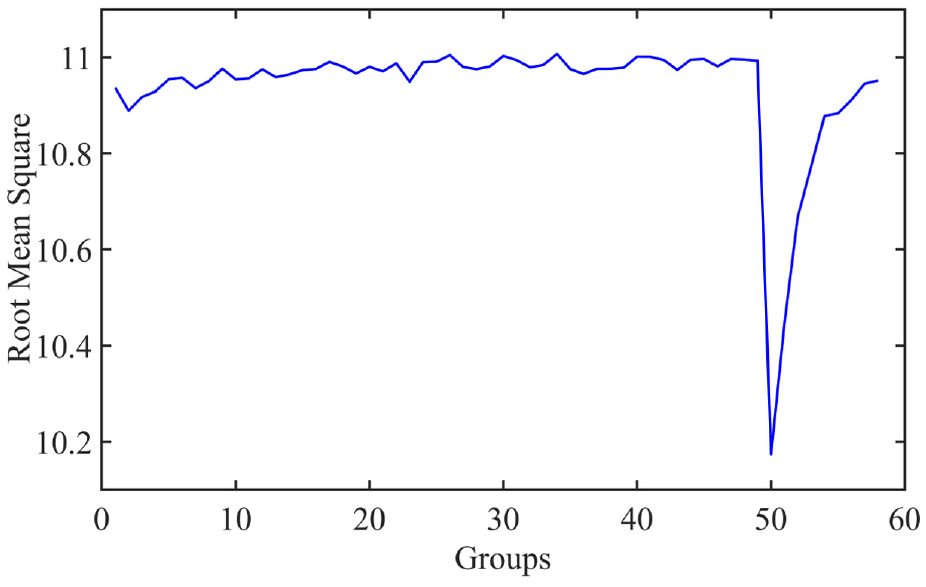
A schematic diagram of root mean square.
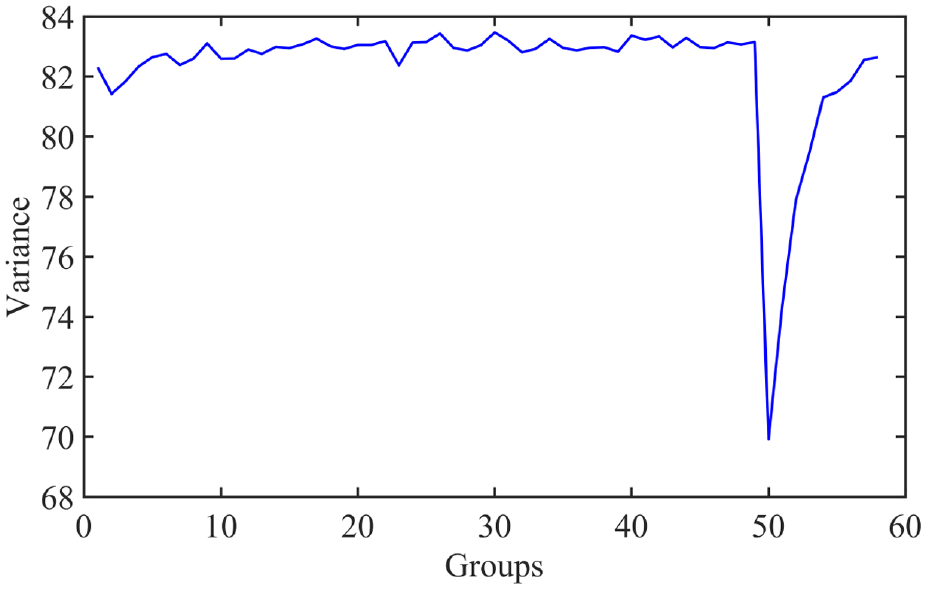
A schematic diagram of variance.
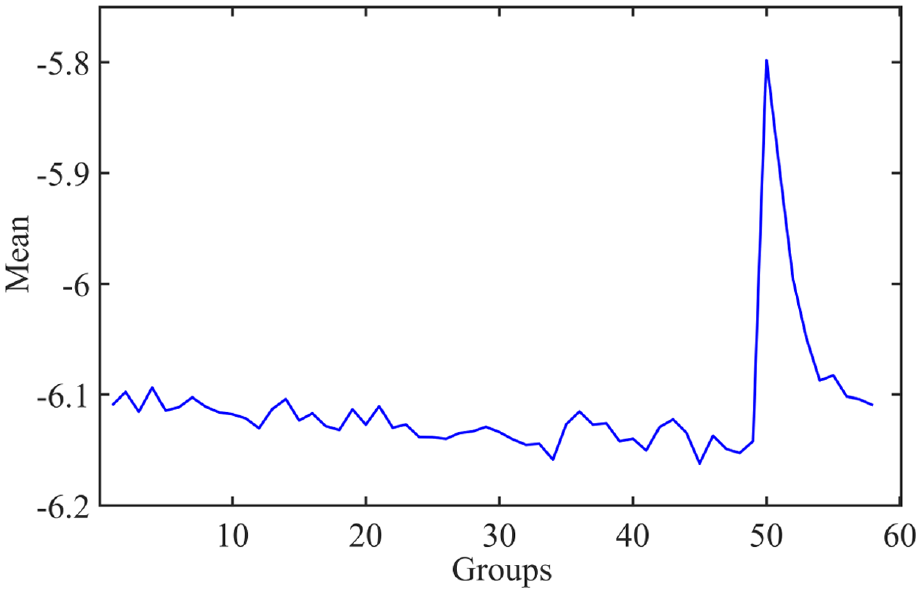
A schematic diagram of mean.
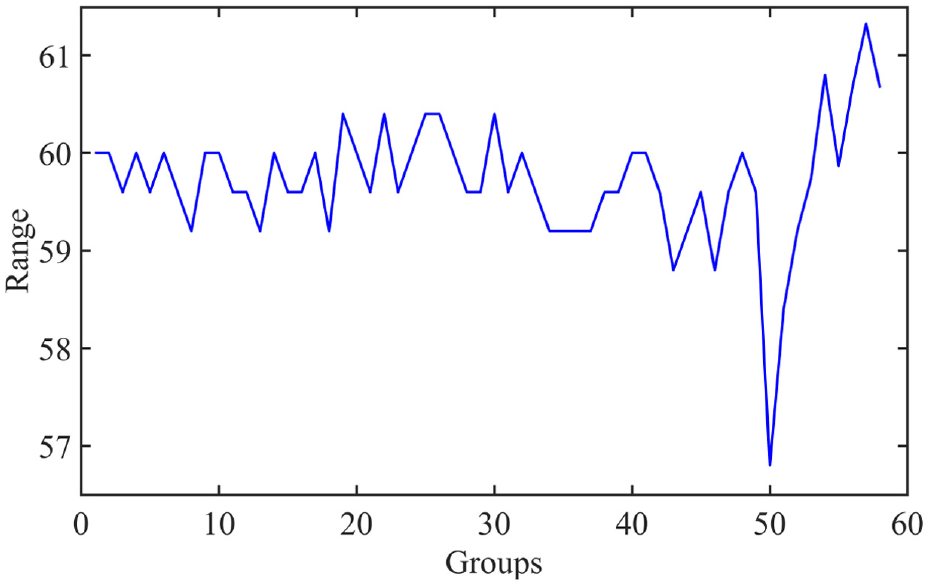
A schematic diagram of range.
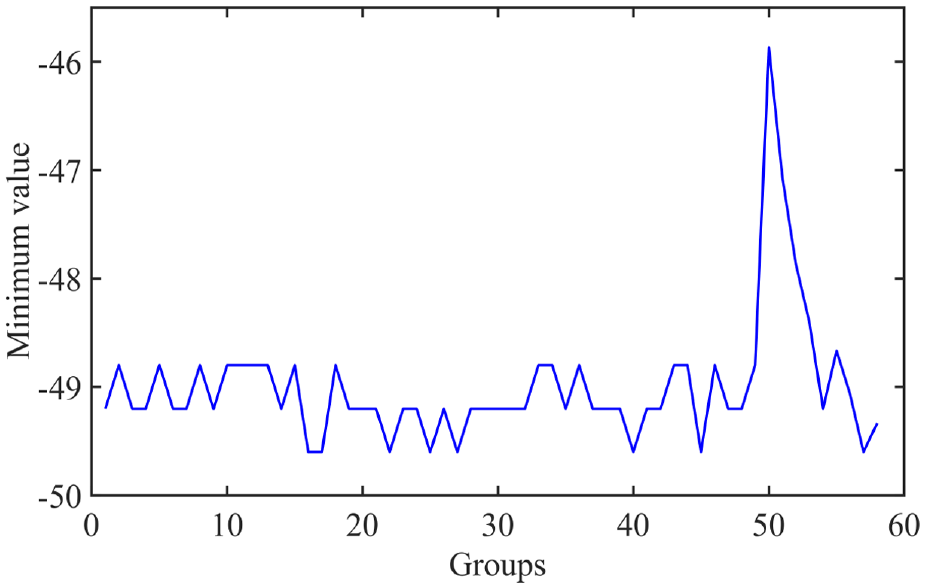
A schematic diagram of minimum value.
A schematic diagram of maximum value.
The extraction of features
According to the analysis in Section 4.2, we need to test the Gaussian distribution of the seven selected features.
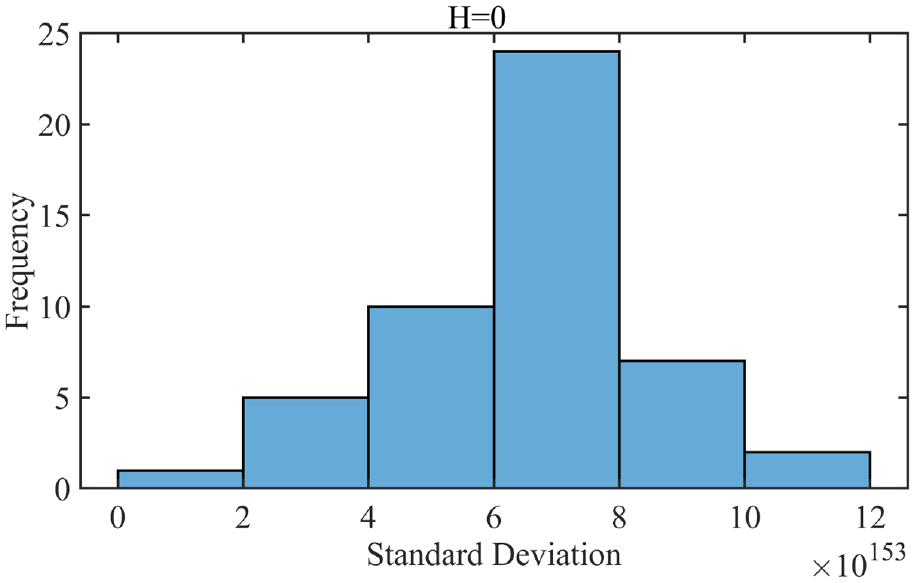
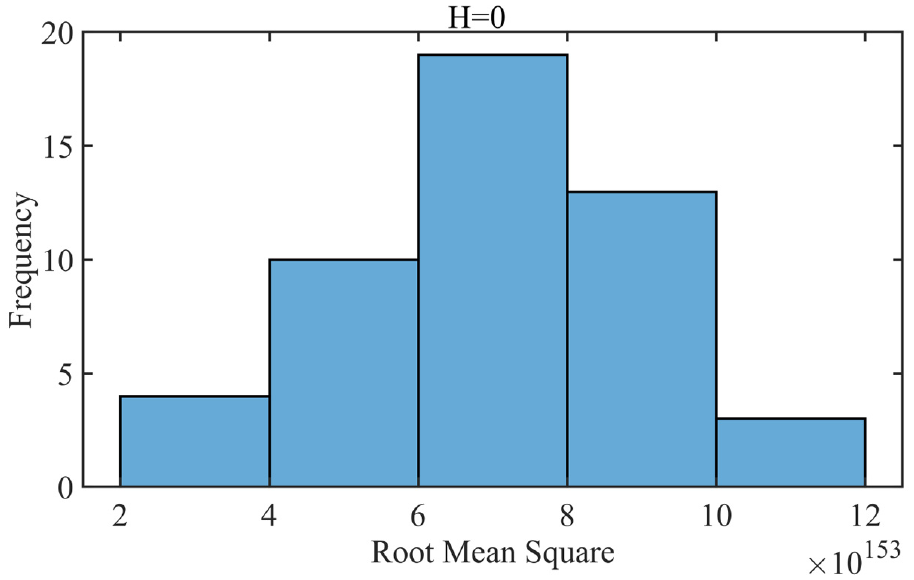
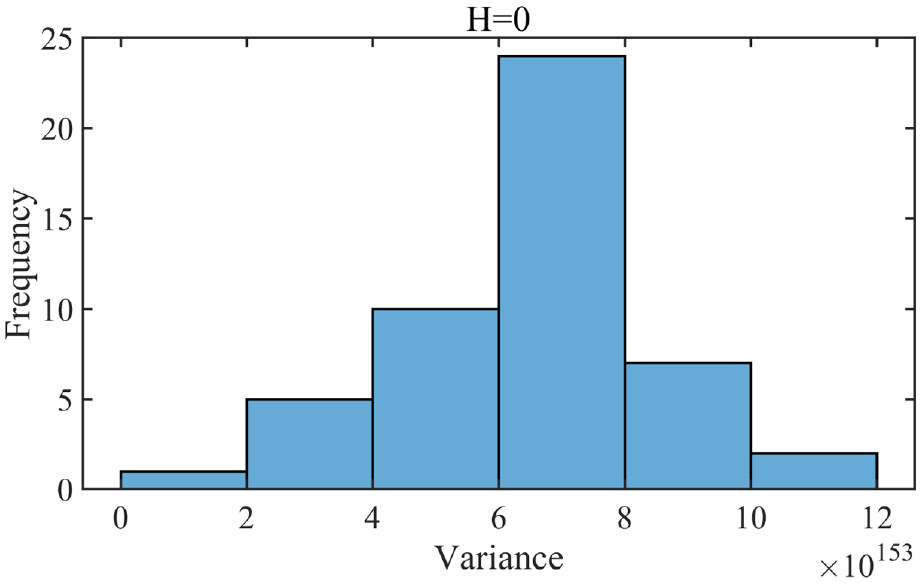
Figures 21–27 are the extracted histogram of each feature frequency distribution of 49 groups of data from the environment without metal, and test the feature distribution according to the Jarque BERA method to determine whether it is Gaussian distribution. The test result of each feature is marked at the top of the figure. If H = 1, the feature is non-Gaussian distribution, and if H = 0, the feature is Gaussian distribution. Standard deviation, root mean square and variance are non Gaussian distribution, and the other four are Gaussian distribution.
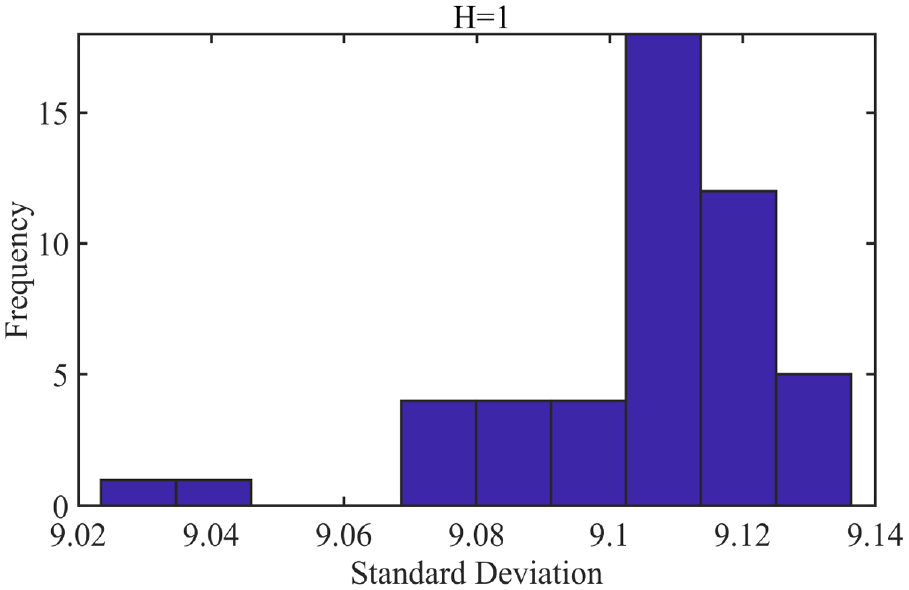
The frequency distribution histogram of standard deviation.
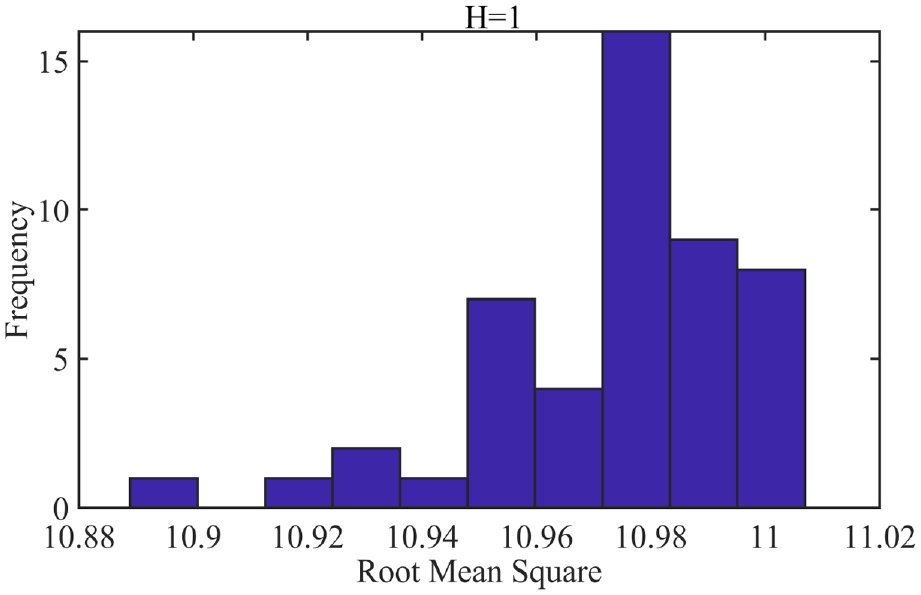
The frequency distribution histogram of root mean square.
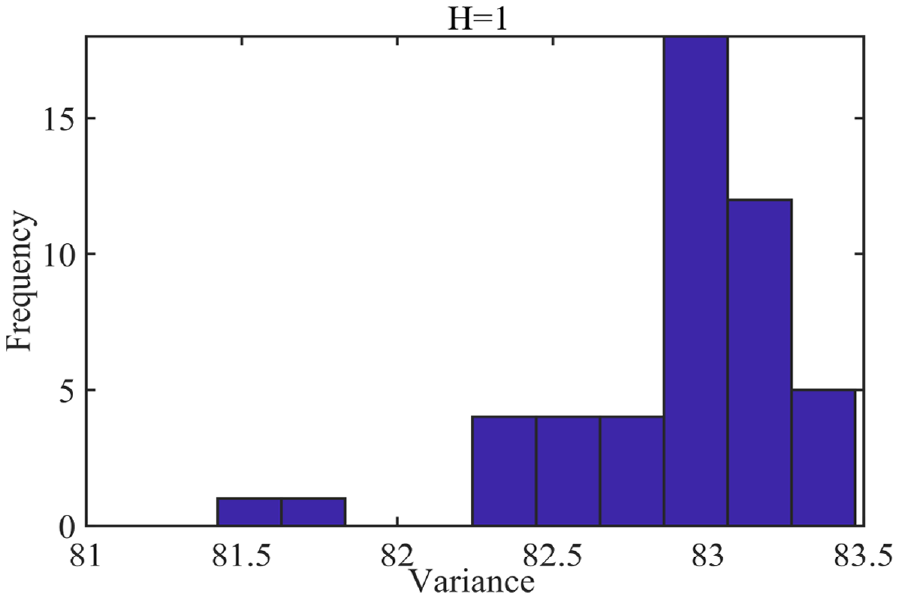
The frequency distribution histogram of variance.
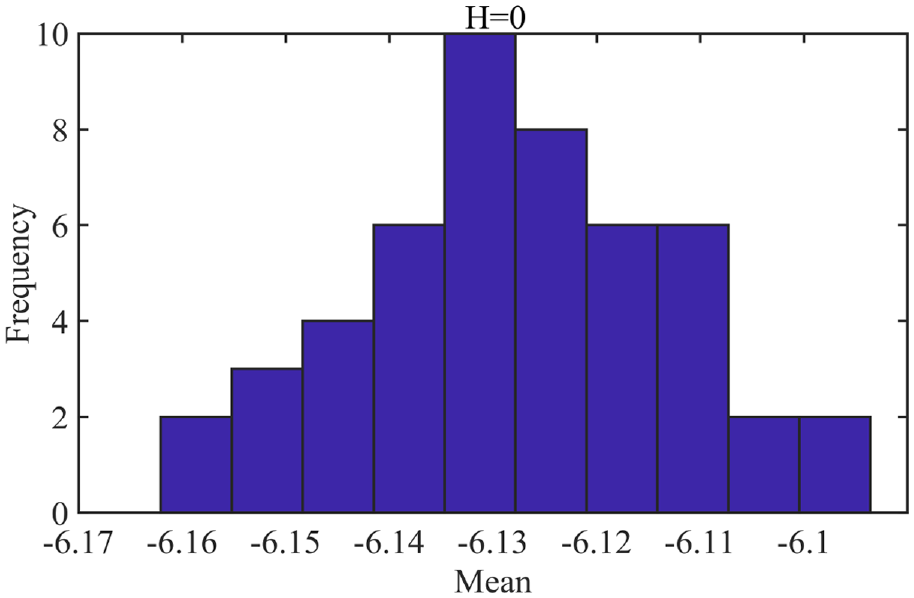
The frequency distribution histogram of mean.
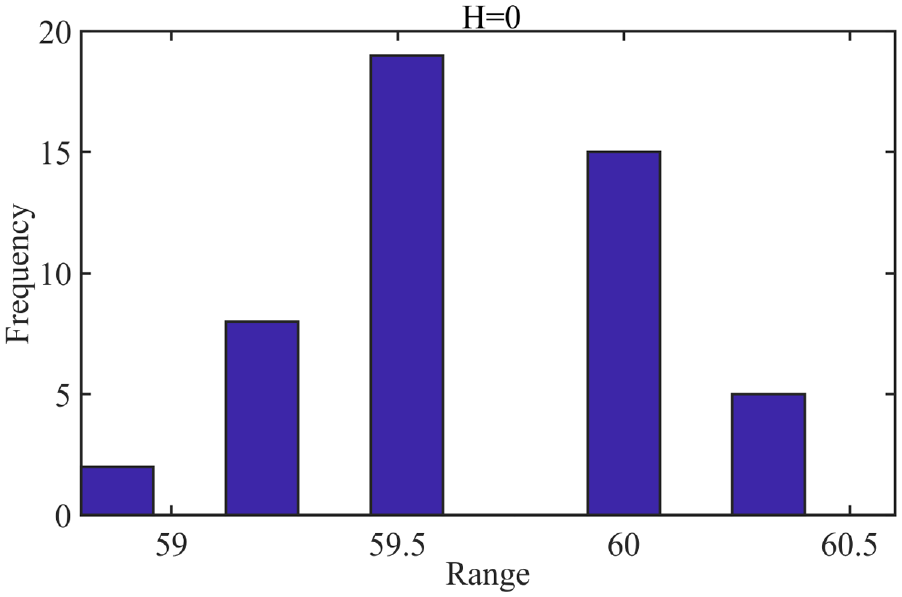
The frequency distribution histogram of range.
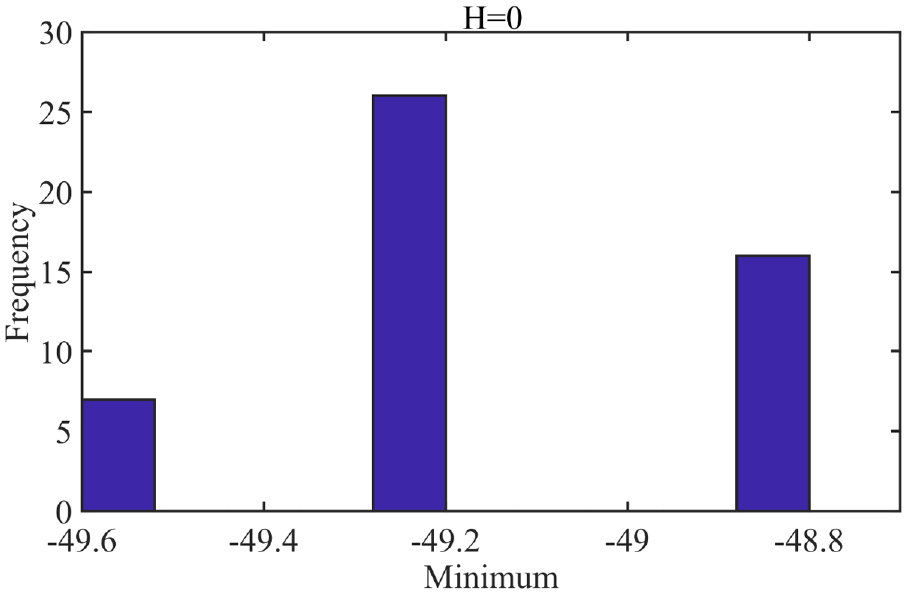
The frequency distribution histogram of minimum.
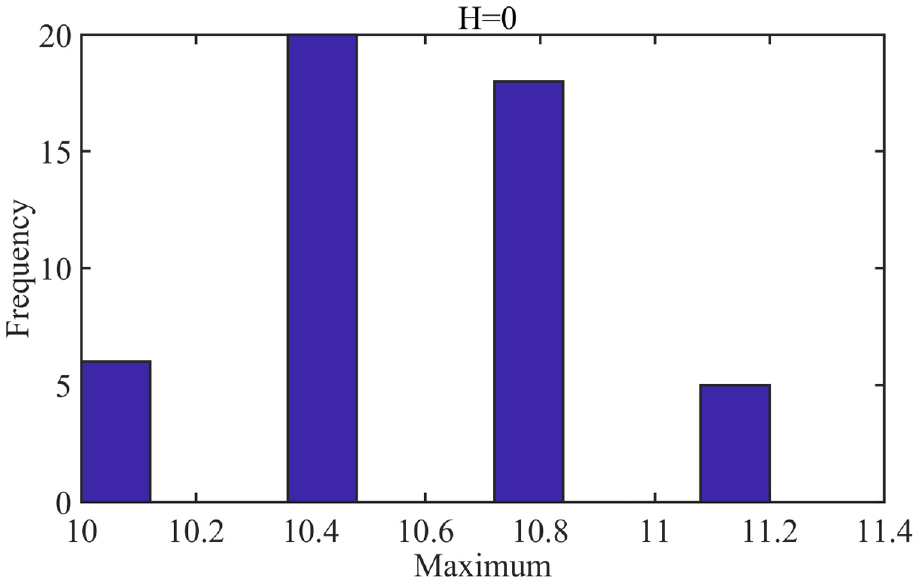
The frequency distribution histogram of maximun.
Therefore, it is necessary to transform the Standard Deviation, Root Mean Square, and Variance into Gaussian distribution. As shown in Figures 28–30, the frequency distribution histogram of Standard Deviation, Root Mean Square, and Variance after box Cox transformation is Gaussian distribution.
The frequency distribution histogram of standard deviation after Box-Cox transformation.
The frequency distribution histogram of root mean square after Box-Cox transformation.
The frequency distribution histogram of variance after Box-Cox transformation.
It has been analyzed in Section 3.2 that the large difference of features will inevitably lead to the hyper ellipsoid of feature distribution space, which will lead to two kinds of errors in system evaluation results. At the same time, due to the large difference of features, these features are not suitable to be drawn on one map, as shown in Figures 31 and 32. Because of the large difference, they cannot be drawn on one map. Moreover, from Figure 32, we can’t know the trend and details of the characteristic curve, which is not conducive to analysis. Therefore, it is very important to standardize the characteristics.
The schematic diagram of three features before standardization.
The schematic diagram of four features before standardization.
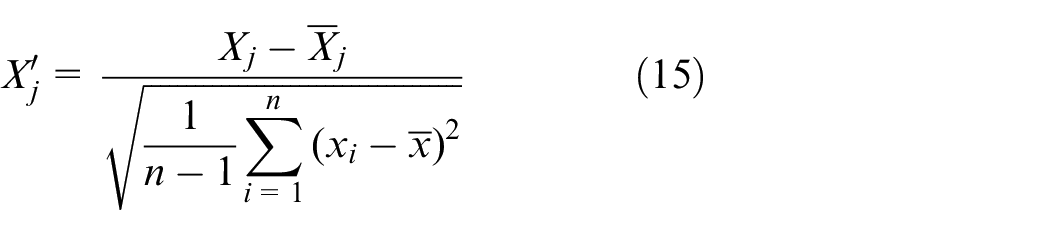
Calculate the average value and standard deviation of all groups of data of each feature, and standardize each characteristic value of each group of data according to the Formula (15), as shown in Figure 33, which is part of the results after the standardization of the features extracted in the previous paper. After standardization, the distribution space of eigenvalues will change from hyperellipsoid to hypersphere, avoiding false positive and false negative evaluation results.
The schematic diagram of some features after standardization.
The setting of threshold
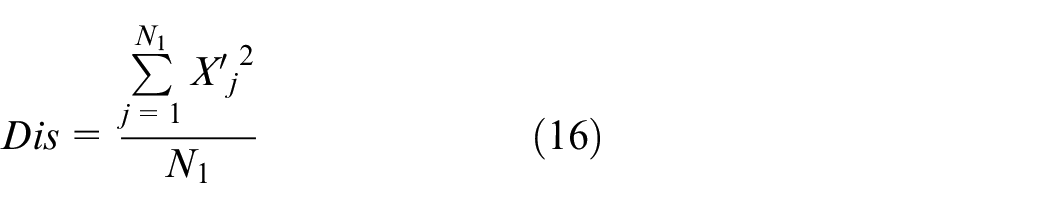
According to 49 groups of data from the environment without metal to determine the threshold, the previous paper has carried out feature extraction and feature standardization for 49 groups of data from the environment without metal, and substituted the standardized feature value into the Formula (16) to get the distance from the feature of each group of data to the average value, and draw the histogram, as shown in Figure 34.
The histogram of Euclidean distance of 49 groups data under the environment without metal.
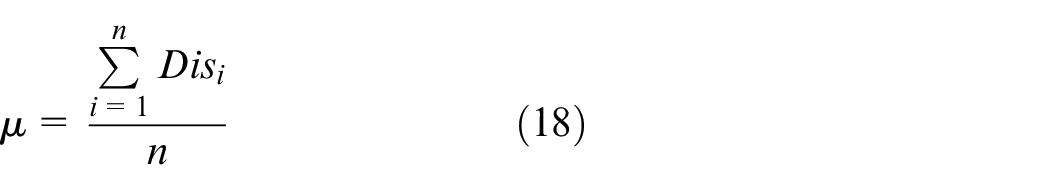
According to Formula (18), the mean of 49 groups of Euclidean distance is as follows:

According to Formula (19), the Standard Deviation of 49 groups of distances is as follows:

The confidence level is selected according to the actual situation. In this paper, the confidence level is selected as

Taking

Testing
In addition to Group-A data, there are 54 groups data with metal, and 27 groups of data are left, which are labeled as Group-B data. The algorithm is verified by Group-B data. Get the Euclidean distance of Group-B data. Since three groups of data are measured every 5 cm between the metal and the receiving coil, it is necessary to take the average value of the three groups of data as shown in the Table 3.
The Euclidean distance of features of Group-B data.
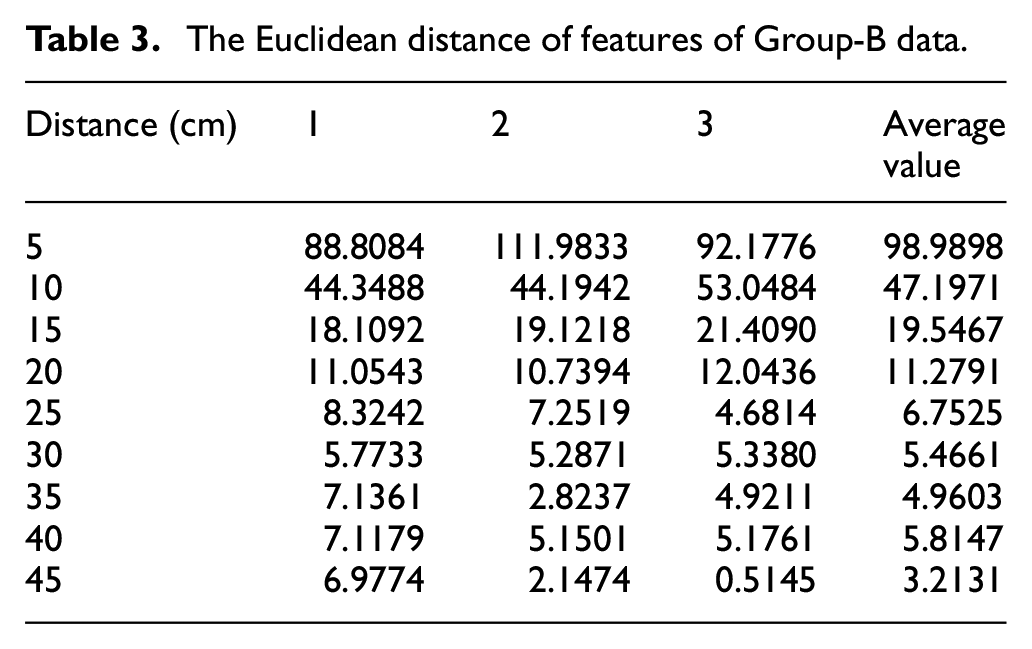
In fact, it can be seen from the table that when the distance is 5–40 cm, the value of Euclidean distance is as follows:

when the distance is 45 cm, the value of Euclidean distance is as follows:

It shows that when the distance is 5–40 cm, the system can effectively detect the presence of metal, but when the distance is more than 45 cm, the system can not detect the presence of metal.
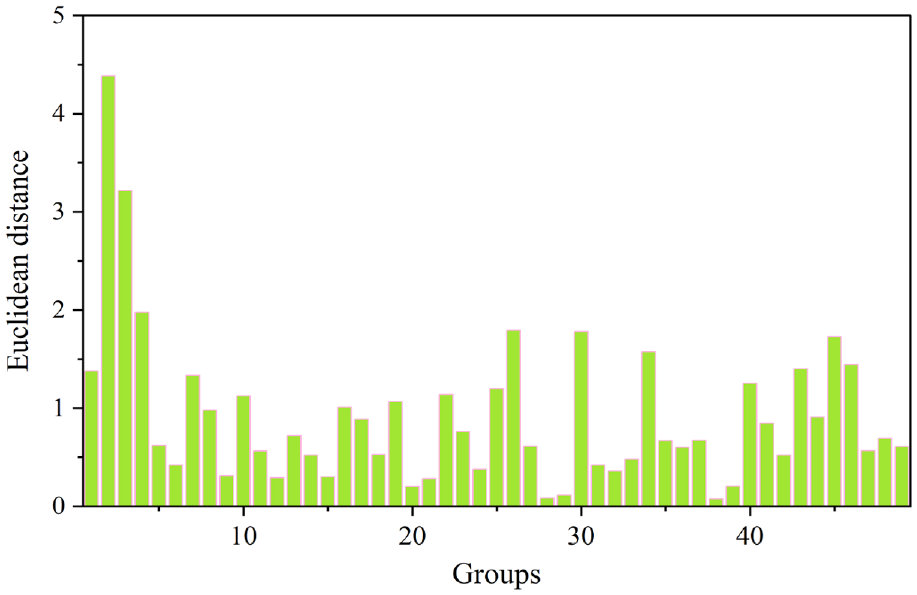
Draw 49 groups of data from the environment without metal and Group-B data on a graph to get the curve of distance, as shown in Figure 35. The blue solid line represents the change of the Euclidean distance. It can be clearly seen from the figure that the Euclidean distance is relatively small when there is no metal. When there is metal near the detection system, the Euclidean distance changes sharply. The closer the metal is to the detection system, the greater Euclidean distance, and the more it exceeds the threshold. But when the distance between the metal and the detection coil gradually becomes far away, the Euclidean distance decreases exponentially. From the enlarged picture of the black ellipse encircling the curve, we can see that the distance decreases and is lower than the threshold, indicating that the detection system can not detect the presence of metal after this distance. The orange dotted line represents the distance between the metal and the receiving coil. However, for the convenience of drawing, the default distance is 0. The red solid line is the threshold, which is the judgment basis for the detection of metal, but you can see the curve position surrounded by the ellipse. A point exceeds the threshold, but the point is the data from the environment without metal. Therefore, the system will make a judgment error, which is reasonable, because it uses the thinking of confidence interval to determine the threshold. The confidence level of the threshold set in the front is
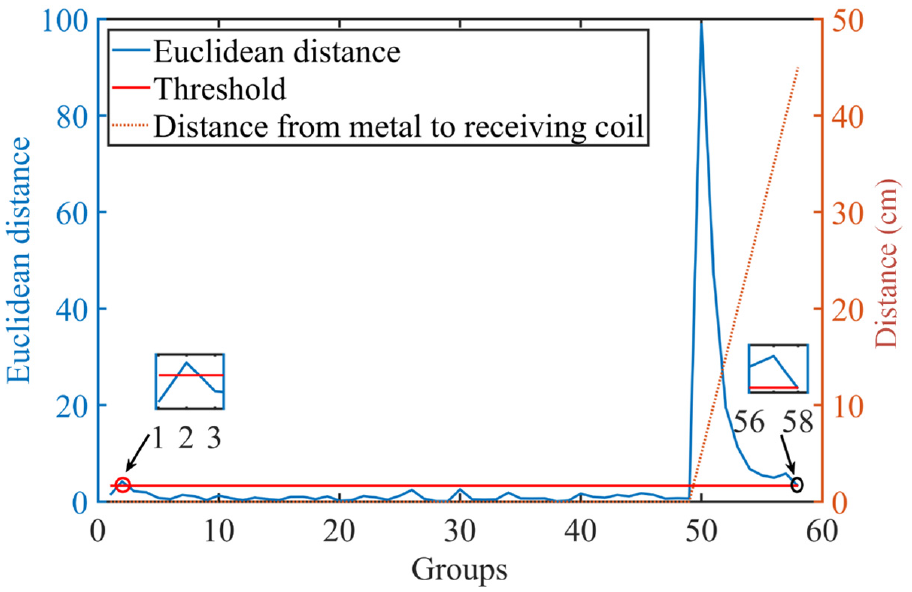
The chart of testing result.
It can be seen from the figure that Euclidean distance of only one point of data from the environment without metal is higher than the threshold, and the other points are below the threshold. The intersection position of the threshold curve and the Euclidean distance curve is between the 57th group data and the 58th group data, basically next to the 58th group data, and the corresponding distance between the metal and the receiving coil is 40 and 45 cm, which means that under the application of the algorithm, the farthest detection distance of the designed system is between 40 and 45 cm, which is basically 45 cm.
The detection when interfering by steeling structure in the environment
The above test environment is in the background of non steeling structure. In fact, the environment on the runway is relatively complex. The runway is built of reinforced concrete. In order to simulate the mine detection under the background of reinforced structure, One meter long steel mesh is specially made. As shown in Figure 4, the diameter of steel bars is 8 mm, crisscross vertically and horizontally, with an interval of 100 mm in the same direction, which is close to the reality. If the steel bar is placed 450 mm in the vertical direction of the off-line circle, the metal detection in this environment will be interfered. According to the previous metal detection process, take the reinforced structure as the detected target, and carry out the same detection, as shown in Figure 36.
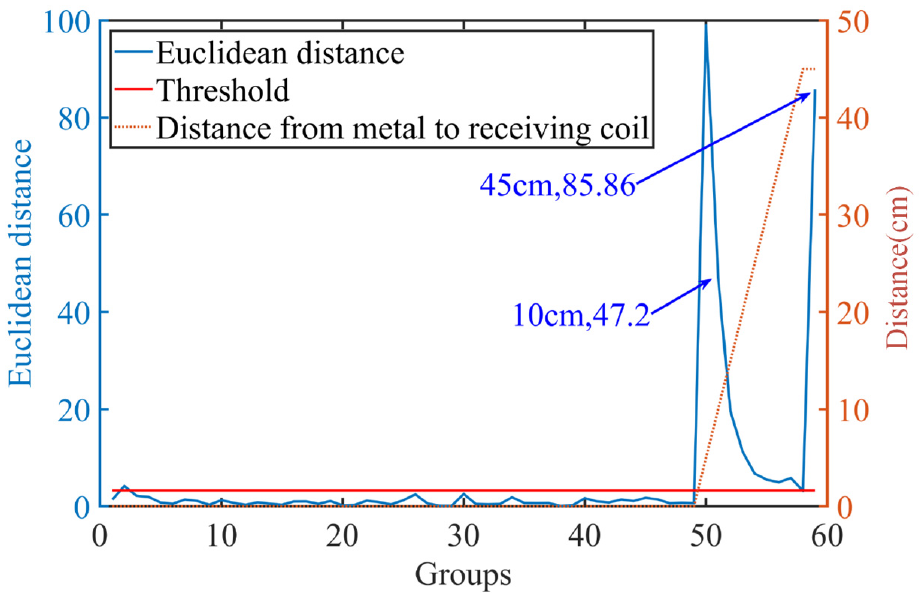
The detection when interfering by steeling structure in the environment.
In the figure, except for a group of additional detection data of steel structure at 45 cm, the others are the same as Figure 35. It can be seen that the Euclidean distance of the steel structure detection data at 45 cm is 85.86, while the Euclidean distance of the metal block detection data at 10 cm is 47.2, the former is larger than the latter, which indicates that if there is a steel structure, even if there is no metal target to be measured, the system will get the metal detection result by mistake. Therefore, in the background of reinforced structure, the detection of metal will produce greater interference.
Previously, the threshold setting of the algorithm was based on the environment without metal background. Now considering the background of reinforced structure, the threshold setting needs to be changed. All other steps and processing methods are consistent. The test results under the background of reinforced structure are obtained, as shown in Figure 37. Groups 1–49 are data without metal under reinforced structure. From the figure, we can see that the test results are ideal, and the distance of metal in different positions is above the threshold. Compared with Figure 35, we can find that the test effect is better under the background of reinforced structure. Therefore, experiments show that the algorithm based on hypersphere model and confidence interval can realize metal detection in the background of non reinforced structure and reinforced structure.
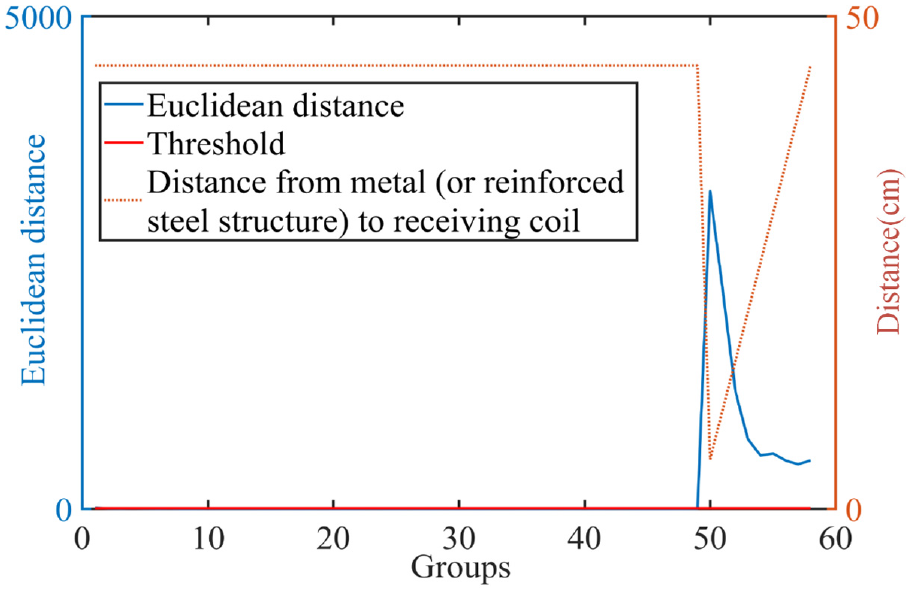
The diagram of test results under reinforced background structure.
Conclusion
Based on the research background of shallow metal detection, aiming at the problems of false alarm and missing report in complex shallow mine detection, a metal detection method based on transient electromagnetic method is studied. The detection coil structure and signal processing algorithm are analyzed. The test platform is built and verified by experiments. Firstly, the loos model of the coil system is established, and the transfer function with the excitation voltage source as the input signal and the induced voltage of the metal conductor as the output signal is derived. The system design of metal detection based on pulse electromagnetic induction is carried out, the overall design scheme of hardware circuit is determined, and a simple and feasible experimental platform is built according to the demand. The characteristics of the detection coil are analyzed, and the magnetic field distribution of different coil shapes is simulated. Aiming at the signal processing problem of metal detection in complex environment such as steel structure, a metal detection algorithm based on hypersphere model and confidence interval is applied. Finally, the experimental verification is carried out. The results show that the designed system is feasible for metal detection, and the applied signal processing algorithm is effective although interfering by steeling structure inthe environment.
Footnotes
CRediT authorship contribution statement
Shi Liang: Conceptualization of this study,Data curation. Zhiqiang Long: Funding. Ping Wang: Methodology, Writing – Original draft preparation. Jiewei Zeng: Software.
Declaration of conflicting interests
The author(s) declared no potential conflicts of interest with respect to the research, authorship, and/or publication of this article.
Funding
The author(s) disclosed receipt of the following financial support for the research, authorship, and/or publication of this article: This document is the results of the research project funded by the 13th Five-year National Key Research and Development Program of China under Grant 2016YFB1200601 and 2016YFB1200602.