
Abstract
For accelerating the technology development and facilitating the reliable operation of lithium-ion batteries, accurate prediction for battery remaining useful life (RUL) are both critical. In this paper, a 1D CNN-BiLSTM method is proposed to extract the RUL prediction of lithium-ion battery of Electric Vehicles (EVs). By using one dimensional convolutional neural network (1D CNN) and bidirectional long short-term memory (BiLSTM) neural network simultaneously, selecting the ELU activation function to apply to the convolutional layer, a hybrid neural network is proposed to improve the accuracy and stability of lithium-ion battery RUL prediction. The 1D CNN is used to fully mine the deep features of lithium-ion SOH data, while the BiLSTM is adopted to study the deep features in two directions, and the RUL prediction of lithium-ion battery is output through dense layer. To verify the effectiveness of the proposed method, the battery data of the National Aeronautics and Space Administration (NASA) are utilized to make some comparisons among the RNN model, LSTM model, BiLSTM model and hybrid neural network model. The results show that the hybrid one has higher generalization ability and prediction accuracy than the others.
Keywords
Introduction
EVs are clean vehicles powered by batteries. It combines new technology, new material and new energy.1–3 It will be one of the important means of transportation in the 21st century. At present, positive and negative materials are gradually developing to higher gram capacity, and their safety is gradually mature and improved. As a portable clean energy source, lithium-ion batteries have obvious advantages compared with other types of batteries such as nickel-metal hydride batteries and aluminate batteries, so they have been rapidly promoted. 4 Lithium-ion batteries have the advantages of small size, fast charging speed and high temperature resistance. They do not require full discharge to charge, do not have any adverse effects (no memory effect), and have a low self-discharge rate. It maintains power better when not in use and has a longer life cycle. These features have enabled it to be successfully applied in many fields and play an important role, such as consumer electronics products (mobile phones and laptops), hybrid and electric vehicles in the automotive industry, hybrid aircraft, renewable energy (solar and wind energy), and space exploration. So far, lithium-ion batteries have been recognized as the standard power source, and their performance has continued to improve. However, lithium-ion batteries undergo an irreversible process during the charge-discharge cycle, such as structural changes of the cathode materials, 5 oxidative decomposition of electrolytes and interface reactions, 6 dissolution of active substances, and precipitation of lithium metal. Lithium-ion batteries are used as the power supply system of electric vehicles, and incorporated bridge type superconducting fault current limit and dynamic voltage restorer are used to improve the power distribution system.7,8 The irreversible process can lead to continuous capacity fading and eventually battery failure. Failure to take safety measures such as replacement or maintenance in time can have catastrophic consequences. Therefore, accurate prediction of RUL for lithium-ion batteries can effectively avoid the irreversible effect of lithium-ion battery failure, 9 and provide important guarantee for the long-term safe operation of battery system.
The RUL prediction of lithium-ion battery can lay a foundation for the safety and reliability of the battery. It is not easy to directly measure the performance degradation of lithium-ion battery, so it is necessary to predict in advance and decide whether to replace the battery to avoid safety accidents. Deep learning is a step forward on the basis of machine learning.10–12 It also extracts knowledge from data to solve and analyze problems. Deep learning uses an artificial neural network algorithm, which allows discovery of intermediate representations to extend standard machine learning. Therefore, an artificial neural network algorithm is used in this paper to predict the RUL of lithium-ion batteries. Through deep learning (gaussian process, 13 support vector machine, 14 extreme learning machine, 15 nonlinear autoregressive neural network, 16 etc.), the health information in lithium-ion battery state data is mined to accurately predict RUL. In Patil et al. 17 a real-time RUL estimation method for lithium-ion battery based on the combination of classification and regression attributes of support vector machine learning technology is constructed. This method extracts key features from voltage and temperature distributions, and combines the classification and regression characteristics of support vector machine to predict the remaining battery power in real time. In Lyu et al. 18 present a new particle filter framework for RUL prediction of lead-acid batteries by incorporating electrochemical models of the battery. The methodology fills the research gap between battery mechanism and data-driven particle filter RUL prediction. LSTM neural network introduces the concept of memory cell states to retain important information in input data. In Zhang et al. 19 use the LSTM to analyze the long-term dependence between lithium-ion battery capacity data, the resilient mean square back-propagation is used as a neural network optimizer, and Dropout method is used to solve the phenomenon of training over-fitting. In Wang et al. 20 the RUL prediction model of lithium-ion battery stacked with LSTM is utilized, the relationship between lithium-ion battery capacity and cycle life is established, and the attention and gradient enhancement regression model are combined to continuously improve the prediction accuracy of the model. In Mao et al. 21 introduce a lithium-ion battery RUL prediction method based on long short term memory networks, combined with empirical mode decomposition, sliding time window, Gaussian or sine function, and Levenberg-Marquardt algorithm. In Hu and Yu 22 establish a multi-scale deep neural network based RUL prediction model for lithium-ion batteries. The data is decomposed using empirical pattern decomposition and correlation analysis. The deep belief network and LSTM are used to model the global trend and fluctuation data of lithium-ion battery energy change, and the final prediction results are integrated.
The above methods consider the time series characteristics of lithium-ion battery data, and use LSTM to analyze the time correlation between lithium-ion battery data, but LSTM can only process the data unidirectionally (from the past to the future), and the ability to analyze time series is relatively single. In this paper, a 1D CNN-BiLSTM hybrid neural network is designed to achieve lithium-ion battery RUL prediction, using BiLSTM (bidirectional analysis data) to improve LSTM, and combining with 1D CNN to improve the generalization ability of the prediction model. The experiments show that this method has high prediction accuracy and stability.
The main contribution of the study can be attributed to the following two aspects:
In order to improve the prediction stability of the neural network, 1D CNN is used to extract the deep features of the lithium-ion battery data, and the feature information of the input data is fully utilized.
Due to the time series characteristics of battery data, we choose BiLSTM neural network to predict the change trend of SOH of lithium-ion battery. BiLSTM has the ability of memory, can effectively retain the important information of historical input, so as to analyze the long-term correlation between data, and has high prediction accuracy.
From the practical application, we set the prediction point and estimate the numerical change curve of lithium battery capacity after the prediction point by training the lithium battery data before the prediction point.
The rest of this paper is organized as follows. The section 2 describes the introduces the object and content of this paper. The section 3 introduces the structure of 1D CNN-BiLSTM hybrid neural network. In the section 4, the 1D CNN-BiLSTM model is introduced, and the prediction experiment and analysis are carried out using NASA lithium-ion battery data. Finally, the conclusion of this paper is given in the section 5.
Problem statement
Lithium-ion battery is a kind of chemical battery which depends on lithium-ions shuttling between the positive and negative electrodes to achieve the purpose of charging and discharging. The main components include: positive electrode, negative electrode, electrolyte, and separator (for separating the positive and negative electrodes), as shown in Figure 1.
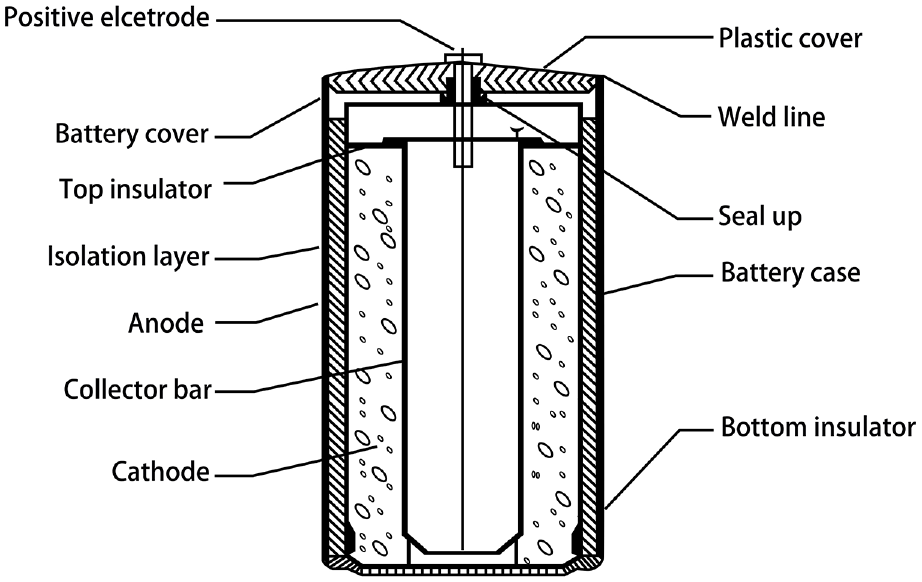
Structure diagram of lithium-ion battery.
The RUL refers to the number of charge-discharge cycles required from the value of current state of Health (SOH) to the failure threshold (SOH reduced to 0.7) after a certain charge-discharge process, as shown in equation(1). Battery cycle refers to a complete charge- discharge cycle, and the number of cycles is a calculation method of the charge-discharge cycle. When the battery reaches a complete charge-discharge cycle, the number of cycles will increase once.

where, the end of life (EOL) of lithium-ion battery is defined as the number of cycles when the SOH of lithium-ion battery first drops to the specified failure threshold,
The SOH is used as a reference indicator for judging the performance degradation of lithium-ion batteries, 23 which can be characterized by physical quantities such as lithium-ion battery capacity, power, lithium-ion battery internal resistance, lithium-ion battery cycles, and lithium-ion battery peak power. The capacity of lithium-ion batteries has a good tendency to continue to decay. The capacity is an important parameter directly characterizing the current energy storage capacity of lithium-ion battery, so it is widely used as a health indicator for RUL prediction of lithium-ion batteries. In this paper, the ratio of the current lithium-ion battery capacity to the initial capacity is selected as the SOH definition standard. The calculation of SOH is as in equation(2).

where,
Therefore, according to the time series characteristics of the battery, we need to build a neural network to predict the change of battery capacity with the number of cycles, and use the existing historical data to predict and analyze the future battery state.
Hybrid neural network
CNN is a kind of deep feedforward neural network, which is specialized in processing data with network structure. 24 It has the ability of feature extraction and weight sharing. CNN includes 3D CNN, 2D CNN, and 1D CNN, the differences are as follows:
By adding the dimension of time (continuous frames) to the input of the 3D CNN, the neural network can simultaneously extract temporal and spatial features for behavior recognition and video processing.
2D CNN is commonly used in the field of computer vision and image processing (in video processing, each frame of image is identified by CNN, without considering the information of time dimension).
1D CNN is commonly used in the field of sequence models and natural language processing. Because the capacity data of batteries is one-dimensional time series data, 1D-CNN is used.
Under the same network structure parameters, the computational complexity of 1D CNN is lower than that of 2D CNN and 3D CNN.
It can be seen from the above that 1D CNN is suitable for feature extraction of time series (can be regarded as a one-dimensional network on the time axis), 1D CNN structure is shown in Figure 2.
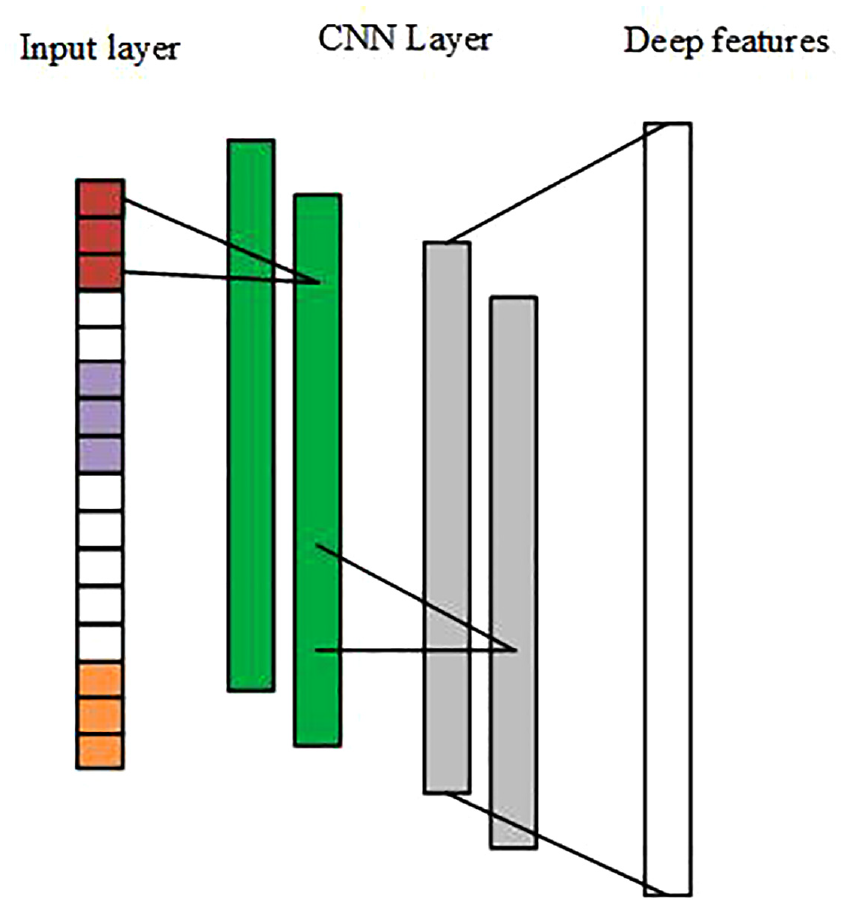
1D CNN structure.
In the one-dimensional convolution layer, the convolution operation and activation function calculation are performed on the input data (one-dimensional vector), as shown in equations (3) and (5).
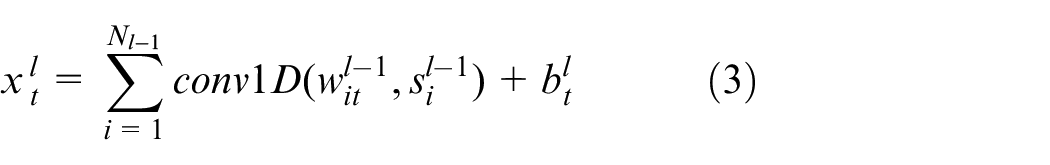
where,
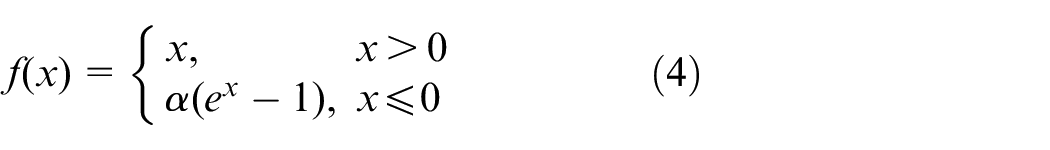
In order to improve the nonlinearity and learning ability of the hybrid neural network, the exponential linear unit (ELU) is used as the activation function in the convolution process with the SOH data of each lithium-ion battery. The ELU function can speed up the training and improve the stability of network training. The positive characteristic of ELU function can alleviate the disappearance of gradient. Compared with the ReLU function, the negative characteristic of the ELU function can make the average output value of the active unit close to 0, which achieves the effect of batch normalization and reduces the amount of calculation. The equation is as follows:
The output of the neural node after one-dimensional convolution and activation function is shown in the equation (5).

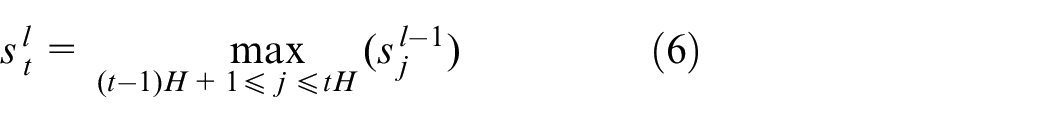
The max pooling layer, taking the maximum value of the adjacent area at a certain moment as the final output of that moment.The max pooling layer can be adopted to reduce the amount of parameters of neural networks and effectively reduce network overfitting that can be described as:
BiLSTM is a temporal recurrent neural network. 25 BiLSTM can effectively retain the ability of historical input data and has the ability of memory. Compared with LSTM processing input data in one direction, BiLSTM bi-directionally trains the input data in ascending and descending order, and predicts in combination with context. BiLSTM structure is shown in Figure 3.
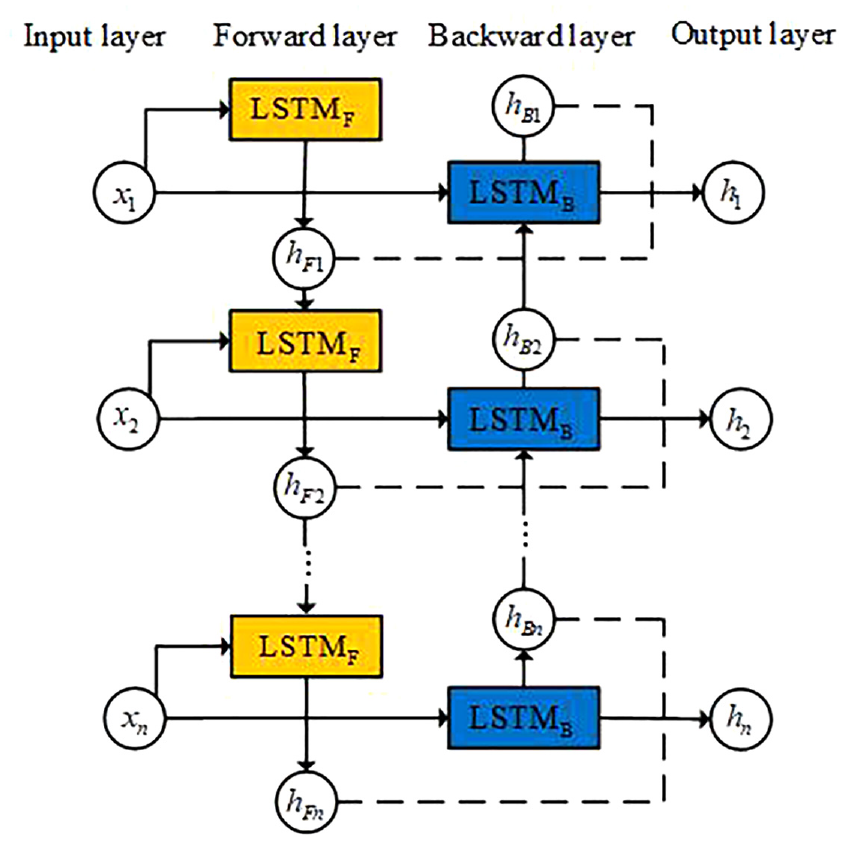
BiLSTM structure.
BiLSTM feeds the deep SOH characteristics of lithium-ion batteries
The LSTM unit structure is composed of input gates, forget gates, output gates and the connection of memory cells. The activation function realizes short-term memory, and the weight update is used for long-term memory. The equations are as follows:


where
When the training data is relatively small, the prediction model is prone to over fitting phenomenon, and when the neural network hybrid integral model is used, the training time of the model is relatively long. In order to solve the above problems, this paper uses Dropout technology, which effectively alleviates the over fitting phenomenon and speeds up the network training speed. In each training process, by ignoring half of the feature detectors (half of the hidden layer nodes are 0), the over fitting phenomenon is effectively reduced, and the dependence on local features in the training process is avoided, and the generalization ability of the model is improved.
In the 1D CNN-BiLSTM prediction model training process, the Adam optimization function is used to update the weights and biases of the network, and can be written as:


where
We set up Dense layers to extract the correlation between the output features of the hidden layer and output the final prediction value of the model. 1D CNN-BiLSTM neural network is shown in Figure 4.
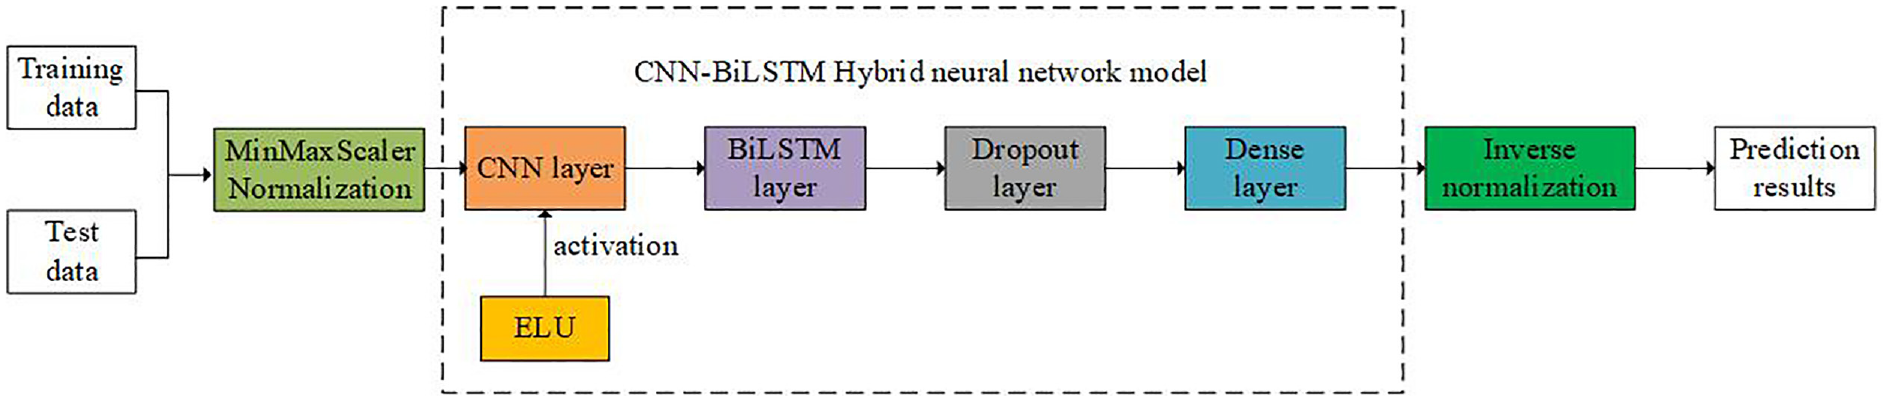
1D CNN-BiLSTM hybrid neural network.
Prediction experiment and analysis
Experimental data and evaluation criteria
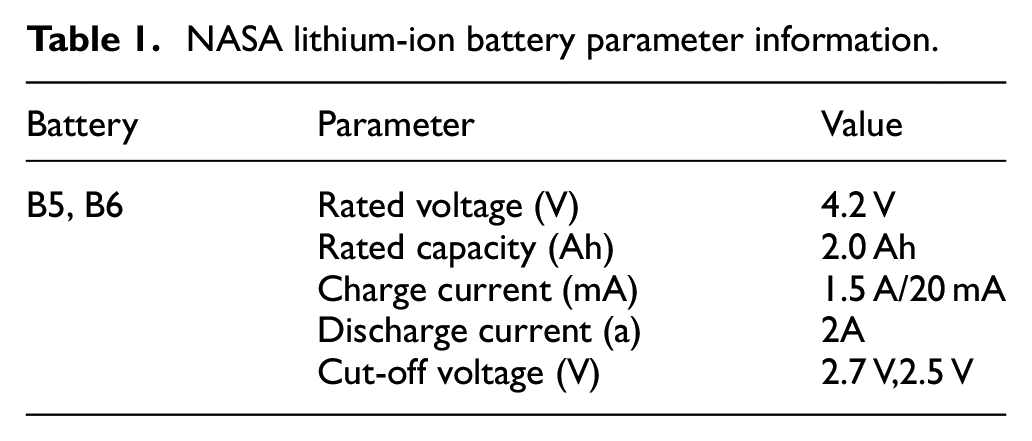
In this work, we selected two battery datasets from NASA Ames Prognostics Center of Excellence, B0005 (B5) and B0006 (B6), and their SOH curves are shown in Figure 5, and the battery parameter information is shown in Table 1. The lithium-ion battery is charged and discharged in a constant temperature working environment, and the working data is recorded and monitored. The charge-discharge process is as follows:
In the process of constant current and constant voltage charging, the lithium-ion battery is charged with a constant current of 1.5 A to increase its voltage to 4.2 V, and then charged with a constant voltage of 4.2 V to reduce its current to 20 mA.
In the process of constant current discharge, the lithium-ion battery is discharged with a 2A constant current until the voltages of the lithium ion batteries B5 and B6 drop to 2.7 and 2.5 V, respectively.
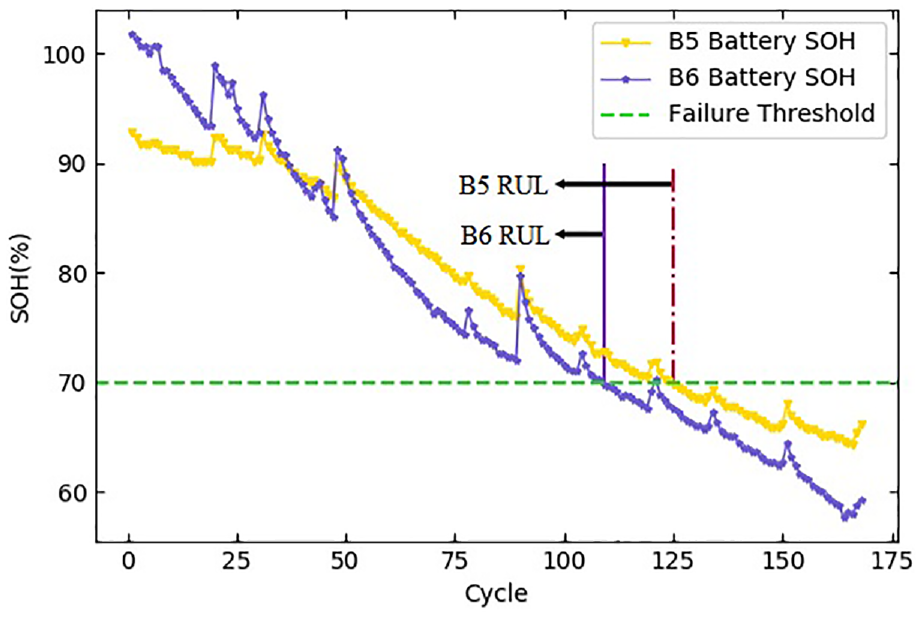
The SOH decay curve of NASA lithium-ion battery.
NASA lithium-ion battery parameter information.
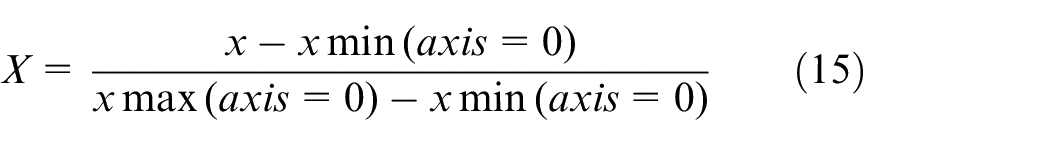
The MinMaxScaler function is used to normalize the SOH data of lithium ion battery. Normalization improves the convenience of data processing and the convergence speed of program operation. The calculation of MinMax normalization is as in equation (15).
The RUL absolute error (RULae), root mean square error (RMSE), mean absolute error (MAE), and r-square (R2) are used as indicators to evaluate the prediction results of the model. RULae is the absolute error between the predicted failure threshold point and the actual failure threshold point, RMSE and MAE are the error between the predicted SOH curve and the actual SOH curve, R2 is the fitting degree between the predicted SOH curve of the prediction model and the actual SOH. The above four evaluation indicators are defined as:


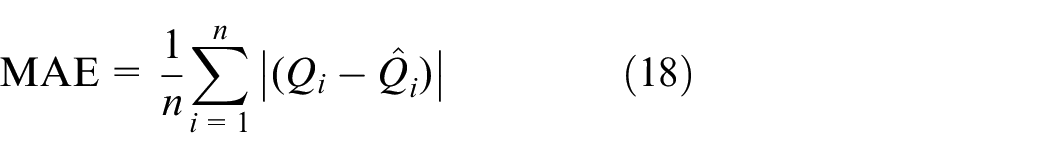
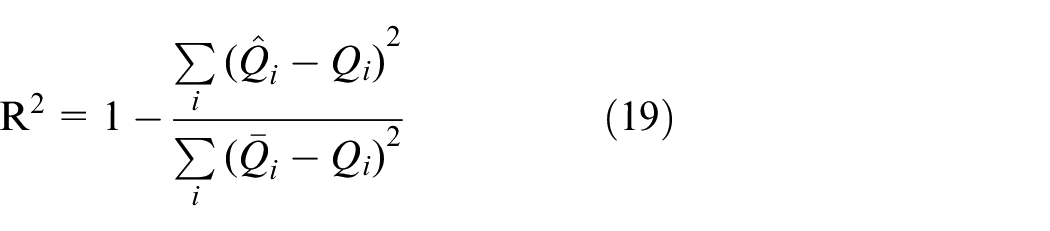
where,
1D CNN-BiLSTM model prediction process
The training process of 1D CNN-BiLSTM lithium-ion battery RUL prediction model is shown in Figure 6 and be given as follows.
Step 1: Extract the data of lithium-ion battery and convert the capacity data into SOH data.
Step 2: The lithium-ion battery capacity data is divided into test set and training set according to different prediction points, and normalized.
Step 3: Model Initialization. The weights and deviations of the 1D CNN-BiLSTM prediction model are initialized.
Step 4: CNN layer calculation. The CNN layer extracts the features of the input data and obtains the output value.
Step 5: BiLSTM layer calculation. The output data of CNN layer is calculated through the BiLSTM hidden layer, and the output value is obtained.
Step 6: Output layer calculation. The output value of the model is obtained by calculating the output value of the BiLSTM layer.
Step 7: By calculating the battery SOH value of the output layer, the actual value of the battery SOH is compared, and the corresponding error is calculated.
Step 8: To judge whether the model reaches the maximum number of iteration steps. If the maximum number of iteration steps is reached, the training is completed and the predicted SOH value of lithium-ion battery is output. If not, go back to the fourth step and increase the number of iteration steps by one.
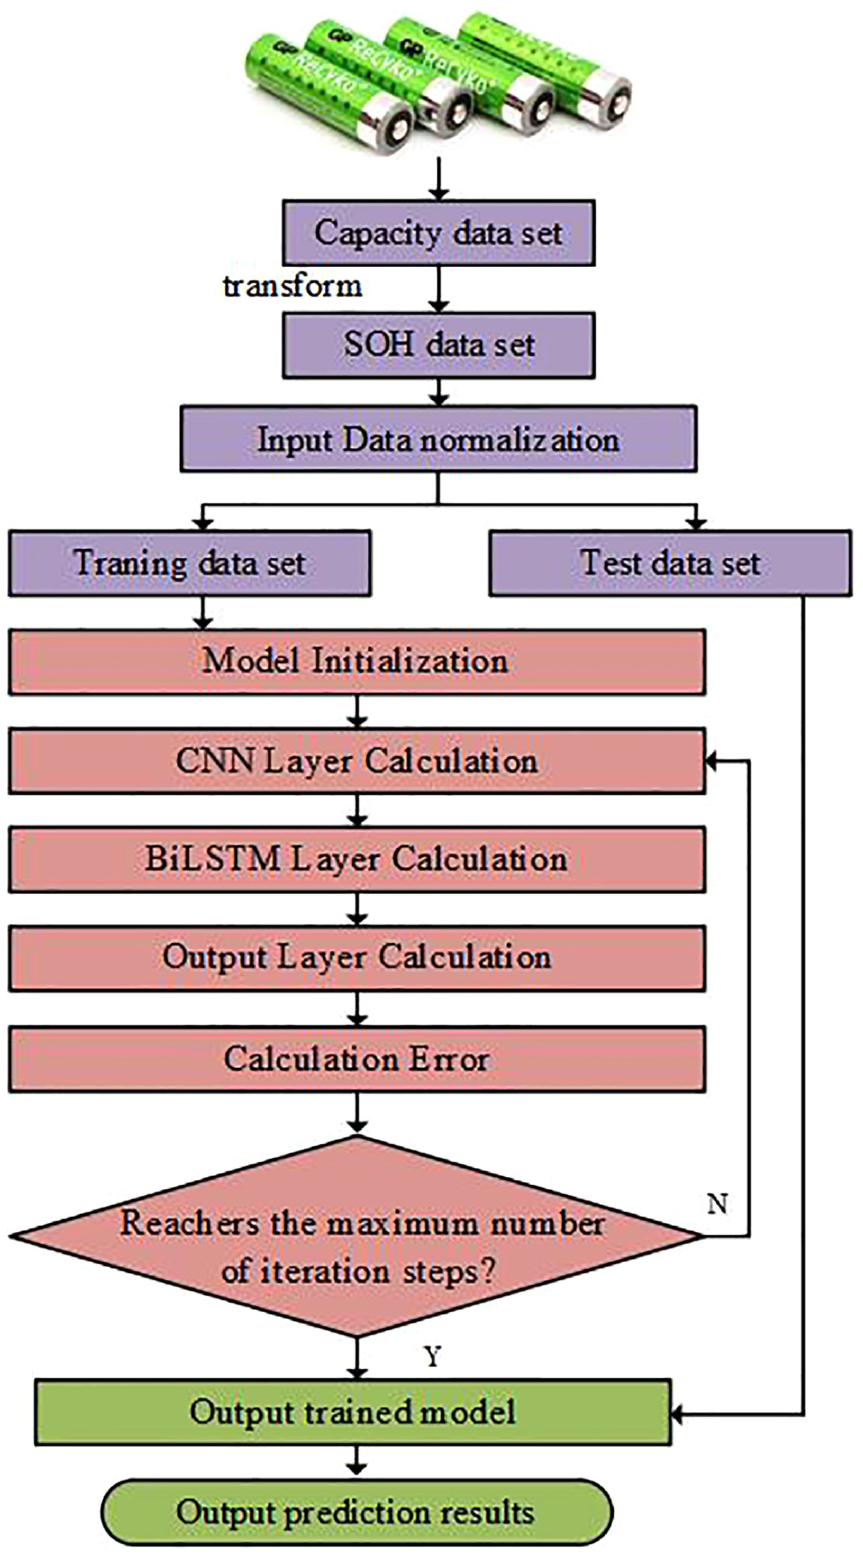
1D CNN BiLSTM model training process.
Model prediction experiment and analysis
For data-driven methods, the performance of the model largely depends on the setting of super parameters. Adam with an initial learning rate of 0.01 is used as the optimizer to train our 1D CNN-BiLSTM model. The hyperparametric tests required by our model include the digital layer of the convolution function filter FilterN and the number of BiLSTM units BiLSTMU. For our model, we change FilterN between {2, 4} and BiLSTMU between {64, 84, 104}, and test to obtain the best super parameters. The experimental results are shown in Table 2.
The setting of hyperparameters based on B5 dataset.
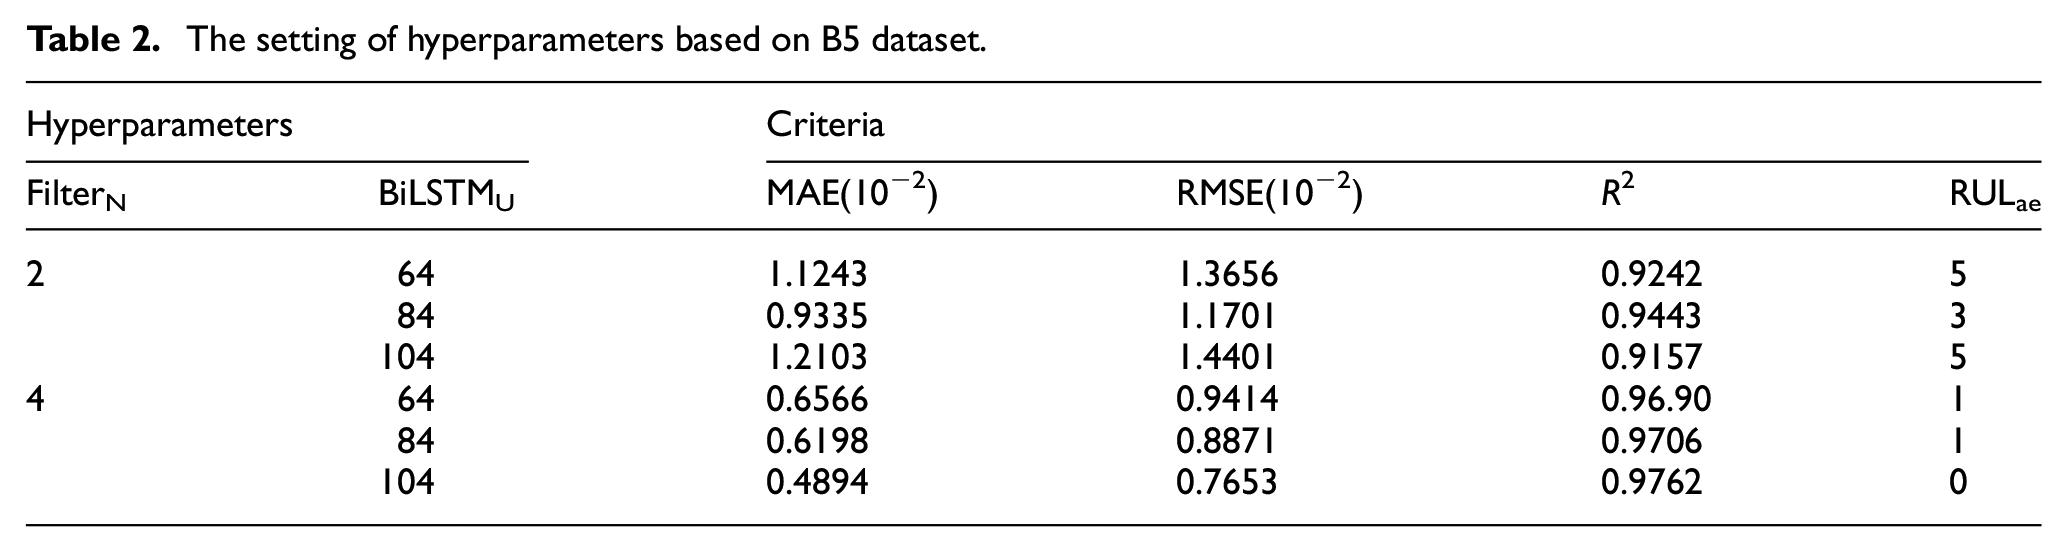
At the prediction point of B5 lithium battery 70, when FilterN = 4 and BiLSTMU = 104, the prediction index of the model reaches the best, the error between the predicted failure threshold and the actual failure threshold is 0. The optimal parameters of the model are determined by comparing different parameter settings.
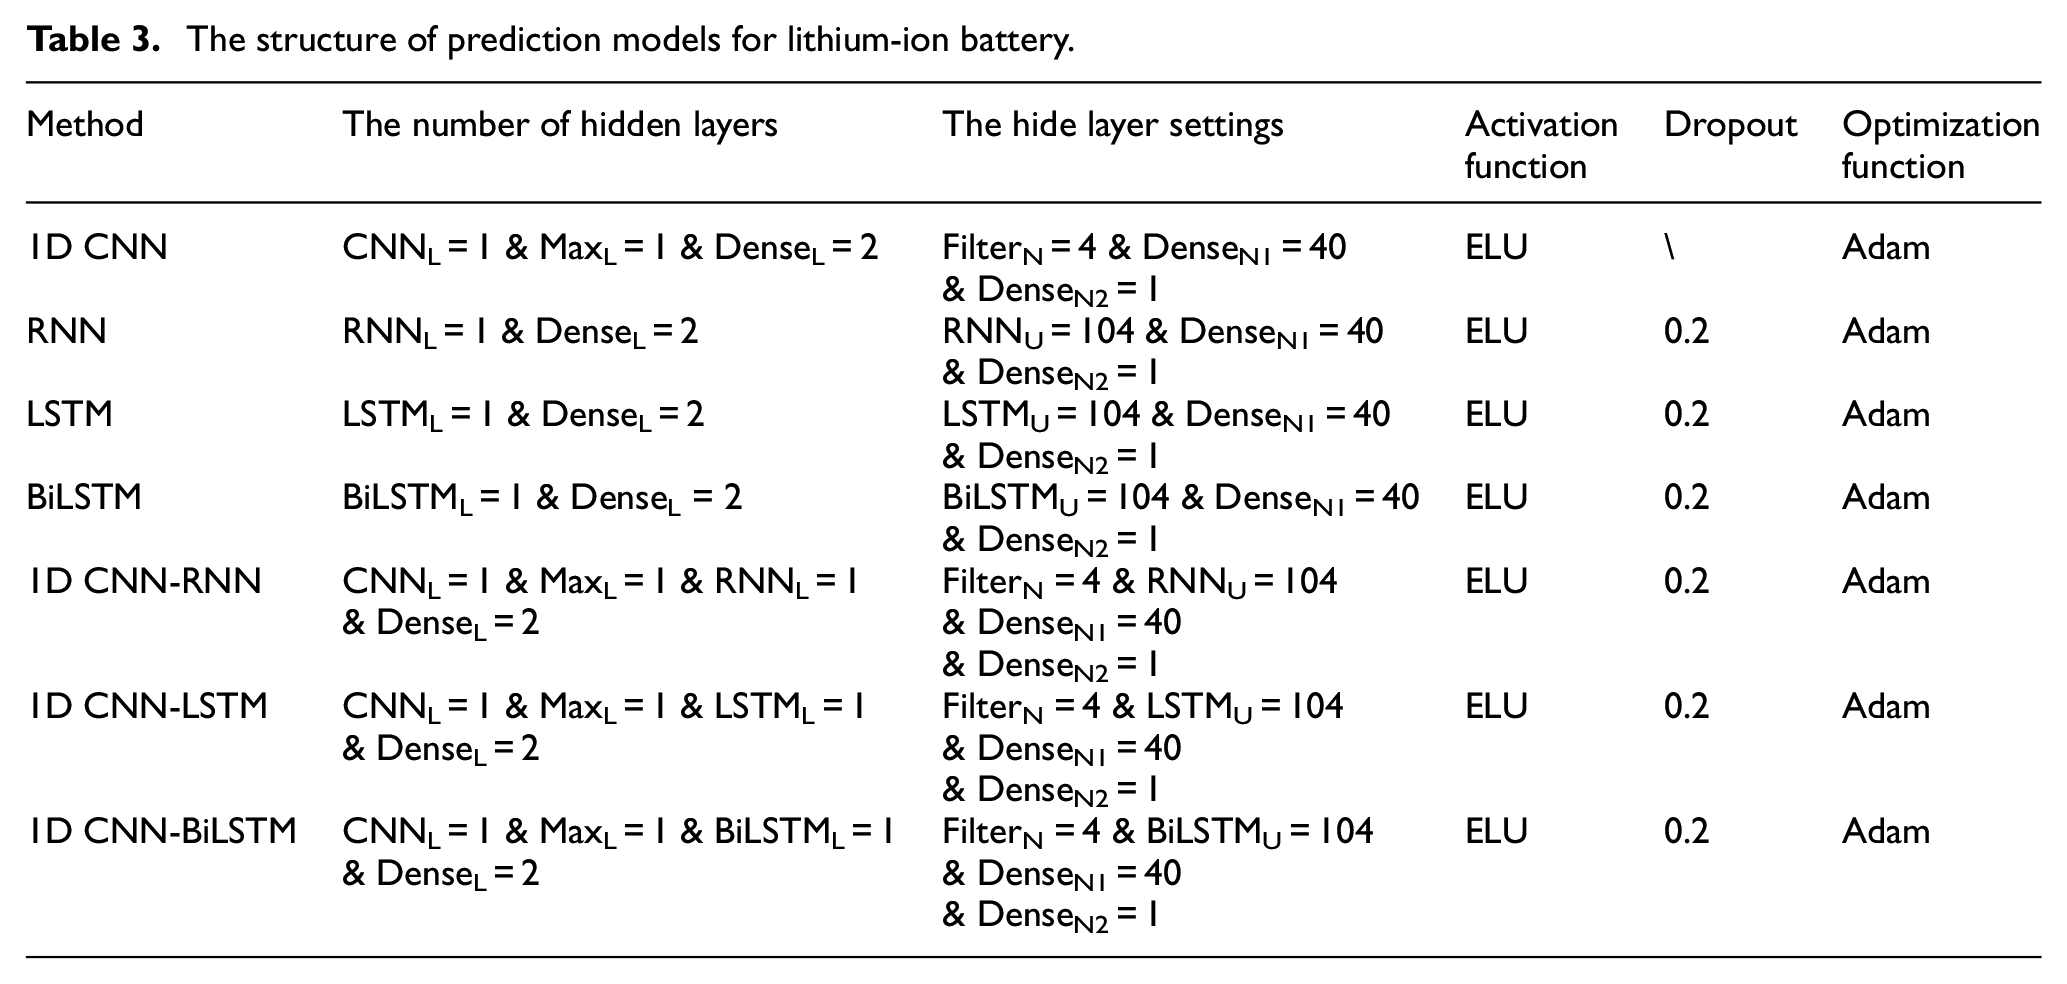
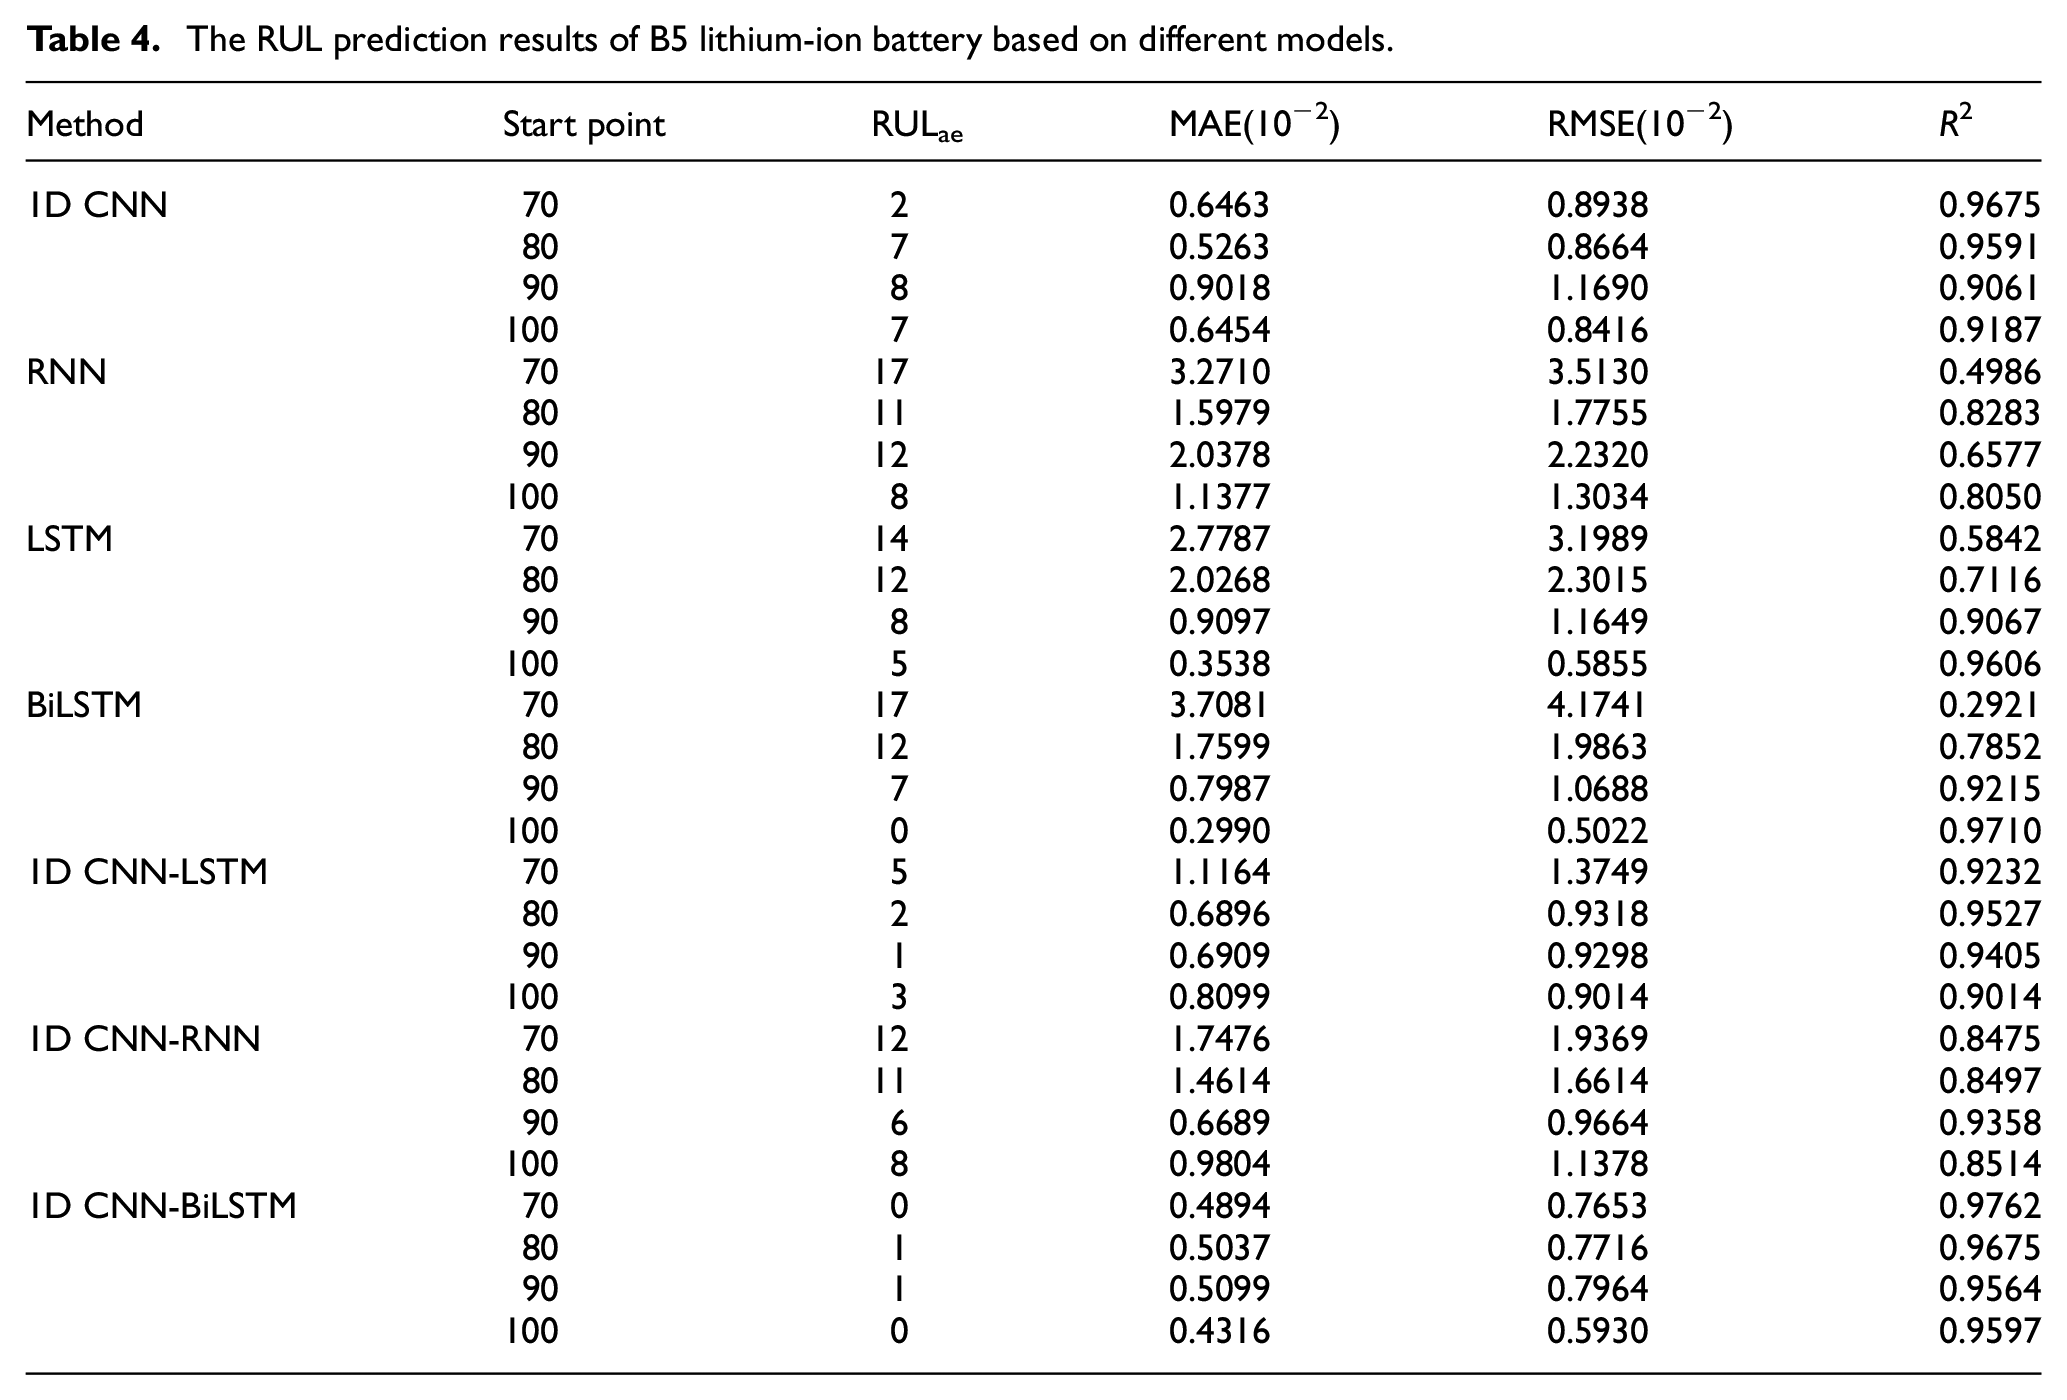
To verify the accuracy of the 1D CNN BiLSTM model, NASA’s B5 and B6 lithium-ion battery data are used as experimental data, and experimental comparisons are made with multiple models. The structure of different prediction models is shown in Table 3. Different prediction points are set to divide the B5 and B6 lithium-ion battery data into training data and test data. The RUL prediction results of B5 lithium-ion battery are shown in Table 4 and Figures 7 and 8, the RUL prediction results of B6 lithium-ion battery are shown in Table 5 and Figures 9 and 10.
The structure of prediction models for lithium-ion battery.
The RUL prediction results of B5 lithium-ion battery based on different models.
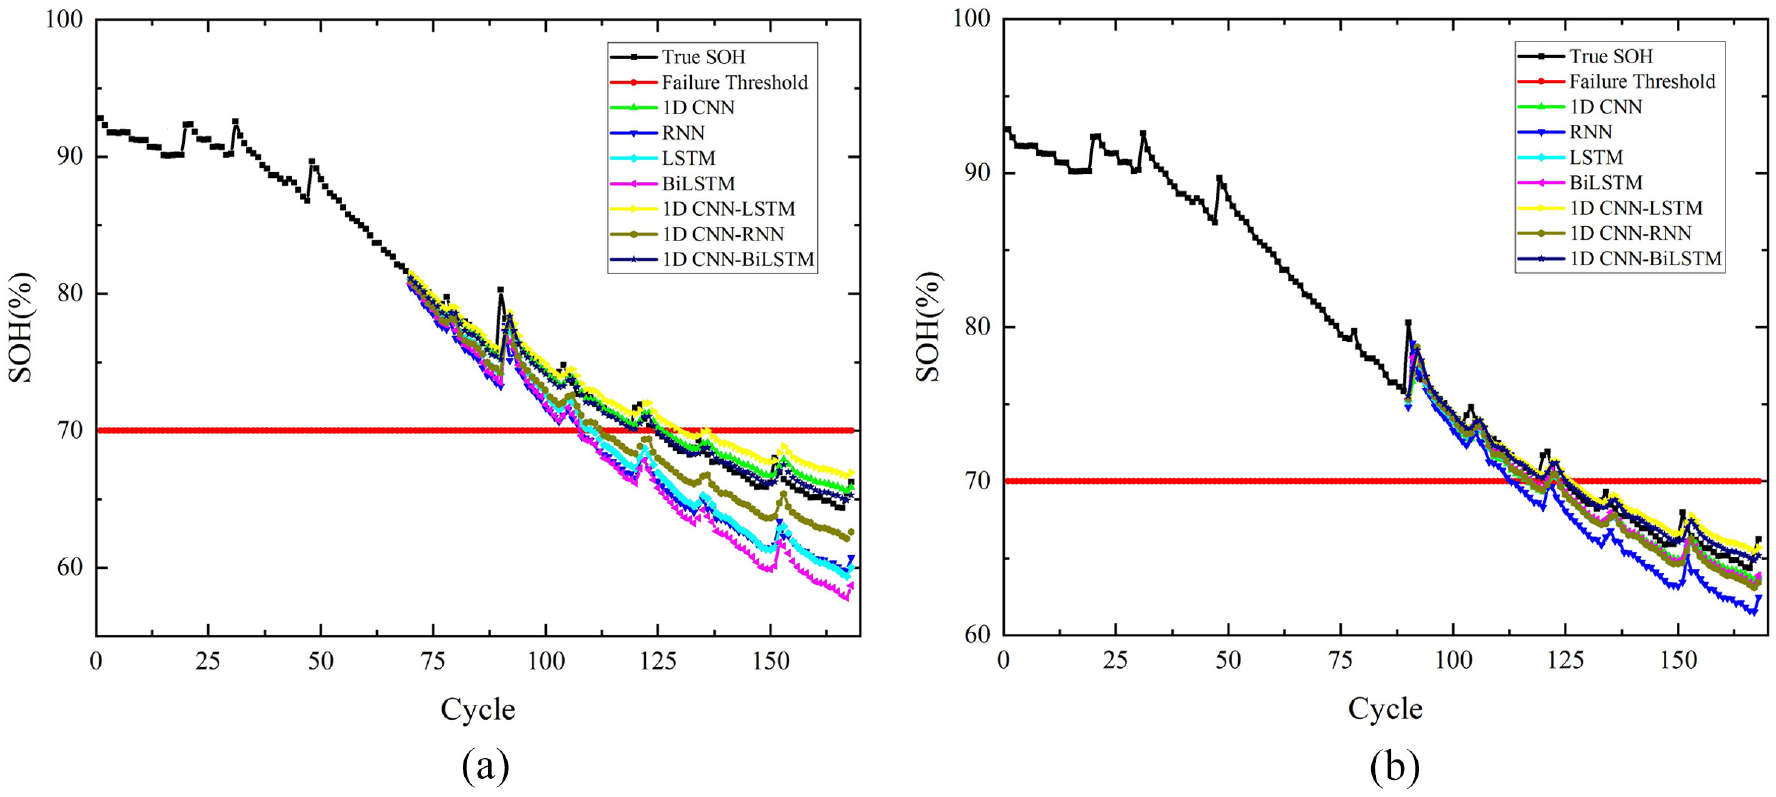
The prediction results of B5 lithium-ion battery RUL: (a) start at 70 cycles of B5 and (b) start at 90 cycles of B5.
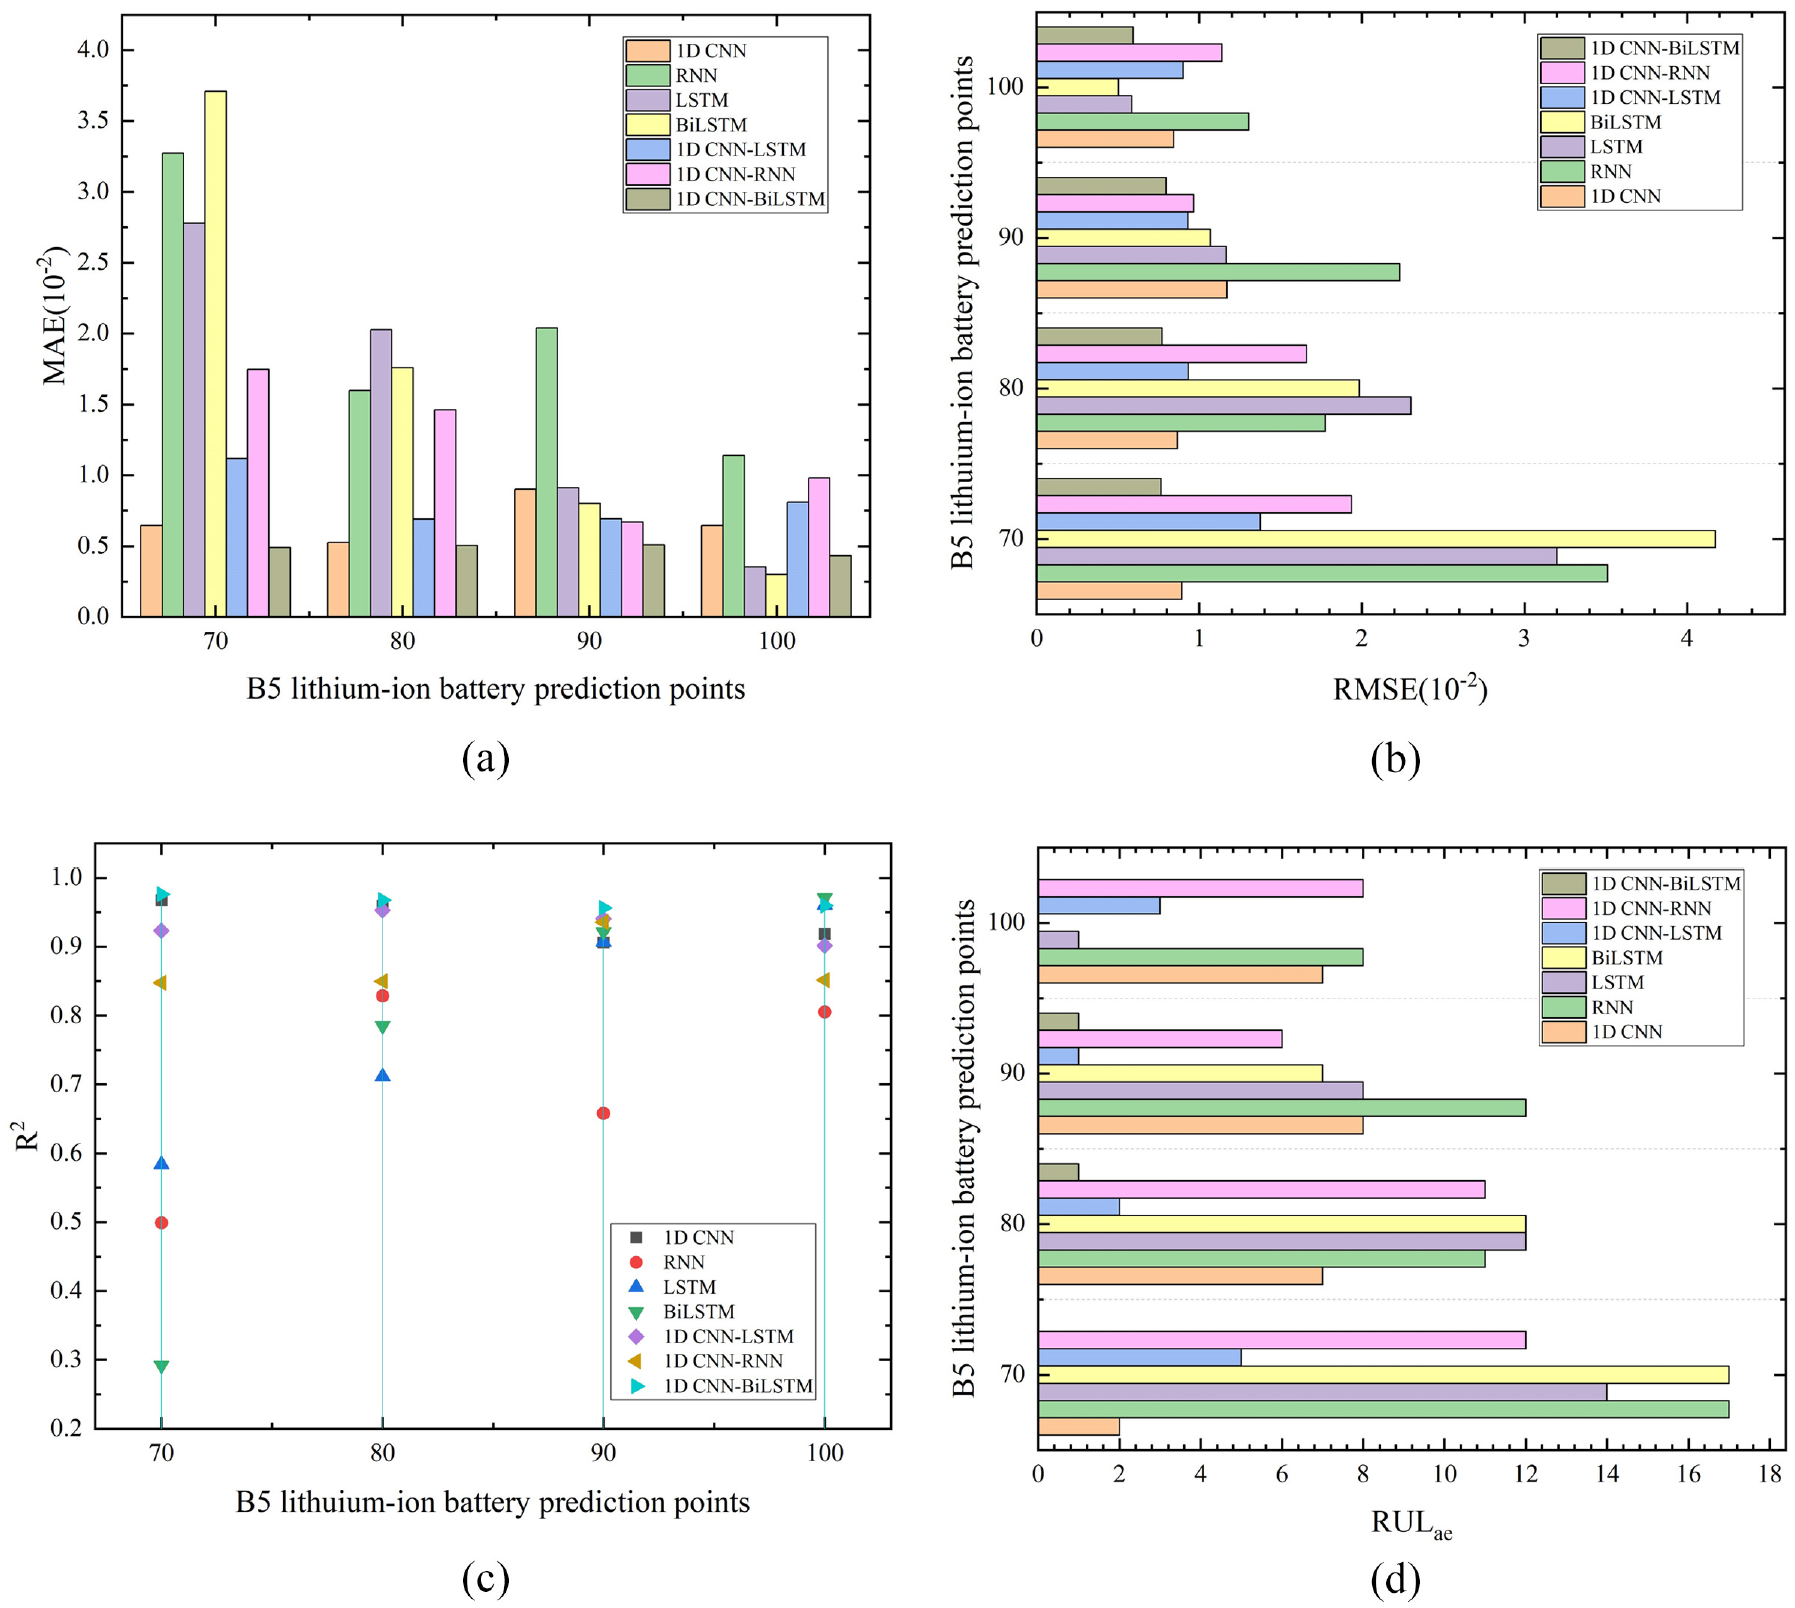
The prediction indicator results of RUL of B5 lithium-ion battery with different prediction models.: (a) the MAE results of different prediction models, (b) the RMSE results of different prediction models, (c) the R2 results of different prediction models, and (d) the RULae results of different prediction models.
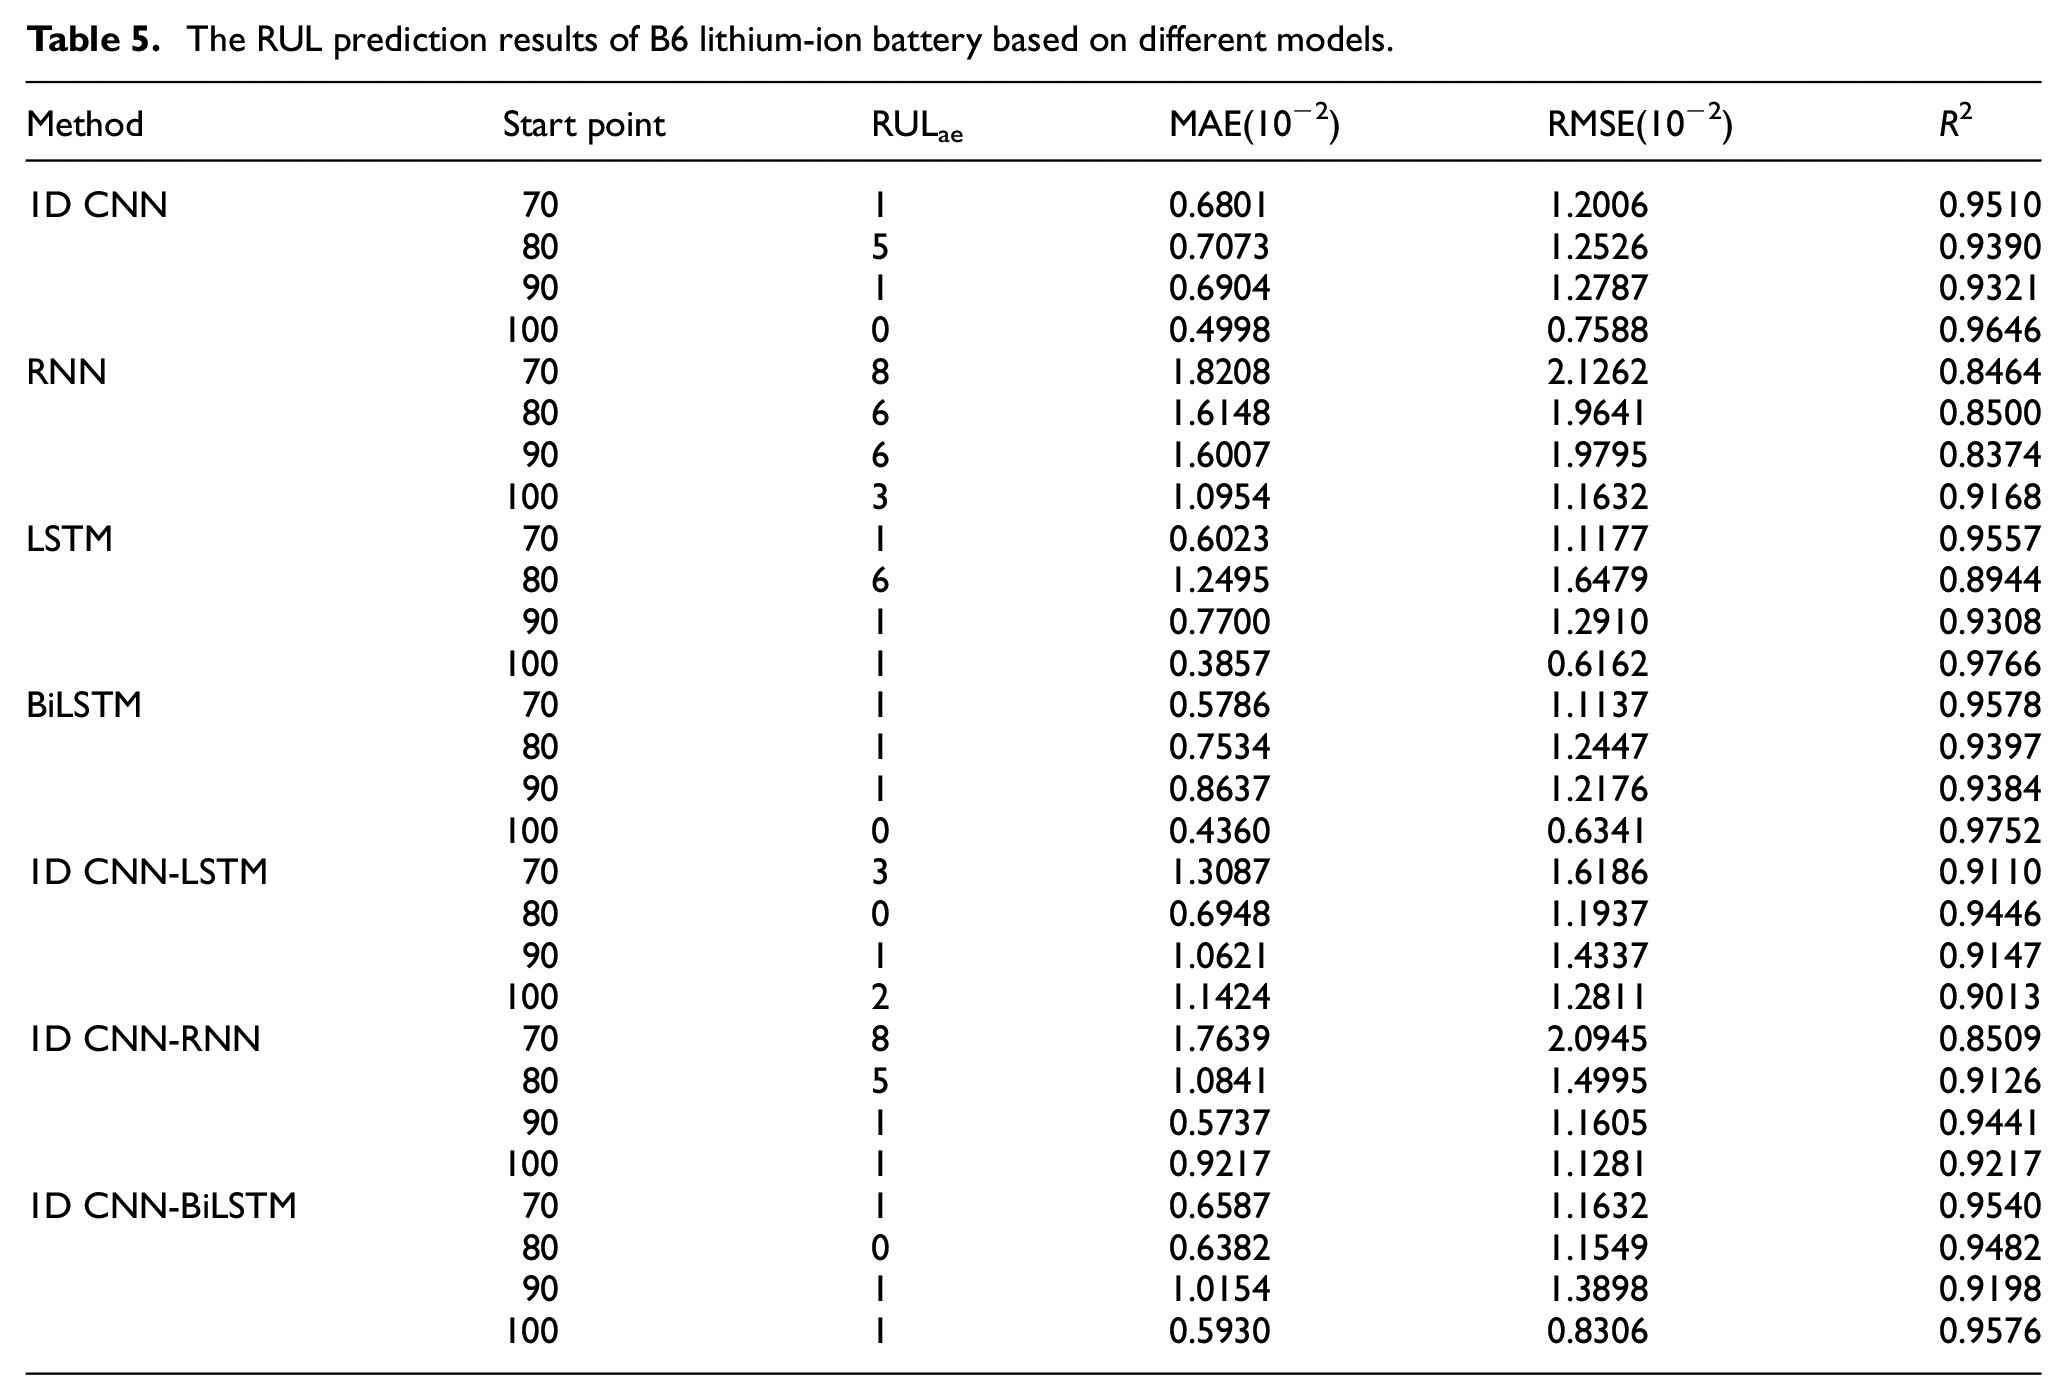
The RUL prediction results of B6 lithium-ion battery based on different models.
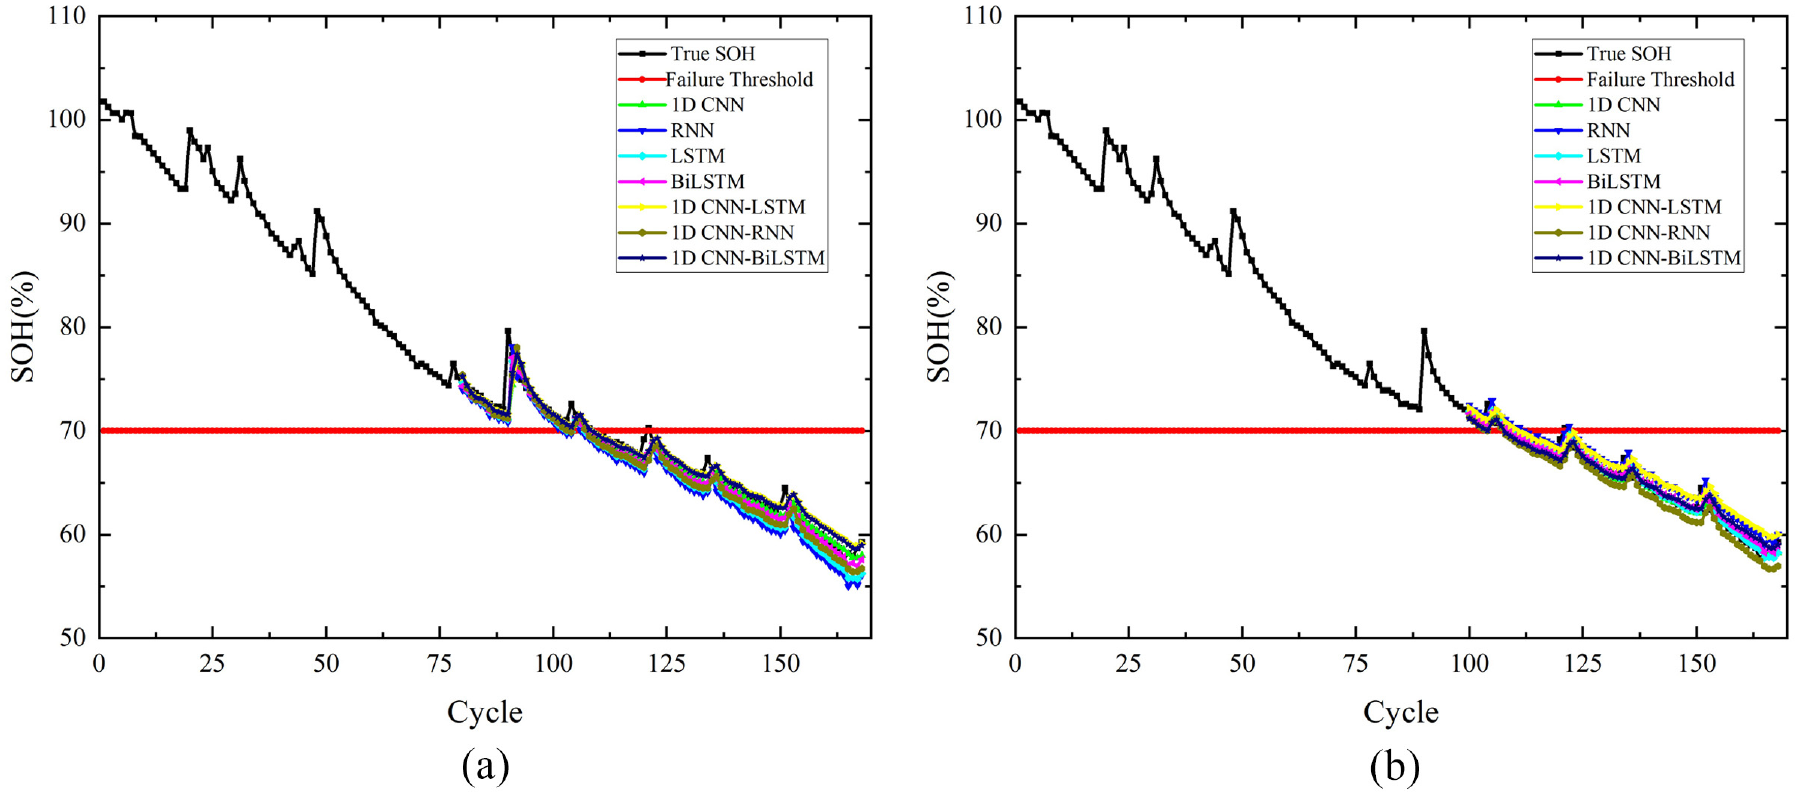
The prediction results of B6 lithium-ion battery RUL:(a) start at 80 cycles of B6 and (b) start at 100 cycles of B6.
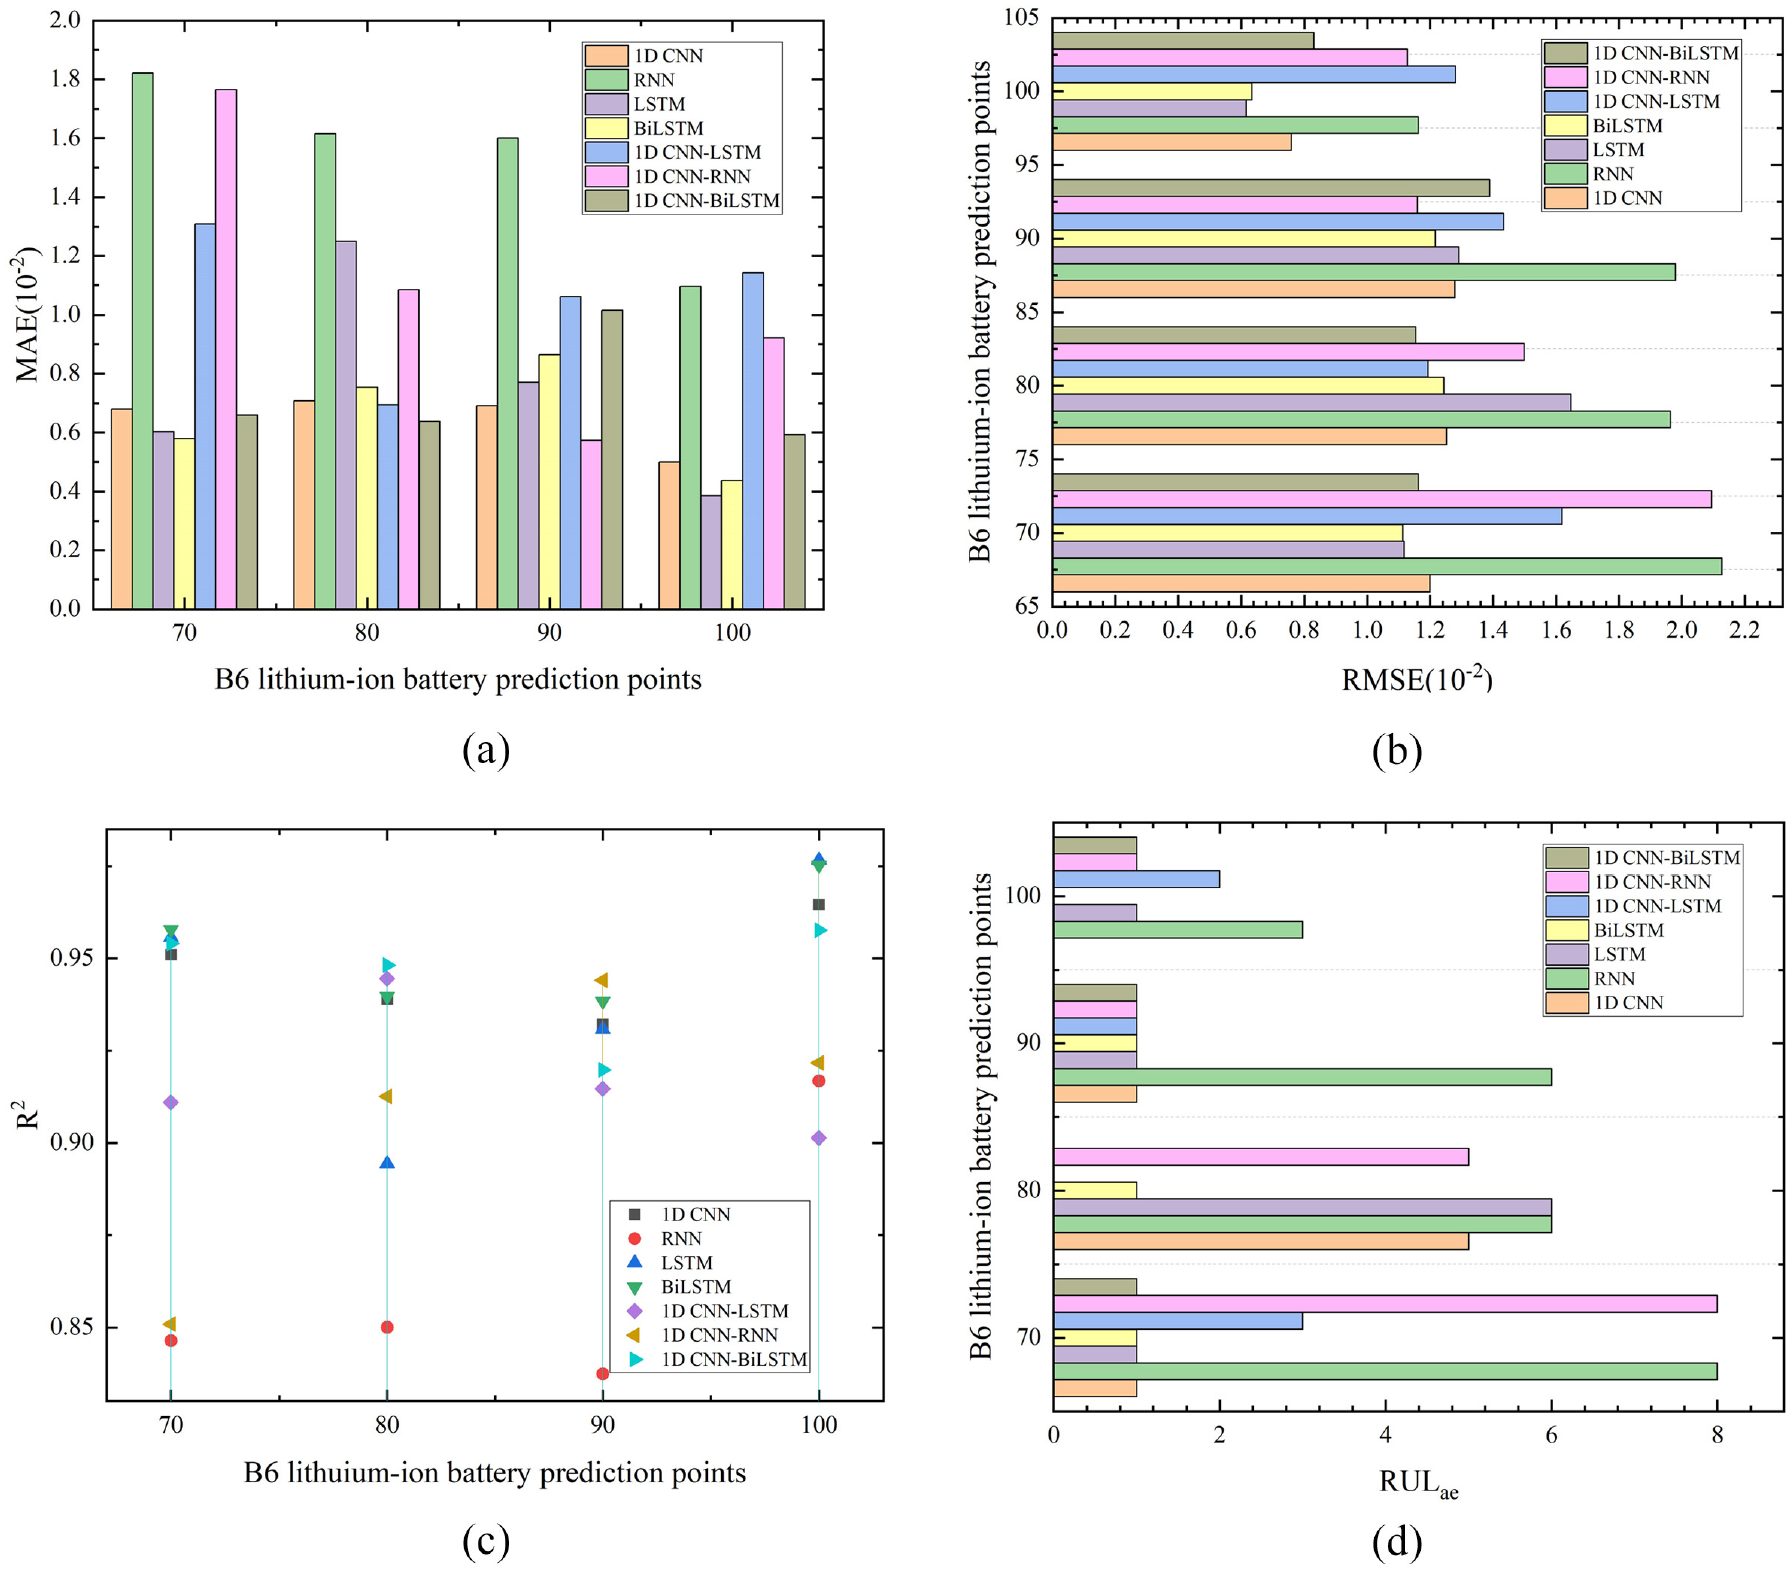
The prediction indicator results of RUL of B6 lithium-ion battery with different prediction models: (a) the MAE results of different prediction models, (b) the RMSE results of different prediction models, (c) the R2 results of different prediction models, and (d) The RULae results of different prediction models.
As shown in Table 4 and Figures 7 and 8, the predicted experimental indicators of RNN model in B5 lithium-ion battery: The values of RULae fluctuate steadily between 2 and 8, and the values of R2 are stable above 0.9061. The RNN model has low prediction accuracy, low prediction fit, and poor generalization ability.
The B5 lithium-ion battery RUL prediction results of the 1D CNN model show that the model has a high degree of prediction fit, with the values of R2 of more than 0.90, but the values of RULae fluctuate between 2 and 8, and its prediction accuracy is low.
The prediction results of LSTM model for B5 lithium-ion battery RUL show that the prediction accuracy of the model improves with the increase of training data, the change of RULae values fluctuate to 5 and 14, and its prediction stability is relatively low. Compared with the prediction results of RNN model, LSTM model has higher fitting degree and accuracy.
The prediction results of the BiLSTM model of RUL for B5 lithium-ion battery show that the prediction accuracy of the model improves with the increase of training data, the change of RULae values fluctuate between 0 and 17, and the prediction stability is low. When there are few training data, BiLSTM model relies too much on the local characteristics of the data, resulting in insufficient prediction accuracy and stability. When the training data increases gradually, the prediction accuracy of the model increases gradually.
The experimental indicators predicted by 1D CNN-RNN model in B5 lithium-ion battery: The values of RULae fluctuate between 8 and 12, and the values of R2 fluctuate between 0.8475 and 0.9358. Compared with the RNN model, the prediction stability and prediction accuracy of the 1D CNN-RNN model are greatly improved.
The experimental indicators predicted by the B5 lithium-ion battery 1D CNN-LSTM model: The values of RULae fluctuate between 1 and 5, and the values of R2 fluctuate between 0.9014 and 0.9527. Compared with the LSTM model, the prediction stability and prediction accuracy of the 1D CNN-LSTM model have been greatly improved, and the error between the predicted failure threshold point and the actual failure threshold point has been reduced to less than 5.
The experimental indicators predicted by the B5 lithium-ion battery 1D CNN-BiLSTM model are: The values of RULae fluctuate between 0 and 1, and the values of R2 fluctuate Between 0.9597 and 0.9762. The error between the predicted failure threshold point and the actual failure threshold point of the 1D CNN-BiLSTM model is accurate within 1, and the prediction fit is relatively high.
Compared with the improved LSTM model in Long et al. 26 , the RUL error of 1D CNN-BiLSTM model decreased steadily by 3 and the RMSE value decreased by 73.63%. At 100 prediction point, the RUL error of 1D CNN-BiLSTM model decreased steadily by 2 and the RMSE value decreased by 49.74%. Its prediction accuracy and prediction robustness are greatly improved.
As shown in Table 5, Figures 9 and 10, the predicted experimental indicators of RNN model in B6 lithium-ion battery: The values of RULae fluctuate between 3 and 8, and the values of R2 fluctuate between 0.8374 and 0.9168. With the increase of training data, the prediction accuracy of RNN model is improving.
The prediction results of the 1D CNN model on the B6 lithium-ion battery data show that the overall prediction accuracy of the model is high, but the value of RULae at the 80 cycles point is 5, and the error between the predicted failure threshold point and the actual failure threshold point is large, the prediction accuracy of this point is low. Combined with the comprehensive analysis of the prediction results of B5 and the B6 lithium-ion battery, the 1D CNN model has a high degree of prediction fit, but the prediction accuracy is relatively low.
The predicted experimental indicators of LSTM model in B6 lithium-ion battery: The values of RULae fluctuate between 1 and 6, and the values of R2 fluctuate between 0.8944 and 0.9766. Compared with the prediction results of the RNN model, the LSTM model has higher prediction accuracy and stability. The LSTM model introduces the concept of storage unit on the basis of RNN, and has the ability to analyze long-term time series. LSTM unidirectionally analyzes the correlation between the time series before and after the forecast, thereby improving the accuracy and stability of the forecast to a certain extent.
The predicted experimental indicators of the B6 lithium-ion battery BiLSTM model: the values of RULae fluctuate between 0 and 1, and the values of R2 fluctuate between 0.9384 and 0.9752. Compared with the prediction results of B5 lithium-ion battery RUL, the BiLSTM model has higher prediction accuracy for B6 lithium-ion battery RUL. Combining the two results, the prediction stability of the BiLSTM model is low. Due to its bidirectional data processing characteristics, it is easy to rely on the local characteristics of the data. When the training data increases, its prediction accuracy gradually improves.
The experimental indicators predicted by 1D CNN-RNN model in B6 lithium-ion battery: The values of RULae fluctuate between 1 and 8, and the values of R2 fluctuate between 0.8509 and 0.9441. Combined with the comprehensive analysis of the prediction results of B5 and B6 lithium-ion batteries, 1D CNN-RNN integrates 1D CNN on the basis of RNN to improve its prediction stability and accuracy.
The predicted experimental indicators of 1D CNN-LSTM model in B6 lithium-ion battery prediction: The values of RULae float between 0 and 3, and the values of R2 fluctuate between 0.90.13 and 0.9446. Combined with the comprehensive analysis of the prediction results of B5 and B6 lithium-ion batteries, 1D CNN-LSTM integrates 1D CNN on the basis of LSTM. The 1D CNN-LSTM model has higher prediction accuracy and stability than the LSTM model.
The predicted experimental indicators of the 1D CNN-BiLSTM model in the B6 lithium-ion battery prediction: The values of RULae fluctuate between 0 and 1, the values of R2 fluctuate between 0.9198 and 0.9576. Combined with the comprehensive analysis of the prediction results of the B5 and B6 lithium-ion batteries, the 1D CNN-BiLSTM model solves the problem that the BiLSTM model is easy to rely on the local characteristics of the data, and the error between the predicted failure threshold point and the actual failure threshold point is stabilized within 1. Compared with other prediction models, the prediction accuracy and stability of the 1D CNN-BiLSTM model is higher.
Compared with the particle filter using kendall rank correlation coefficient model in Gao et al. 27 the RUL error value of 1D CNN-BiLSTM model is reduced by 9 and the RMSE value is reduced by 70.15% at 80 prediction points of B6 lithium-ion battery. The model is trained by considering multiple parameters in the charge and discharge data, and the battery capacity is estimated by analyzing the measurable indirect parameters in the process of battery discharge. This experimental method converts the capacity of lithium-ion battery into SOH value for training, and the accuracy of RUL prediction is higher.
Conclusion
In order to solve the problem of low prediction accuracy and stability of traditional prediction methods for lithium-ion battery RUL, a 1D CNN-BiLSTM neural network method for lithium-ion battery RUL prediction is proposed in this paper. The prediction experiments of two sets of NASA lithium-ion battery data show that the error of prediction failure threshold point of 1D CNN-BiLSTM neural network is stable 0–1; The fitting degree between the predicted capacity curve and the actual capacity curve is high, and the R2 values of the two groups of experiments are stable between 0.9564 and 0.9762 and 0.9198 and 0.9576, respectively. This method combines the deep features of 1D CNN mining data with the ability of BiLSTM to analyze time series, and has better prediction accuracy and stability.
Research Data
sj-csv-1-mac-10.1177_00202940221103622 – Supplemental material for A hybrid CNN-BiLSTM approachfor remaining useful life predictionof EVs lithium-Ion battery
Supplemental material, sj-csv-1-mac-10.1177_00202940221103622 for A hybrid CNN-BiLSTM approachfor remaining useful life predictionof EVs lithium-Ion battery by Dexin Gao, Xin Liu, Zhenyu Zhu and Qing Yang in Measurement and Control
Research Data
sj-csv-2-mac-10.1177_00202940221103622 – Supplemental material for A hybrid CNN-BiLSTM approachfor remaining useful life predictionof EVs lithium-Ion battery
Supplemental material, sj-csv-2-mac-10.1177_00202940221103622 for A hybrid CNN-BiLSTM approachfor remaining useful life predictionof EVs lithium-Ion battery by Dexin Gao, Xin Liu, Zhenyu Zhu and Qing Yang in Measurement and Control
Footnotes
Declaration of conflicting interests
The author(s) declared no potential conflicts of interest with respect to the research, authorship, and/or publication of this article.
Funding
The author(s) disclosed receipt of the following financial support for the research, authorship, and/or publication of this article: This work was supported by National Natural Science Foundation of China (61673357), the Key Research and Development Projects of Shandong Province (2019 GGX101012), the Project of Shandong Province Higher Educational Science and Technology Program (J18KA323), and Shandong Graduate Education Quality Improvement Plan Project (SDYY18092).
References
Supplementary Material
Please find the following supplemental material available below.
For Open Access articles published under a Creative Commons License, all supplemental material carries the same license as the article it is associated with.
For non-Open Access articles published, all supplemental material carries a non-exclusive license, and permission requests for re-use of supplemental material or any part of supplemental material shall be sent directly to the copyright owner as specified in the copyright notice associated with the article.