
Abstract
The use of input devices of resonance-type in flaw detectors is advisable at frequencies above 100–200 kHz. However, in the practice of non-destructive testing by eddy currents, it is often necessary to use lower frequencies. In this case, one should connect the eddy current probes to devices with a non-resonant interface such as a bridge circuit. The functioning of bridge circuits used in eddy current sensors is significantly different from its functioning when used for components measurement because eddy current sensors operate under linear parametric modulation. In this case, it is advisable to perform the measurements by the self-comparison method, when a pair of closely located identical probes are placed in adjacent arms of the bridge.
In this article, we first provide a detailed mathematical analysis of the operation of such a bridge circuit used as a flaw detector interface device. We use impedances of arbitrary finite values as disturbances. It is shown that despite the non-resonant character of the bridge circuit, it exhibits good selectivity for different loading (insertion) impedances. The isolines of the output signal and the probe’s complex impedance diagram (hodograph) in balanced and imbalanced bridge circuits are jointly built. In this way, it is possible, for the first time, to construct hodographs in the complex plane for both selective signal suppression, and maximum sensitivity. Although this method is already used in series flaw detectors designed for aircrafts testing, the theory behind this method is presented here for the first time.
Keywords
Introduction
Adler et al. 1 shows the construction and use of the isolines method for the analysis of experimental results. The authors introduce the concept of “shortest descent” or “gradient path” as a curved line intersecting each isoline at right angles. In Fastritsky et al.,2,3 the authors analyzed the phase angle between the input and output voltages of an imbalanced bridge, in which two arms consist of the reference and the EC detection coils (surface probes). The authors considered controlling the system by two parameters: electrical conductivity and gap. They derived a formula that allows determining the conditions for minimizing the influence of the gap by choosing the value of the reference inductance. It is shown that the gap influence can be suppressed in a narrow range of electrical conductivity, which can be extended by lowering the sensor’s quality factor, Q.
Patent 4 presents a self-comparison sensor in the form of two orthogonal coils perceiving the tangential component of the induced magnetic field. The sensors are placed in two adjacent arms of a bridge circuit.
Patent 5 offers an EC probe for multi-directional inspection, which consists of at least two excitation coils, and one measuring coil. The probe allows for inspecting test surfaces for flaws of any orientation with only one scan pass. It provides sufficient sensitivity and noise cancelation in all directions. Patent 6 presents a broadband flaw detector for inspecting the inner surface of steel pipes. It uses four EC sensors placed in the arms of a bridge circuit. The sensors are located symmetrically (900 apart) on the surface of a dielectric cylinder. A similar bridge circuit is used as an input device for the flaw detector.
In Tada and Hidehiko, 7 a new method for monitoring welded austenitic pipes and detecting contaminating foreign metals in welds is proposed. An EC detection apparatus is placed inside the pipe. Defects are detected using two eddy current sensors placed in adjacent arms of a bridge circuit. In Morris and Langari, 8 two modes of applying the bridge circuit in the measuring techniques are examined: balancing to zero (null type), and deviation from the balance. The authors argue that the former one is more laborious but is more accurate compared to the latter. Nevertheless, the second method is widely used for measuring temperature, pressure, and other physical quantities due to its simplicity. The authors do not consider the more complex task of applying a bridge circuit in EC control with linear parametric modulation.
In Liu et al., 9 the authors present a bridge-based EC flaw detector for the inspection of steel rails. However, the authors do not provide any calculation or analysis of the flaw detector operation.
In last decades, many eddy current probes using planar coils have been proposed.10–13 Pasadas et al. 14 presents a double-layer planar coil that creates rotating magnetic field and is used for detection of cracks with complex geometry.
In Rosado et al., 15 the authors present a new eddy current probe for crack detection. They use a planar probe that allows for dynamic changing of the eddy current so that cracks of different orientations can be detected.
Recently, a new double-layer planar coil of differential structure has been proposed. 16 Using a symmetric structure (with a rectangular coil) the authors achieved a uniform eddy current with enhanced magnetic field and improved detection sensitivity.
Many works published so far consider the performance of EC sensors when placed in a bridge circuit, as their use is very common in practice (see, e.g. Savard et al. 17 ). However, these works are purely empirical in approach and present no theoretical analysis for the choice of the bridge circuit and the operating frequency. From the foregoing, it is evident that the design of operation of EC detectors based on imbalanced bridge circuits lacks the needed theoretical framework for optimization of its performance.
In this work, we present the theory of sensor interfaces based on an imbalanced bridge at low frequencies (4–100 kHz), and analyze their operation in detail. This can facilitate optimal design of EC sensors based on imbalanced bridge interfaces that are very effective for detecting subsurface defects.
Calculation and construction of isolines and hodographs of maximum sensitivity of input devices of eddy current flaw detectors
The problems of selective suppression and maximum sensitivity of EC sensors with a resonant circuit interface are quite well covered in the literature. In this work, we start our analysis by considering bridges having a non-resonant input device that, as stated above, have not been thoroughly covered yet. The output voltage across the bridge diagonal (Figure 1) taking into account the source internal impedance and the input impedance of the load (amplifier) is equal to:
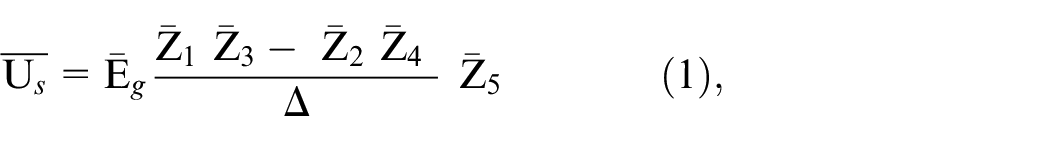
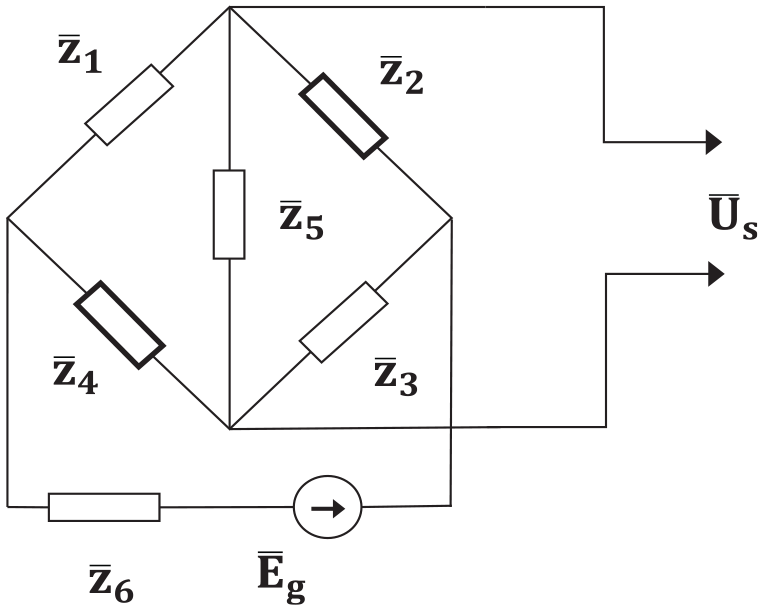
Conventional bridge measurement circuit.
where
and
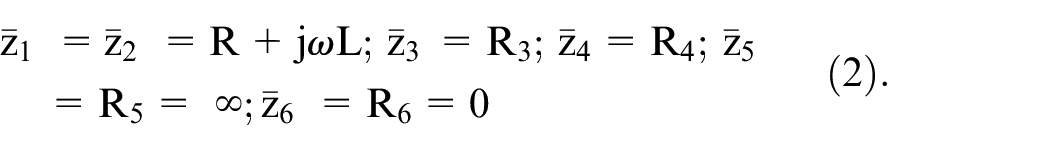
Figure 2 shows a bridge circuit, in which two EC probes are placed in two adjacent arms for applying the self-comparison method at two close areas on the test surface. In this case, the component values in Figure 2 are:
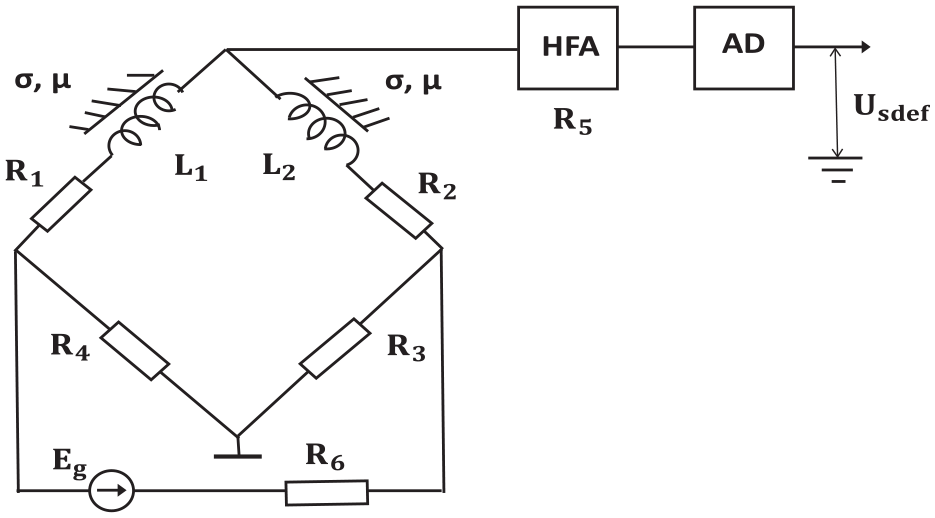
Bridge circuit commonly used in eddy current non-destructive testing. L1 = L2; R1 = R2.
In this case Δ reduces to
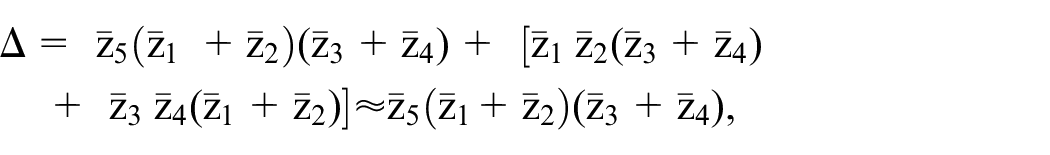
So that (1) reduces to the classic form:
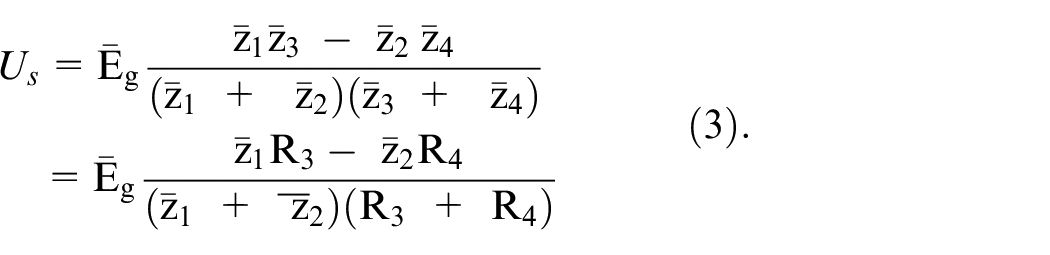
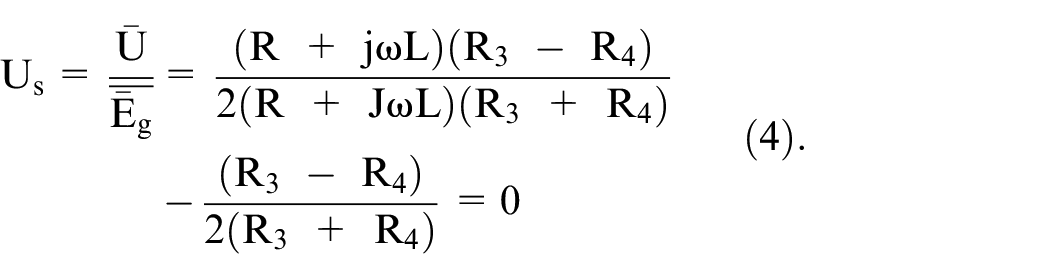
In the absence of any flaw/defect, the relative output voltage Us (normalized by Eg) of the unbalanced bridge of Figure 2, with L1 = L2 = L; R1 = R2 = R, is equal to:
Now, let us assume that under the first sensor there is a disturbing element (e.g. a defect) that introduces an impedance of finite resistive and reactive parts Rin, ωLin. This will cause an increment in the output voltage of the amplitude detector:
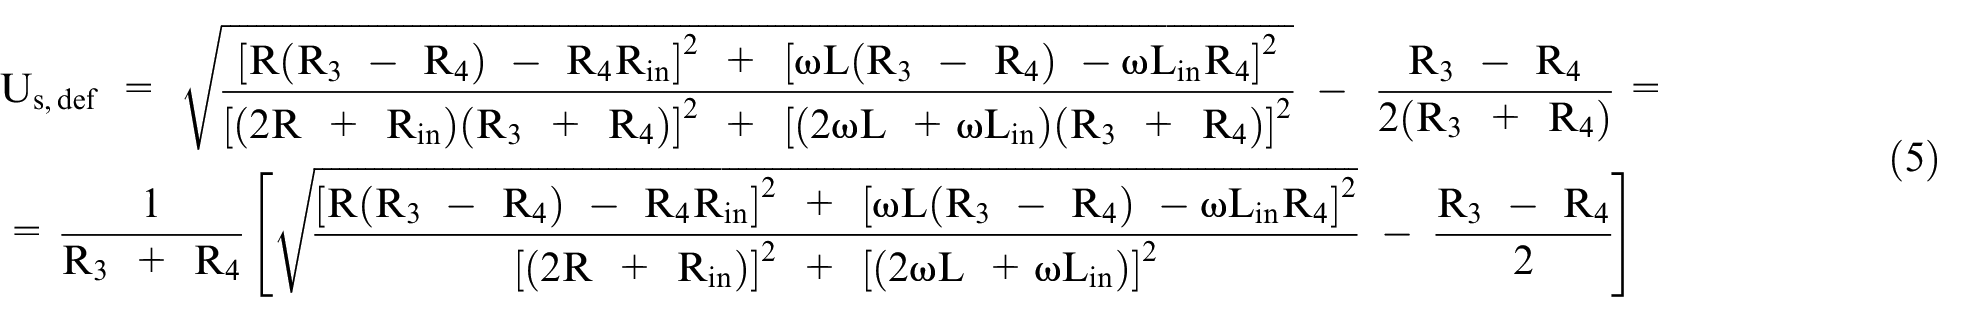
where Usdef is amplitude of the signal from the defect at the output of the bridge interface (see Figure 2).
The possibility of selective suppression is evident from (5), as Us,def vanishes for a certain ratio of R3 and R4:
where k =
where m =
We consider the case when the origin (m, n) is located on the hodograph of a parametric probe placed above a conductive non-magnetic half-space. The selected point is characterized by the generalized parameter of the sensor
the following expression for the isoline in a plane in coordinate system (m, n) can be derived from (7):
Thus, the isoline is the locus of the ends of all introduced impedance vectors in the complex plane, corresponding to a constant output voltage. In particular, if the end of the introduced impedance vector coincides with the zero-level isoline, the resulting signal will be suppressed. This may be due to a change in the gap, or some undesirable heterogeneity, etc. We call such an isoline a Hodograph of Selective Suppression (HSS).
The vector from the “useful” introduced impedance may coincide with a direction on the complex plane, in which maximum sensitivity is achieved. In the theory of experimental design, this is called the “steepest descent” direction. We call this direction the Hodograph of Maximum Sensitivity (HMS) direction. The above analysis shows that equation (9) defines eccentric circles whose centers are on the same line lying in the odd quadrants of the coordinate system (m, n), and its HSS passes through even quadrants. Thus, the equation of the isolines of a bridge circuit including EC sensors on the complex plane has the form 19 :

where A = P2 − 1; B = 2d[2P 2 + (α − 1)]; C = 2[2P2 + (α − 1)]; D = (d2 + 1)[4P2 − (α − 1)2]
The isolines radii are given by:
and the isolines center coordinates are:

In the absence of a signal Usdef = 0; P = P0 =
which has no free term. This means that the given hodograph passes through the origin of coordinates (m, n). 19 Figure 3 shows the isolines of the bridge circuit, into the adjacent arms of which two identical EC sensors are connected in the unbalanced mode with α = R3/R4 = 1.3.
An unbalanced bridge with α = R3/R4 = 1.3. 1: the hodograph of a probe located above a non-magnetic conductive half-space. Probe’s gap α = 0.4; general parameter β0 = 0.7. AB is the line connecting the isolines centers – hodograph maximal sensitivity (HMS).
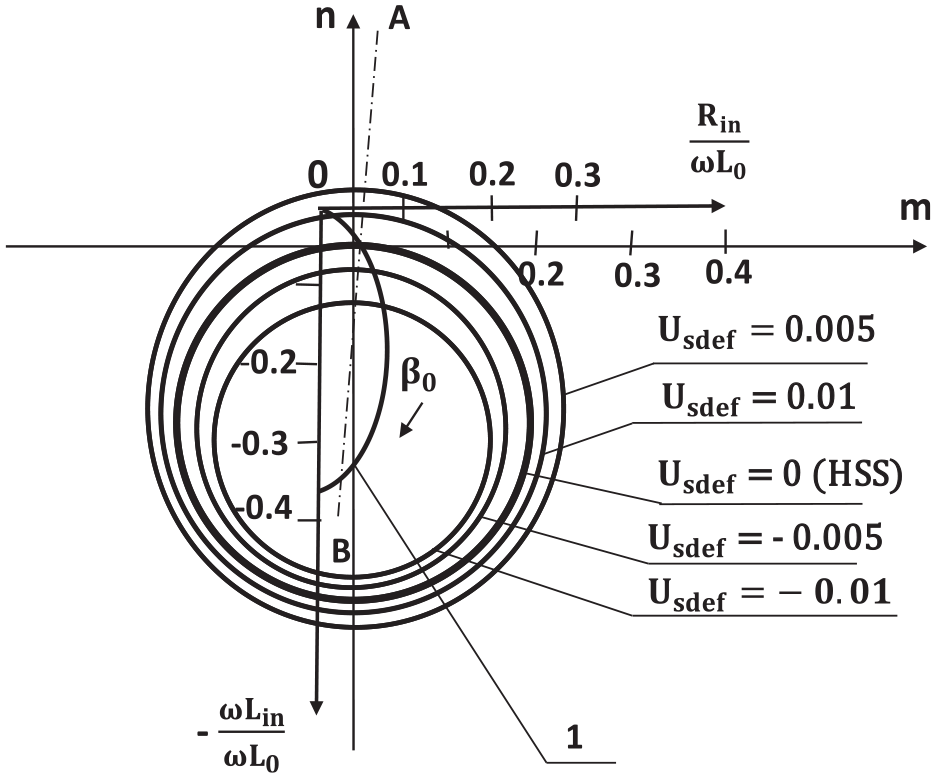
In the balanced mode (

The equation (14) presents two imaginary lines intersecting at origin. 12 The physical meaning of this result for the balanced mode is a lack of possibility to suppress any signal caused by the introduced impedance of any sign and magnitude. Thus, in this mode, selective signal suppression is impossible (see Figure 4).
A balanced bridge. A = 1.0. Probe’s gap α = 0.2; general parameter β0 = 1.7.
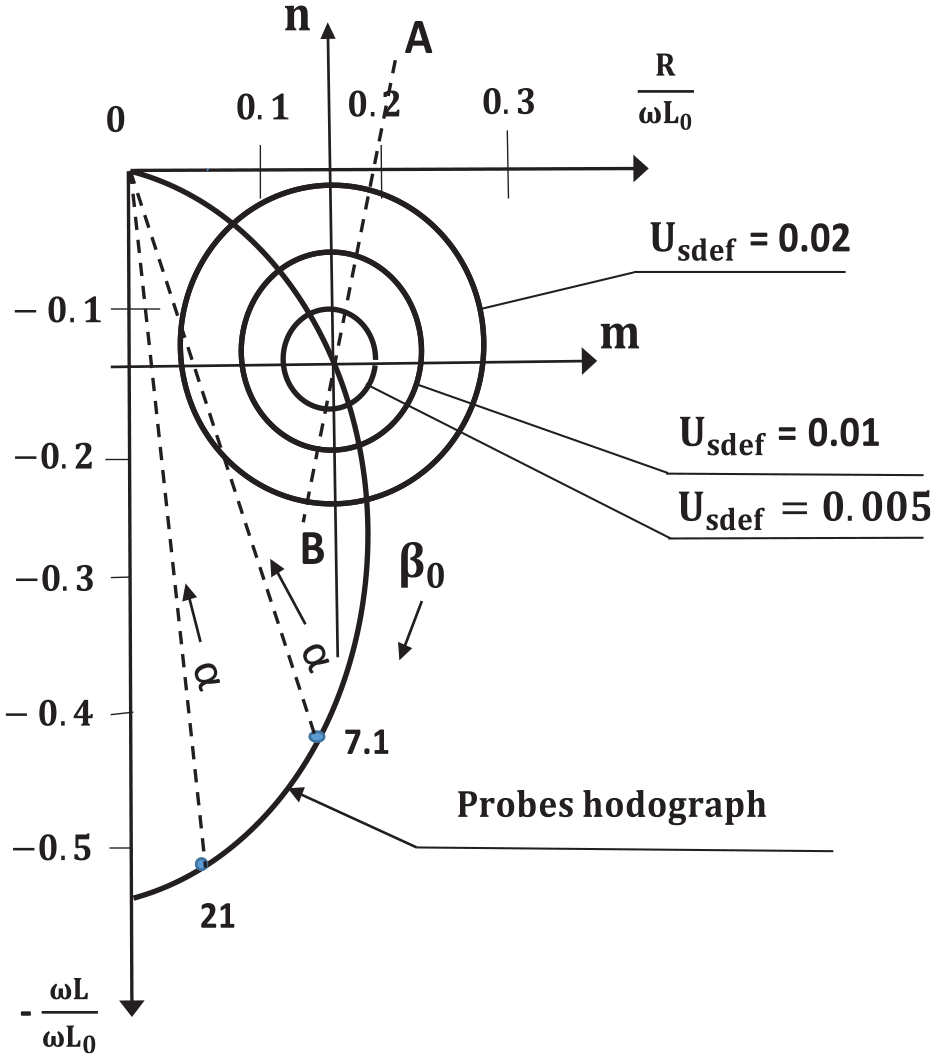
Figure 5 shows the isolines of the bridge circuit, into the adjacent arms of which two identical eddy current sensors are connected in the unbalanced mode with α = R3/R4 = 0.7.
An unbalanced bridge with α = R3/R4 = 0.7. 1: Hodograph of a probe located above a non-magnetic conductive half-space. Probe’s gap α = 0.4; general parameter β0 = 0.7; AB – line of isolines centers.
The diameter of each isoline, corresponding to a certain introduced impedance (imbalance), determines the sensitivity to that impedance. For example, for Usdef = 0.005, the minimum diameter of the isoline and hence the maximum sensitivity are obtained when the bridge is balanced. However, there is no possibility of suppressing interfering factors. It worth also to note that for α = 3 the HSS equation degenerates into a family of lines satisfying the following equation:

These lines passing through the origin lie in even quadrants, as their slope is numerically equal to the attenuation of the transducer with a minus sign. Figure 6 shows a family of these lines, which are HSS bridge schemes for the case of α = 3. It can be seen from Figure 6 that as the attenuation d of the probe increases, signals due to high-reactance introduced impedances will be suppressed. Similar linear hodographs can be used to suppress interfering signals when the gap changes.
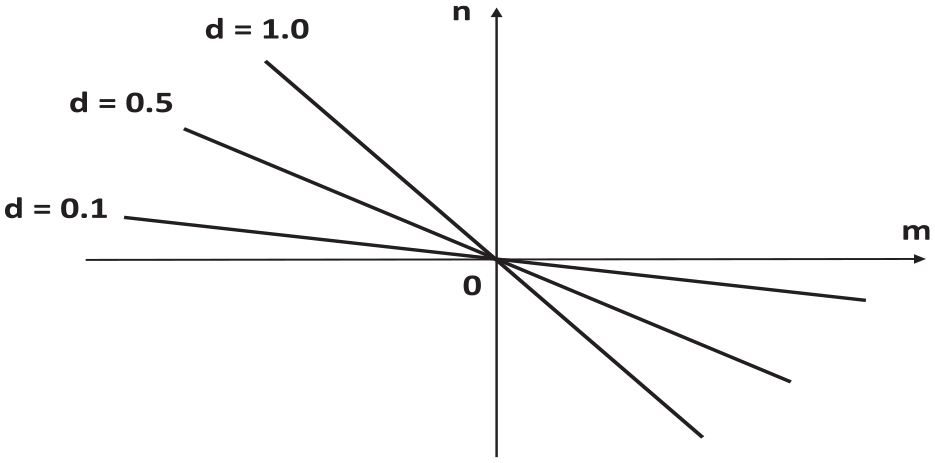
Linear HSS of the bridge circuit at α = 3.
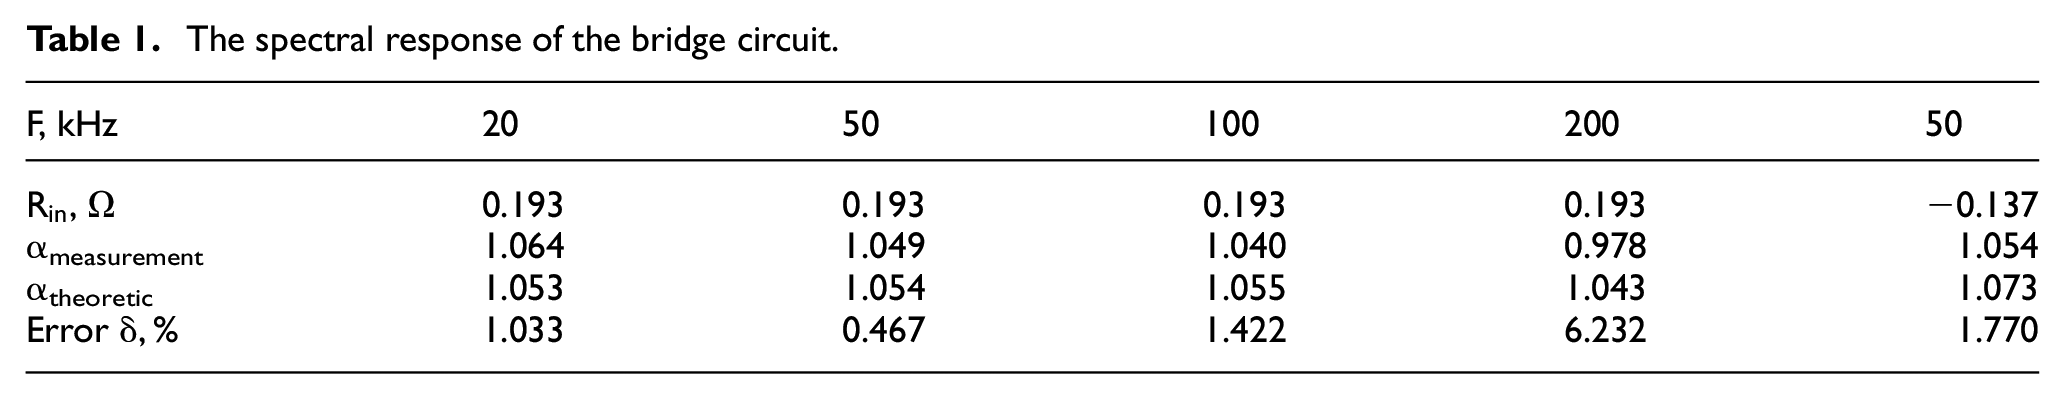
We used the R-333 class 0.5 and the K12-1a meters for measuring the resistance and inductance, respectively. The measurement error was 2%. The measurement results are given in Tables 1 and 2.
The spectral response of the bridge circuit.
Required values of the input impedance for selective suppression of various impedances.
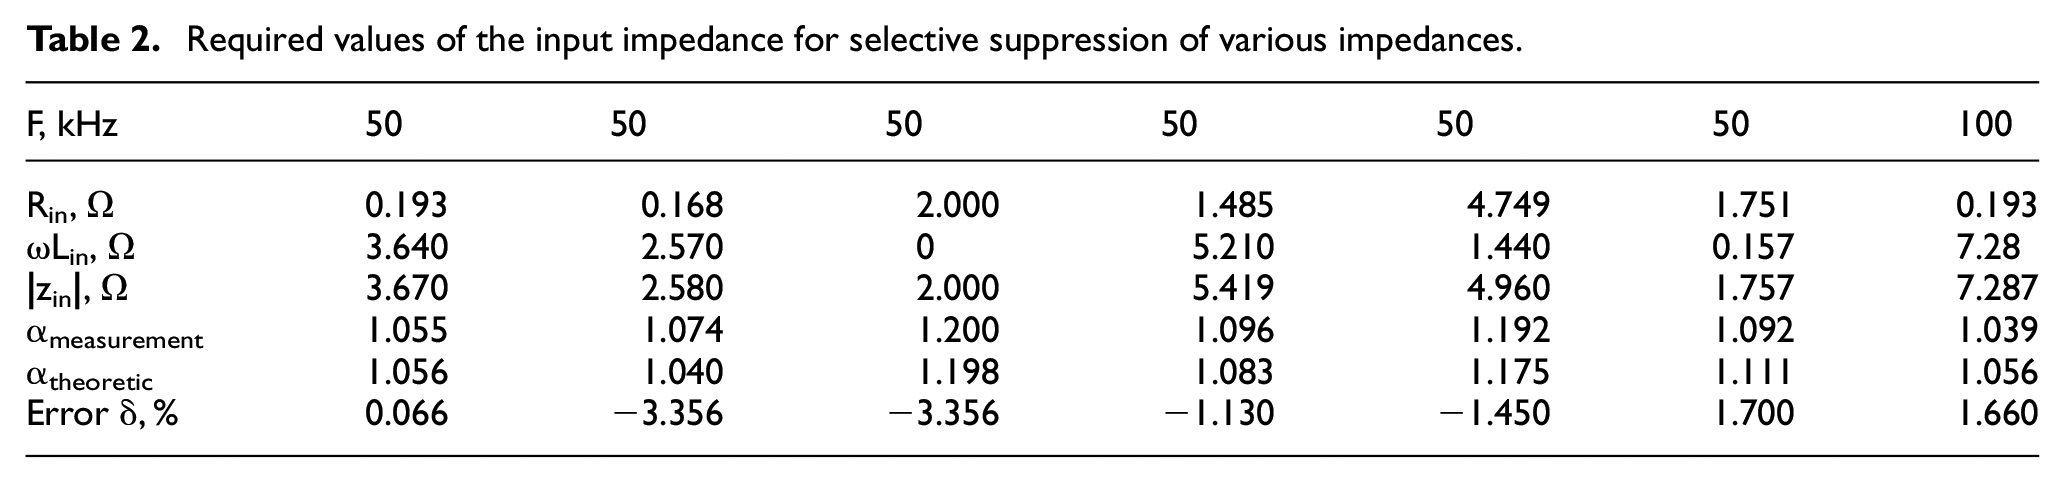
Table 1 shows the results of selective suppression when measuring the spectral response of the bridge circuit. Table 2 shows the selective suppression of various impedances.
Experimental verification
In our experimental investigation, we prioritize the selective suppression of interfering factors. Therefore, we choose equation (6) for experimental verification. This test was performed on a laboratory prototype of the bridge circuit in Figure 7.
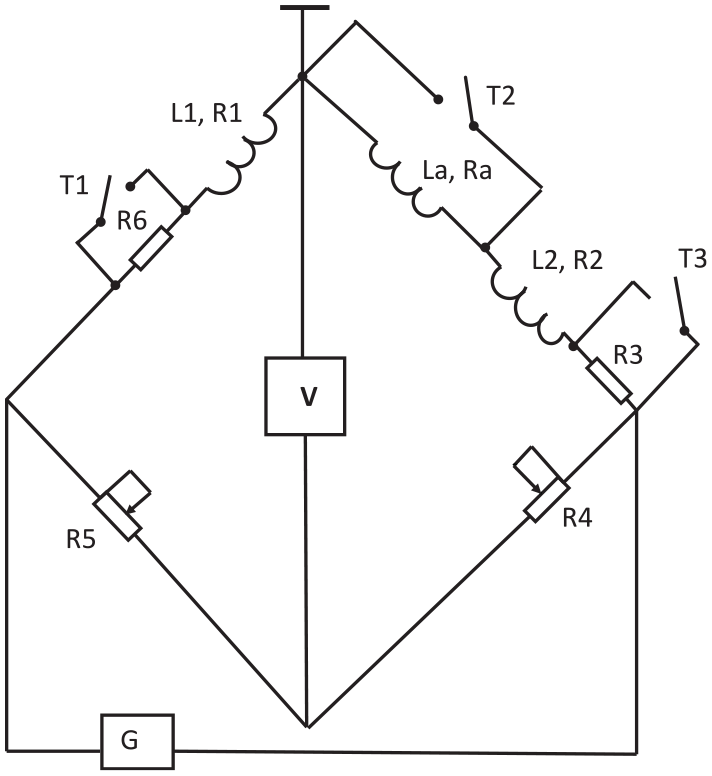
Experimental bridge interface circuit: G – the G3-33 standard signal generator, V – the V3–14 mV meter, L1 = 102.4 μH with series resistance R1 = 4.787 Ω, L2 = 102.3 μH with series resistance R2 = 4.71 Ω, R3 = 75.08 Ω, La = 11.6 μH with series resistance Ra = 0.193 Ω, and R6 = 2.0 Ω.
We can see from the above results that the calculated values of α0 are very close to the experimental ones.
Hodograph of maximal sensitivity (HMS)
From Figures 3 and 5, it is easy to see the direction of the fastest growth of the output signal (HMS) for the considered variant of the bridge circuit. Obviously, this is the line of centers AB. It crosses all isolines at right angles, in the “steepest descent” direction, 1 and passes through the odd quadrants of coordinates system (m, n). It is important to note that vectors of impedances introduced due to subsurface discontinuities lie in the first quadrant. This feature is inherent in bridge circuits, in contrast to the resonant type circuits. As it is well known, HMS of the resonant type circuits lies in the even quadrants of the (m, n) system. The HSS of the bridge circuit lies in even quadrants, that is, where the clearance line is located. This creates the conditions for optimizing of EC testing using a bridge circuit. However, this may weaken the detection of surface discontinuities, since their introduced impedance vectors also lie in the second quadrant when β0 < 3.0. If it is desired that the subsurface discontinuities of interest be revealed with maximum sensitivity, the following condition should be fulfilled:
where:
In conclusion, we have shown the possibility of using a bridge circuit for simultaneous detection of surface and subsurface defects. We considered both static and dynamic modes when monitoring materials with low conductivity (β0 < 2), for example, stainless steel products. If the probe’s Q is low, the angle ϕ of line AB decreases, which can lead to coincidence of the introduced impedance vector of the surface defect with the HSS, as shown in Figure 8.
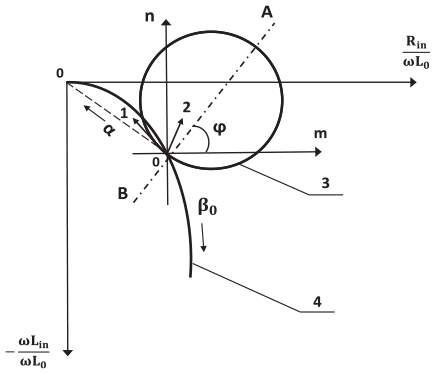
An unbalanced bridge. α > 1; Q = 1.2– the quality factor of the probe placed above the metal; 1: vector of surface defect impedance; 2: vector of subsurface defect impedance; 3: hodograph selective suppression (HSS); 4: hodograph of a probe, located above a non-magnetic conductive half-space. ϕ ≈ 500 – the angle of the line AB of the isolines centers.
Conclusion
In conclusion, we have derived an analytical theory for optimization and design of EC sensors placed in imbalanced bridges. It is based on creation of the isolines of the output signal of the input device of a EC flaw detector on a complex plane in conjunction with the hodograph of a sensor. Using the isoline method, the scheme of the EC probes placed in imbalanced bridges with parametric modulation and amplitude analysis is considered, for any arbitrary insertion impedance of finite value. It is shown, for the first time, that despite the non-resonant character of the bridge it has well-defined selective properties with respect to various introduced impedances. The only exception is the balanced mode that does not allow for suppressing any signal. In such regimes, suppression of the influence of interfering factors is impossible.
It is also shown for the first time that a bridge of such a scheme, in contrast to the resonant one, has a high sensitivity to subsurface discontinuities. It can be used to simultaneously detect both surface and subsurface discontinuities. In this case, it is necessary to use probes with a sufficiently high-quality factor Q. Otherwise, there is a risk of missing surface defects.
The optimum sensor interface is one in which the vector of the defect impedance coincides with the hodograph of maximum sensitivity, and the vector of introduced interference impedance coincides with the hodograph of selective suppression. If it is impossible to satisfy both conditions at the same time, satisfying the latter condition should be preferred.
Footnotes
Declaration of conflicting interests
The author(s) declared no potential conflicts of interest with respect to the research, authorship, and/or publication of this article.
Funding
The author(s) received no financial support for the research, authorship, and/or publication of this article.