
Abstract
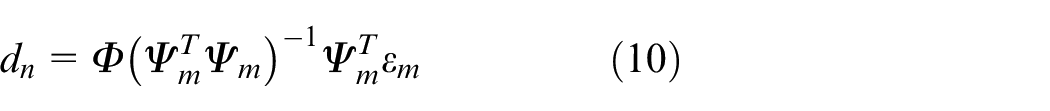
To achieve real-time sensing and deformation reconstruction of flexible plate structure, a 3D reconstruction technique based on a quasi-distributed fiber grating sensor network and order-optimized modal superposition method is proposed. Graphic visualization is introduced to the field of deformation monitoring, then the displacement field reconstruction of the typical structure of spacecraft is realized. Firstly, a finite element model of the four-sided fixed-supported plate structure is constructed, and the conversion matrix of surface strain and displacement are obtained based on modal analysis, and then the modal parameters are optimized through static simulation experiments; Secondly, the influence of the number and position of sensors on the reconstruction accuracy is studied, then a high-density distributed fiber grating sensor network is attached to the surface of the plate to construct an experimental FBG model of the spacecraft; Finally, concentrated loads are applied to the structure at different positions, and structure’s surface strain information is collected by FBG network, then the morphological reconstruction of the deformed structure is realized based on the improved model superposition method, which proves the feasibility of the algorithm. The results show that the reconstruction method’s average absolute error is less than 0.13 mm, so this method can be used to displace field reconstruction problems of flexible structures.
Keywords
Introduction
Plate structures are widely used in aerospace vehicles. In recent years, spacecraft need to perform more diverse and complex tasks, and their structures are becoming larger and lighter. The complexity of the working environment makes its structure very vulnerable to microelectronic flow, high and low-temperature alternating and space debris. In addition, during the mission, the spacecraft needs to complete some specific flight attitudes: violent climb in a short time, twist in the air, etc. The above factors will lead to the deformation of its structure and affect its flight mobility and reliability. Hence, the real-time monitoring and visual reconstruction of typical structural morphology are essential means to guarantee its operational stability.1–3 A monitoring system of the deformation is established as follows. The sensor array is arranged on the surface of the flexible structure to extract feature information in real time. Based on the computer system, the deformation state of the structure is analyzed and displayed in real time. The state that endangers the safety of the structure is alerted in time and the relevant parameters are adjusted, so as to ensure the safety of the spacecraft in service.
At present, the common methods of structural morphology sensing include camera method, accelerometer-based, or resistive sheet deformation monitoring method.4,5 However, the above methods generally have the disadvantages of bulky devices and relatively long measurement cycle, which are more suitable for laboratory environment or ground measurement, and they are difficult to achieve online real-time structural morphology measurement in complex environments; Fiber Bragg grating (FBG) sensor has high sensitivity, wide measurement range, high-temperature resistance, and high stability, which makes up for the shortcomings of many traditional sensors.6,7 What is more, FBG can also form a distributed network through wave division/space division and other techniques, which is more convenient and accurate to obtain deformation data at various points on the experimental structure, so it is widely used in the monitoring of spacecraft structure deformation.
For the three-dimensional reconstruction problem of structural morphology and image visualization,8–10 some researches have been carried out. The current reconstruction algorithms include the deflection curve method, inverse finite element method, neural network method, curvature transformation method, and modal method. Ko and Richards 11 and Ko and Fleischer 12 found a deflection curve-based reconstruction method using classical beam theory and extended its application to simple-supported beam, aircraft wings, etc. The core of this algorithm is segmental linearization, which discretizes the structural deformation and expresses the strain distribution of each segment by a polynomial, finally realizes the deformation field reconstruction by quadratic integration; Tessler and Spangler 13 proposed an inverse finite element method, which approximates the finite element model by using different error functions and constructional shape functions, thus achieving structural deformation reconstruction; Kefal and Oterkus 14 applied the inverse finite element method to the deformation and stress monitoring of the hull. They used the finite element model to simulate the experimental strain, studied the influence of the number and position of the sensors on the reconstruction accuracy, and finally realized the real-time reconstruction of the hull structure. Gherlone et al. 15 proved the effectiveness of the inverse finite element method for structural reconstruction and extended it to trusses, beams, and frames; Artificial neural network as a new intelligent algorithm 16 has also been applied to the field of structural health monitoring, Mao et al. 17 used the self-learning neural network training system to approximate the static deformation as a linear combination of strains, and expressed the linear mapping with the strain-displacement transformation matrix. They also point out that a good shape reconstruction could be achieved under the premise of enough training cases; Bruno et al. 18 noted a method combining simulated annealing and neural network to establish the mapping relationship between the strain and displacement of the target structure by training experimental samples. Finally, they calculated the current structure’s deformation state by using a small amount of strain measurement values; Zhang et al. 19 took the wing main load-bearing structure – fishbone as the research object and used the method of inverse finite element method and deformation piecewise superposition to monitor the deformation of the structure under different deflection angles; Yuegang et al. 20 proposed a curvature integral recursive algorithm with error compensation for the deformation reconstruction of aluminum alloy sheet, which realized the transformation from strain to curvature, and then obtained the deformation curve. This method effectively improved the reconstruction accuracy through error compensation. Through comparative study, it is found that the inverse finite element method and the deflection curve method are suitable for relatively simple models but are not suitable for large engineering structure measurement, and their application scope is narrow. The curvature reconstruction algorithm’s core is interpolation and recursion, so this method will accumulate calculation errors in the inversion process, which will reduce the reconstruction accuracy. The error size of the neural network method depends on the experimental sample’s accuracy, and the method requires the collection of a large amount of experimental data. Therefore, the experimental process is relatively time-consuming. In the research and analysis of the system, the combination of model-based simulation analysis and experimental verification is often used21–24 and the modal superposition method is an algorithm that combines simulation and experiment, which has a short experimental cycle. It can be used for complex structures and has general applicability in the morphological reconstruction of structures.25,26 In the past studies, Bang et al.27–29 built a strain-deformation model of wind turbine tower using the modal method and collected strain data by using the fiber Bragg grating sensors which were mounted on the surface. Finally, real-time shape estimation of wind turbine tower structure was realized; Rapp et al. 30 used FBG sensors to measure the strain information of two-dimensional cantilever beam structures. They pointed out that the modal deformation matrix condition number is an excellent technical index that can reflect the advantages and disadvantages of sensor layout well. They optimized the layout of sensor networks by numerical simulation and used modal transformation matrix to monitor and reconstruct the whole displacement field of cantilever beam; Li et al. 31 embedded the optical fiber grating into the smart skin antenna, adopted modal analysis and state space theory, and finally realized real-time reconstruction of the displacement field of the deformation antenna structure by using a small amount of strain data. Zhang 32 used the modal method to study the bending and torsion states of flexible structures, proved the feasibility of this algorithm for the problem of shape perception and reconstruction of plate structures.
The current researches are mainly devoted to relative and simple cases such as the displacement field and strain field inversion of unilateral fixed-supported structures: wings, beam structures, and solar panels, etc. In this paper, the more complex four-sided fixed aluminum alloy plate structure is selected as the research object. Based on the traditional single point loading, a multi-point loading mode is added. The sensor elements with higher sensitivity and better stability are selected to form a high-density, wide-range, and evenly distributed quasi distributed fiber Bragg grating sensor network with temperature self-compensation. Based on finite element simulation, a displacement field reconstruction method with modal superposition as the core is proposed to construct the structural deformation monitoring system. The main steps are as follows:
Based on the finite element simulation experiment, the reconstruction effect under different modal orders is compared to select the appropriate modal order.
The layout of the sensor network is optimized by analyzing the influence of the number and location of FBG sensor networks on the accuracy of reconstruction.
The experimental system of structural deformation sensing is built, and the single-point loading and multi-point loading experiments are carried out. The deformation information is obtained by the fiber Bragg grating sensor network and it is compensated by temperature, finally combined with the modal superposition method to realize the morphological reconstruction of the deformation structure under different working conditions.
The system is mainly applied to the situation that the flexible structure in the aerospace field cannot be fully pasted with FBG sensors, causing incomplete acquisition of deformation monitoring information. The whole field displacement of the flexible structure can be monitored through the modal superposition reconstruction algorithm and a limited number of FBG sensors. Then it provides the basis for structural damage identification to ensure the stability and safety of spacecraft in operation.
Principle of displacement field reconstruction
Principle of FBG strain measurement
Fiber Bragg Grating sensors have been widely used in collecting strain information of large flexible structures because of their small size, anti-electromagnetic interference, and high measurement accuracy. 33
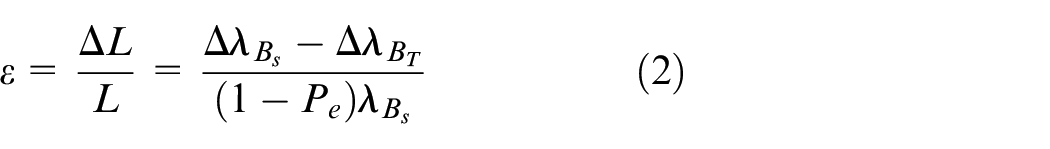
According to the coupled-mode theory, when broadband light is transmitted in the fiber grating, mode coupling is generated, the relationship between the Bragg reflection peak wavelength and the fiber grating period is as follows:

Where
When the plate is deformed, the FBG sensor pasting on the structure surface will also be deformed, as shown in Figure 1, and the central reflection wavelength will shift accordingly due to the influence of strain and temperature. After the experimental calibration, the relationship between the axial strain of the structure and wavelength offset can be obtained:
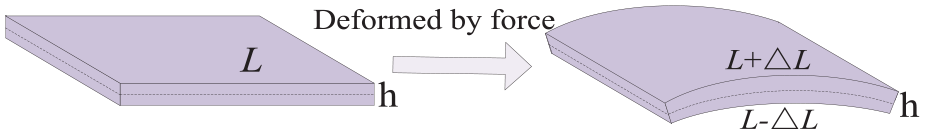
Structural deformation diagram.
Where
Modal superposition method
The four-sided fixed-supported plate structure can be equated to a damped multi-degree-of-freedom linear system under external load, and the vibration equation of the multi-degree-of-freedom system is as follows:

Where
The characteristic equation of the non-damage-deformed structure is as follows:

Where
Equation (3) can be decoupled as:

The total response of the structure is equal to the superposition of contributions of each mode. After knowing the natural mode of the structure, the displacement

Where
Similarly, the structure’s strain can be obtained from the modal superposition, and the modal coordinates are consistent with those of the displacement modes.
Where
In the experimental process, the number of sensors is far less than the number of nodes in the finite element strain field

Where
The displacement field of the structure can be obtained as:
If
Then

Where
Workflow of the experimental system
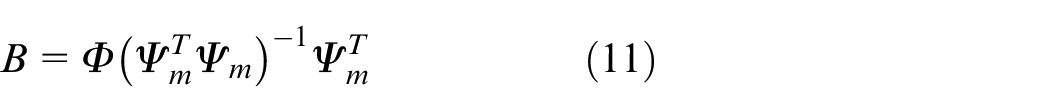
The four-sided fixed-supported plate structure that composes the spacecraft cabin is used as the experimental object. The plate structure is made of aluminum alloy, with the length of 660 mm, the width of 660 mm, and the thickness of 3 mm.
For thin plate structures, the shear strain corresponding to the shear force along the z-axis is not important for the plate’s bending deformation and can be ignored. It is derived that the plate deformation satisfies the following conditions:
Plane assumption. It is assumed that the cross-section after deformation is still plane and perpendicular to the axis after deformation.
Continuity assumption. It is assumed that the plane’s axis changes from the original horizontal straight line to a continuous smooth curve.
The structure can be equated to a plane in space, and the strain field distribution of the whole structure can be expressed by obtaining the strain information of the structure surface. Therefore, the study on the four-sided fixed-supported plate structure is transformed into the spatial surface reconstruction. The workflow is shown in Figure 2.
Flow chart of structural morphology perception and displacement field reconstruction.
Firstly, build a simulation model, obtain the strain-displacement conversion matrix of the structure based on modal analysis, and verify the reliability of the conversion matrix with statics simulation results; secondly, carry out the load test. The experimental system consists of a quasi-distributed fiber grating sensor network, a high-precision demodulator and a dial indicator array. By controlling the motor to apply a load force to the four-sided fixed-supported flat structure, a high-density fiber grating sensor is arranged to collect structural deformation information. Furthermore, the sensor information is demodulated by a high-precision demodulator into an electrical signal that can be displayed and calculated, namely wavelength information. What’s more, the displacement information generated by the deformation is collected by the dial indicator array; finally, reconstruct the displacement field cloud image of the structure, and compare it with the real displacement information obtained by the dial indicator to obtain the algorithm error.
ABAQUS simulation experiment
Modal analysis
The premise of obtaining the strain-displacement transformation matrix is to establish an accurate finite element model. Aluminum alloy plate density is
Experimental model and finite element model of the plate: (a) experimental model and (b) finite element model.
The modal analysis of the structure is carried out first to obtain the structure’s strain modal matrix and modal displacement matrix.
For each vibration mode of the structure, its contribution to the overall response usually decreases as the frequency increases. Therefore, the first 20 modes of the structure are extracted, which frequency is
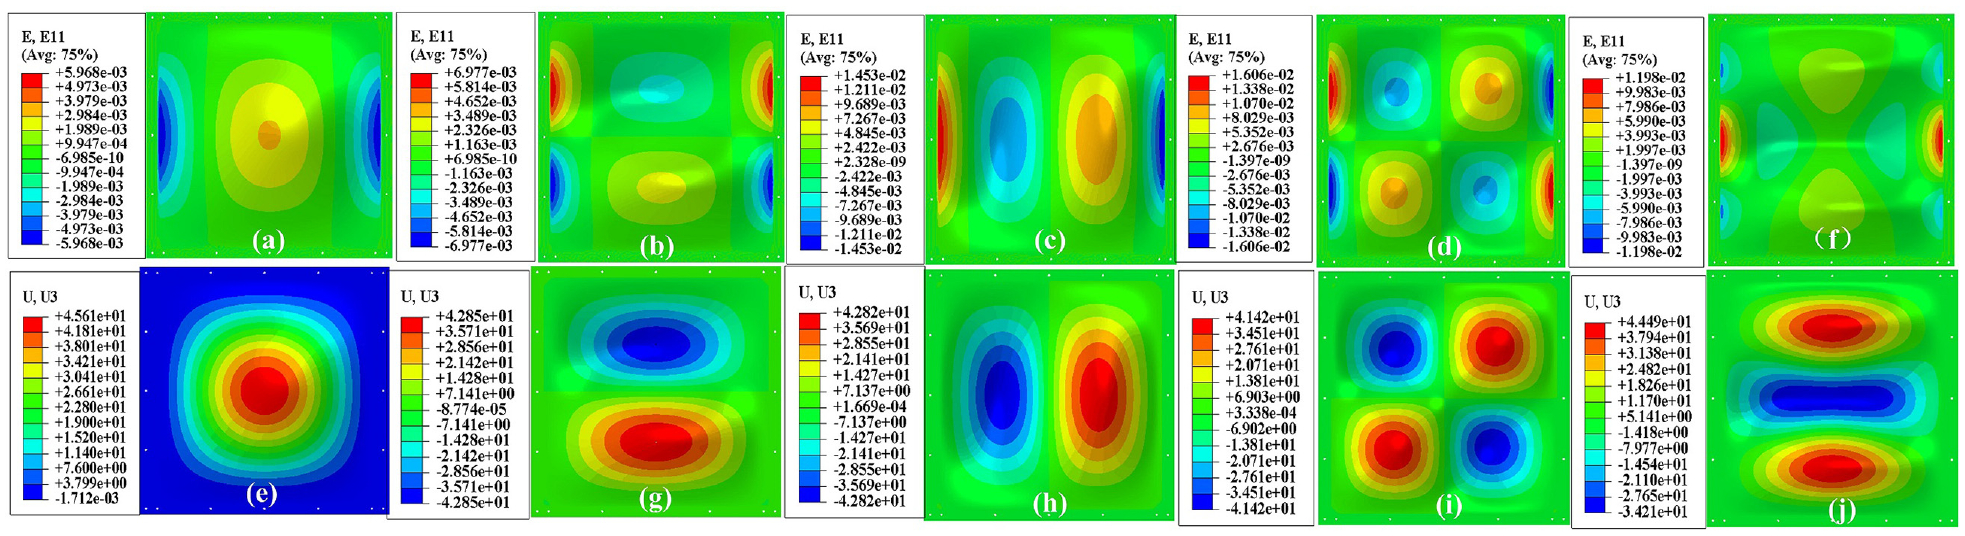
Distribution of strain (E) and displacement (U) mode for the first five orders of the structure: (a-f) Strain modes and (e-j) Displacement modes.
Frequency of vibration pattern.
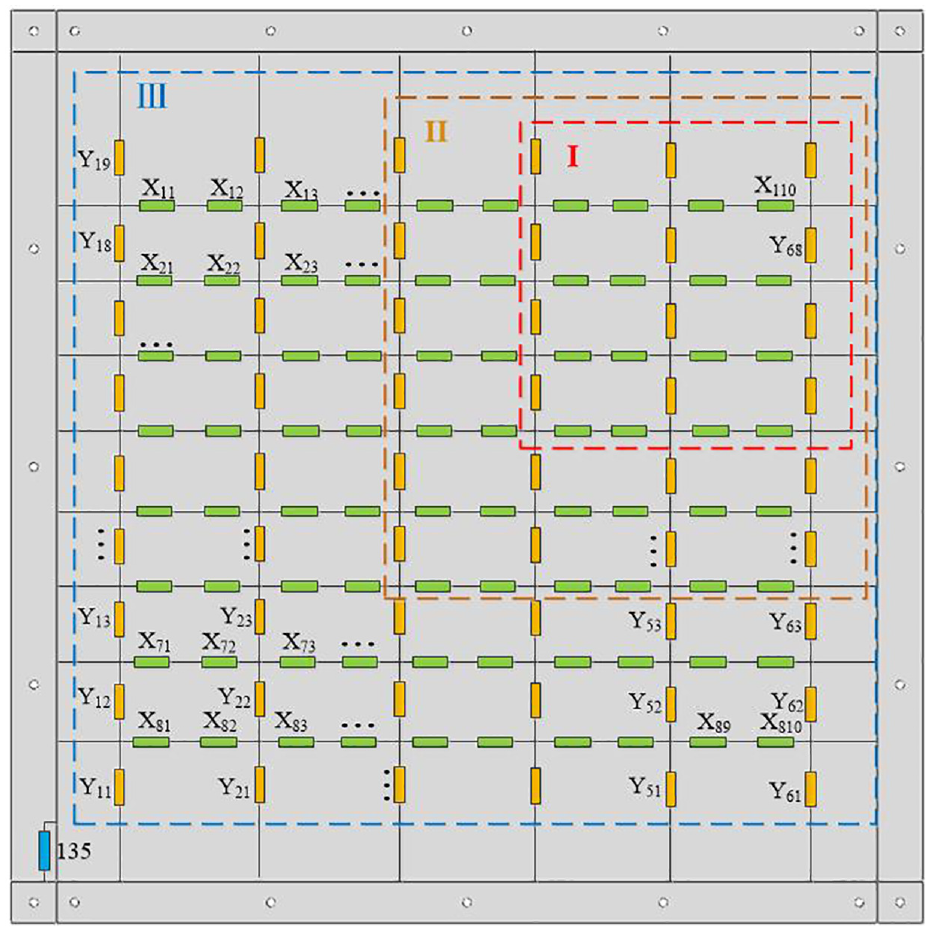
The elements that make up the strain modal matrix are the structural strain data in the X and Y directions collected by the FBG sensor. In order to ensure the comprehensiveness and accuracy of the collected data, high-density, large-scale, and evenly distributed sensors are deployed. As shown in Figure 5 there are 80 transverse strain measuring points and 54 longitudinal strain measuring points, among which the transverse and longitudinal adjacent measuring points are separated by 50 and 60 mm respectively.
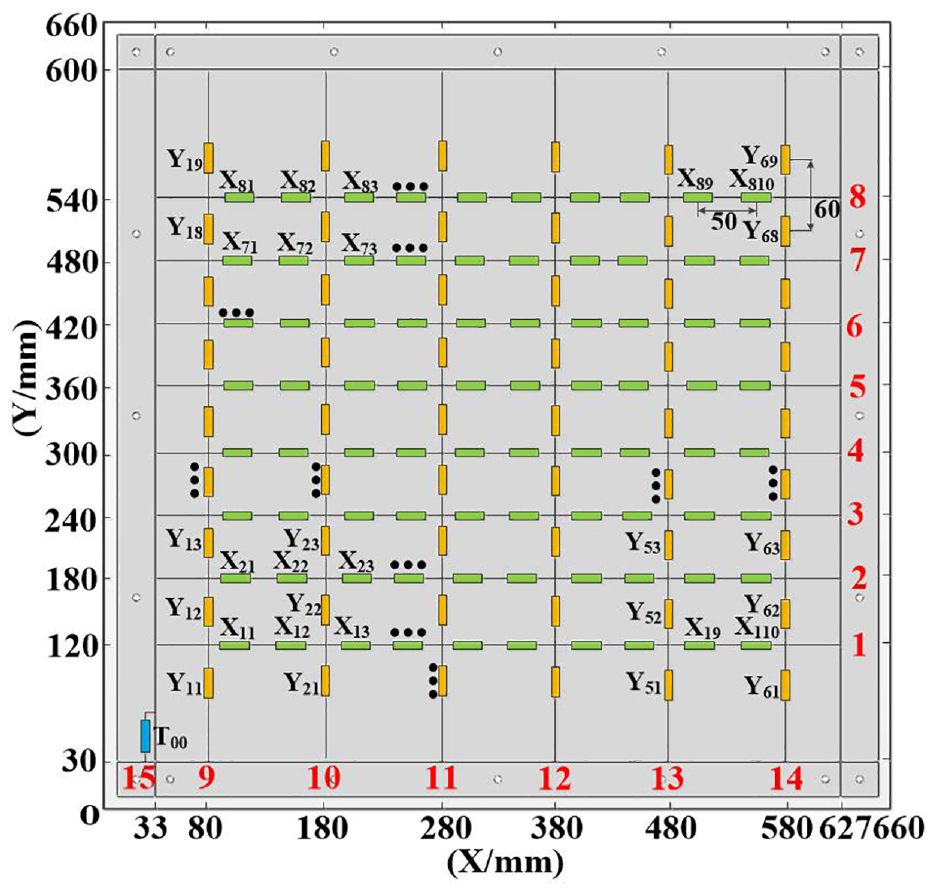
Schematic diagram of strain measuring point.
Besides, to achieve the reconstruction of the full-field displacement of the flat plate, it is necessary to extract a high density of nodal modal displacements, so extracting the Z-axis displacements of a total of 462 nodes in 21 rows and 22 columns as shown in Figure 6, the linear distance between adjacent nodes is 24 mm, and the distance from the edge node to both sides is 80 and 90 mm.
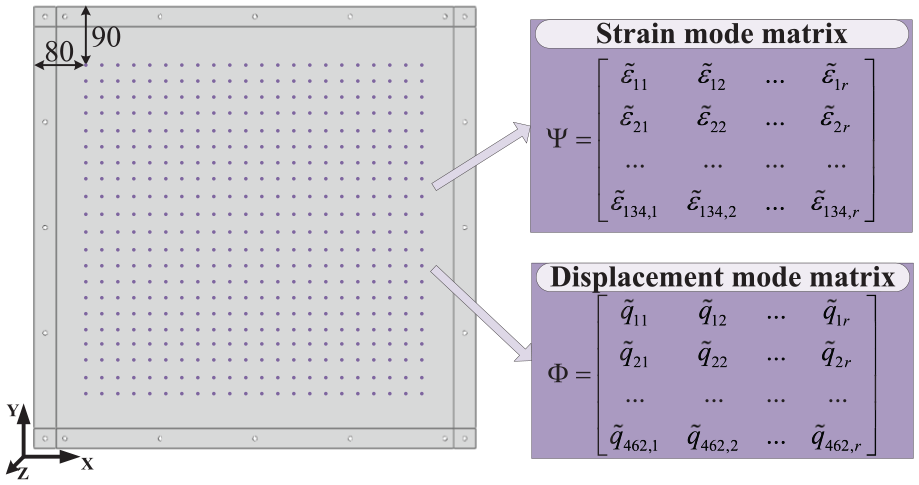
Distribution of displacement field node (units: mm).
Statics simulation
Deploying a high density of sensors can fully acquire structural deformation details. Since the modal information in each measurement point is different, if the different model order or point’s strain data is used to reconstruct the displacement field, the result may vary. Therefore, the next section will focus on the number of model orders and the position of measurement points. What is more, the mean absolute error can be used to evaluate the reconstruction effect.
Where
Selection of mode order
To improve the modal superposition method’s accuracy and reliability, select the appropriate mode order and the number of fiber grating sensors, so carry out a simulation experiment on the force and deformation of the structure.
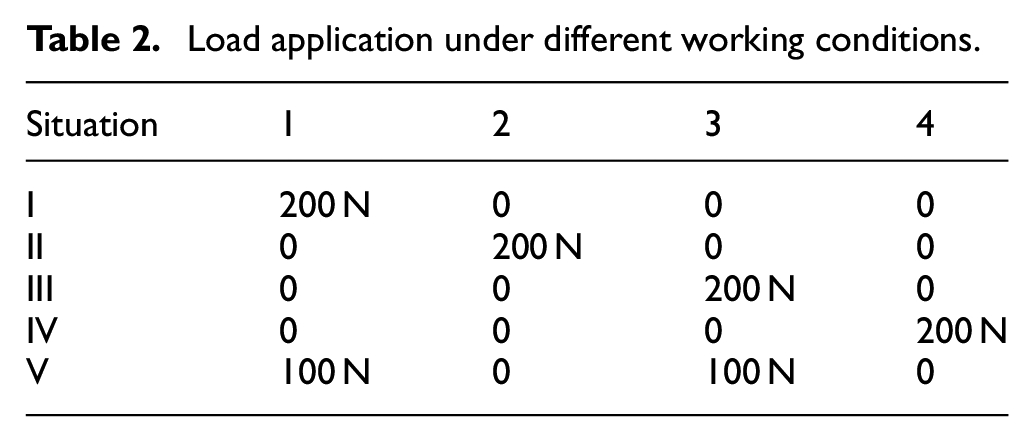
The four nodes with coordinates (330, 330), (480, 330), (480, 440), and (330, 440) in Figure 4 are selected to apply concentrated forces that perpendicular to the XOY plane. The application of the load force is shown in Table 2.
Load application under different working conditions.
After completing the statics simulation analysis, bring the strain data of the extracted structure into equation (12) to obtain the full-field inversion displacement value, then compare the reconstruction error when using 1–20 modes, and the results are shown in Figure 7.
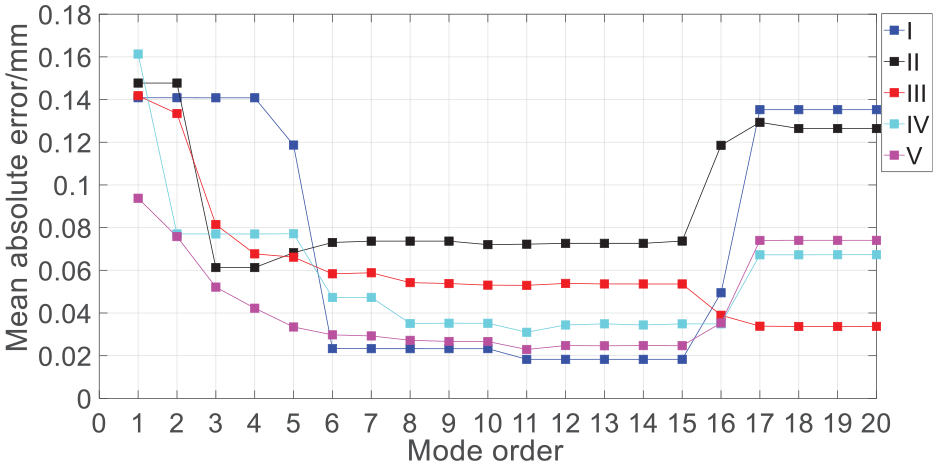
Reconstruction error at different orders.
According to Figure 7, the error is increased when the selected vibration order is too small or too large. If the order is too small, some modes that play a leading role may be ignored; besides, for the experimental structure, the simulation modeling reliability of its high-order mode shapes is relatively small, and errors may even occur, so the high-order modes are generally ignored.
Based on the results of reconstruction in five cases, we can conclude that when the mode of the 11th order is reached, the reconstruction error drops to a relatively low level, and the error magnitude is relatively stable in the left and right sides of this order, so order 1–11 is chosen as the modal parameters for the displacement field reconstruction.
Sensor layout optimization
The accuracy of the reconstruction algorithm depends not only on the modal order but also on the position and number of sensors. Firstly, the sensors should be placed in the place with large strain as far as possible. In addition, in order to select the most appropriate sensor layout, the relationship between the sensor network layout and the position of loading points should be studied. As shown in Figure 8, FBG strain sensors are arranged around the loading point to collect the information of the deformed structure in three situations. The number and distribution range of these sensors increase in turn.
Three sensor network layouts.
Firstly, (480, 440) is selected as the loading point with a load of 200 N. The inversion results are as shown in Figure 9, and Table 3 shows the algorithm errors under different combinations.
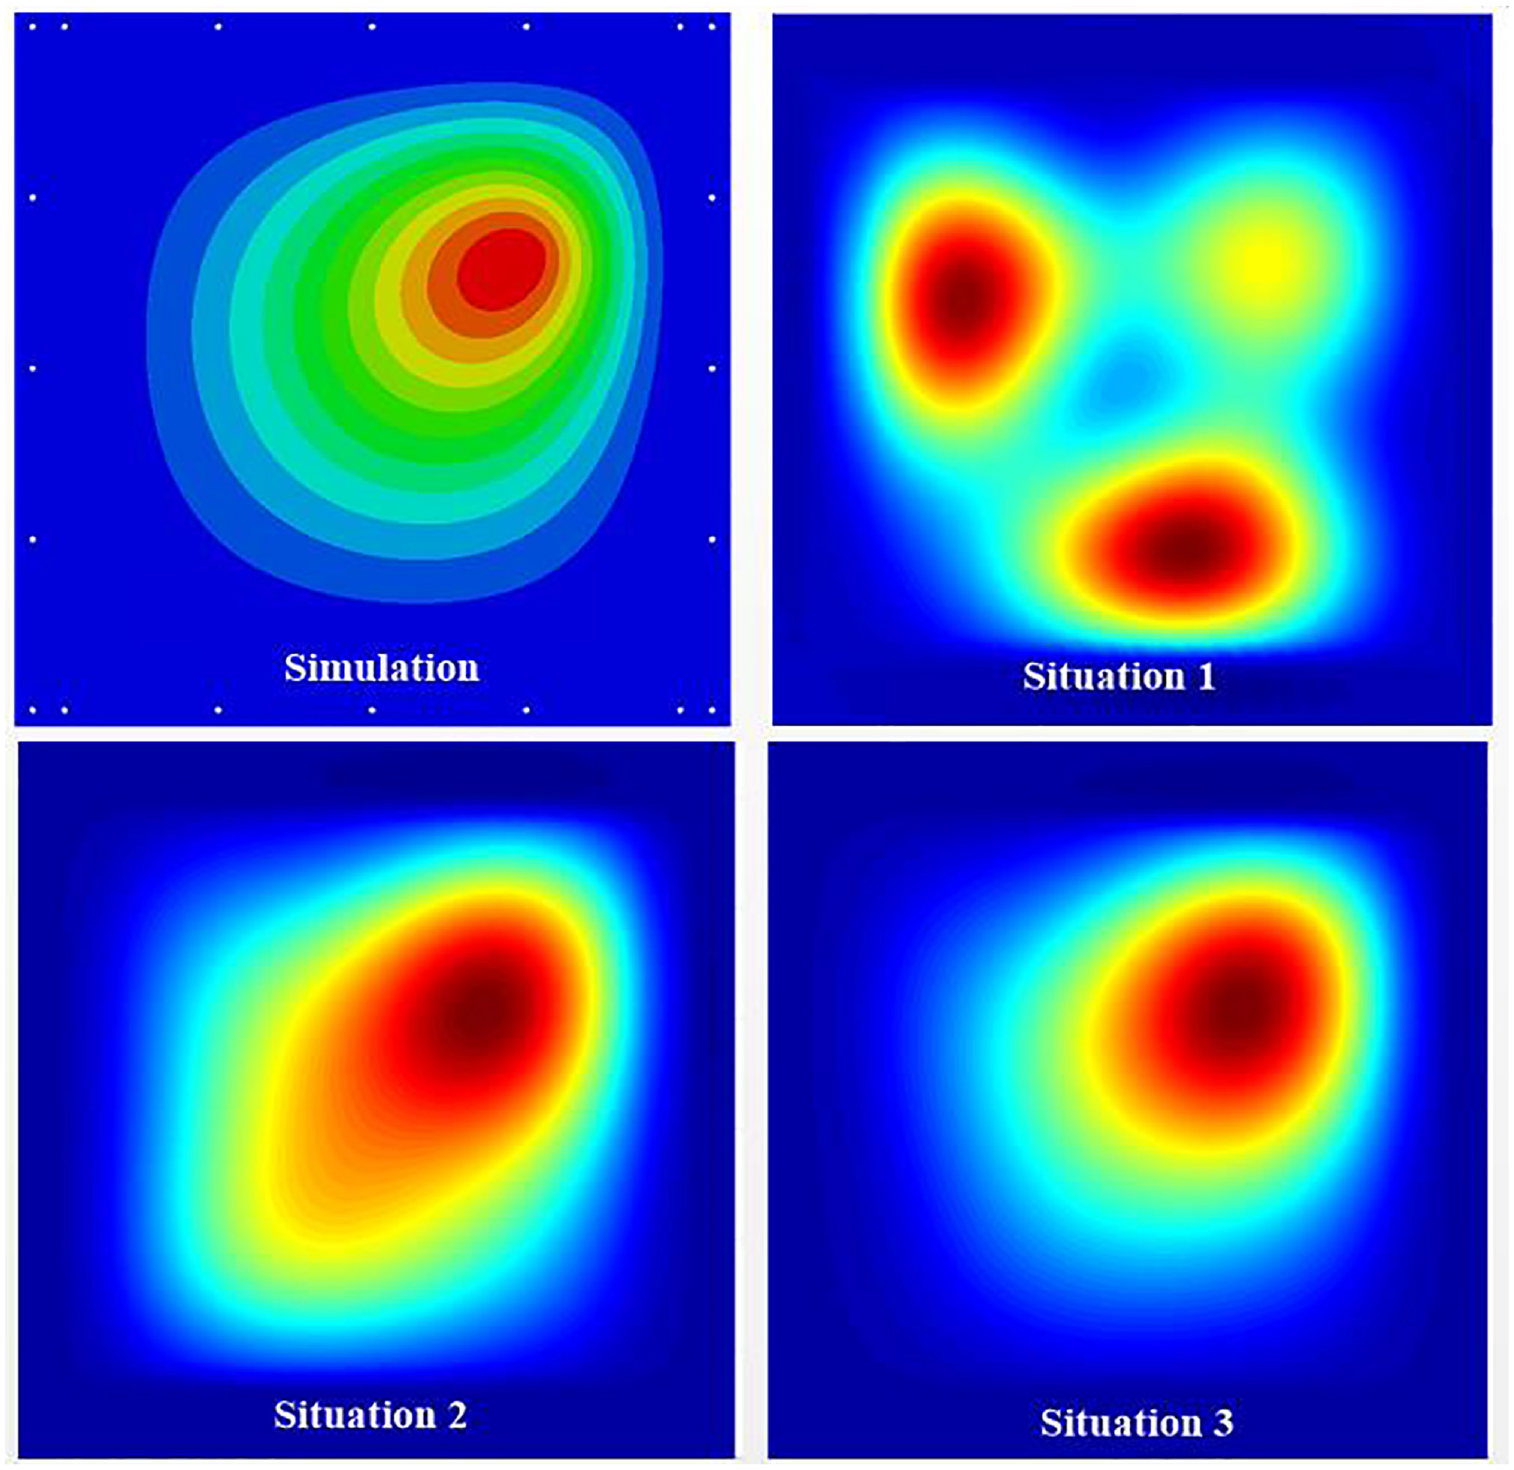
Displacement field distribution under load at (480, 440) based on three situations.
Mean absolute error based on three different FBG sensor networks.
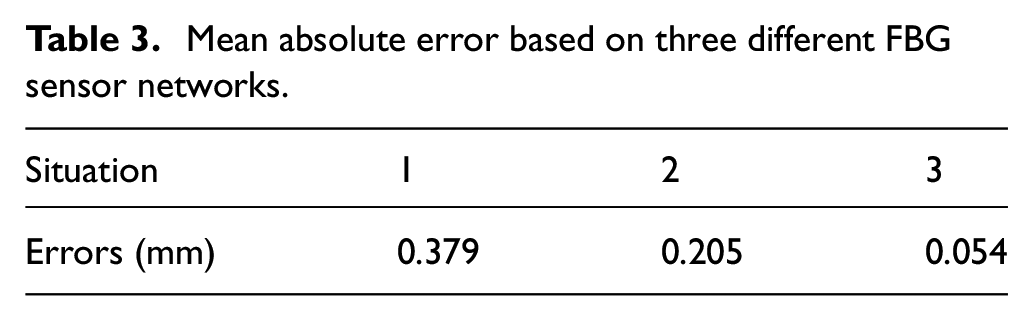
According to the data in Table 3, the number of FBG sensors in the first case is too small and the layout is too concentrated, and the data only includes information in a small range around the loading point, which is not comprehensive and accurate enough, leading to large reconstruction errors; In the latter two situations, the reconstruction accuracy is higher and the displacement distribution is in good agreement with the simulation results.
In situation 2, the number of sensors is large, but they are only arranged in the upper right part of the plate, so the universality may not be high. In order to verify the universality of the latter two situations (310, 330) is selected as the loading point to apply the load of 200 N. The inversion situation is shown in the Figure 10.
Displacement field distribution under load at (310, 330) based on latter two situations.
As can be seen from the Figure 10, the inversion results of situation 2 have a large deviation compared with situation 3. This is because the loading point is close to the edge of the sensor network in situation 2, a lot of effective information is likely to be omitted in the collection process. In conclusion, the sensor network with high density, wide range, and uniform distribution on the surface of the structure can obtain the deformation information accurately and comprehensively, thus effectively reducing the reconstruction error.
Displacement field reconstruction
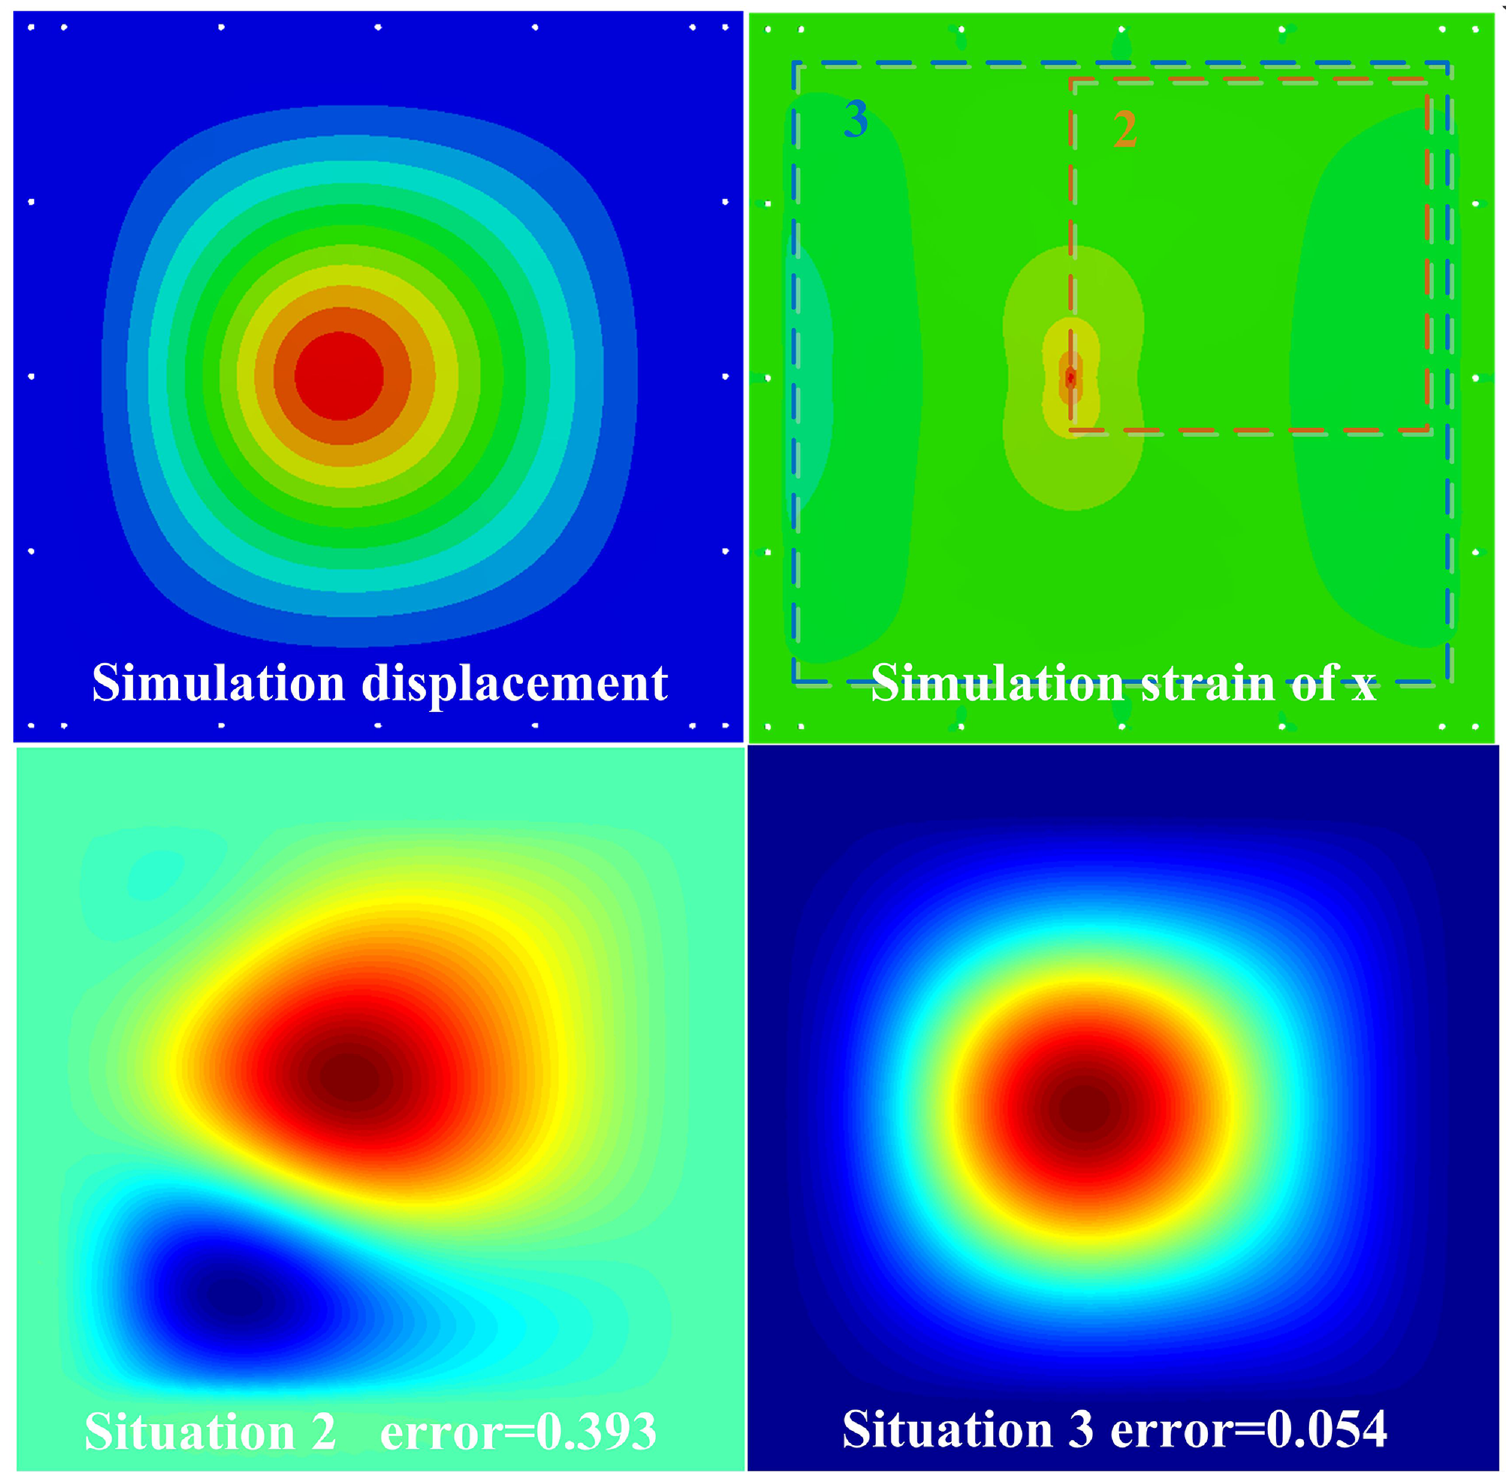
We choose 1–11 modes to form the strain model matrix and displacement model matrix, select 80 sensors and 54 sensors used to measure strain data in X-axis and Y-axis. So bring m = 134, n = 462, r = 11 to equation (12) to obtain the deformed structure’s deformation field distribution, as shown in Figure 11 and Table 4 shows the reconstruction errors under different loading conditions.
Cloud diagrams of the reconstructed displacement field and simulated displacement field for five working conditions: (a–e) reconstruction and (f–j) simulation.
Mean absolute error under different loading conditions.
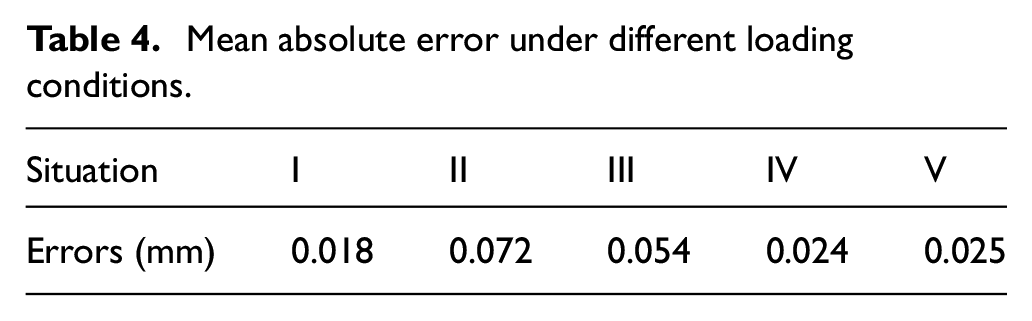
By comparing the displacement field clouds shown in Figure 11, it can be obtained that the displacement field distribution obtained by reconstruction is consistent with the simulation results, which can represent the deformation of the four-sided fixed-supported plate structure more clearly and has an excellent fitting effect, which proves the feasibility of the modal superposition method.
Load experiment
The modal superposition method’s relevant parameters are optimized through simulation experiments, and the practicality of the modal superposition method is further demonstrated based on load experiments.
Experiment system
FBG sensor network
The fiber grating sensor network is the core part of the deformation monitoring system, and the selection of its parameters will affect the accuracy of the experimental results to a certain extent. Table 5 shows the specific parameters of the sensor network.
(1) Quasi-distributed sensor network
Sensor network design parameters.
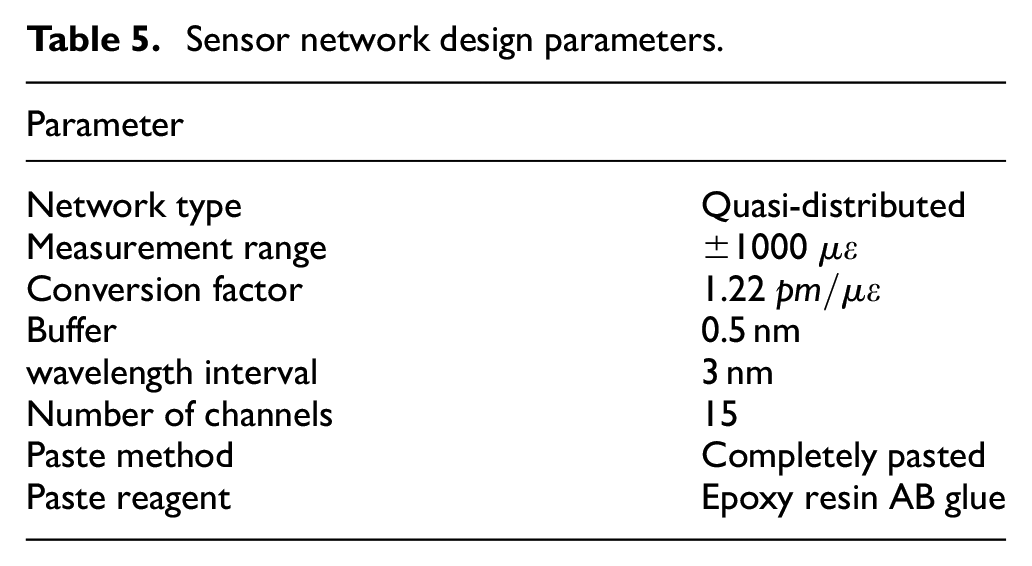
A quasi-distributed fiber grating sensor network is used, that is, multiple gratings with different central reflection wavelengths are connected in series on an optical fiber to obtain information of multiple measuring points. At this time, the optical fiber is only used as a transmission element. Compared with the fully distributed sensor network, which uses optical fiber as both transmission element and sensitive element, its sensor has higher resolution and greater flexibility.
(2) Sensor wavelength interval and number of channels
To obtain the deformation information of the flat structure vertically and horizontally, the orthogonal fiber grating sensor network should be arranged. As shown in Figure 5, 80 transverse strain measuring points and 54 longitudinal strain measuring points were set up respectively. In addition, fiber Bragg grating temperature sensors were deployed to compensate wavelength shifts caused by temperature changes. In order to ensure that the central wavelength and working range of each grating don’t overlap each other, multiple fiber demodulation channels are needed. The maximum number of sensors connected in series by each channel is affected by the wavelength interval of sensors and the light source width of fiber grating demodulation instrument.
The sensor wavelength interval

Where,
Assuming that
Where,
It is assumed that the detection range and wavelength buffer of the fiber grating sensor are the same, and the light source width of the demodulator is


According to equation (17), the maximum number of sensors that can be connected in series on each channel of the optical fiber demodulation instrument can be obtained.
According to the pre-experiment, the maximum displacement of structure which is generated by the motor doesn’t exceed 4 mm. Therefore, during the simulation experiment, the load is applied to the structure to make its center generate 4 mm displacement, and the values of the strain measurement points in Figure 5 are extracted. The results are shown in Figure 12.
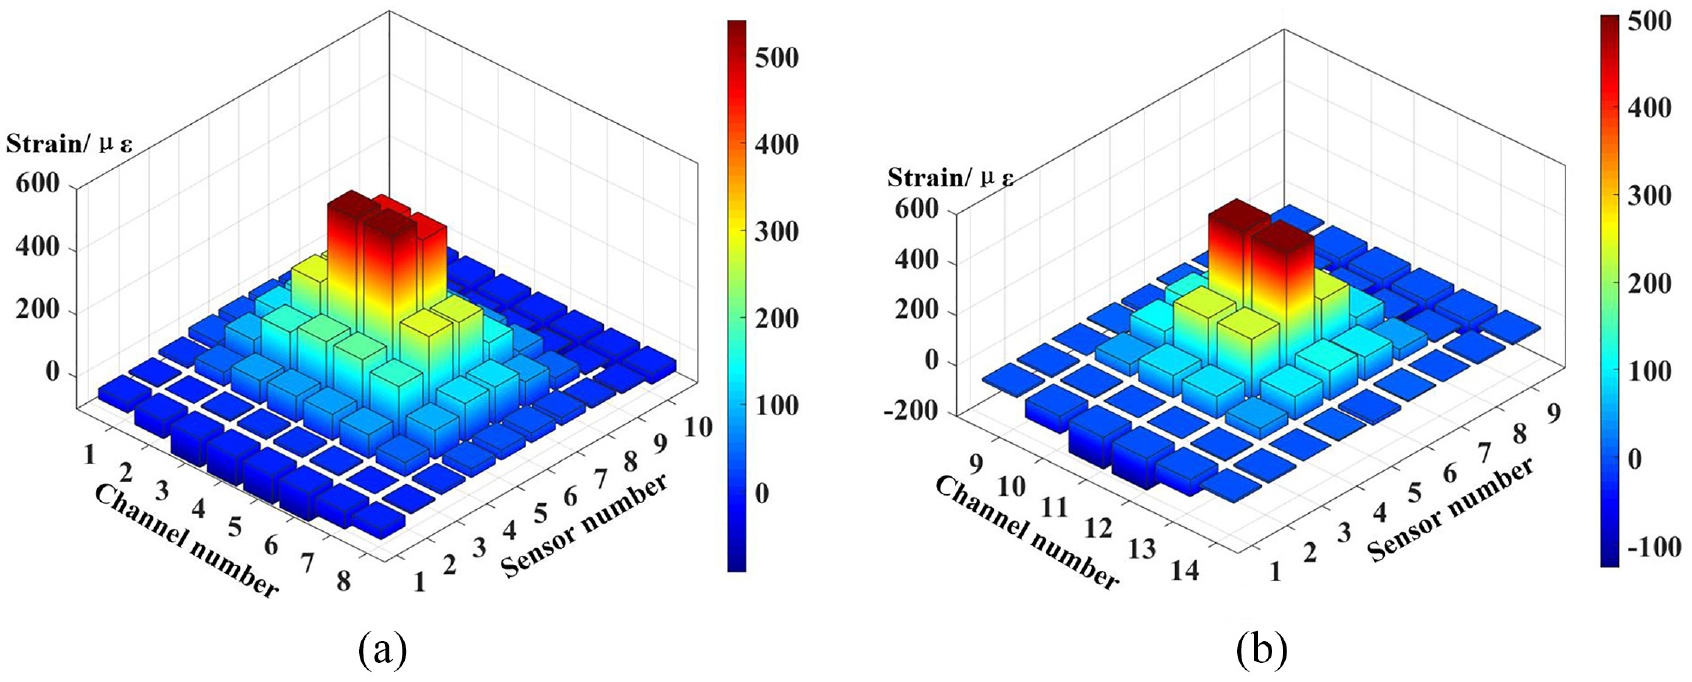
Simulated strain value at maximum displacement: (a) transverse point and (b) longitudinal point.
According to the simulation results, the structural strain value will not exceed
(3) Paste method and paste reagent
When the sensor is laid out, the choice of paste method and paste reagent is equally important.
There are three ways to combine the fiber Bragg grating sensor with the matrix structure: pasting at both ends of the sensor, completely pasting the sensor and embedding. When the sensor is embedded in the material, there will be stress concentration, which will affect the measurement accuracy. Moreover, due to the structural problems of the aluminum alloy plate itself, it is difficult to embed the sensor. In addition, compared with the pasting at both ends of the sensor, using the method of complete pasting, the sensor is more close to the matrix structure, which can ensure the accuracy and stability of measurement better.
As far as the paste agent is concerned, compared with the 502 glue, the epoxy resin AB glue is not easy to embrittle after curing. What’s more, it has higher temperature resistance and anti-aging ability. Therefore, the epoxy resin AB glue is the first choice as the adhesive agent.
Deformation monitoring system
The experimental platform consists of an experimental object (flat plate structure), a strain acquisition system built based on FBG sensors and a deformation acquisition system based on a dial indicators array, as shown in Figure 13.
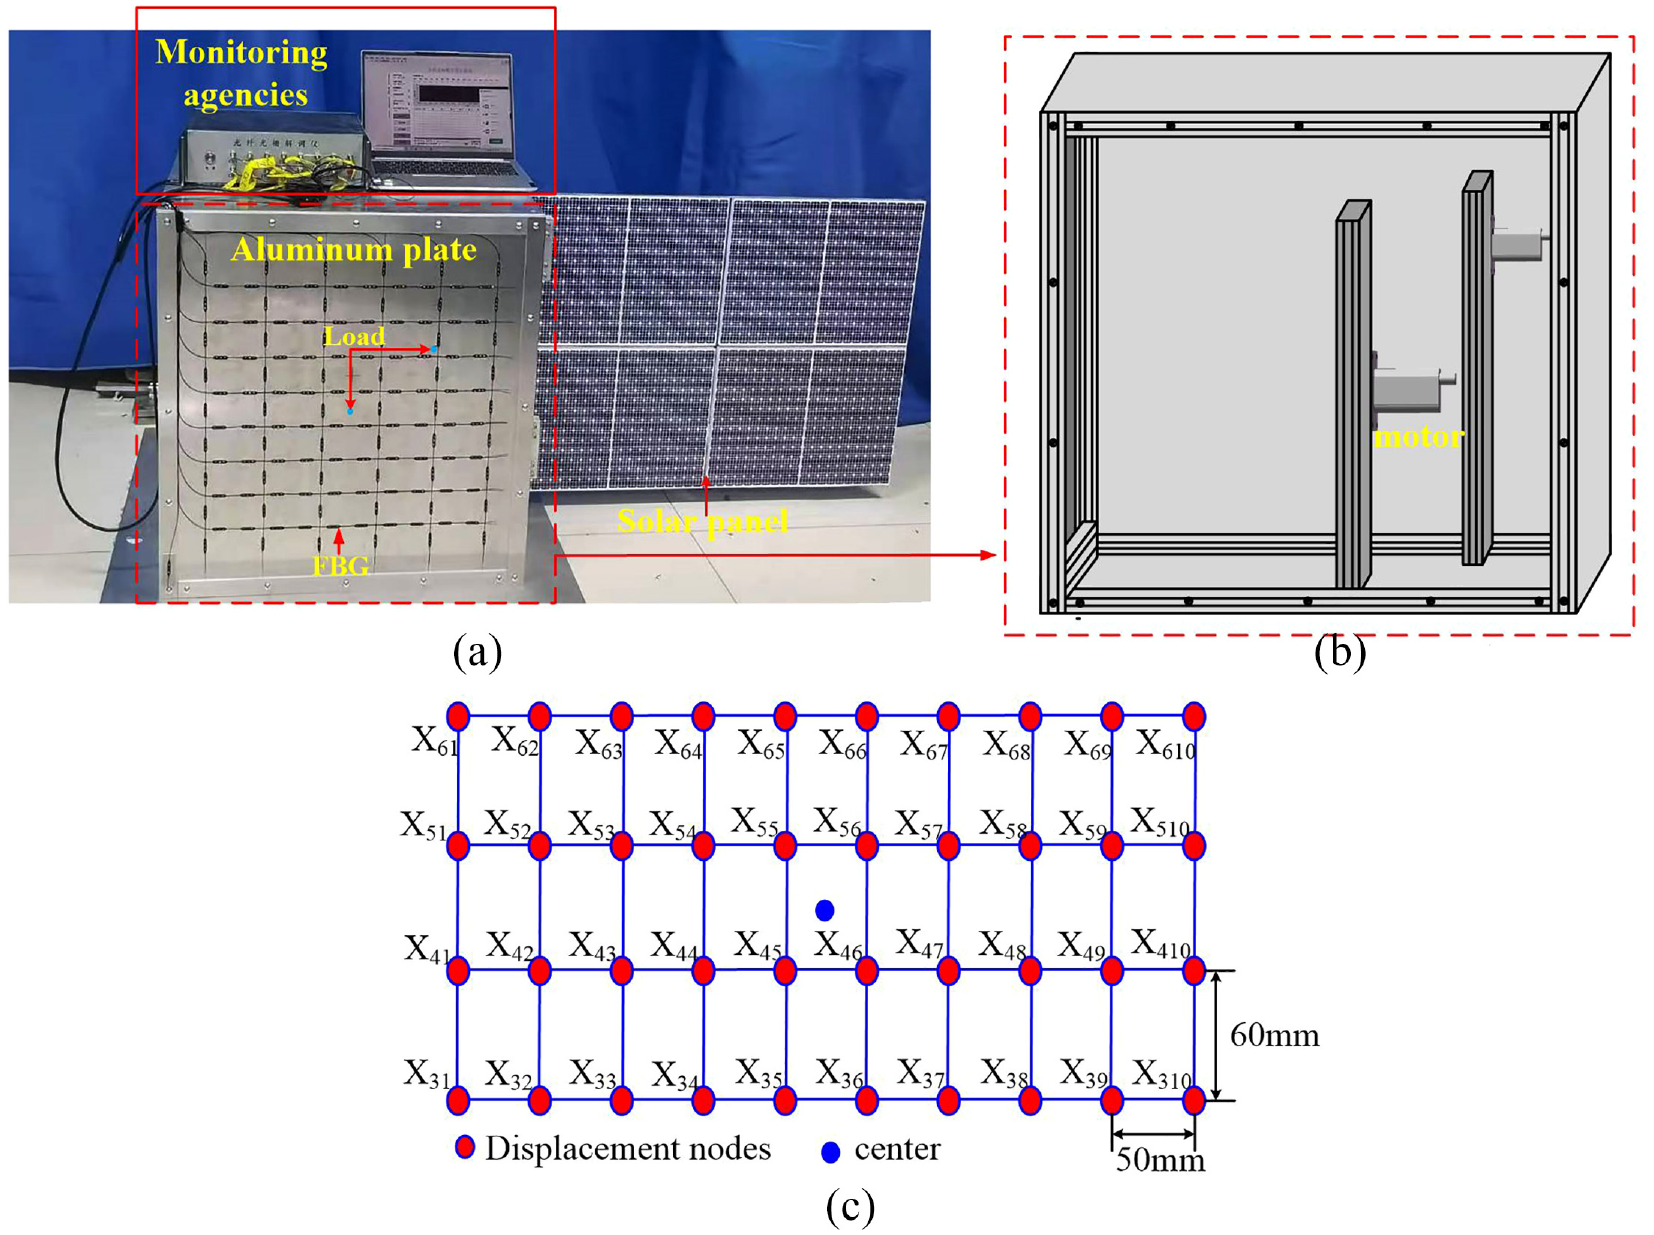
Experimental platform: (a) experimental structure, (b) internal structure, and (c) dial indicator layout.
In the experiment, the coordinates of (330, 330) and (480, 440) are selected as the loading points for the experiment, and the concentrated load is applied to the structure by controlling the motor’s stepping distance. The strain information and deformation information of the structure are collected when different deformation cases are generated.
The sensor network is used to obtain the wavelength information of the structure after deformation. When the wavelength change is negative, it means that the measuring point is in the compression state; otherwise, it is stretching. Besides, the wavelength of the FBG temperature sensor does not change during the experiment. In other words, there is no wavelength shift due to temperature, so the strain data can be obtained by bringing the wavelength information acquired by the strain sensor into equation (2). The structure node’s deformation is the number of dial indicators after deformation minus the number before deformation.
Analysis of experimental results
Loading experiments are divided into single point loading and multi-point loading. Each group of experiments contains three situations as shown in the Table 6. The real strain data acquired are brought into equation (12) to obtain the reconstructed displacement field data of structure, and the deformation data collected by the micrometer array are taken as the real values.
Type of load experiments.
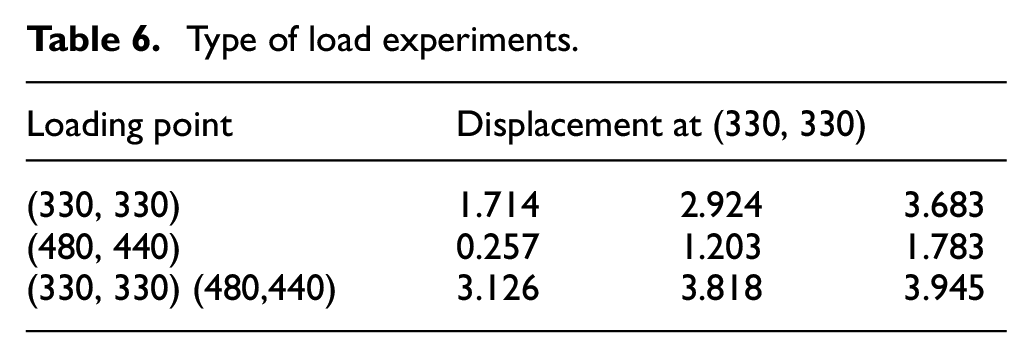
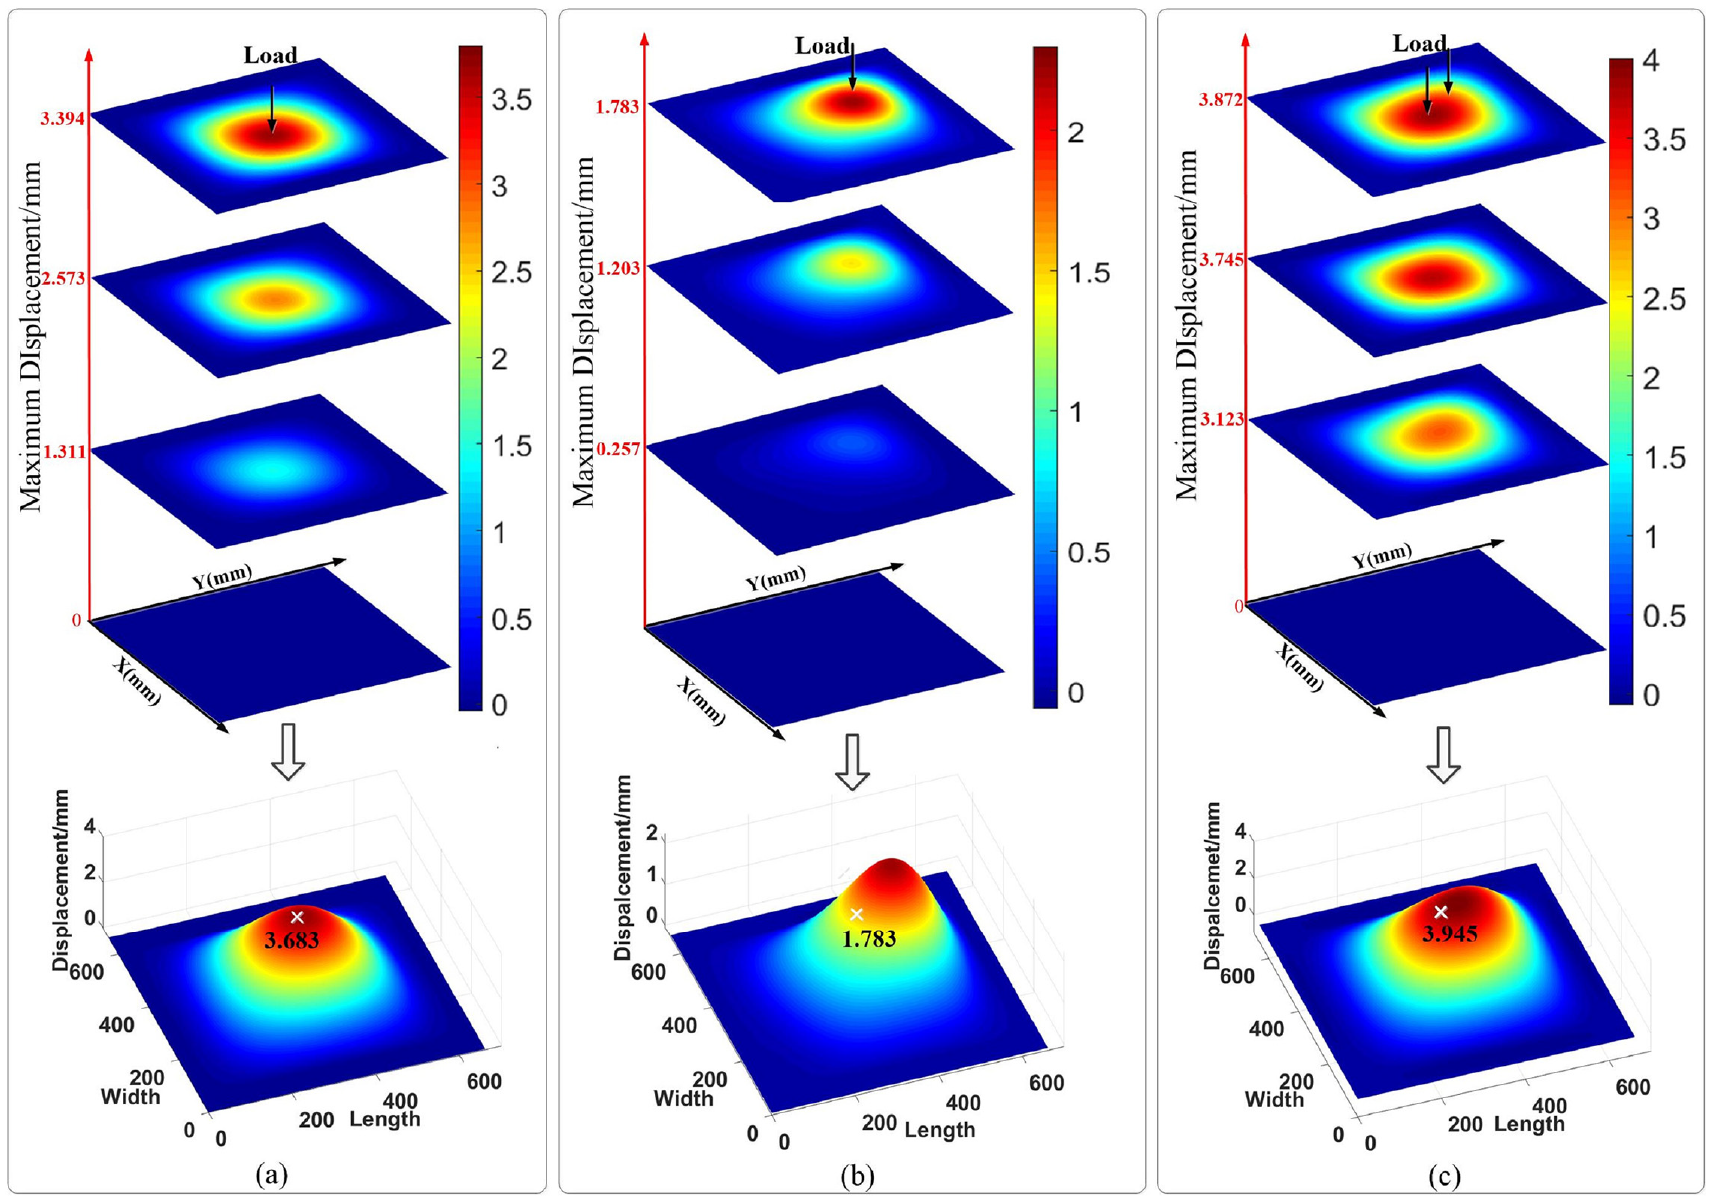
Figure 14 represents the reconstructed displacement value when the maximum load is applied at the central point and the upper right point. What is more, to compare and verify the accuracy of the algorithm, the modal superposition method (MSM), the curvature interpolation method (CIM), and the extreme learning machine (ELM)34,35 are respectively used to reconstruct the deformation states of the structure under different working conditions, and the reconstruction errors of the three methods are analyzed and compared, as shown in Table 7. When using the extreme learning machine, in order to ensure the adequacy of the experimental data, a total of 60 sets of data are collected for training.
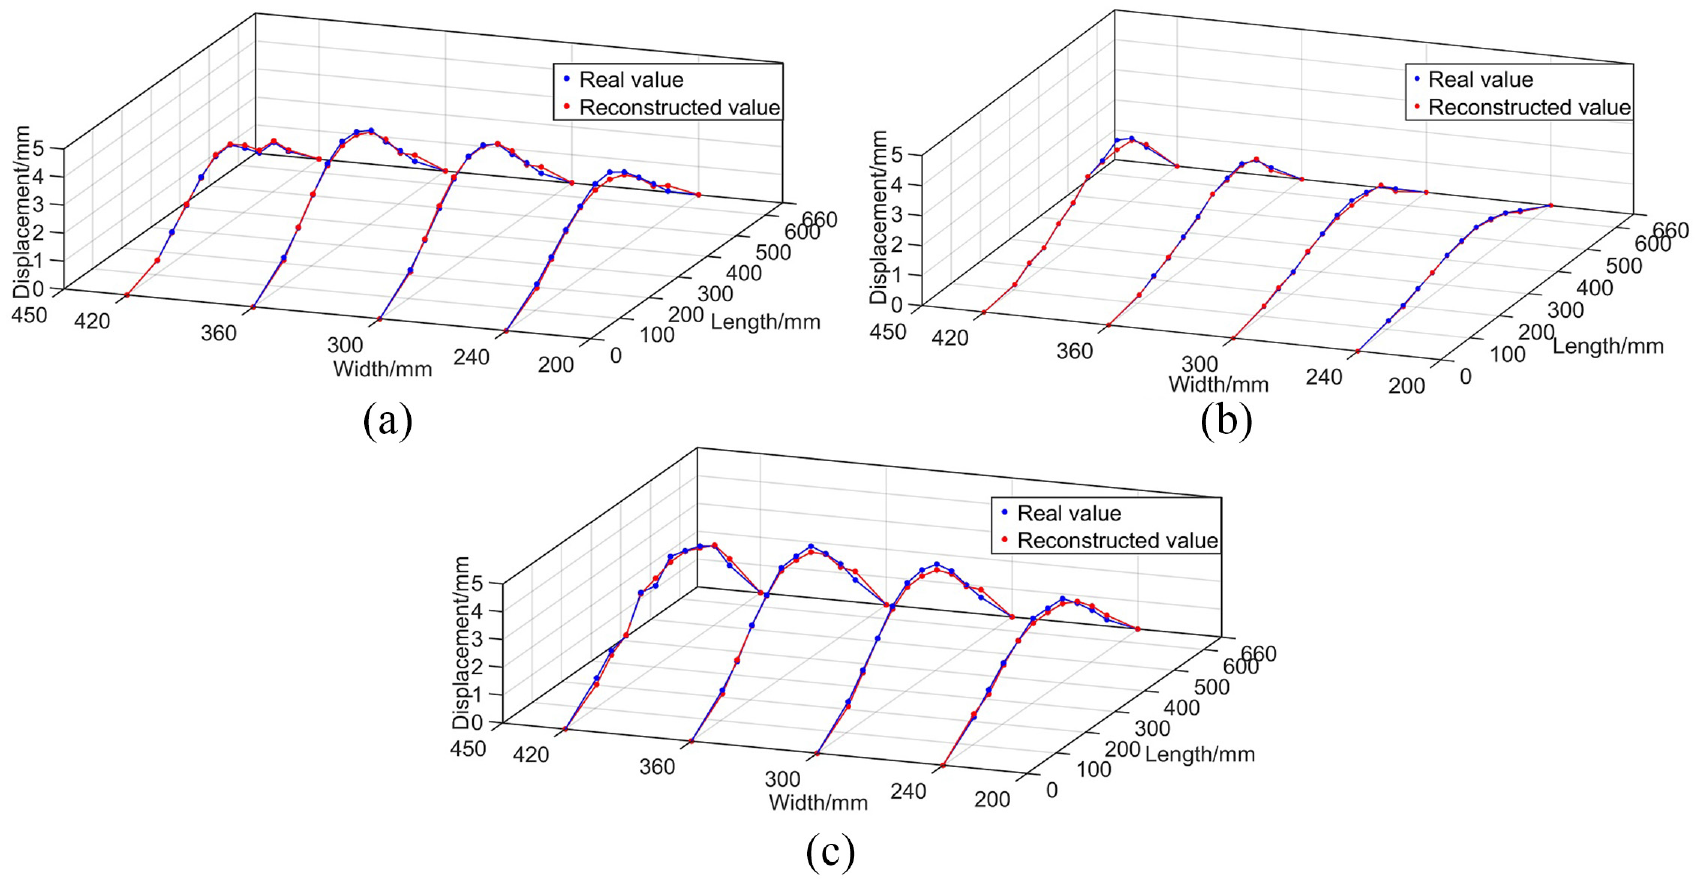
Real curves and reconstructed curves under different conditions of central displacement: (a) 3.683 mm, (b) 1.783 mm, and (c) 3.945 mm.
Reconstruction error (units: mm). (a) Error in loading at point (330, 330).
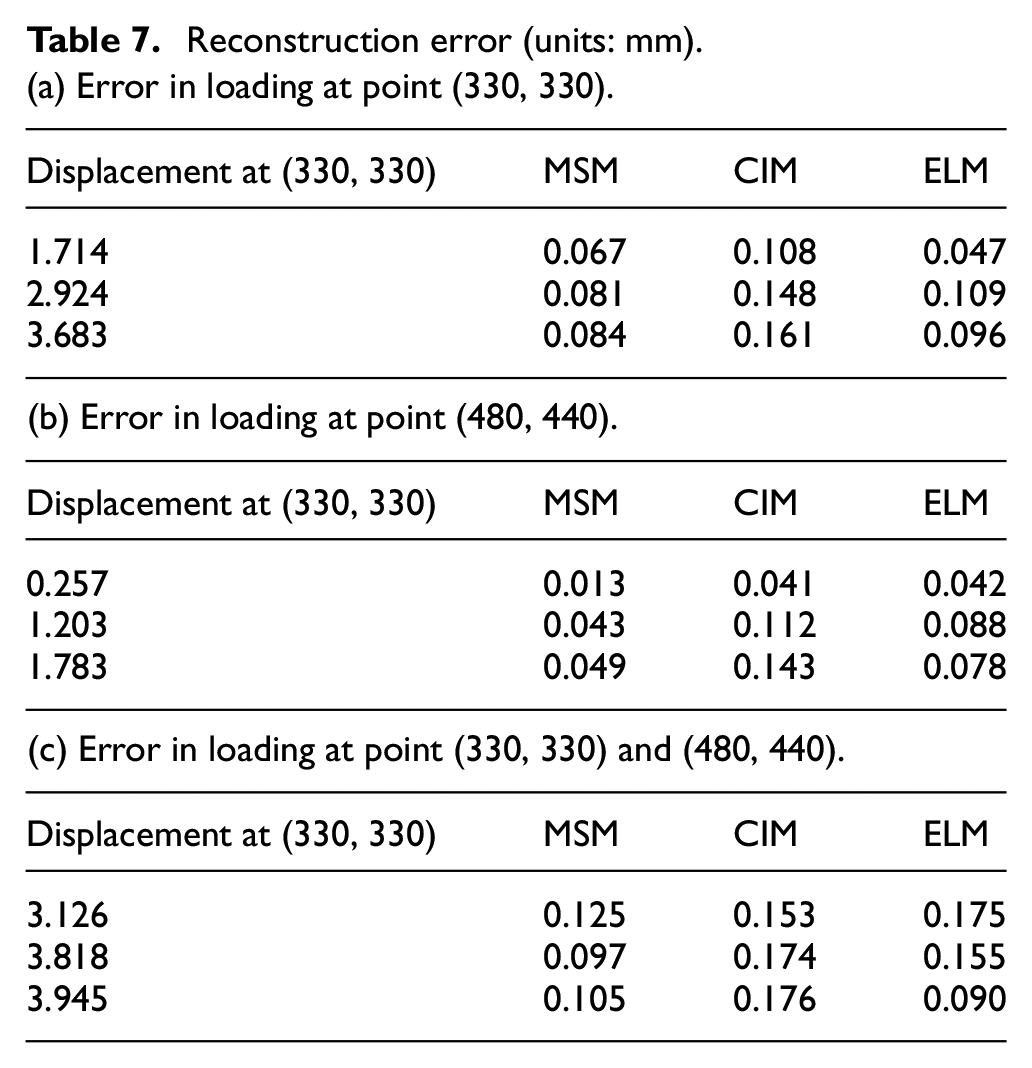
According to Figure 14, we can draw the conclusion that the reconstructed shape variable is highly consistent with the actual value. The results in Table 7 show that the reconstruction error will increase with the deformation degree, but the maximum average absolute error of the modal superposition method is kept within 0.13 mm. In contrast, the average absolute error of the curvature conversion method and the extreme learning machine are all only kept within 0.18 mm. The reconstruction accuracy of the former is much higher than the latter two. Based on the results, the core of the curvature transformation method is interpolation, the algorithm itself will accumulate errors; the ELM algorithm needs to collect a huge amount of experimental data, and its reconstruction accuracy depends too much on the accuracy of the data collection; but the error of the modal superposition method is only from the gap between the simulation model and experimental model, and the algorithm itself does not produce errors, so the reconstruction accuracy can be improved by only ensuring the accuracy during simulation.
Morphological reconstruction
Inputting the discrete measuring point displacements acquired through the modal superposition method into the reconstruction program and the displacement field reconstruction diagrams of the deformed curved surface under different working conditions are obtained, as shown in Figure 15.
The diagram of the reconstructed displacement filed: (a) loading at (330, 330), (b) loading at (480, 440), and (c) loading at (330, 330) and (480, 440).
The curved surface reconstruction shown in Figure 15 can accurately reflect that the four sides of the flat structure are fixed, and it will produce Mountain-like morphological characteristics after being subjected to external load forces. What is more, combining with the model error evaluation shown in Table 7, it can be concluded that the combination of the quasi-distributed FBG sensor array and the 3D surface reconstruction algorithm can accurately achieve the displacement field reconstruction of the deformed flat plate structure.
Conclusion
In order to solve the problem of real-time monitoring of the shape of flexible plate-like structures in the spacecraft field, this paper focuses on the study of optical fiber sensing and reconstruction methods, and then verifies the feasibility and accuracy of the method based on finite element simulation analysis and load experiments; besides, the shape monitoring system and the reconstruction method has a good application background and practical value in the fields of high-speed rail, bridge, and biomedicine.
The deformation monitoring system based on the quasi-distributed fiber grating sensor network can simulate the structure’s deformation under different load conditions and accurately obtain the structure’s surface strain field data.
The use of an order-optimized modal superposition algorithm for surface reconstruction of deformed flat plate structures is feasible and lays a theoretical foundation for the realization of deformation monitoring of typical structures of spacecraft.
The surface reconstruction method still needs to be optimized. To further improve the reconstruction accuracy and calculation efficiency, machine learning and other methods can be used to make a more rational layout of FBG sensors; And by using the method of combining transfer learning and modal superposition, a small amount of actual measurement data is transferred to a large amount of simulation data, which can shorten the experiment period and reduces model errors.
In addition to aluminum alloy materials, composite materials are also widely used in the spacecraft field. Next, the displacement field construction of the composite material structure which is embedded fiber grating sensor will be studied.
Footnotes
Declaration of conflicting interests
The author(s) declared no potential conflicts of interest with respect to the research, authorship, and/or publication of this article.
Funding
The author(s) disclosed receipt of the following financial support for the research, authorship, and/or publication of this article: This work was supported by National Natural Science Foundation of China [grant number 61903224, 62073193, 61873333], National Key Research and Development Project [grant number 2018YFE02013, 2020YFE0204900], and Key Research and Development Plan of Shandong Province [grant number 2019TSLH0301, 2019GHZ004].