
Abstract
The efficiency of train transportation in the port environment directly restricts the production efficiency of the entire port. In order to coordinate the productivity of the entire port and further improve the loading and unloading efficiency of the train automation system, this paper proposes a material segmentation and data statistics algorithm for the problem of material identification in the train compartment. The terrestrial laser scanning system was established under the experimental scenario of CHN ENERGY Tianjin Port. By fusing the laser point cloud data, and then performing pre-processing operations such as box filtering, down-sampling, and radius filtering, the pre-processed point cloud data is projected onto a two-dimensional plane as a two-dimensional image, and the canny operator is used to extract the contour of the carriage on the image. Further fitting to the plane of the point cloud of the carriage wall, and the point cloud of materials in the carriage is segmented. Through the method of slicing the compartment, completing the statistical analysis of the data in the compartment from the whole to the part. The database fields of the main carriage types are established to realize the information interaction between the database and the recognition algorithm. The final experimental results show that the error rate of the carriage length recognition is 5.89%, and the width error rate is 7.25%, which verifies that the algorithm has good recognition accuracy which fully meets engineering needs.
Keywords
Introduction
The train is the main carrier of freight for the fast transportation speed, large carrying capacity, high reliability, and low transportation cost. With the expansion of railways around the world, large quantities of goods can be quickly transferred to each other through trains. Trains also play an important role in port shipping which are an important link in the transfer of cargo between sea and land transportation and are the transportation power for port cargo throughput.
CHN ENERGY Tianjin Port Corporation, whose production and operation field is coal transportation, requires a series of complicated processes from coal entering the port to loading and leaving the port. The train pulls coal into the port, unloading and stacking, grinding and feeding, loading and feeding, and the train transports other goods out of the port finally. In the entire production process, the train participates in the key links of the first and last transportation. The transportation process of the train at the port is shown in Figure 1. From pulling coal into the port to loading iron ore out of the port, the train not only plays an important role in the source of the entire port’s cargo but also an important route for the port’s cargo to be scattered outside. Ports want to improve their production capacity. On the one hand, it is the improvement of the production efficiency of the process in the port, and more importantly, the improvement of the efficiency of train loading and unloading, which directly limits the throughput of port cargo. Establishing a comprehensive train perception system and realizing the automation of train loading is a requirement in the actual production environment of the port.
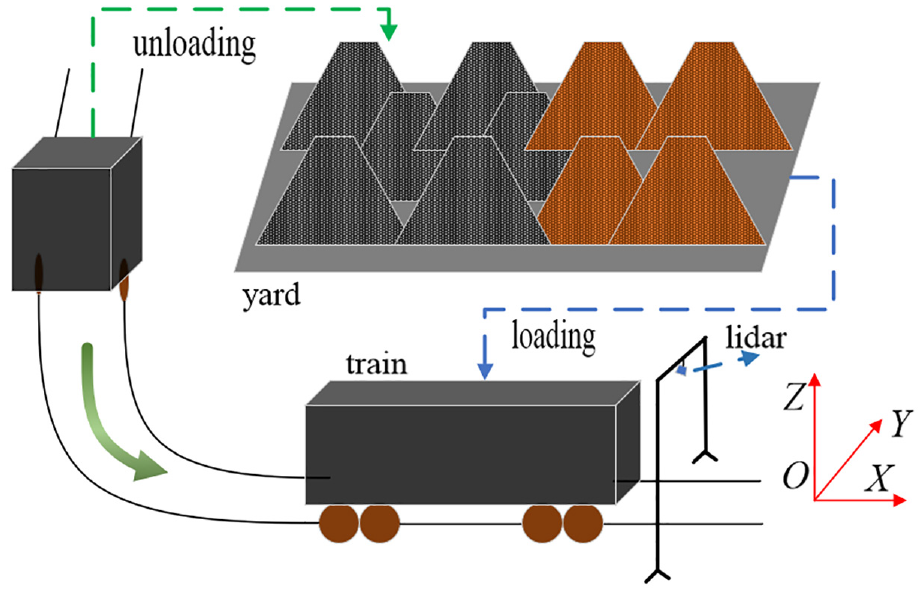
Schematic diagram of train entry and departure process.
In the general environment of port operations, to ensure continuous and normal production, the primary indicator of all industrial equipment is continuous, stable, and reliable operation. As far as the material identification in the train compartment is concerned, the design scheme based on lidar is the first choice. Compared with the camera, lidar is less affected by the outside world and can obtain a continuous and reliable data source. The port environment of CHN ENERGY Tianjin Port Corporation is complex and changeable where weather is often cloudy, cloudy, and rainy pretty much. In this environment, the camera will be restricted to a large extent, causing production blockage. The relatively stable and reliable data source of lidar can ensure smooth production. Moreover, compared to single-line lidar, multi-line lidar can provide a larger illumination angle of view and more data points per frame. When point cloud stitching is performed, it has more abundant data redundancy resources as accurate registration with a good data basis.
Lidar has been relatively mature for surveying and mapping and has a wide range of applications in many fields such as houses,1–3 landforms,4–8 forests,9,10 and mines.11,12 Literature 12 took full advantage of the lidar and completed the accurate modeling of coal piles in the open-pit mine environment. This paper constructed a minefield surface laser scanning system, using the point cloud registration algorithm, and finally got a coal pile model with the error of only 0.72%, which can effectively use the model data to complete the analysis of the height and volume of the coal pile in the minefield. The high-precision point cloud model is not only an accurate representation of the modeled object, but more importantly, the analysis of the point cloud, which can accurately see the internal shape of the modeled object, perform statistical analysis of data in the horizontal, vertical, and partial directions, and feature data extraction.
To obtain a high-precision point cloud model, it is necessary to perform fine registration processing on the two-frame point cloud of the lidar.
To improve the production efficiency of train transportation in the port and improve the automatic system of loading and unloading goods, this article proposes an automatic identification method for train carriage materials. On the one hand, it is to improve the automatic level loading and unloading system of trains, get rid of human participation, and improve the loading speed of the train’s material, thereby promoting the production capacity of the entire port. On the other hand, it is the identification, modeling and statistical analysis of the train cargo loading volume, digitizing the shipment volume, providing feedback to the production control system, and facilitating the port’s access to the entire port. The loading capacity of the train is recorded, planned, adjusted, and managed for the next step of production planning.
The train tracks are not as regular and tidy as the ports shore base, so the identification of the train carriages naturally cannot use the mobile carrier strap-down sensing device to actively move to identify the static train carriage materials. To ensure the overall production efficiency of the port, the train is moving during the whole process as the sensing device can only complete the recognition of the height of the material in the entire carriage under a fixed viewing angle, a ground three-dimensional scanning system. The difficulty lies as follows.
The train carriage is moving, even if the train’s moving speed is known in advance, in view of the different speeds of different trains, the lidar splicing system is required to make adaptive adjustments under the speed scale.
The task of this paper is to make a statistical analysis of the materials in the train carriage. Considering the differences of a different train carriage at different speeds, each carriage needs to be accurately segmented, which improves the accuracy requirement of point cloud splicing. If the splicing deviation is large, it will cause a series of influences on the cloud segmentation of the compartment location and the statistical analysis of the compartment materials.
The shapes of different train carriages are different, and there may even be irregular shapes in the cars, which increases the difficulty of the division of the carriage and the statistics of the materials in the carriage.
In this paper, by establishing a train’s database, processing specific types of trains in the database, obtaining prior information of different types of trains from the train manufacturer, combining with a series of algorithms such as
Point cloud stitching
As shown in Figure 1, the world coordinate system OXYZ is established. The coordinate origin O is established at the agreed point of the train track. The center of the track at the loader is the X-axis with the positive direction of the train’s forward direction. The Y-axis and the X-axis are both on the rail plane, the direction perpendicular to the X-axis pointing to the inside of the rail is the positive direction, and the Z-axis is perpendicular to the X-axis and the Y-axis, and pointing to the sky in the form of a right-handed coordinate system is the positive direction.
The lidar of livox(
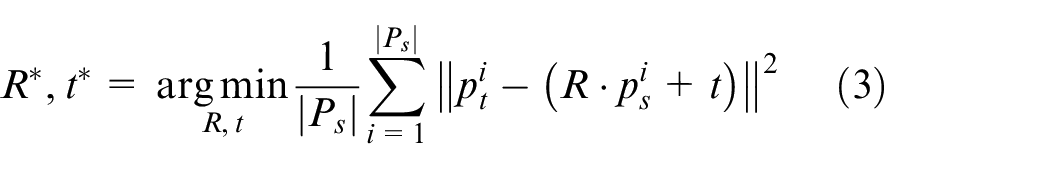
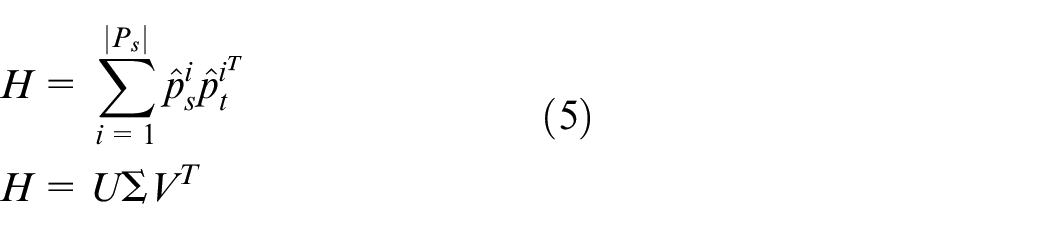
After using the train moving speed and running time to complete the coarse registration of the train point cloud, in order to further improve the accuracy of the registration, it is necessary to use the
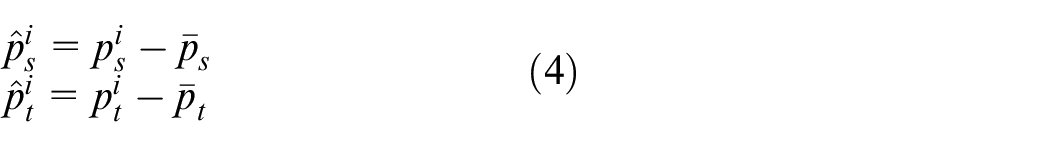
As shown in formula (4),
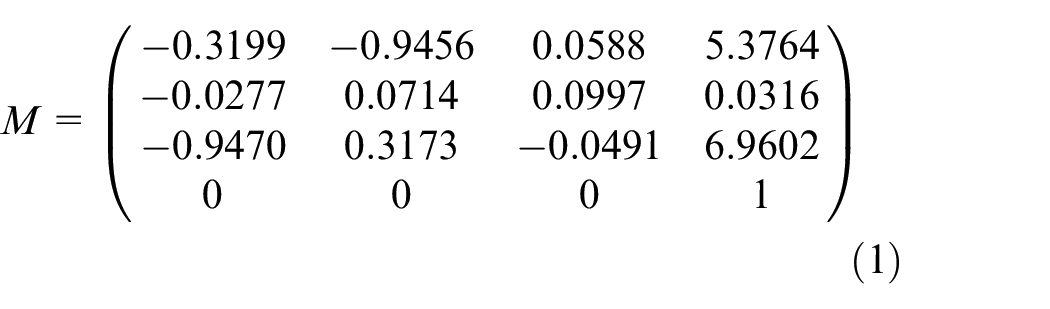

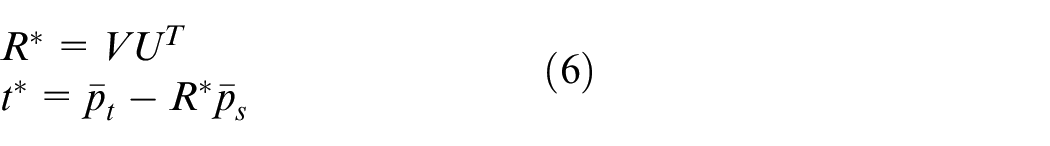
After rough registration and fine registration, the final train point cloud splicing model is shown in Figure 2. From Figure 2, it can be seen that the entire point cloud splicing effect is good, the contour of the carriage is obvious, and the materials in the carriage are clear, which lays the foundation for follow-up material analysis. Due to the perspective of the lidar, the upper part of the point cloud model integrates part of the loader, which can be filtered by pre-processing to obtain pure point cloud data of the carriage.
Lidar point cloud stitching result.
Carriage material extraction
Compartment point cloud preprocessing
It can be seen from Figure 2 that after the completion of the carriage point cloud stitching, there is some noise in the overall point cloud, which needs to be filtered to extract pure carriage point cloud to facilitate subsequent analysis.
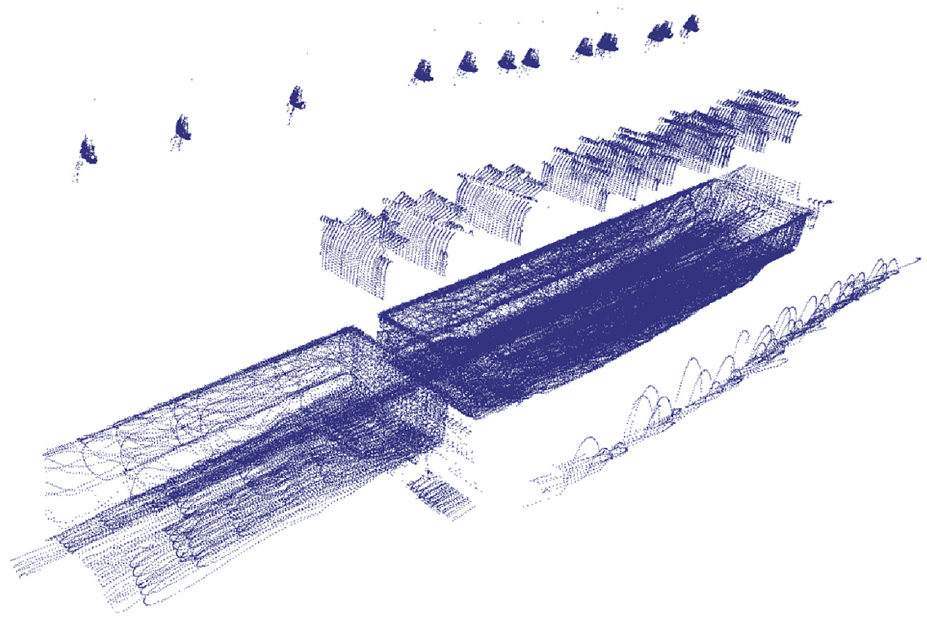
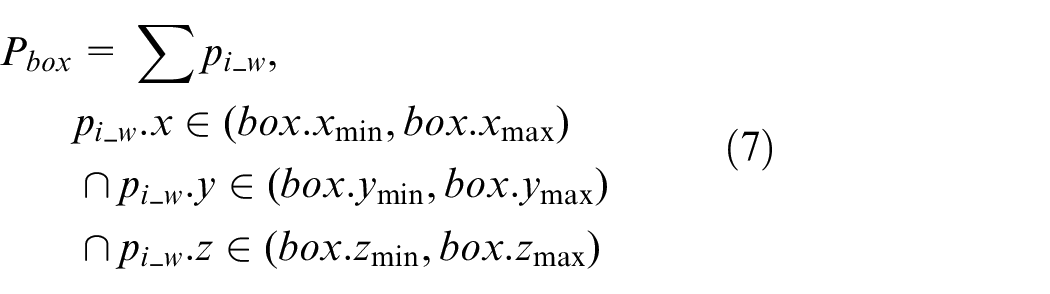
Firstly, box filtering is performed on the original point cloud data, and the geometric box is delineated according to the lidar angle of view at a fixed position, and the point cloud beyond the range of the box is weeded out, and only the point cloud in the box is retained, as shown in formula (7).
To ensure the real-time performance of carriage segmentation, voxel down-sampling processing is performed on the filtered box, and the voxel parameters are set to 0.05, 0.05, 0.05. The outliers in the point cloud are eliminated through radius filtering, the radius parameter is set to 0.2, and the neighborhood point cloud threshold is set to 20.
The point cloud of the train carriage after pre-processing is shown in Figure 3. The green part on the figure is the original splicing point cloud, and the red part is the result after pre-processing. It can be seen that after the box filtering, the point cloud of the loader at the height and the noise point cloud around the rail are processed, and a relatively pure and complete point cloud of the train compartment is obtained, which provides good data for the subsequent compartment material segmentation.
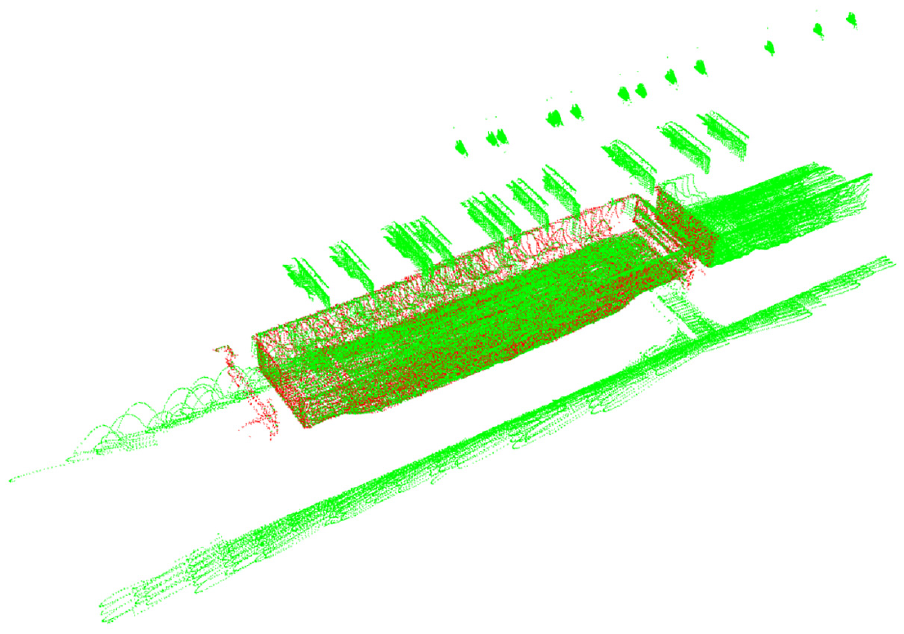
Lidar point cloud pre-processing result.
Projection on a two-dimensional plane
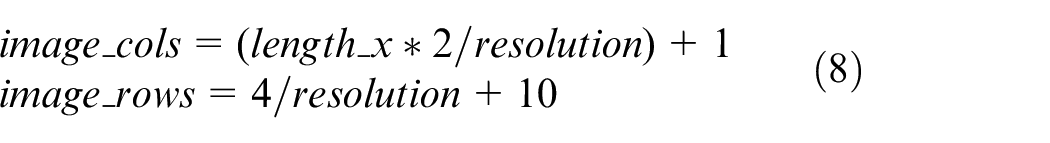
The pre-processed train point cloud is projected onto a two-dimensional plane, converted into a two-dimensional image, and the contour of the carriage is extracted through an image processing algorithm. The projected two-dimensional image size setting is shown in formula 8 where
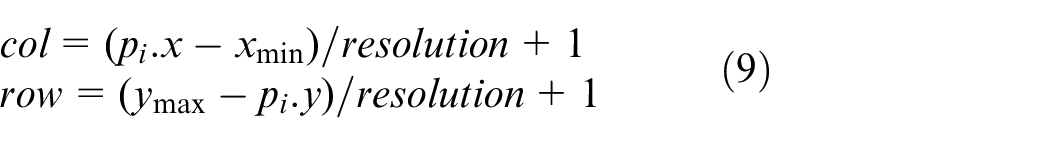
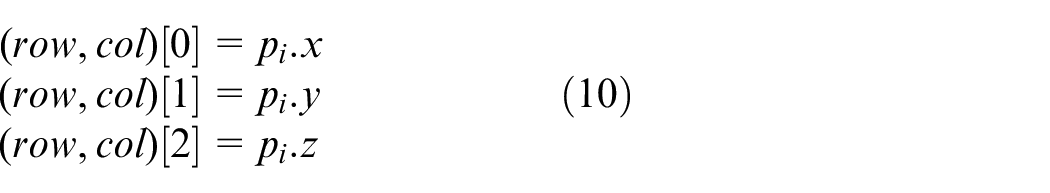
Converting each point cloud pixel in the cabin point cloud to a two-dimensional image pixel. The specific conversion method is shown in formula (9).
The final two-dimensional projection image is shown in Figure 4. From the figure, it can be seen that the image completely includes the entire point cloud pixels of the train carriage, and the outline is clear, which lays the foundation for the subsequent extraction of the carriage outline and the segmentation of materials.

Point cloud plane projection result.
Contours extracting by canny operator
After converting the carriage point cloud projection into a two-dimensional image, using the

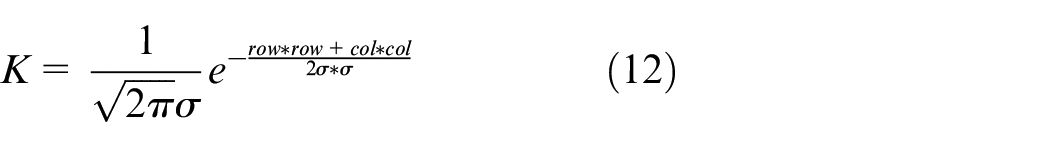
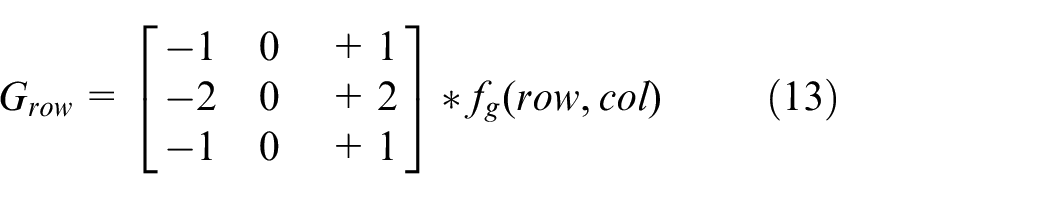
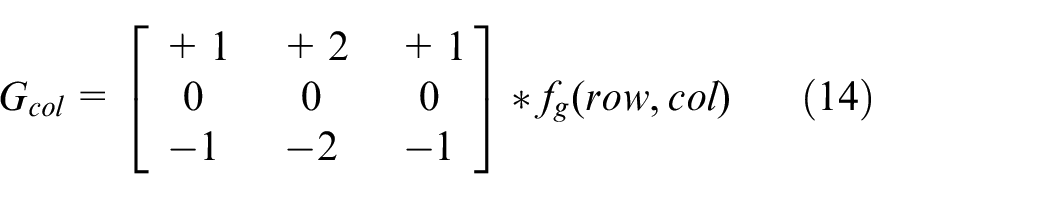
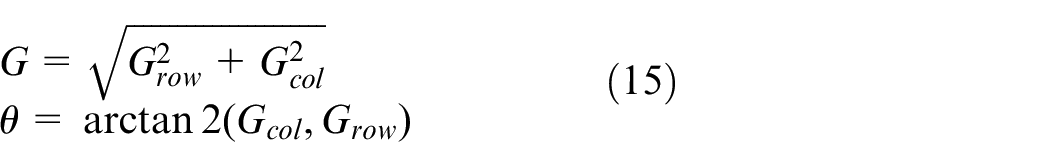
After using the
Non-maximum suppression.
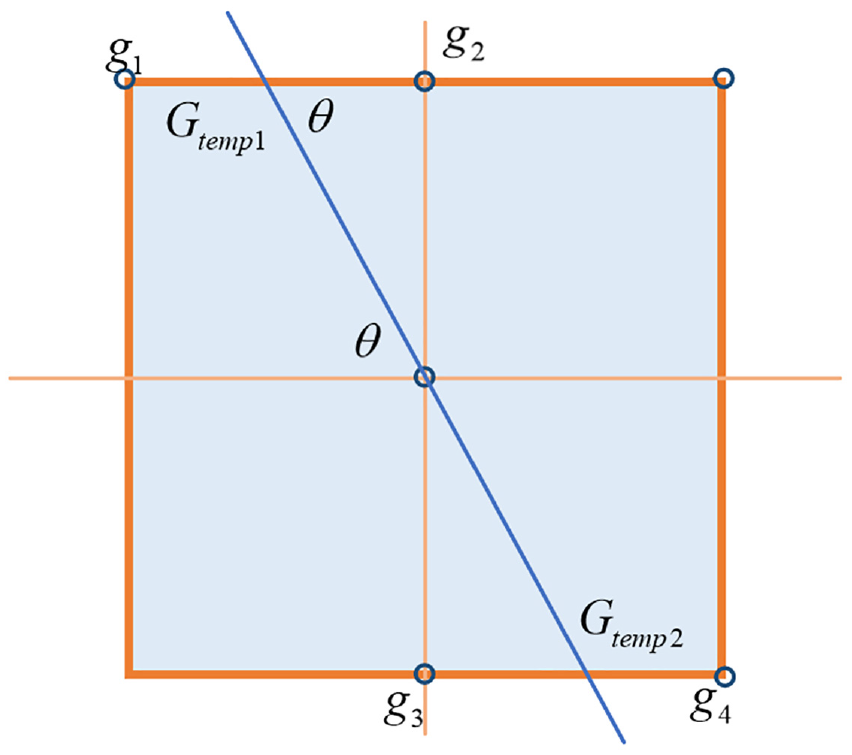
According to the length and width of the train carriage, the smallest wrapping rectangle obtained by the fitting is screened, and the contour whose length and width error does not exceed 1
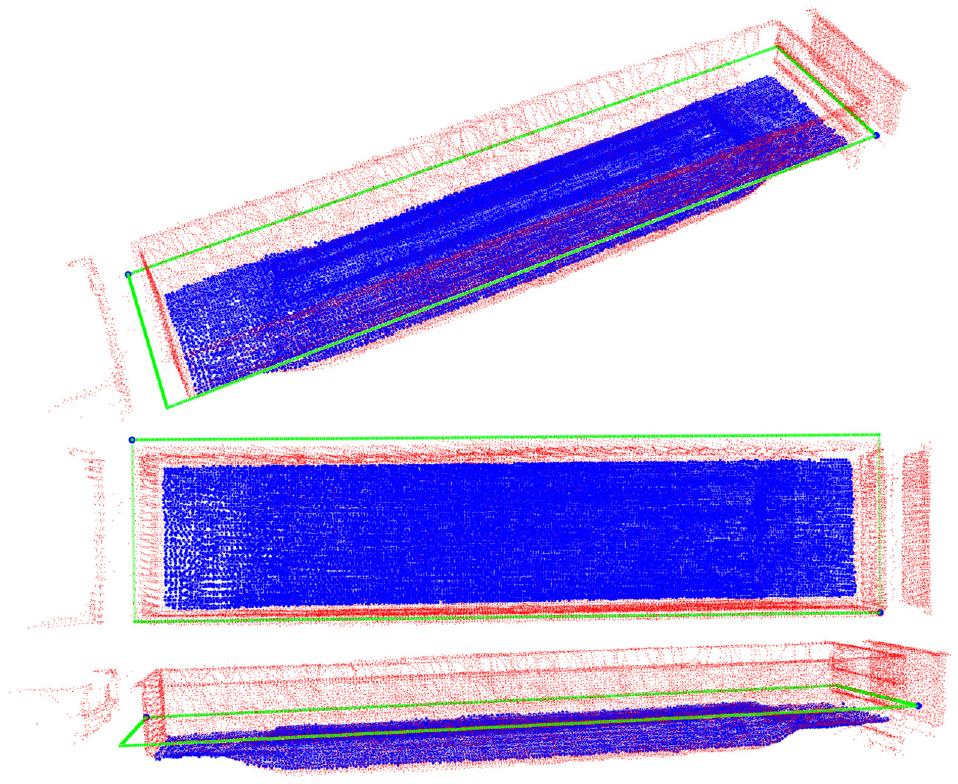
In the pre-processed point cloud, the contour of the carriage marked that have been extracted, as shown in Figure 6. Figure 6 shows the two perspectives of the point cloud and the extracted contour. The red part is the point cloud data of the carriage after pre-processing. There are two blue points in the upper left and lower right corners of the red point cloud, which are the maximum contour corner point of the image after contour extraction through the projection, the contour of the carriage is generated according to the two corner points, as shown in the green box on the figure. It can be seen from the figure that the contour extracted from the image frames a single complete carriage very accurately, and fits well with the edge of the carriage, providing a benchmark for the subsequent analysis of the materials in the carriage.
Carriage point cloud contour extraction result.
Carriage material division
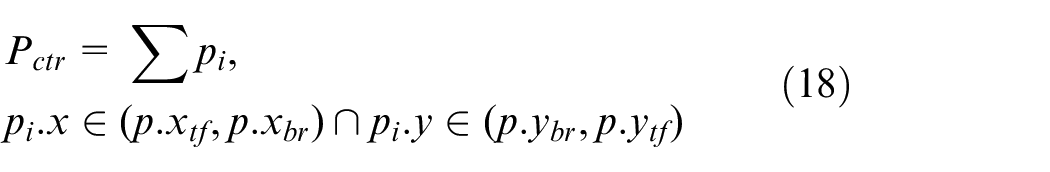
According to the contour of the carriage calculated by the canny operator, the point cloud of the material in the carriage is segmented. As shown in Figure 6, the train point cloud is filtered again according to the train contour corner points calculated on the map. Traversing the initial splicing point cloud, accumulating the point cloud pixels in the box, removing the point cloud pixels outside the box, see formula 18. Calculating the average height and variance of the point cloud pixels in the box, and filtering is performed once to eliminate the point cloud other than the mean value 1.5 times the standard deviation. Traversing the point cloud in the final box to get the maximum and minimum × coordinates, and the maximum and minimum Y coordinates. The accuracy of the carriage’s contour is further adjusted.
Segmenting the point cloud of materials in the compartment, traversing the point cloud of the compartment obtained by filtering in the previous step, and performing a neighborhood search for each point cloud with a search radius of 0.4. Performing plane fitting according to the point cloud in the neighborhood to obtain a plane fitting normal vector. The point cloud is classified according to the plane normal vector, and the center point coordinates of the carriage are calculated based on the maximum and minimum values of the X coordinate of the carriage point cloud and the maximum and minimum values of the Y-axis calculated in the previous step. Combining the coordinate center point of the carriage and the point cloud in the neighborhood to fit the plane normal vector, the specific classification of the point cloud on the inner wall of the carriage is realized.
When the X value of the normal vector is greater than 0.9 and the X coordinate of the point is greater than the X coordinate of the center point of the carriage, the point is considered to belong to the inner wall of the carriage with the largest × coordinate. On the contrary, when the X coordinate of the point is less than the X coordinate of the center point of the carriage, the point is considered to belong to the inner wall of the carriage with the smallest × coordinate. When the Y value of the normal vector is greater than 0.9 and the Y coordinate of the point is greater than the Y coordinate of the center point of the carriage, the point is considered to belong to the inner wall of the carriage with the largest Y coordinate. On the contrary, when the Y coordinate of the point is less than the Y coordinate of the center point of the carriage, the point is considered to belong to the inner wall of the carriage with the smallest Y coordinate.
After the above steps, the point cloud of the inner wall of each carriage can be separated, and then the plane fitting is performed on the point cloud of the four carriages respectively to obtain four fitting plane parameters. Calculating the distances from the point cloud of the carriage to the four planes. When the distance from the point to the four planes is greater than the distance threshold of the four planes, it means that the point is a material point in the carriage. Traversing the point cloud pixels of the carriage to obtain a complete point cloud of materials in the carriage.
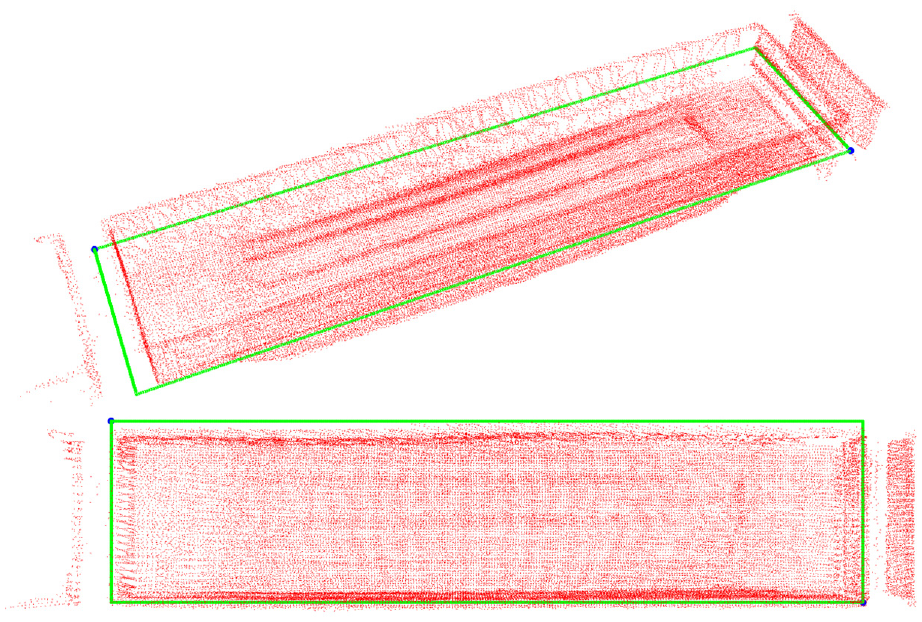
As shown in Figure 7, the figure shows three perspectives after segmentation of the point cloud of materials in the compartment. The red part is the point cloud as the original splicing point cloud data after pre-processing and box filtering. And the green box is the point cloud contour of the carriage obtained after projection and canny operator contour extraction on the two-dimensional plane. The blue part is the obtained point cloud of the material in the carriage. It can be seen that the segmentation of the material point cloud in the compartment is very accurate, the outline is clear, and it fits perfectly with the inner wall of the compartment, indicating that the algorithm has good compartment adaptability. The entire material data is complete and clear, which is convenient for subsequent data statistical analysis.
Carriage point cloud material segmentation result.
Material statistical analysis
After segmenting the point cloud of the train compartment, a slicing model of the point cloud of the compartment is established. As shown in Figure 8, the compartment is divided equally from the beginning to the end, and the height of the material on each slice is gradually analyzed to complete the height of the material in the entire compartment for statistical analysis and estimation weight of materials in the carriage. What needs to be emphasized is that the loader is directly above the train carriage during the loading operation, and the loading caliber is relatively large. At the same time, the train carriage feed is basically in the middle of the train carriage. The amount of material discharged at different times is different, resulting in a difference in the height of the material in the transverse direction of the train carriage. As shown in Figure 8, the red part represents the average height of the material on each slice. After the material is sliced in the horizontal direction, the height statistics of the material in the vertical direction are further carried out to obtain the average size of the material on each slice. After reasonable slicing and decomposition, the weight of the materials in the carriage can be roughly estimated.
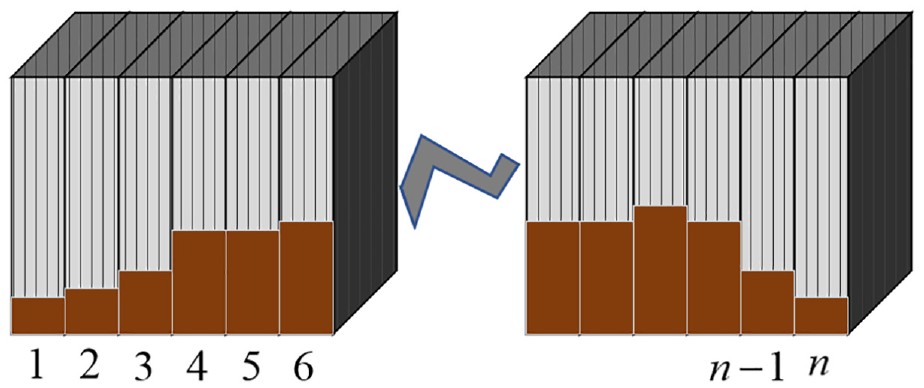
Carriage slice model.
In the specific operation, the slice thickness is set to 1
Experiment
To realize the adaptive recognition of different types of train carriage, as shown in Figure 9, we have designed an interactive data transmission scheme based on the train’s database. Establishing the basic data structure of the train carriage and storing it in the database. Before the carriage material point cloud segmentation, the corresponding train carriage data should be retrieved from the database in advance by using SQL.
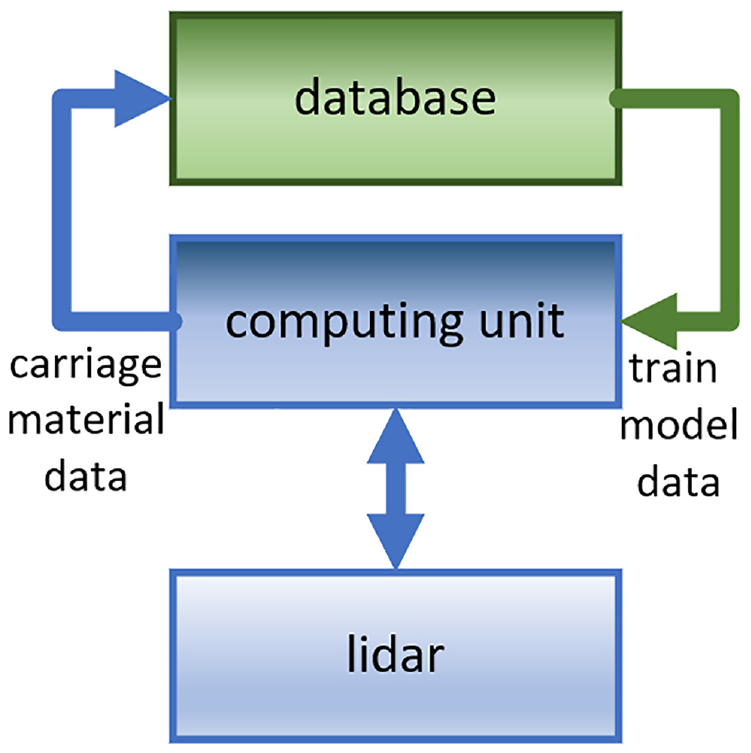
Lidar and database interaction structure diagram.
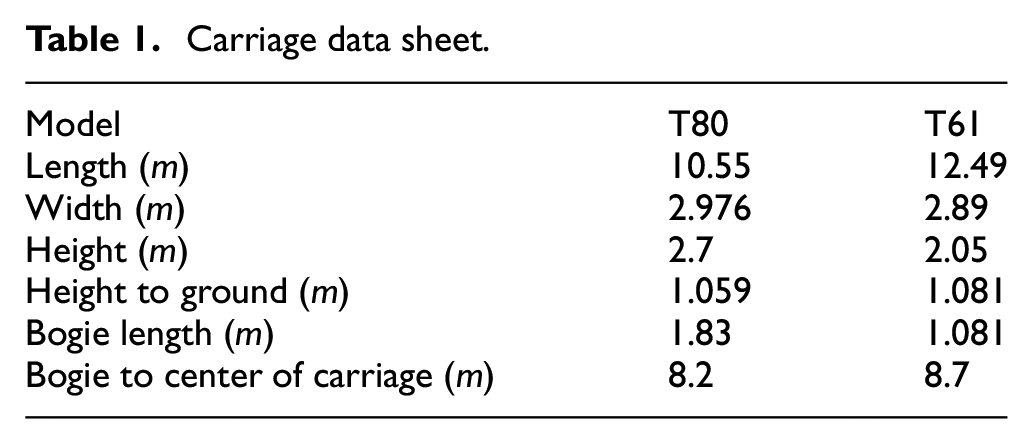
As shown in Table 1, for each carriage model, almost all of its geometric size information is extracted and stored in a field. In this field, the length, width, height, height from the ground, and bogie length the distance from the bogie to the center of the carriage is included. The data of two typical carriage models are given in the table, T80, and T61. The identification of compartment materials is based on these basic compartment data, including the size setting during box filtering which is specifically set according to the compartment size, which realizes the adaptability in the identification of different compartment materials.
Carriage data sheet.
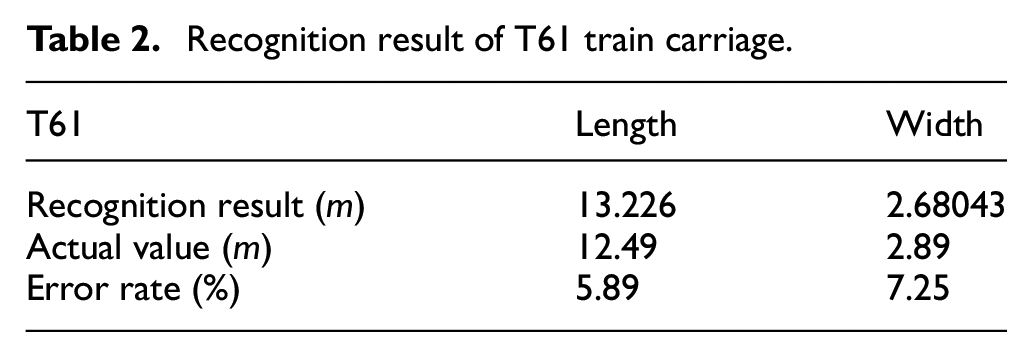
The actual loading scenario is as shown in Figure 10. After the material flows out of the stacker, we use a Livox Horizon lidar to scan the train carriage. The visualized material segmentation results of a typical T61 carriage are shown in Figure 7, and the corresponding specific experimental data are shown in Tables 2 and 3. It can be seen from Figure 7 that the algorithm proposed in this paper has a good segmentation effect on materials, with a clear outline and close fit with the carriage. The data in Table 2 verifies this. From the data in Table 2, it can see that the length recognition error is 0.736
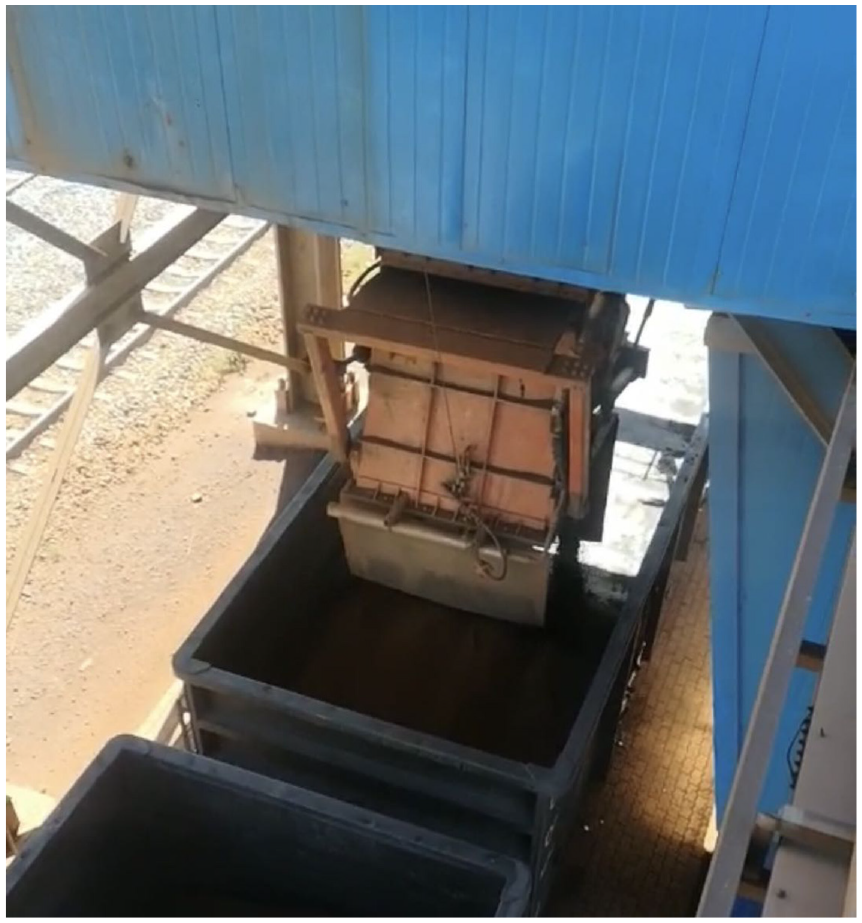
Real experimental scenario.
Recognition result of T61 train carriage.
T61 type train carriage material statistics result.
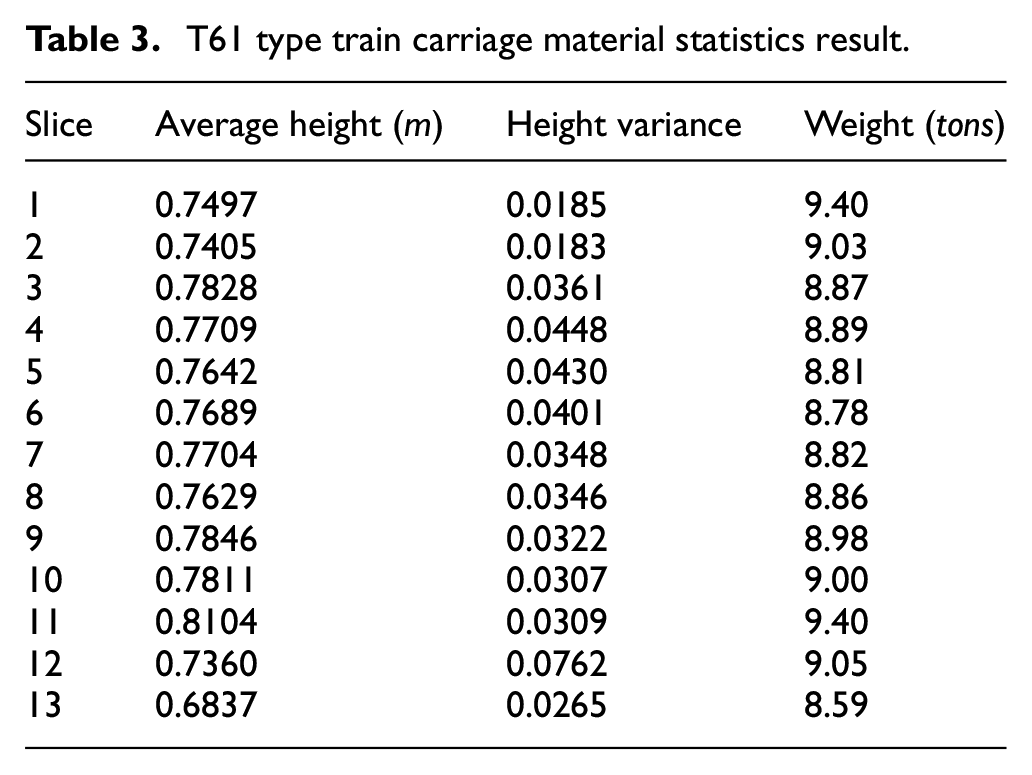
Table 3 shows the statistical results of the material data of the T61 train carriage which is sliced at 1
Conclusion and future work
This paper proposes an algorithm for material segmentation and data statistics of train carriages. By constructing the information interaction mode between the database and the edge computing unit, it can realize the self-adaptive identification of different carriage materials, and feedback the statistical information such as the height and weight of the carriage materials to the database, forming a large-scale data closed loop. The three-dimensional point cloud is projected onto a two-dimensional plane, and the canny operator is used to extract the contour of the carriage on the two-dimensional image to realize the segmentation of the point cloud of materials in the carriage. Carrying out 1
To further realize the stable operation of the algorithm in actual scenarios, there is still some work to be further tested and improved.
To improve the reliability of the algorithm, multiple tests are required in an experimental environment. Due to the limited time, this work will be tested sequentially as the project progresses to continuously improve the reliability of the algorithm in the actual port environment.
The train carriage database currently refers to the integration of a limited number of carriage models, and subsequent new carriages will be gradually improved as the train continues to load and unload.
Footnotes
Declaration of conflicting interests
The author(s) declared no potential conflicts of interest with respect to the research, authorship, and/or publication of this article.
Funding
The author(s) received no financial support for the research, authorship, and/or publication of this article.