
Abstract
Measurement of the information flow along the ascending auditory pathway from the periphery to the auditory cortex (AC) has been given much attention in neurocomputation. While the neurophysiological mechanisms of the auditory pathway have been well studied, the temporal resolution and relationships among the auditory centers are still under investigation, especially when suffering from acoustic trauma that results in peripheral deficits and neural signal changes in the auditory system. In this study, we measured rat AC neurons and auditory nerve (AN) signals in digital format by using two new algorithms to calculate the neural response time of the AC neurons to electrical stimulation of the AN and quantify the neural information flow in the temporal domain. One algorithm compared time difference of neural spikes directly, which was based on the conventional idea of spike train in neurocomputation. The other employed a modified cross-correlation algorithm. Both algorithms shared the same pre-signal processing of spike selection. The statistical results by the two methods were compared and various parameters in the algorithms and their impact on the accuracy of the results were discussed. To test the effectiveness of the proposed method, the time difference between the AC to AN activities was calculated by both algorithms with raw neural signals collected. The neural signals from the animals were measured before and after noise trauma, and one of the animals received intra-modiolus electrical stimulation (IMES) to stimulate the AN. The results from using the two algorithms were generally consistent, and the biological mechanisms behind the time delay results between AC and AN activities were discussed.
Keywords
Introduction
The neural information travels among multiple areas in the brain, which has been of great interest in the field of neurocomputation, and several computational methodologies have been developed and applied to measure the neural information flow. For example, the spike distance metric (SDM) method 1 focused on the temporal domain of signals and computed the correlations between extracted spike trains. Transfer entropy2,3 has been an effective algorithm to summarize the relations of neural activities in different brain regions when a large amount of spike data is processed. Phase-locking analysis4,5 often utilizes the Hilbert transform and denotes the signals in a frequency-phase domain. The results could show correlations of multiple signals in terms of frequency distribution, such as those in theta, alpha, beta, and gamma bands. The cross-frequency coupling method helped researchers better understand the neural information transfer and exchange with different frequency carriers,4,6–8 thus has been widely used. Besides the information coherence, researchers have also developed algorithms to detect the temporal relations among them. For example, Aertsen et al. 9 examined the correlations of spike trains at two neurons and presented the correlation relations in joint peristimulus time histograms (JPSTH). The approach has been utilized in behavior analysis with single neuron communication in the monkey frontal cortex by Vaadia et al. 10 To further conduct comparisons among multiple neurons in the brain, Czanner et al. 11 utilized the snowflake plot concept by Perkel et al., 12 which demonstrated the time relations in three neurons and discussed extending the algorithms to more neurons. Based on these theories, Paz et al. 13 expanded the algorithms and evaluated interactions among four brain regions from simultaneously measured signals. The temporal relations of the same type of neuron activities could also be calculated through correlation analysis. 14 For example, spike train cross-correlation has been utilized to analyze functional connectivity in the cat striate cortex, 15 and local field potential (LFP) raw data at various frequencies were cross-correlated to evaluate the time lag between brain regions. 16
The coherence and temporal analysis of neural activities in the auditory pathway have also been paid great attention to. The signals that travel among different brain areas play an important role in different brain functions, especially because many of the relations between different brain areas may be switched under pathological conditions including peripheral deafferentation due to acoustic trauma. Much research in the field of auditory neurocomputation was conducted with above-mentioned algorithms. For example, auditory brainstem responses to tones in noise were tested with spike-distance metric and correlation index. 17 The AN and trapezoid body in the auditory brainstem were compared in correlation index and the results have presented the phase and interspike intervals, where the temporal information is quantified in correlation; yet, the time differences were not evaluated. The previous work 18 has also compared simultaneous neural activities in the AC, inferior colliculus (IC), and dorsal cochlear nucleus (DCN), and the signal correlations among various auditory brain structures were evaluated. In the analysis of temporal responses, peristimulus time histograms (PSTHs) have been used by researchers to identify the rat AC response to external noise stimulus, and the difference in the responses to various types of acoustic signals was discussed, 19 cumulative PSTH was utilized in cat’ neural reactions to tonal stimulation, 20 and PSTH was applied to Chinchilla AC responses to the frequency-modulated tones. 21 All these studies used benchmark signals from the external sound source as a stimulus that could be controlled and measured. However, these methods were not designed for measuring spontaneous activities where no external stimuli are employed for comparison. Meanwhile, the temporal information spreading along the auditory pathways, especially for any pathological change of neural activities after acoustic trauma, has yet to be quantified. Thus, an alternate signal processing method needs to be explored and modified to fit the specific application.
Neural signals with transduced and coded auditory information that travel from the AN to the AC require sophisticated auditory processes including frequency analysis, sound localization, temporal integration, and discrimination. The abnormal deviation of the fine sophisticated sound processing, transduction, and coding following traumatic insult often triggers auditory pathological conditions, such as tinnitus, hyperacusis, and central auditory processing disorder. Thus far, investigations of the role of signal processing in the auditory system from the periphery to the higher auditory center in the temporal domain are still limited. This study aimed to quantify the amount of time needed for the AC neurons in response to AN stimulation. By analyzing the values of time delay, especially at various measurement locations from the AN to the AC, an overall AC neural responses could be characterized. We applied the approach to animals with different experimental conditions, including before and after noise trauma, before and after IMES, and then compared the changes of neural response time in the AC. The proposed algorithms applied to different experimental conditions to the animals mentioned above could provide a clue on the signal response and its shifts in the AC during the development of hyperactivity, a neural mechanism of tinnitus, and lead to an in-depth understanding of the information flow inside the auditory pathway. The knowledge will help better understand the mechanisms of tinnitus, a neuropathological condition of ringing in the head or ear without external sound stimulation.
The AN and AC are different types of neural structures and the signal patterns are different, thus coding and processing auditory signals differently. The spike train proposed in PSTH 19 usually can eliminate the influences by signal shapes. Yet, the processing of extracting spikes from LFPs in the AC and signals in the AN required an identification algorithm, and an appropriate value of threshold needed to be optimized. The first method introduced in this study, Time Difference at Peaks (TDAP), utilized the concepts from the spike train. It took AN signals as benchmarks and added pre-processing algorithms to extract proper spikes from raw data. At each selected short period of time where a snippet of signals included a spike, spontaneous neural signals in the AN and AC were compared and the difference between the timings of their peaks was calculated. The algorithm compared all possible pairs of signal pieces across multiple recording channels in the AN and AC, then summarized the AC response time to AN stimulation. While noticing that the background noises from LFPs in the AC might disturb peak timing in the signal’s temporal domain, we introduced a second method, Time Difference by Cross-Correlation (TDCC). It shared the same pre-processing algorithm when selecting signal pieces from raw data. But instead of checking the peak locations in the time-domain directly, it utilized a modified cross-correlation method to calculate the two waves’ time difference statistically, therefore eliminating the possible distortion of spike timing introduced by LFPs. Similar to TDAP, TDCC also summarized pair-wise comparison results and presented the AC response time to the AN activation via IMES.
The section Methodologies in this paper introduced the methodologies of spike extractions, TDAP, and TDCC, which were tailored for the signal analysis between the AC and AN. The section Experimental Results and Discussion compared the TDAP and TDCC results of the sample data collected from an animal before noise trauma, followed by more experimental results from two animals with different experimental conditions, that is, before and after noise trauma, and before and after IMES. The results’ biological meanings were discussed. The conclusion was presented and future work was discussed in the section Conclusion and Future Work.
Methodologies
Raw signal data were collected using TDT (Tucker-Davis Technologies) hardware and software and further processed in Matlab and TDT SDK. Raw neural signals in the AC of rats were collected simultaneously in 16 (#1-16) channels, positioned in 2 × 8 chronic micro-wire arrays (Clunbury Scientific LLC). To implant the array in the AC, a high-speed drill was used to make a burr hole on the right side temporal bone and to expose the core and belt regions of the AC. Based on the anatomy mark and the frequency-tuning curve of each electrode, a 16 (2 × 8) micro-wire array was implanted ∼0.8–1.0 mm deep in the primary AC, barely passing layer IV and reaching layer V. Layer IV or lower III receives bulk of thalamo-cortical input while layer V projects predominant subcortical and contralateral cortical neurons. The implanted electrode array was secured with dental cement. At the same time, 6 channels (#27–32) in a thread microelectrode array (Clunbury Scientific LLC) were used to record neural signals in the AN of the left ear. To achieve AN stimulation via intra-modiolus implantation in the cochlea, we developed an occipital to access the cochlea oblique to the AN trajectory, with the advantage of minimizing morbidity and mortality. Specifically, an incision in the left neck was performed to expose the occipital bone and restromastoid craniectomy was performed to expose the left 8th cranial nerve, a 6-channel neural probe was inserted into the modiolus (∼15° degree to the horizontal plane) towards the apex of the cochlea.
Under anesthesia, electrophysiological recordings of neural activity in the AC and AN were performed and frequency tuning characterization (FTC) established to determine the frequency representation of each implanted electrode/locus in the right AC and the left AN using tone sweeps (50 ms in duration, 2–42 kHz, incremental steps of 7 dB) delivered to the left ear by an electrostatic speaker. LFP and spikes were recorded on the same electrodes before noise exposure, after noise exposure, and after IMES. The TDT preamplifier has a fixed gain (255X) with an input range of ± 4.5 mV and a 16-bit signal resolution on the AD converters. The output of the channels was connected to a real-time signal processing system (by RZ2 and TDT) with a 25 kHz sampling rate and a 100–3000 Hz band-pass filter from units in which the signal-to-noise ratio was ≥1.5.
During recordings of both types of neural signals, it was noticeable that though AC neural activities were collected with the LFPs, there was usually a neural spike present in the AC following an AN spike on a time sequence. Figure 1 shows an example of the comparison of one AN and one AC channel plotted at the same timeline, and those signs labeled with triangles indicate the timing of AN spikes. The two algorithms presented here were to analyze the time difference between the AN and AC spikes, that is, to find how much time it takes for AC neurons to respond to AN activation. As mentioned in the experimental setup, 16 electrodes were distributed in the AC in a 2 × 8 configuration, thus it could lead to different response time values across electrodes’ physical configurations in the AC. Time-domain plot showing simultaneous neural signals in the AC and AN in Animal # MO12, before noise trauma. Blue (solid) lines show the data from Channel 1 in the AC, and red (dashed) lines the data from Channel 27 in the AN. Triangles indicate peaks of neural signals in the AN.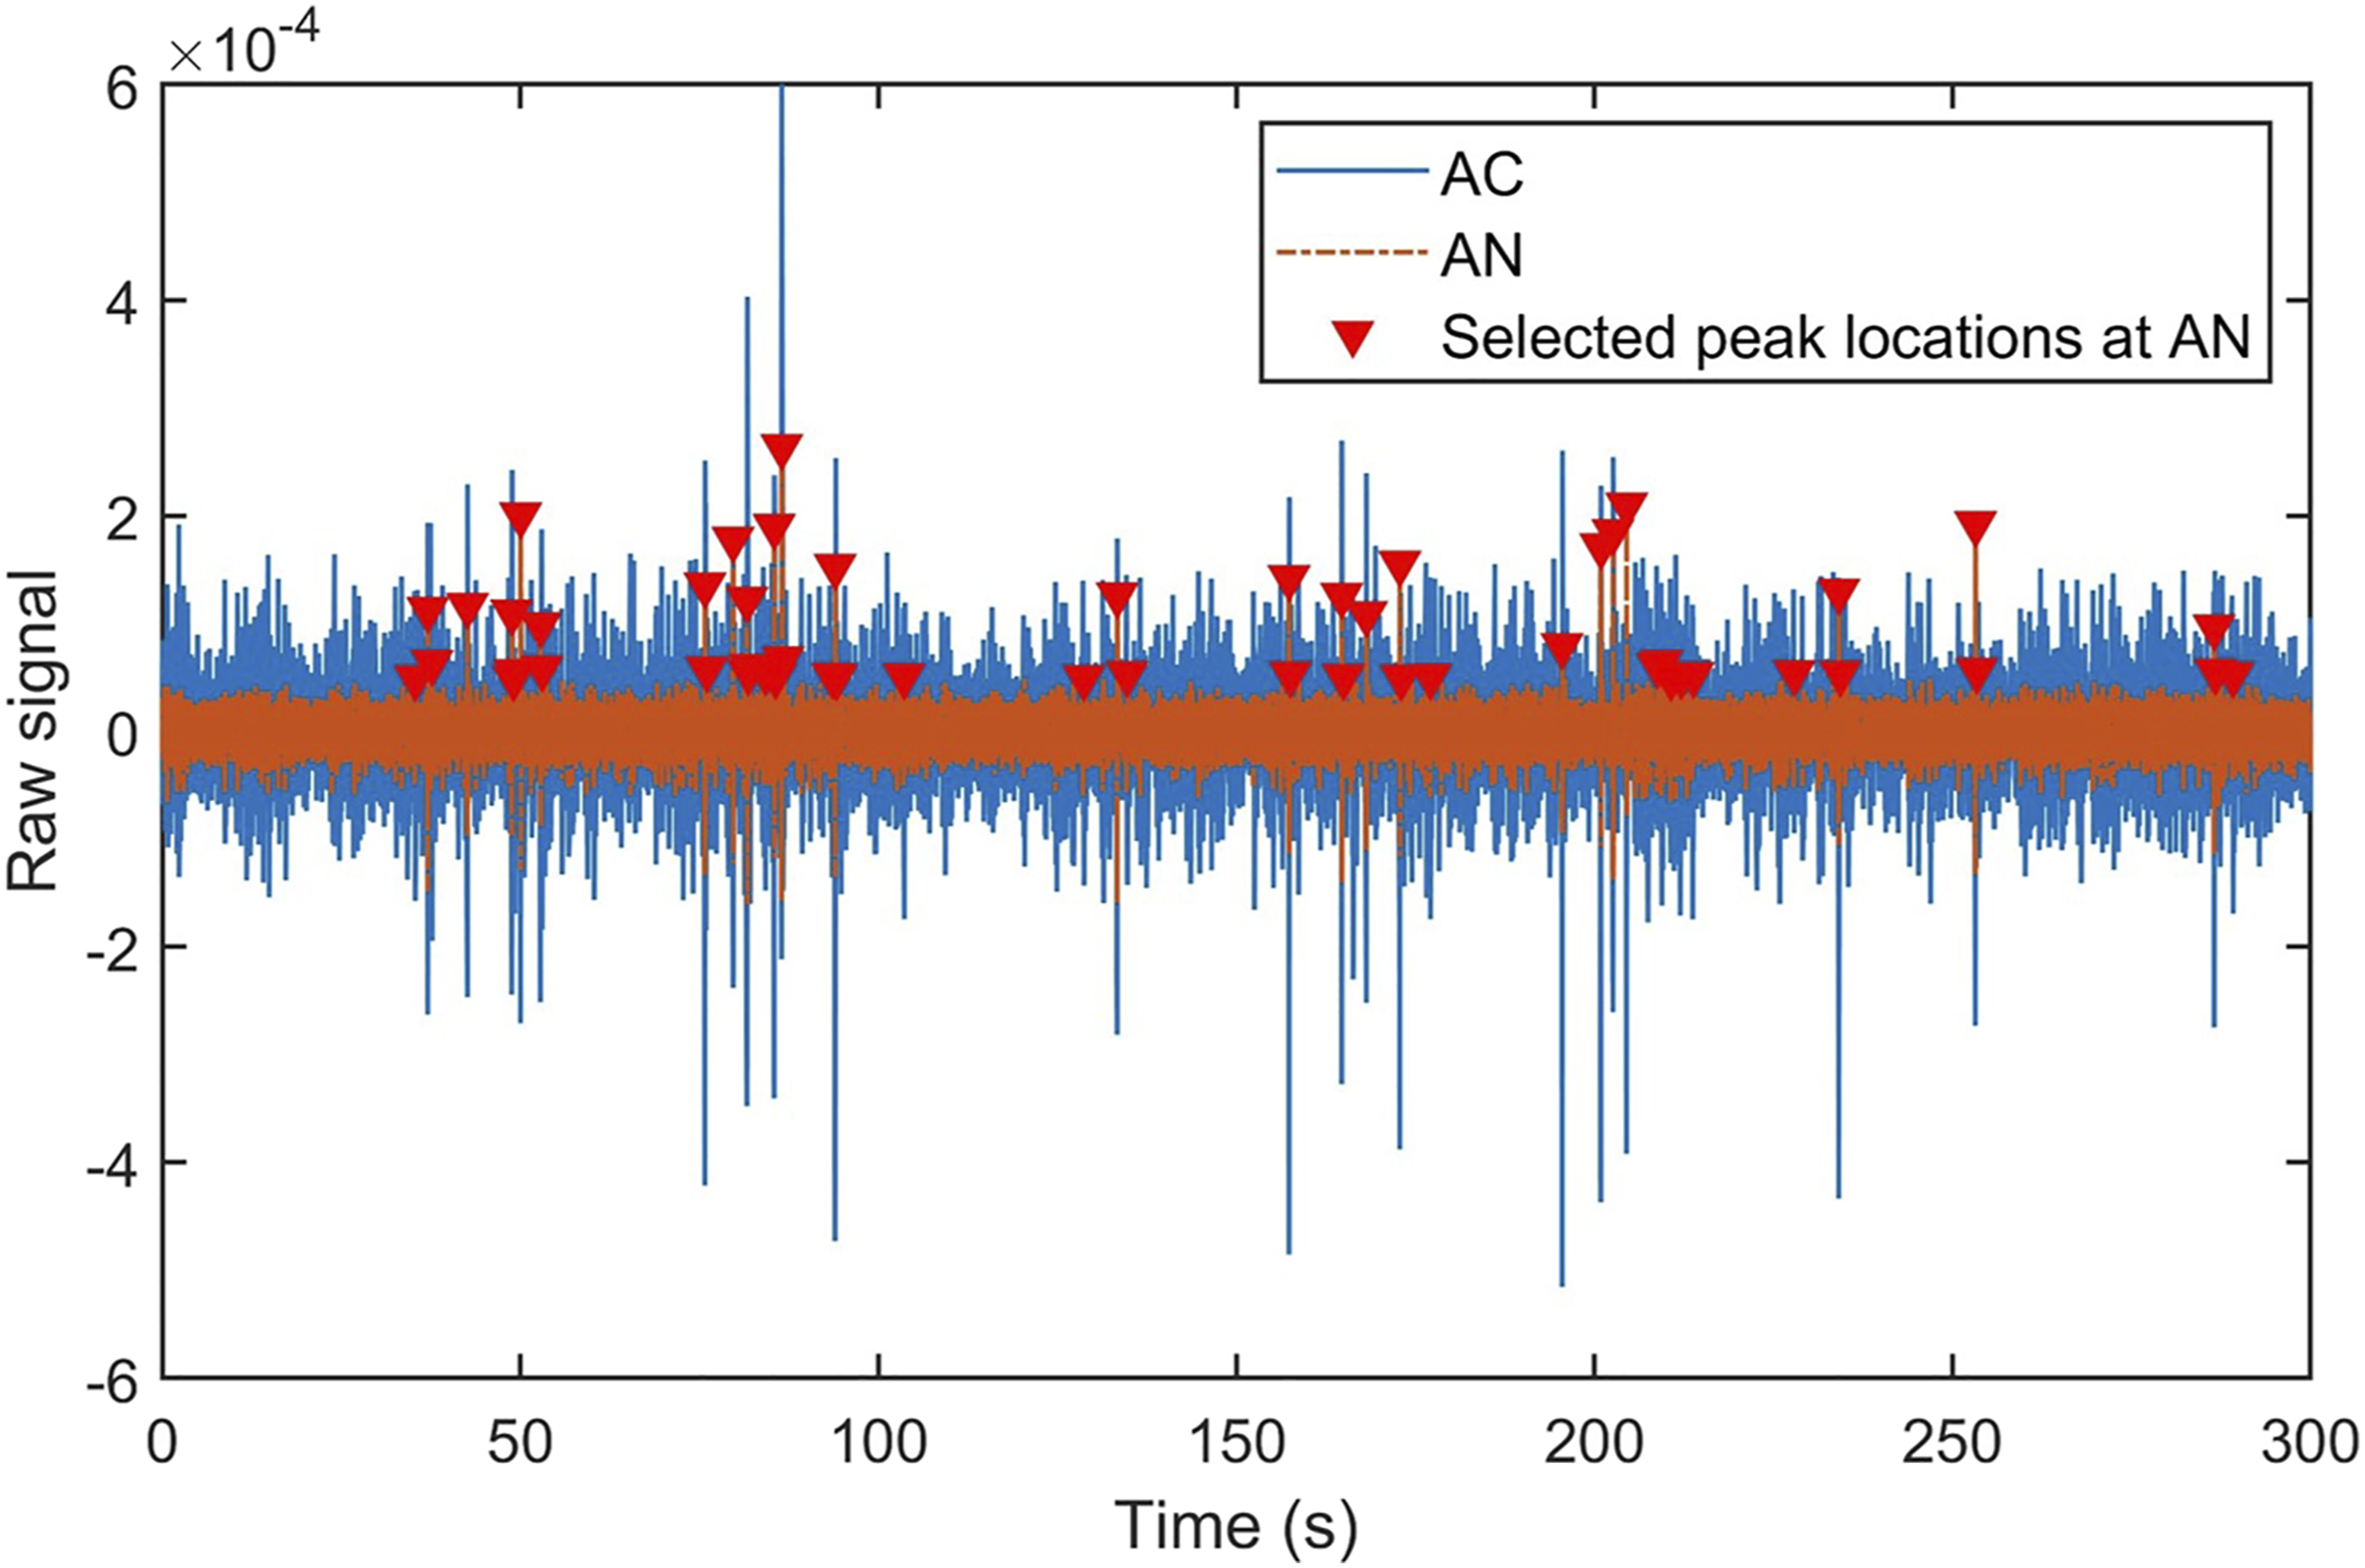
The raw data in the time-domain has shown that the AN signals are consistent in the temporal domain across different recording channels, though the amplitudes and peak patterns may vary. On the other hand, the AC signals’ peaks occurred at different temporal locations and the timing may be related to the location of AC channels. Based on our observation, we selected the AN channels’ peak locations as benchmarks, as the triangles shown in Figure 1. Several assumptions were also applied during the development of the algorithms, including: 1. The AC neurons were activated by the AN stimulation, thus AC signal peaks occurred after AN in the time domain. 2. Only the first peak activity of the AC neurons after the AN peak timing was counted, and a time window was applied to the signals to assure the program only counted the AC responses within a reasonable period of time. 3. The final response time of the AC to AN activation was calculated from the averaged value of all peaks’ calculation between two channels.
Extraction of Spikes
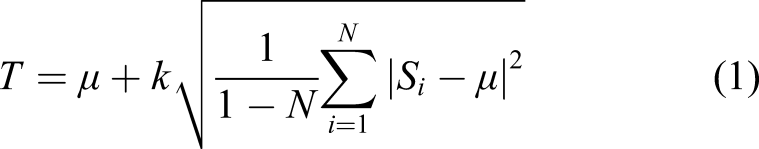
To process the raw data collected, AN signals at each channel were first analyzed and a threshold value T was determined. Examples of single peak analysis by TDAP and TDCC. Both samples were collected at Channel 1 in the AC and Channel 27 in the AN, from Animal # MO12 before noise trauma. (a) and (c) showed TDAP values by finding the difference at peaks from the AC and AN raw signals. (b) and (d) plotted the lag indices by cross-correlation, and the values of time delays were therefore calculated and marked in the figures. (a) Sample #1 signals and TDAP, (b) Sample #1 TDCC, (c) Sample #2 signals and TDAP, (d) Sample #2 TDCC.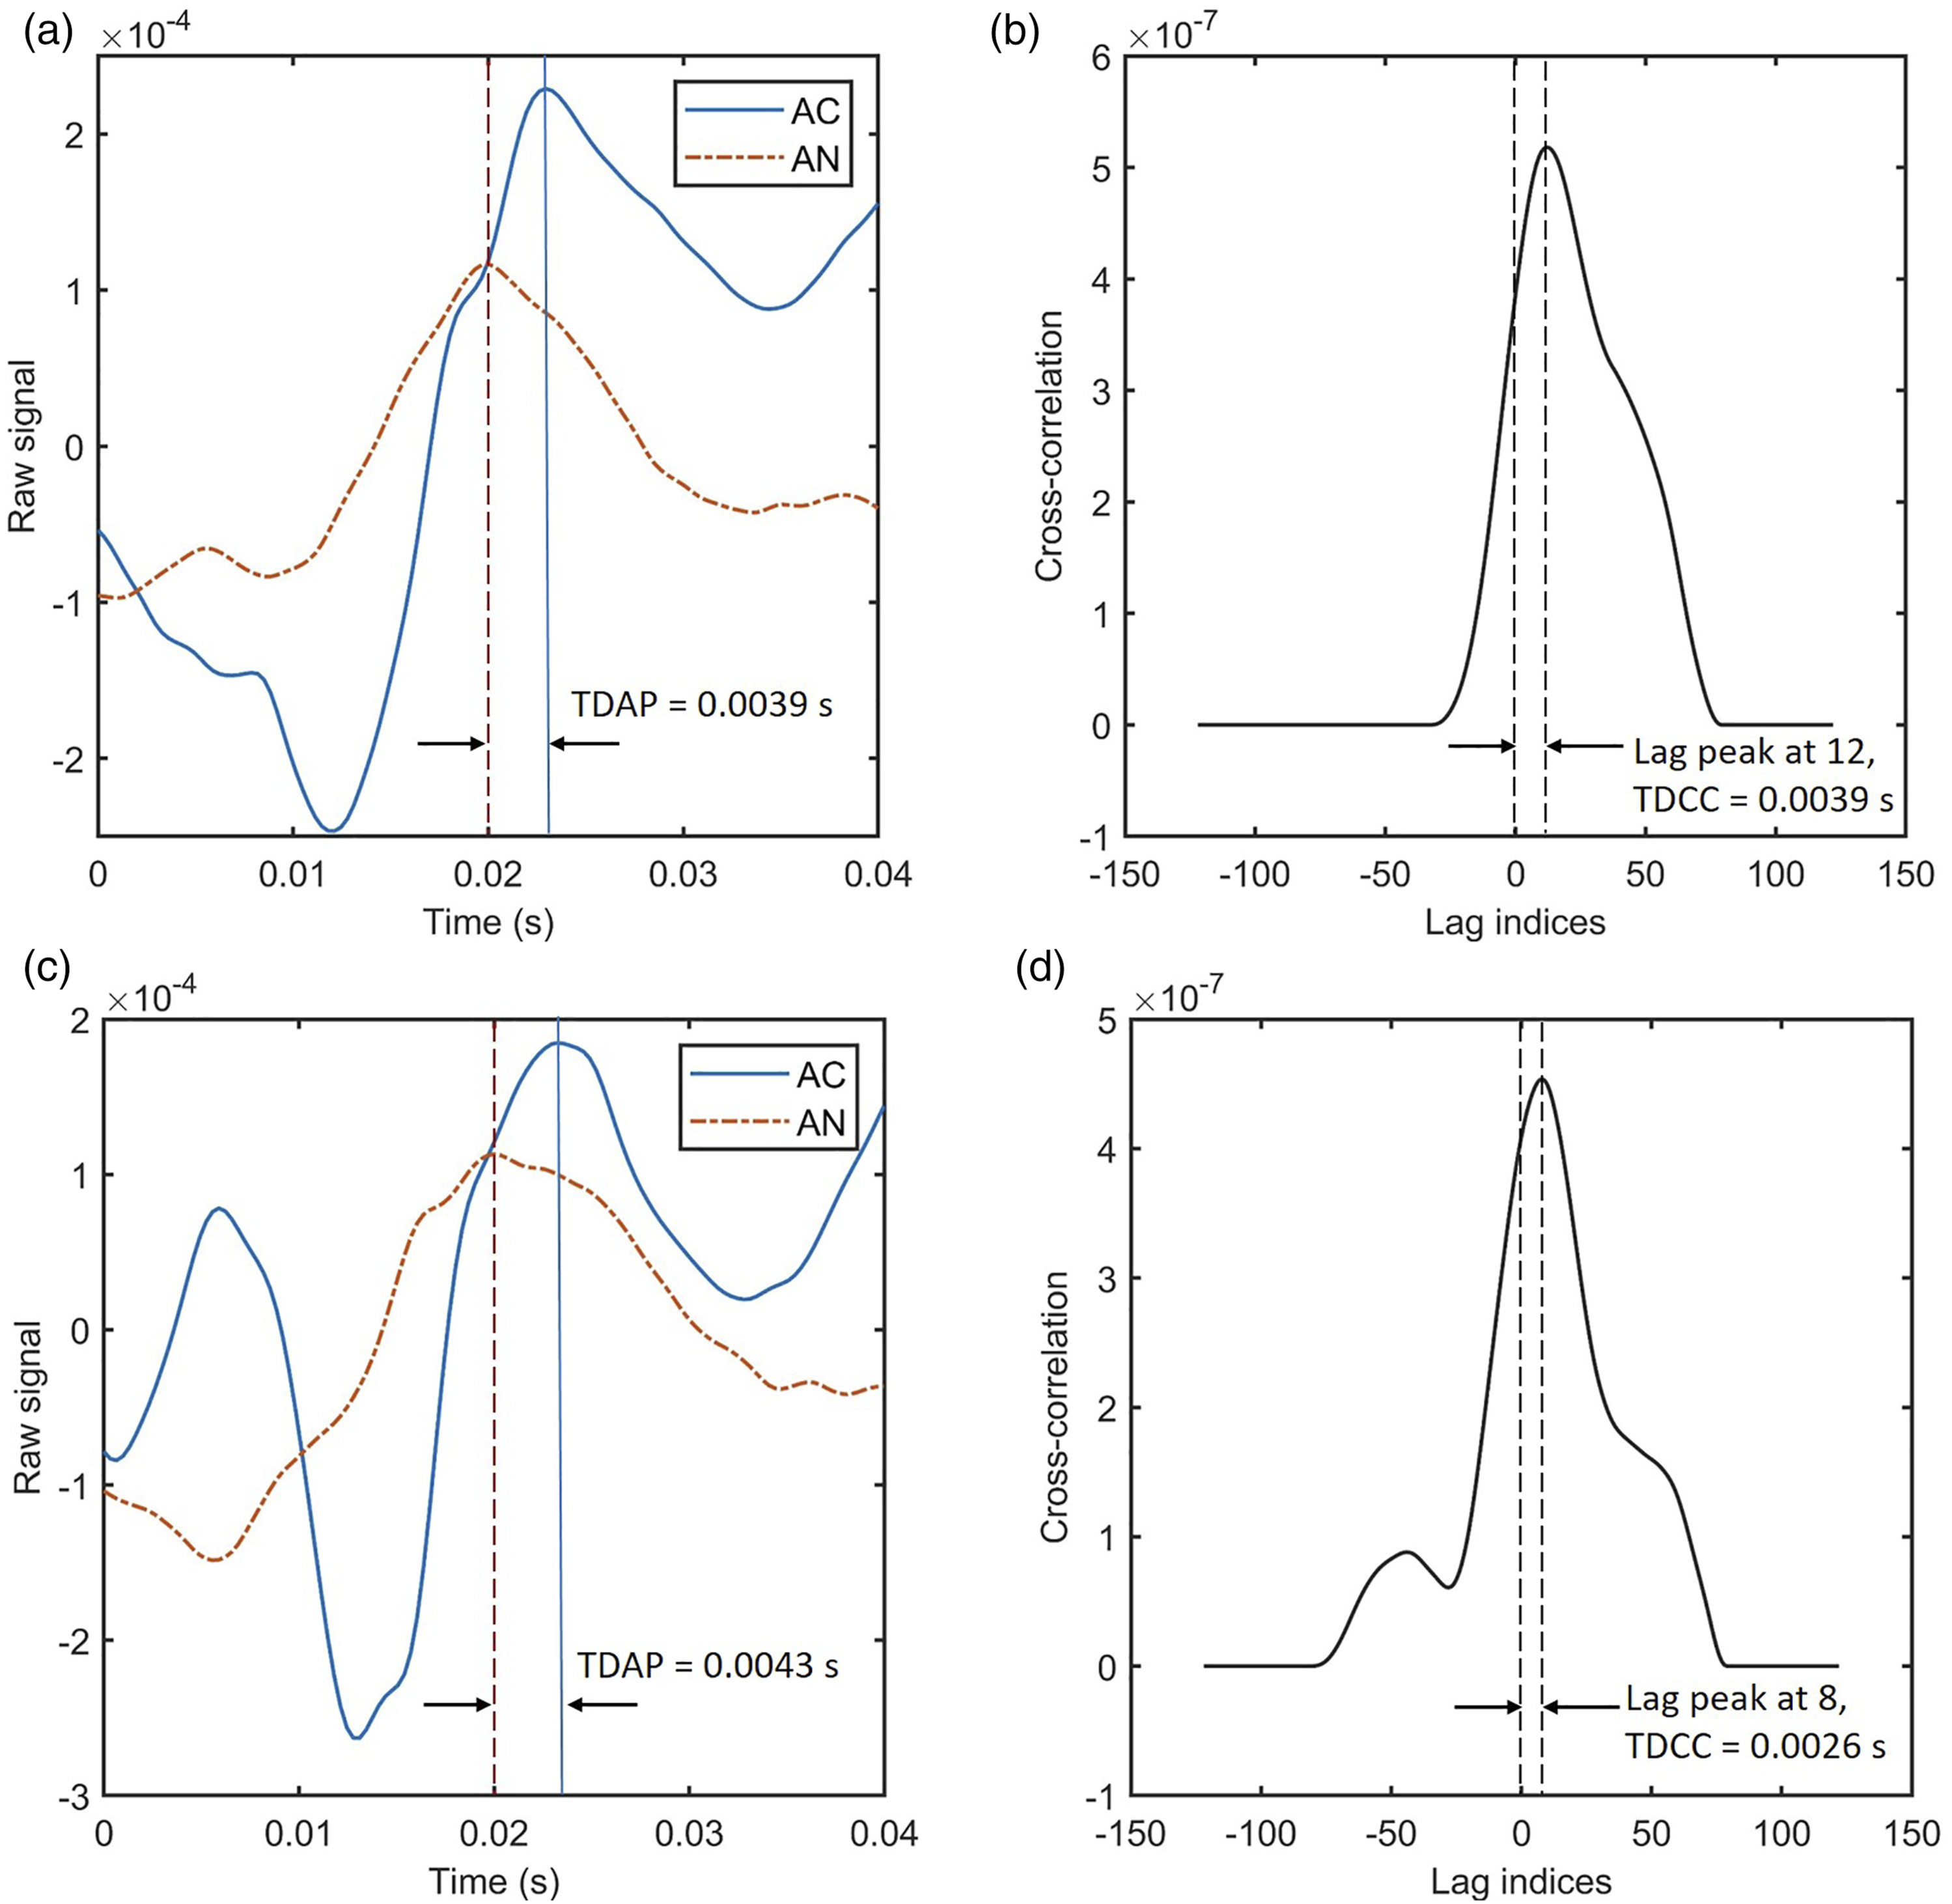
Time Difference at Peaks
The first method, time difference at peaks (TDAP), detected the two peak locations for both signals and calculated the time difference directly:

Time Difference by Cross-Correlation
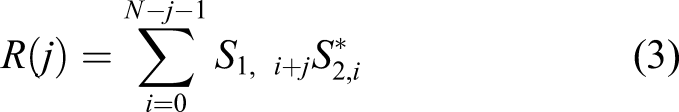
The second method, time difference by cross-correlation (TDCC), utilized the idea of cross-correlation and employed a pre-process cutting-off of the negative parts of the signals, thus eliminating the influence by the signal type difference between the AN and AC. Cross-correlation provided the linear correlation between two signals,
22
with the values 1 meaning the two signals are identical, 0 was not correlated, and −1 was the same pattern but opposite directions. The time difference can be calculated based on the lag count:

It was noticed that the time difference values calculated by both methods could be the same (Figure 2(a) and (b)), or different within a tolerance (Figure 2(c) and (d)). Several factors influenced the results. One major reason was that the LFP interference with spikes in AC introduced noise into the signal, thus peak locations in the TDAP method could be slightly offset. Meanwhile, the nature of the AC and AN signals were different, thus the shapes of waves may not match well. The TDCC method has eliminated the shapes of the AC and AN signals in negative numbers, which was significantly different, but only kept those positive and around the peaks, yet error still existed. Other factors that influence the results of the two methods and their agreement are discussed in the following sections.
The two methods presented here were utilized to test the AC to AN neural responses in rats. The experimental activities were conducted under the oversight of the Institutional Animal Care and Use Committee (LACUC) at Wayne State University, Protocol 19-02-0952, date of approval 4/7/2020. The animal care program at Wayne State University is accredited by the Association for Assessment and Accreditation of Laboratory Animal Care International (AAALAC).
Experimental results and discussion
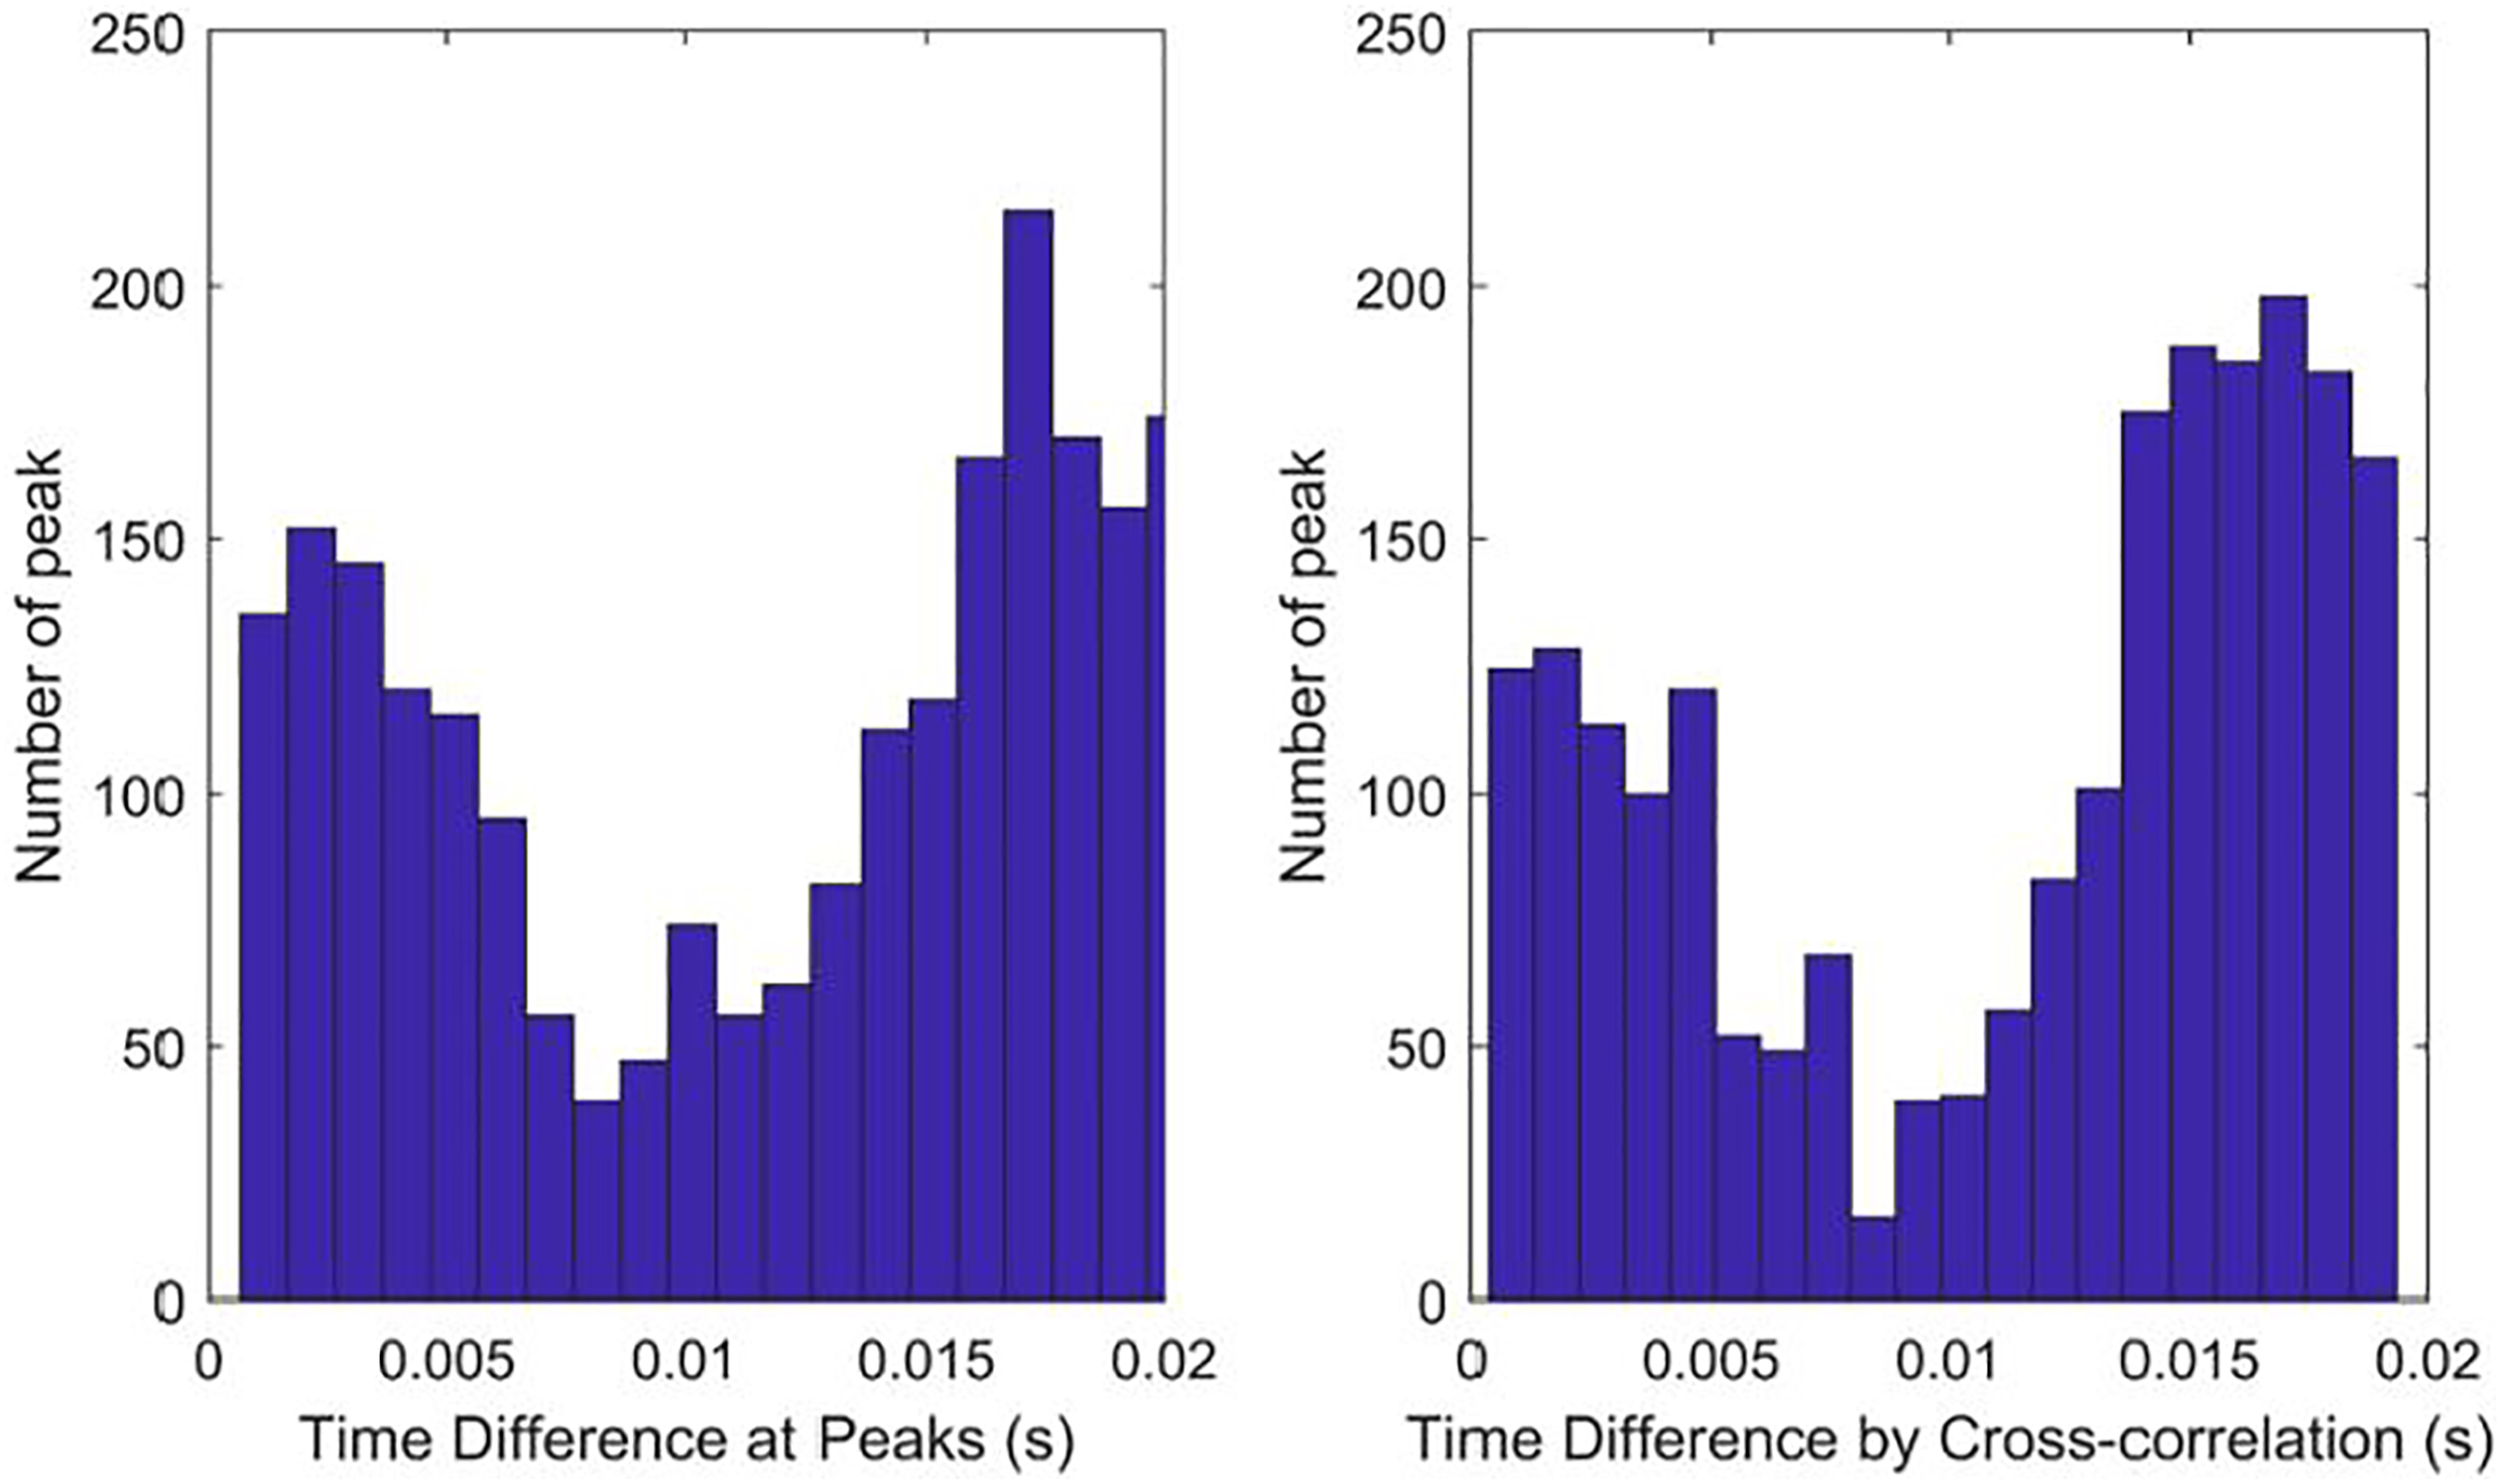
The rat was implanted in the right AC and left AN with chronic electrodes, and the neural activities from the AC and AN were recorded simultaneously, before and after noise trauma, and after IMES. The experiment setup was shown in Figure 3. A 5-minute long data recorded from one animal before noise trauma was employed to compare the two methods with various parameter setups. Neural activities from 16 channels in the AC and 6 channels in the AN were recorded simultaneously and a pairwise comparison generated Schematic of the cochlear implantation via the modiolus approach. HC: hair cell. SGC: spiral ganglion cell. CN: cochlear nucleus. Histogram summary of pairwise comparison of 16 AC and 6 AN channels. A total of 4928 peaks were triggered.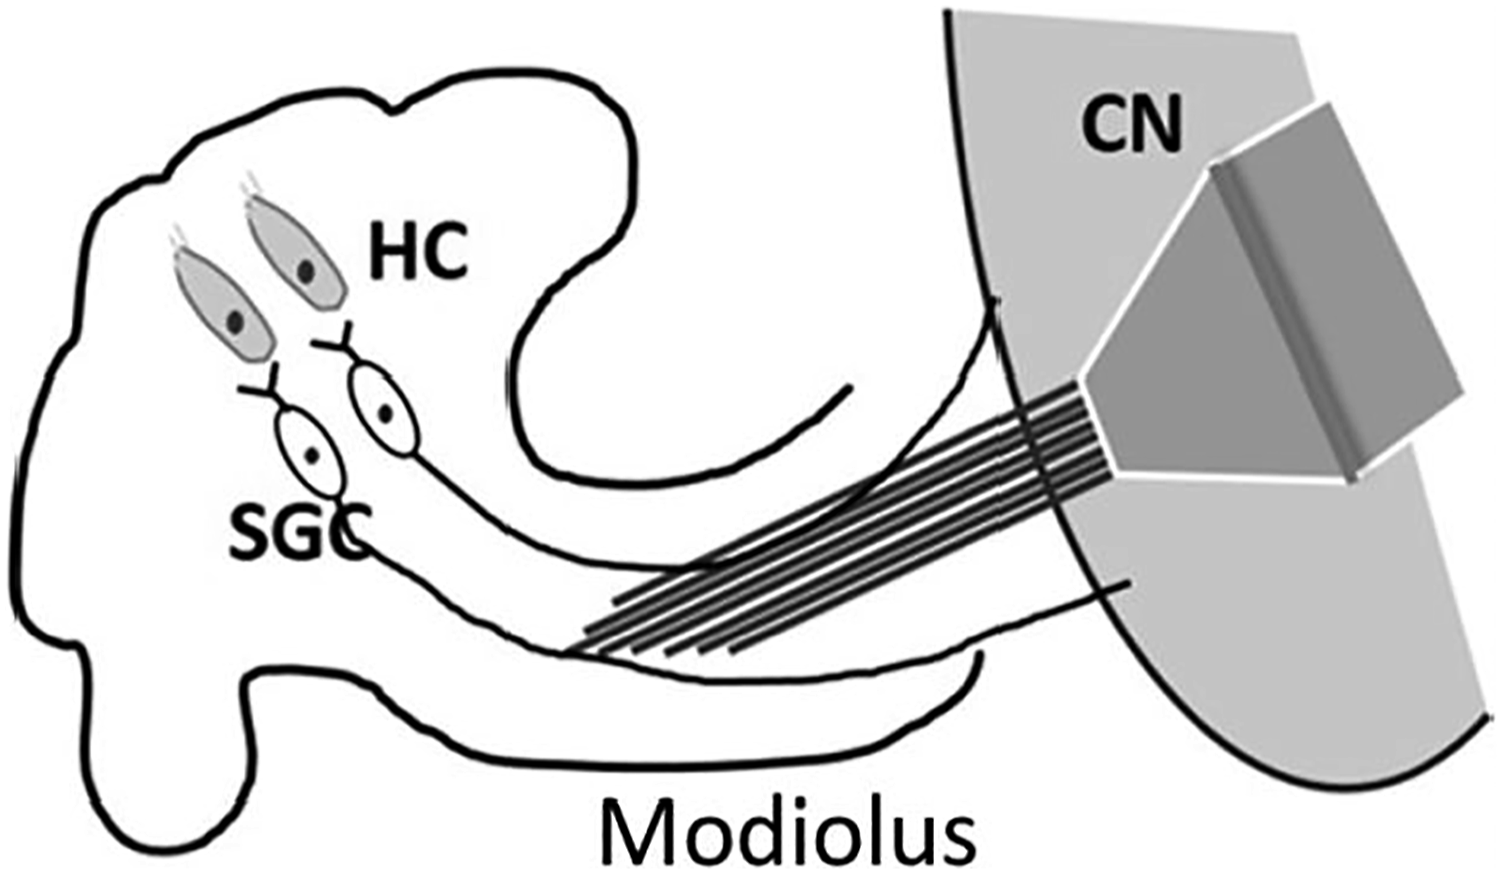
Agreement of TDAP and TDCC methods
The agreement of TDAP and TDCC results were examined and demonstrated in Bland–Altman
23
plots, as shown in Figure 5. A test on how the peak threshold influences the result and agreement of the two methods was also discussed. Figure 5(a) shows the lowest threshold, and Figure 5(c) the highest. Generally speaking, the higher threshold we set, the fewer spikes we picked, and the closer the results between the two methods. On the other hand, it was important to collect a significant amount of spikes during the data processing. Therefore, it was necessary to identify the optimal threshold value based on different signal conditions. With the above-mentioned considerations, Comparison and Bland–Altman plots of TDAP and TDCC results. The agreement of the two methods relied on the threshold level in spikes selections. A higher threshold made fewer spike signals selected, and closer results between the two methods. (a) 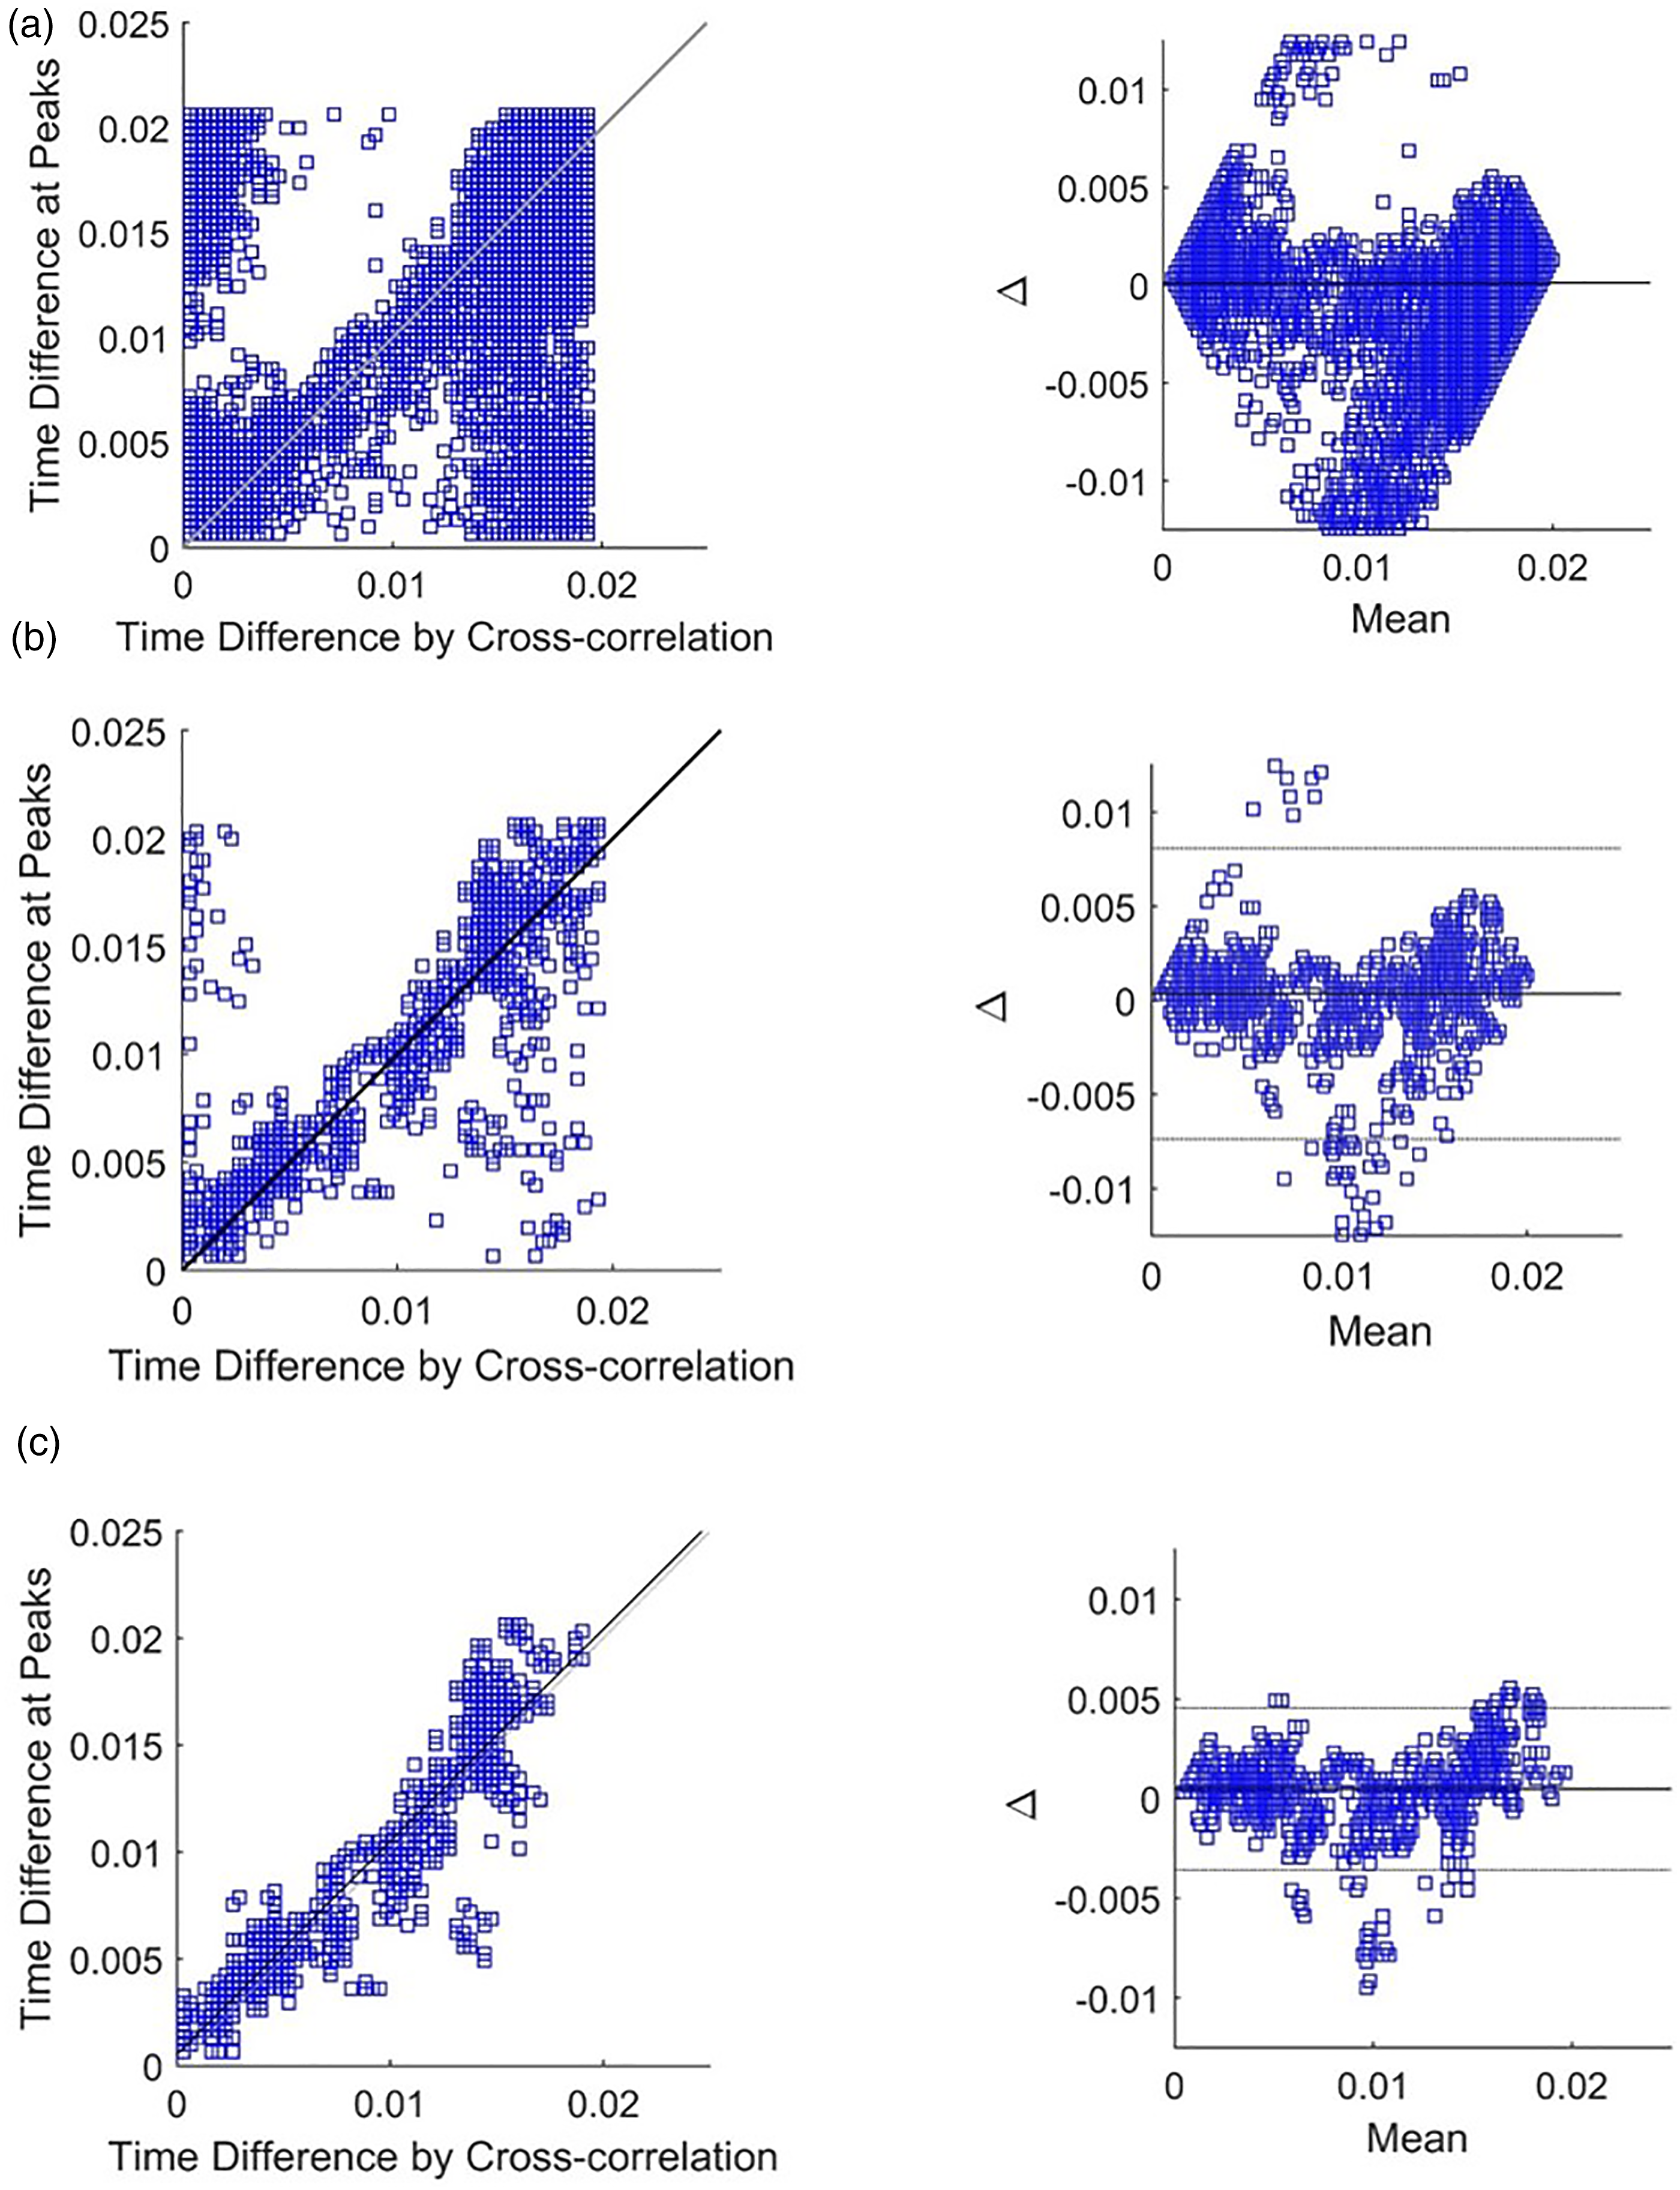
The data points in Figure 5 are clustered at the two ends away at △=0 because the plots represent overall results from 16 channels in the AC. It is noticed that the responses in the AC were location depended, with responses of some channels quicker than others. The error between TDAP and TDCC is because they follow different processing algorithms. TDAP counts the exact peak timing between two pieces of signals, therefore may count in any interference introduced by LFPs at peaks and introduces error. On the other hand, TDCC does a statistical calculation with cross-correlation thus reducing the influence of the LFPs at peak timing, but experience some difficulty because the AN and AC signals are different types and their shapes are not identical.
Differences on various channels from each recorded area
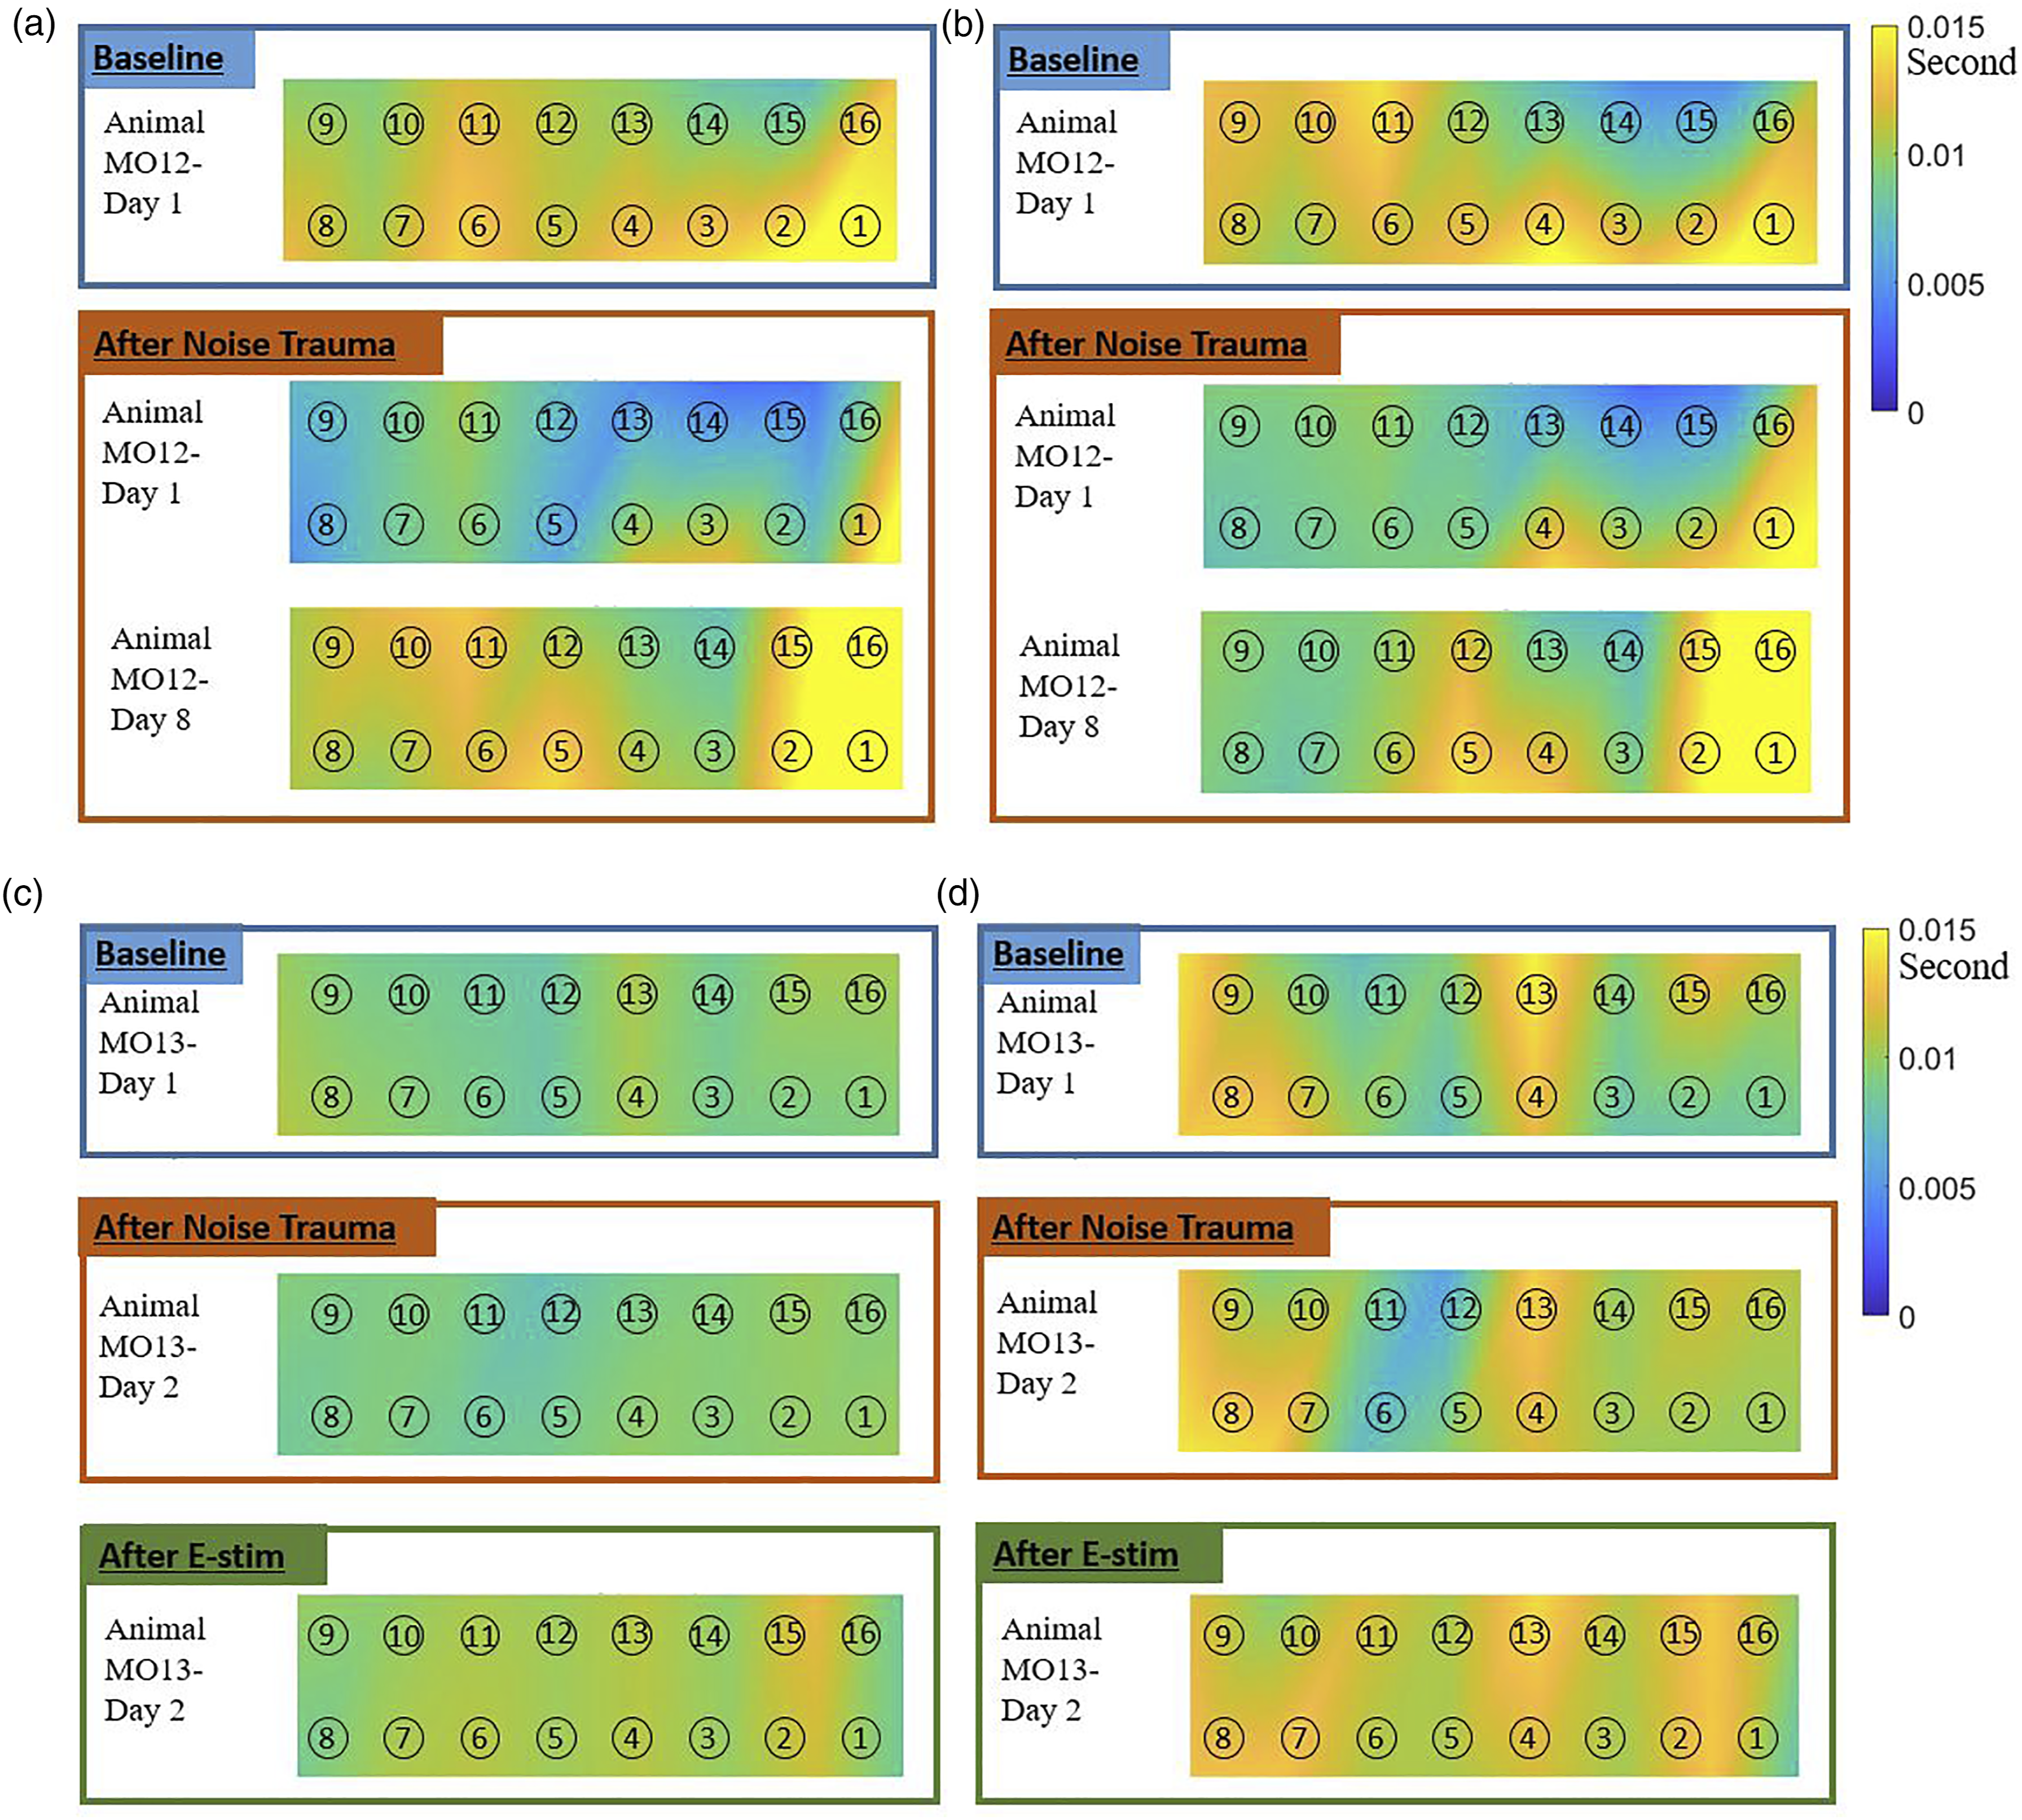
The same set of data results of Part A was summarized in paired channels and the average response time for each set was calculated. Figure 6(a) and (b) show the results using TDAP and TDCC, respectively. The horizontal axis indicates each channel in the AC, the vertical axis shows the response time in seconds, and each line in the figure indicates an AN channel. Both methods had consistent results in showing response time among different channels. All lines were close to each other, meaning the influence of AN channel location on the response time was very limited. On the other hand, the location of the AC channel has played an important role in the time response. For example, Channels 14 and 15 responded sooner, and Channels 1 and 2 later than others. This indicates that the response activities varied across different areas/channels in the AC and each channel’s response time depended on the electrode’s physical location. The differences are further described in a format of the color map (Figure 7), and discussed when comparing the responses before and after noise trauma, and before and after IMES in the following part of the paper. The difference at various channels. The response time results were less impacted by the channel difference at AN, but highly influenced by AC channel location. (a) Averaged TDAP at each AC channels. (b) Averaged TDCC at each AC channels. AC response time to AN stimulation analyzed using the TDAP and TDCC. Color map showed spatial locations of the recording channels in the AC, number in circles indicated the AC channel numbers. Color showed the time delay in second. Blue color (darker) indicated a shorter delay, or faster response, while yellow color (lighter) indicated a slower response. (a) TDAP, Animal # MO12. (b) TDCC, Animal # MO12. (c) TDAP, Animal # MO13. (d) TDCC, Animal # MO13.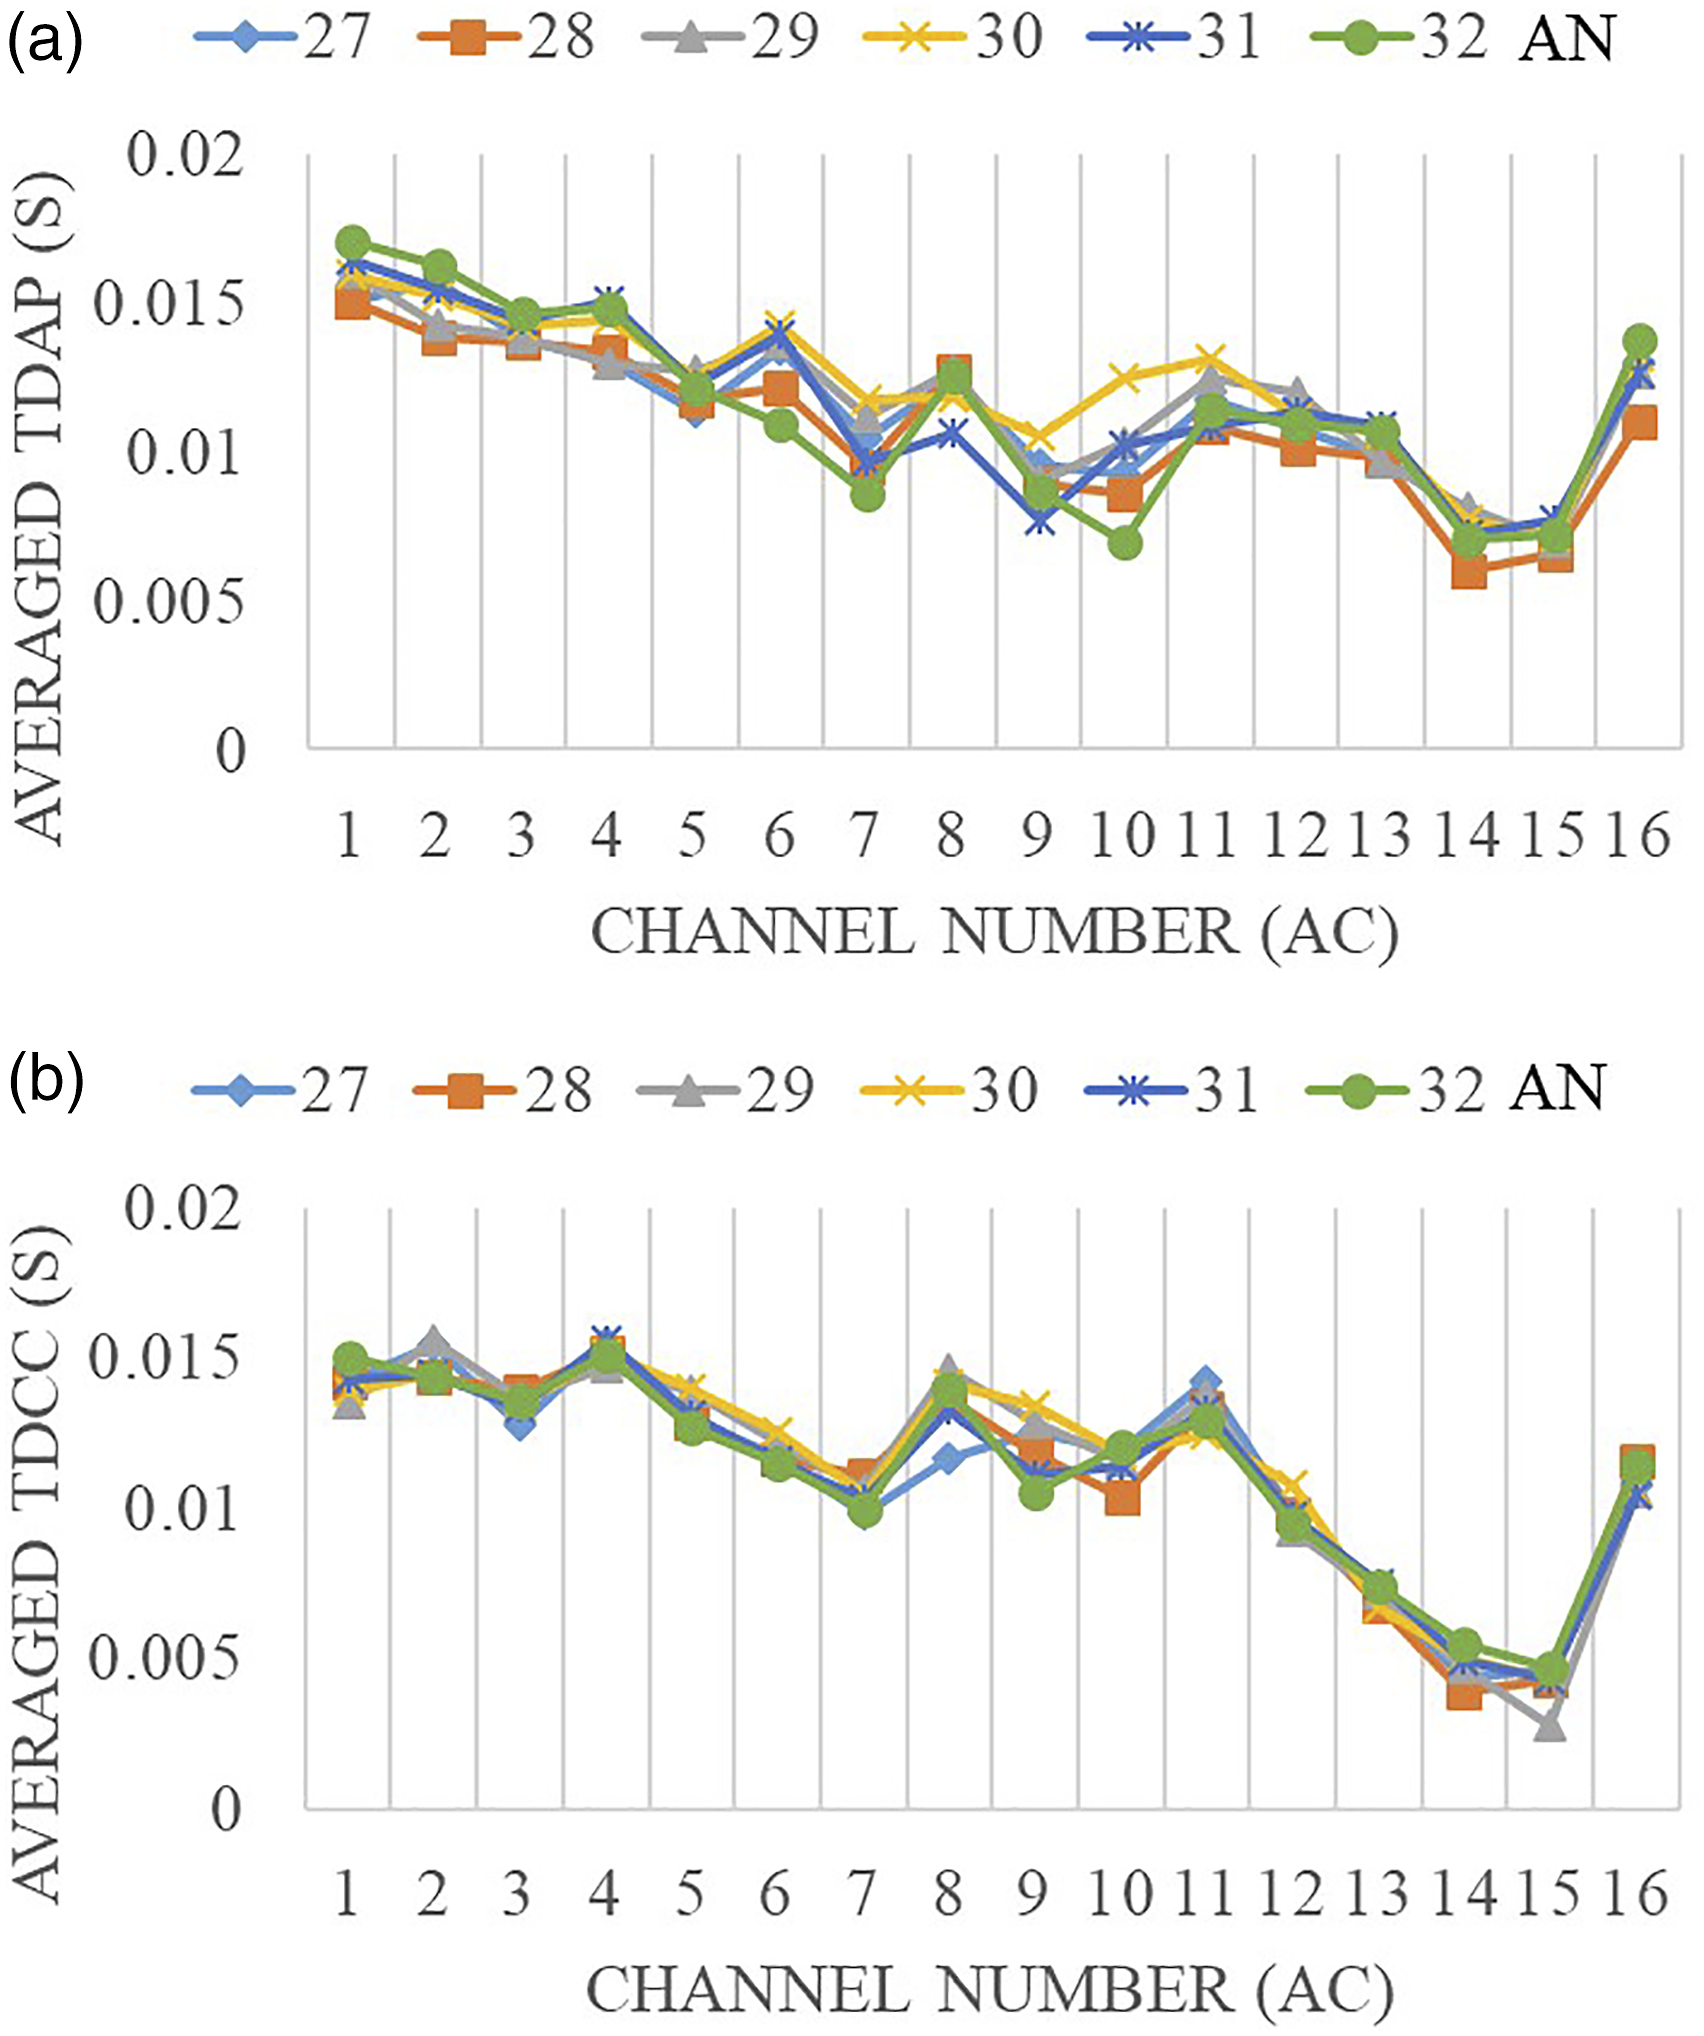
Experimental results
The two methods introduced in this study were applied to neurophysiological recordings in two animals, animal # MO12 and MO13. The quantified data was used to observe the effectiveness of IMES in animals with noise-induced tinnitus. An operant conditioning-based test was performed for tinnitus testing. 24 Briefly, water-deprived animals were trained to lick water-spot during sound perception and to suppress licking during silence. Following acoustic trauma, if an animal increases licking during silent trials, it can be inferred that the animals exhibit tinnitus-like behavior. Using this paradigm, we determined both acute and lasting tinnitus pitch behavior in individual animals. Both rats have been noise-exposed by 8–16 kHz bandpass noise at 110 dB SPL for one hour. Both rats showed tinnitus behavior after noise trauma. As shown in Figure 7, a set of 16-channel sensors (recording electrodes) collected spontaneous activities in the AC, and the averaged delay to AN signals was plotted in the color map. The color bar shows the delay time in the unit of second, with blue color (darker) indicating a shorter delay, or faster response, while yellow color (lighter) indicating a slower response.
For animal # MO12 (Figures 7(c) and (d)), on Day 1, a baseline measurement was conducted, followed by noise trauma to induce tinnitus, and one more measurement which showed the shift of time delay across different areas. Another measurement was conducted on the same animal on Day 8. Over time, the yellow or lighter area expanded, indicating a slower AC response to AN stimulation, which may be related to abnormal sophisticated signals processing in the auditory pathway after noise trauma. Animal # MO13 has experienced the full routine of baseline, noise trauma, and IMES. Similar to # MO12, a baseline was collected, followed by noise trauma on Day 1. On Day 2, one more measurement was conducted, and then IMES was applied. Additionally, another measurement was collected after IMES. Though those data were only collected for two days, measurements have shown that the noise trauma has caused neural plasticity in the AC by expanding the yellow (lighter) areas distribution, and IMES helped to change the trend by pulling it back to the baseline, in comparison with the animal #MO12 without IMES.
The results can also be explained with physiological responses that after noise trauma, the activity in the AN decreased, but the neural activities increased in the AC. That is why the data showed increased time delay. Putting the results together, the available information suggests that IMES-induced time difference change may operate through a combination of up-regulated the neural activities in the AN (a peripheral structure in the auditory pathway) and restoring physiological information flow along the ascending auditory pathway to draw pathological attention away from the aberrant signal and onto a normal input, which resulted in the down-regulation of the neural activities in the AC (a central structure in the auditory pathway). That could be the reason the data showed time delay decrease. Based on our limited number of animals and tests, TDAP and TDCC algorithms in combination with the biology observation provided the proof-of-concept neurocomputation of a possible pathway of information flow in the auditory pathway. However, more investigations in a larger number of animals are needed to draw a definite conclusion of biological significance. Nevertheless, the current study allows us to see the results of AC response time shifts after noise trauma and IMES, which support the possible applications of the TDAP and TDCC algorithms in the investigations of temporal delay of neural information flow along the auditory pathway.
As discussed above, both TDAP and TDCC have successfully quantified the response time of AC neurons to AN stimulus in the two animals (Figure 7), yet constraints were noticed during the test. First, both two methods are influenced by the background noise level of the LFPs. The number of data points extracted varied depending on the threshold level during spike extraction and is different from channel to channel. This may influence the accuracy of the final result, though the general tendency remained the same. We also observed, as shown in Figure 7, the similarity between TDAP and TDCC varies case by case. Color map results by the two methods were close for animal # MO12, but have a visible difference for animal # MO13. This is because the LFPs activities are relatively higher in the measurements in # MO13, which influence the spike extraction and peak identification. This caused differences between TDAP and TDCC as they follow different approaches in compressing the LFPs as background noise. Second, the color maps in Figure 7 show AC responses, yet the real spatial distributions of recording channels in the two animals are different and difficult to control during the implantation of the electrode array in the AC. In the future, such variability should expectedly and decreased when working with data collected in a larger number of animals.
Conclusion and future work
Through the proof-of-concept study, we discussed the measurement and signal processing algorithms by analyzing the central AC neural response to peripheral AN stimulation, and by comparing the differences in rats, before and after noise trauma, and before and after IMES. The consistent results from using the two methods, TDAP and TDCC, support the concept of quantifying AC time delays to AN stimulation that could interpret the temporal information processing along the auditory pathway. The test results have shown that the level of threshold determines the number of spikes selected in data processing thus influences the accuracy of the results, and a higher threshold in selecting spikes made the two methods' results to be closer to each other. The results from analyzing the multi-channel neural signals have also shown that different channels from the AN did not exert much influence on the response time, whereas the neural activities in different areas/channels in the AC behaved differently. It is noticed that the color map results are based on the signal processing data in two animals, yet the physical locations of the array implant in AC might be different. Nevertheless, the biological meaning of the observed time response changes indicates that noise trauma could delay the AC response to AN stimulation, and IMES treatment may re-adjust the trend and restore towards the a normal condition.
For future work, a larger sample size of animals will be employed in the research, and multi-channel neural signals will be simultaneously collected in the DCN, IC, and AC, allowing us to develop a more complete measurement system to analyze the temporal relations along the auditory pathways. Meanwhile, the correlations among the three auditory brain structures will be calculated and pairwise compared. The temporal relation and correlation together would provide a clearer view of the neural information flow which will benefit the research toward the understanding of the mechanism of tinnitus-related neural activities in auditory brain structures.
Footnotes
Declaration of Conflicting Interests
The author(s) declared no potential conflicts of interest with respect to the research, authorship, and/or publication of this article.
Funding
The author(s) disclosed receipt of the following financial support for the research, authorship, and/or publication of this article: The research work is supported by the Hearing Health Foundation.