
Abstract
A robust control strategy based on Adaboost prediction was proposed for the effects of dynamic uncertainty, parameter perturbation and nonlinear factors such as friction and leakage on the robustness and low-speed performance of the electro-hydraulic servo system. Based on the establishment of the Pol-Ind friction model, according to the mathematical model of the continuous rotary electro-hydraulic servo motor, the structural uncertainty model of the system under parameter perturbation and external perturbation and the generalized state equation of the system are established. The robust controller is designed according to the
Introduction
The guidance equipment has become the core component of spacecraft. Whether the performance of the guidance system can accurately simulate the precise positioning and automatic tracking of spacecraft has become a research hotspot in the aerospace field. 1 The hydraulic flight simulator commonly used in the laboratory is used to reproduce the dynamic characteristics of the spacecraft such as the attitude angle and angular velocity changes of the spacecraft in the air, and it is of great significance to provide a simulated flight environment for the guidance equipment.2,3 The continuous rotary electro-hydraulic servo motor is one of the most key equipment to drive the hydraulic simulator, which has the performances of the wide speed regulation, the high frequency response and the high precision. 4 However, due to non-linear problems such as parameter uncertainty, external interference, friction, and leakage in the system, it is difficult to establish an accurate mathematical model, and then the tracking accuracy of electro-hydraulic servo system is seriously affected. Thus, a controller is properly designed to improve the system performance has become one of the hot spots in the control fields.5,6
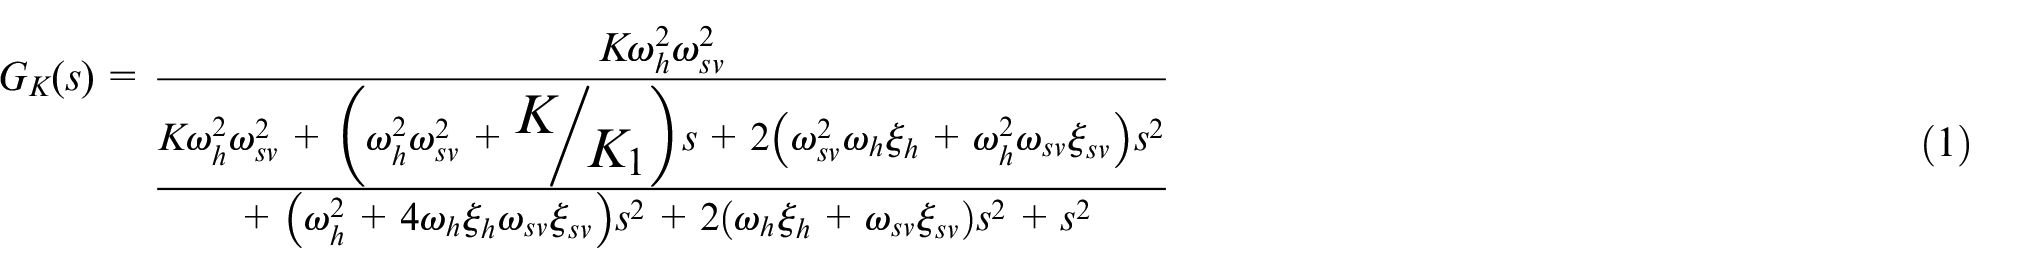
According to the least square method, the system was identified. He YH et al. 7 proposed the mixed sensitivity control method, the lead-lag and the differential pre-composite control strategy to suppress the effects of disturbances and uncertainties in continuous rotary electro-hydraulic servo system, which only improves the influence of nonlinear factors on the system, and the control effect of parametric uncertainties is not obvious, and the robustness of system is not good. In Wen-Tao 8 studied the control of a large displacement continuous rotary electro-hydraulic servo motor, in order to ensure the performance of the system, the lead-lag correction and differential front-end strategies were adopted, but the algorithm requires high accuracy of the system model and poor robustness. Xinhao et al. proposed a sliding mode control strategy for electro-hydraulic servo system, the sliding mode control has the advantages of fast response and strong robustness, which does not require the precise model of the system. However, the sliding mode control has the problem of jitter caused by high frequency switching control, and the system state variables are difficult to converge in finite time.9,10 Han et al. 11 proposed a system with a small jitter amplitude based on the RBF neural network, but the fitting accuracy of the neural network algorithm is low, and has the characteristics of high nonlinear fitting and over fitting, and the generalization ability is not strong, which easily leads to the network falling into local optimum. 12 Xue et al. 13 designed a linear active disturbance rejection control system for nonlinear time-varying uncertain systems with discontinuous external disturbance. When the disturbances satisfies the hypothesis of Lipchitz condition, the capability of active disturbance rejection control is limited to a certain degree. Qianghui et al. 14 adopted the switching control between the global sliding mode and the variable exponential reaching rate, which effectively eliminated the chattering phenomenon of PMSM servo system. However, due to the large number of super parameters, the application is difficult. Zhenshun et al. 15 proposed a fuzzy self-tuning of PID controller, which has certain effect on suppressing interference and noise, but did not consider the transient response speed, and the overall performance optimization effect was limited. Yongqiang et al. 16 used radial basis neural network to make adaptive compensation for the system, which effectively improved the decline problems of steady-state tracking performance of the direct-drive servo system, but it was only limited to simulation research. Mohanty and Yao analyzed the adaptive robust control theory of hydraulic system, dynamic tire load, suspension system and actuator, the theory can make the system achieve the requirements of the high tracking accuracy and the high response speed under parametric uncertainties and nonlinear factors.17–19 At present, in order to raise the control precision of the system, realize real-time feedback and predictive control, the lead-lag control theory, the prediction of sliding mode control theory, the neural network chaotic prediction theory and the adaptive predictive control are proposed.20–23 However, the structure of the general prediction algorithm is complex, and it is unable to accurately establish the prediction model of the system.
The AdaBoost algorithm is an important algorithm for analyzing classification and prediction problems in machine learning, which is usually used to train different weak learners for the same training set, according to the weight size, the weak learners are formed into the strong learners, which has the strong generalization ability and the highly nonlinear mapping ability. And the over fitting phenomenon of the learner can be effectively eliminated.24,25 Qihua and Rui 26 used AdaBoost algorithm to improve the fault classifier of neural network, and verified the improvement of generalization ability and noise robustness of fault classifier. Yao et al. 27 proposed an adaptive integration method based on the random subspace and AdaBoost, which integrated the random subspace into the training process of AdaBoost to increase the diversity of AdaBoost. At present, the algorithm is widely used in face detection, machine vision, speech recognition, weather prediction, fault diagnosis and other fields.28–34
Based on the above references, the robust control strategy based on AdaBoost prediction is put forward, and the friction model of system and linear uncertain generalized equation of state are established.23,35,36 According to the robust control theory, the
The establishment of model
The establishment of mathematical model of electro-hydraulic servo motor
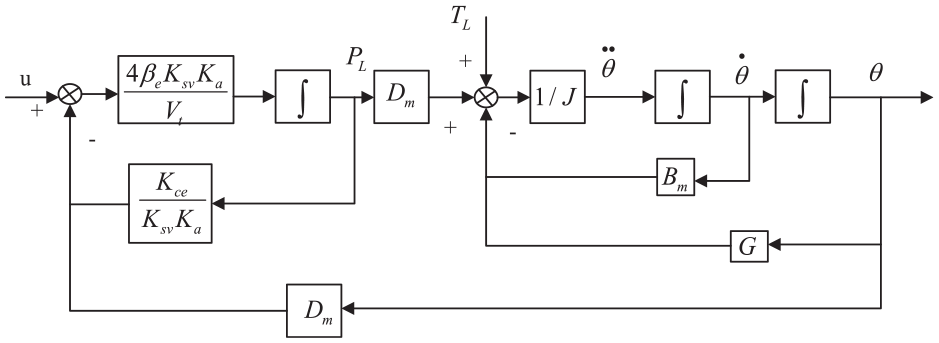
Because of parameter uncertainties and nonlinear uncertain factors such as internal and external leakage, friction interference, and oil temperature in the actual system, which seriously affect the tracking accuracy of the motor. 32 Therefore, in order to ensure the performance requirements of continuous rotary electro-hydraulic servo motor, this article mainly uses the traditional modeling method to establish the mathematical model of the continuous rotary electro-hydraulic servo motor. Based on the Xu and Yang, 26 the block diagram is in Figure 1.
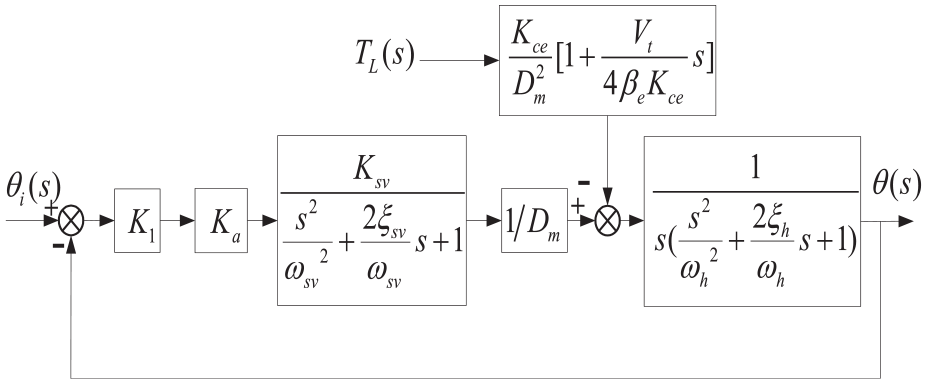
The block diagram of system transfer function.
where θi(s) is the input signal; K1 is the transfer function of main controller, θ(s) is the output signal, TL(s) is the additional friction torque, Dm is arc discharge (m3/rad), Vt is the total volume (m3), βe is the effective volume elastic modulus of the oil (N/m2), Kce is total flow pressure coefficient of valve control motor (m3/(s·Pa)), Kce = Kc + Ctm, Kc is the servo valve’s floe-pressure coefficient (m3/(s·Pa)), Ctm is the total leakage coefficient (m3/(s·Pa)), ωh is the undamped natural frequency of hydraulic pressure (rad/s), Ksv is no-load flow gain (m3/(s·A)), ζh is the hydraulic damping ration (dimensionless), ωsv is the equivalent undamped natural frequency (rad/s), ζsv is the equivalent damping coefficient (dimensionless), Ka is the gain of servo amplifier (A/V).
Therefore, the open-loop transfer function of the electro-hydraulic servo system is as follows:
W where,
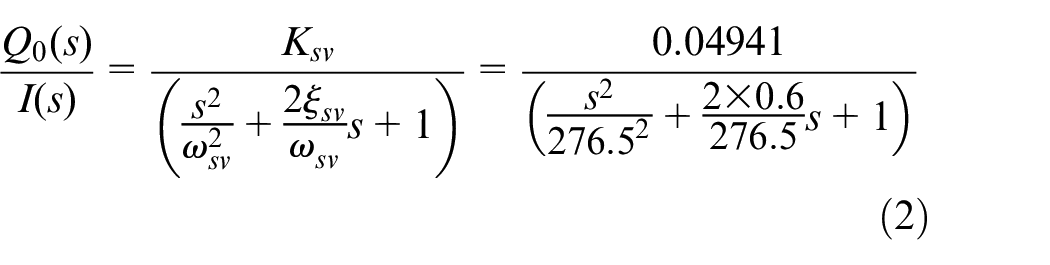
Arc discharge is Dm = 1.59 × 10⁻⁴ (m3/rad), the load moment of inertia is Jt = 10 (kg⋅m2), the oil pressure is 12 (MPa), the bulk modulus of elasticity of hydraulic fluid is βe = 7 × 10⁻⁸ (N/m2), the total effective volume of the system is Vt = 1.21 × 10⁻³ (m3), the natural frequency of hydraulic system is ωh = 76.5 (rad), the hydraulic damping ratio is ζh = 0.1, the viscosity coefficient is Bm = 5343 (N·m·s/rad), the leakage coefficient is Kce = 7 × 10⁻¹² (m3/(s·Pa)). The rated current of servo valve is 8 (mA), the rated pressure is 16 (MPa), the rated flow is 30 (L/min), It is assumed that the equivalent damping coefficient of the selected servo valve is ζsv = 0.6. Therefore, it can be known that the flow gain of servo valve in the hydraulic system is Ksv = 0.04941 (m3/(s·A)). Because the servo valve’s superior circuit flows through the servo amplifier, it can be concluded that the maximum output current of the servo amplifier connected with the servo valve should be controlled within 8 (mA). When the input voltage saturation value is ±10 (V), amplification of servo amplifier is 0.8 (mA/V).
Therefore, combining the parameters in the continuous rotary electro-hydraulic servo motor and substituting them into the transfer function of the electro-hydraulic servo valve, then, the servo valve transfer function can be expressed as follows:
Thus, the open-loop transfer function of the system’s response to the input signal is:
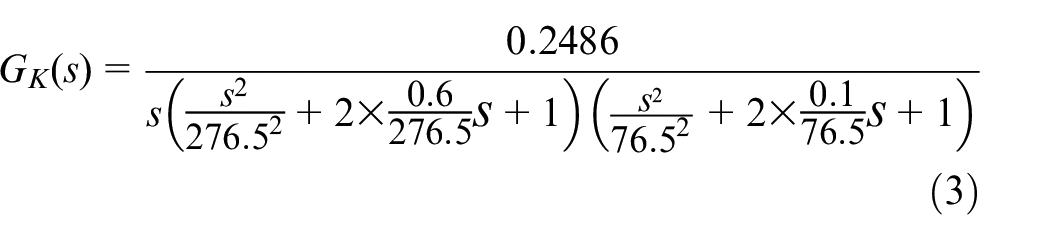
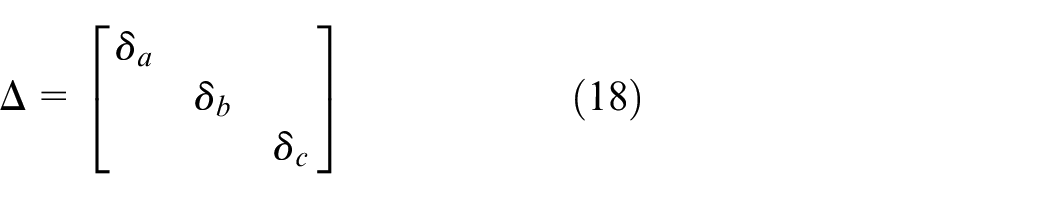
If the dynamic characteristics of the servo valve are ignored and simplified as a proportional link, the open-loop transfer function of the system’s response to the input signal can be obtained as:
The establishment of Pol-Ind friction model
The friction torque has seriously affected the tracking performance of the continuous rotary electro-hydraulic servo motor. Therefore, in order to achieve efficient system tracking control, the friction torque of motor operation should be compensated and controlled. Based on this, a new friction model – Pol-Ind model is introduced.
The Pol-Ind friction model was proposed by Professor Krzysztof of Rhodes University of technology and his term in 2016. The friction model can accurately describe a variety of friction characteristics. For example, the delay effects of pre-slip and slip stages, stick-slip, the non-local memory effect of pre-slip stage and so on. To a certain extent, it covers the friction characteristics of Coulomb friction model, Maxwell friction model and Stribeck friction model. The friction model is selected as follow.
The Pol-Ind friction model is described by the change rate of the roughness deviation of the contact surface. The expression is shown in formula (5):
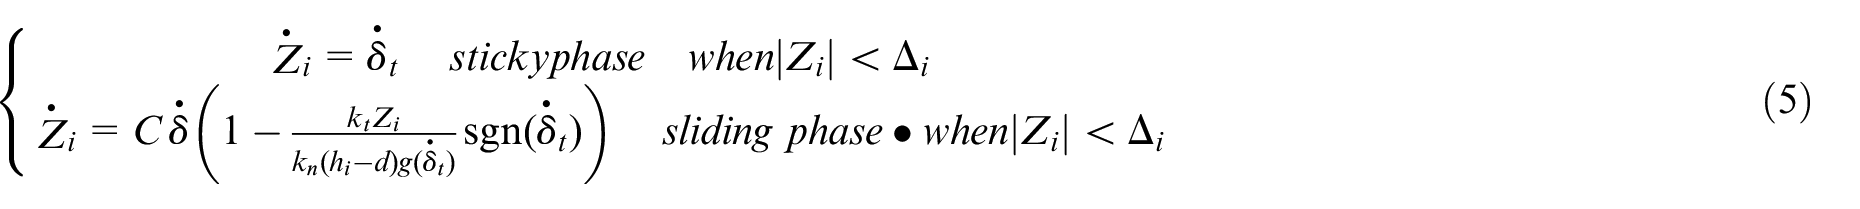
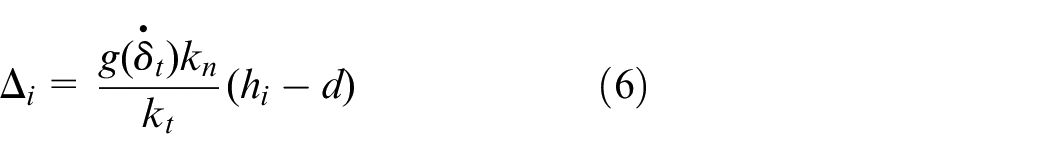
Where, Δi is the maximum deviation (the maximum elongation of the spring model), which is allowed in the sliding phase, then:
Where,
By superimposing the friction torque of each rough elastic block, the value of each rough peak and its coefficient in the tangential direction can be linearly superimposed, then the total friction torque can be obtained as follows:
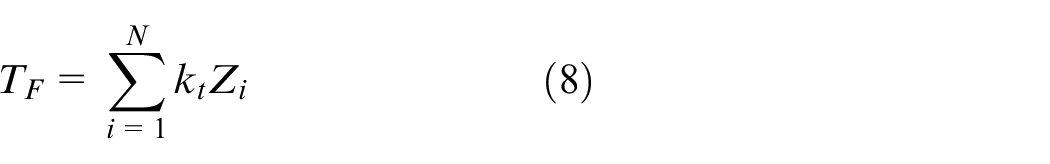
Among,
Since Zi is the state quantity, which indicates the elongation of the deformation caused by friction. and it is unmeasurable quantity, so it will be discretized, then:
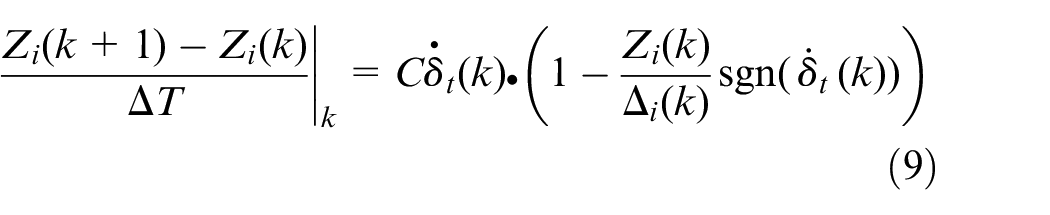
In the formula: ΔT is the sampling time interval (s);
Then the elongation can be obtained by iterative method, the expression is as follows:
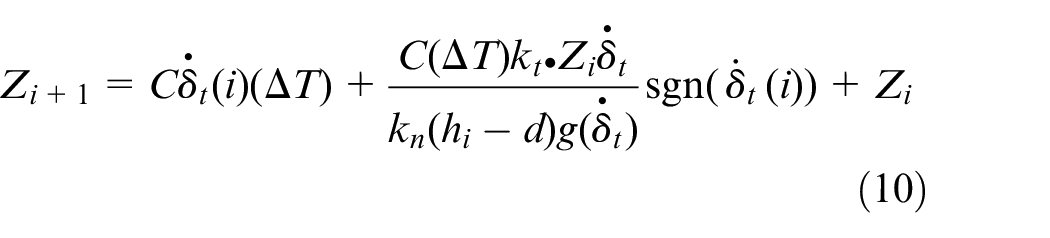
When Zi (0) =0,
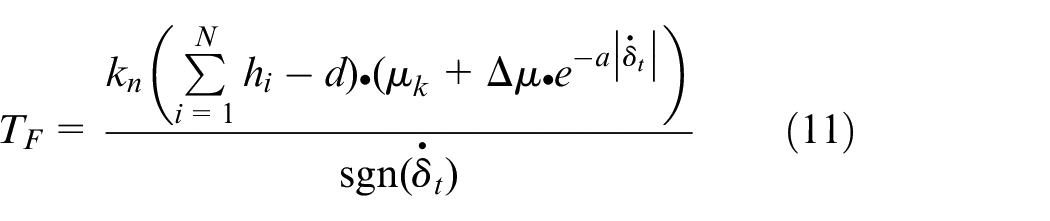
According to the above expression of friction torque, we can get the parameters waiting to be identified of the Pol-Ind friction model, including hi, μs, μk, kt, kn, N, a. Assumption S is the equivalent height of all rough peaks, then,
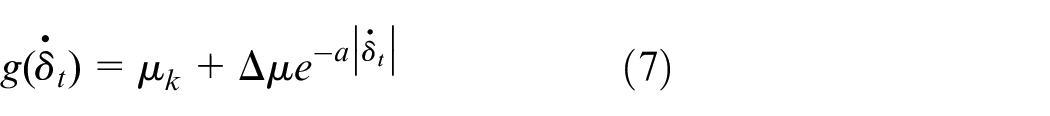
Where us is the static friction coefficient, △u = us − uk, uk is the minimum dynamic friction coefficient, kt is the stiffness coefficient in the tangential direction of the spring (N/m), hi is the height of a single rough peak (m); d is the distance between the rigid plane and the average rough peak height (m), kn is the nominal stiffness coefficient of the simulated spring (N/m), kn is the nominal stiffness coefficient of the simulated spring (N/m), a is exponential function,
When the oil supply pressure is 8 (MPa) and the output oil pressure of the pressure reducing valve is 4 (MPa), the experiment of the electro-hydraulic servo system of the continuous rotary motor was carried out, the angular velocity of 10 sets of input signals
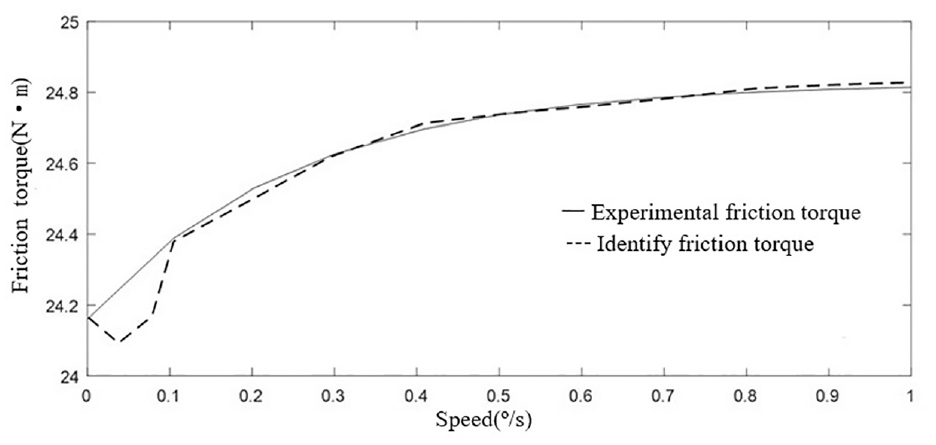
The friction model is identified by particle swarm optimization, and the average value of 10 optimal parameters is taken as the final model parameters, then the comparison diagram of experimental friction torque and the parameter identification torque are obtained by the identification algorithm in Figure 2.
The comparison diagram of friction torque and parameter identification torque.
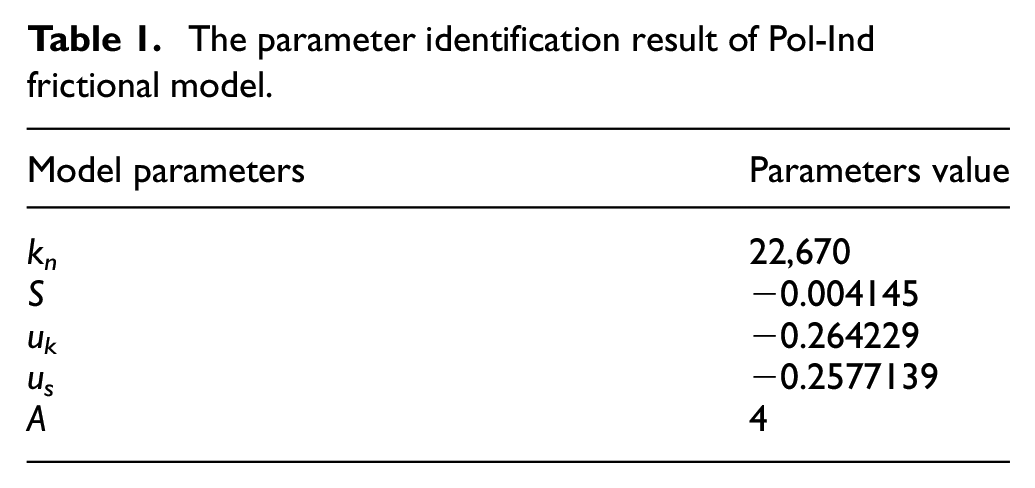
It can be seen from Figure 2 that the friction torque obtained by identification is not much different from that obtained by the experiment, the identified torques are basically close to the variation trend of experimental torques, so the Pol-Ind friction model can be approximately used as the actual friction model of the system, then the optimal parameter value can be shown in Table 1.
The parameter identification result of Pol-Ind frictional model.
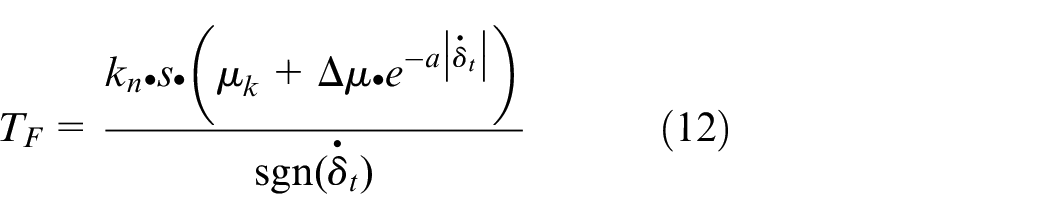
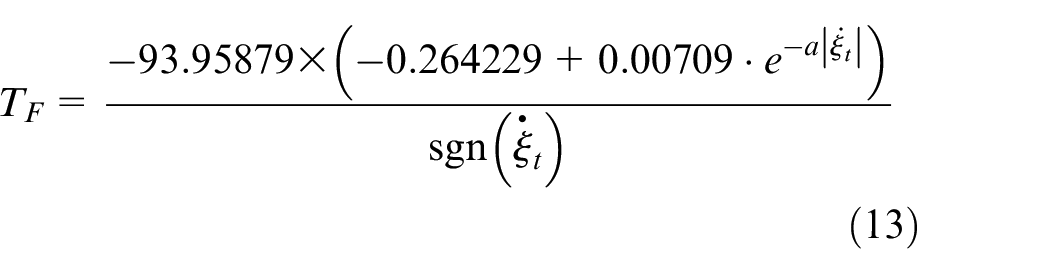
The final dynamic friction model is shown in equation (13).
The establishment of system uncertainty model
The equivalent structure block diagram of Figure 1 is shown as Figure 3.
The equivalent structure block diagram of servo system.
There are many uncertainties caused by external interference, nonlinearity, time-varying and high frequency dynamic characteristics which cannot be modeled in the system. The uncertain parameters of the system are studied in this paper, including the bulk modulus of elasticity of oil, the kinematic viscosity coefficient and the leakage coefficient. Then the following uncertain parameters are assumed:
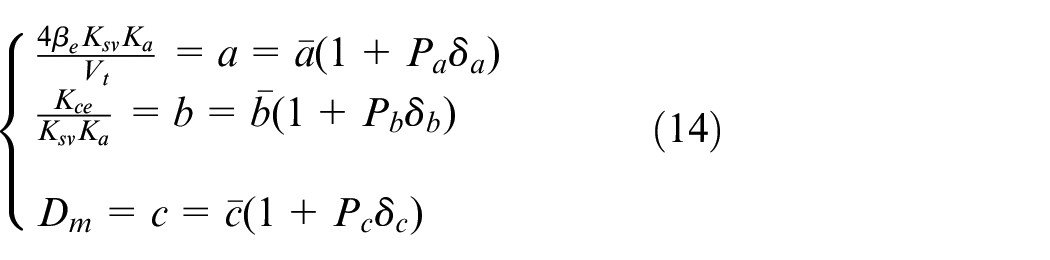
Where, pa, pb, pc = 2% are the disturbance quantity of parameters, −1 ≤ δa, δb, δc ≤ 1 are the uncertain parameters.
In particular, the matrixes of uncertain parameters Ma, Mb, Mc are assumed as follows:
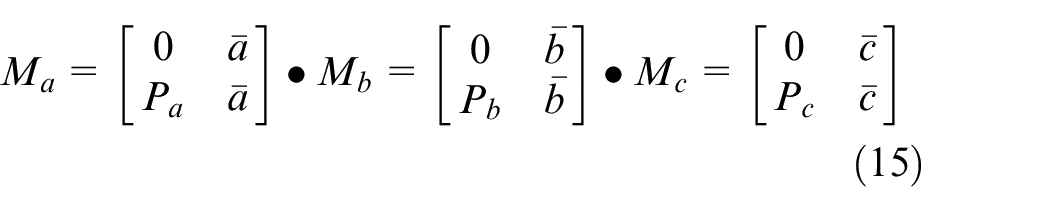
So, the equation (14) can be expressed as follows:
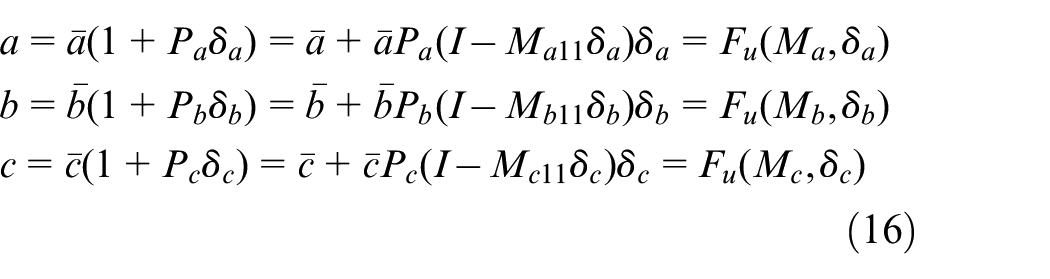
Where, Ma11 = Mb11 = Mc11 = 0.
Based on formula (16), according to the additive uncertainty modeling rule, the Figure 3 is transformed into the model structure of as Figure 4.
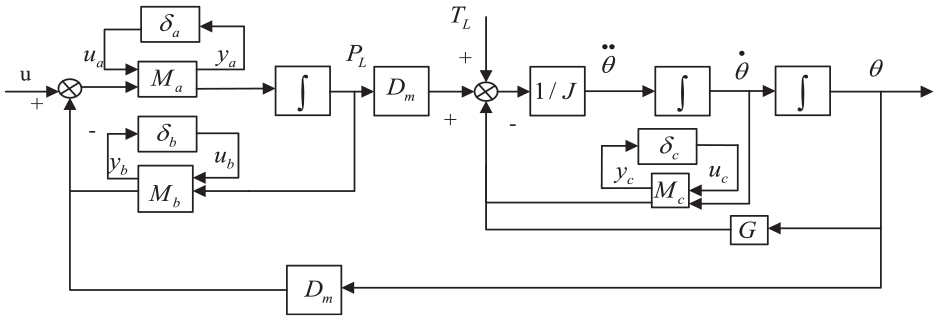
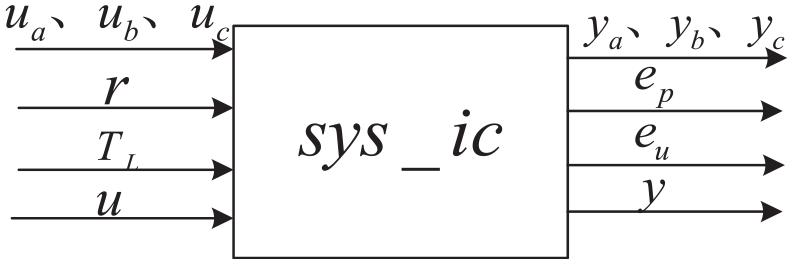
The robust structural parameters and structural uncertainty model of the system.
In the Figure 4, the input of linear fractional disturbance δa, δb, δc are ya, yb, yc and the output of linear fractional disturbance δa, δb, δc are ua, ub, uc. So, the Figure 4 can be further expressed by equation (17).
△ is the transfer matrix under the parametric perturbation, which is described as follows:
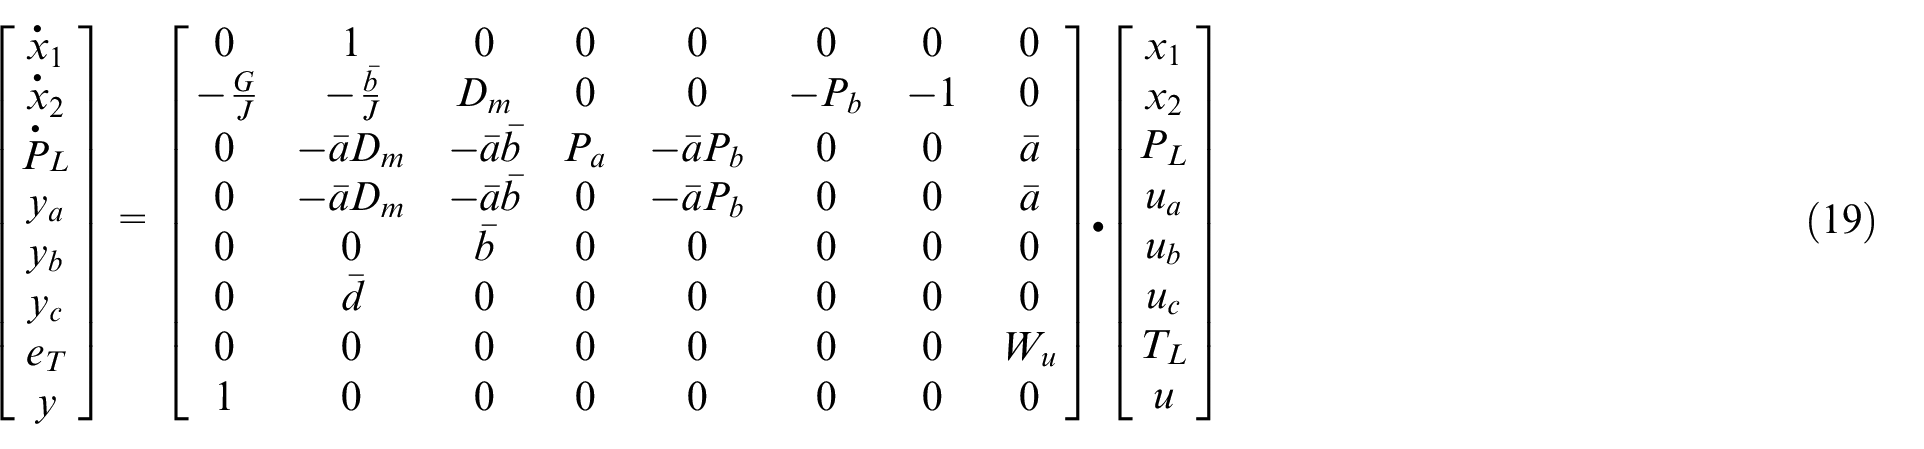
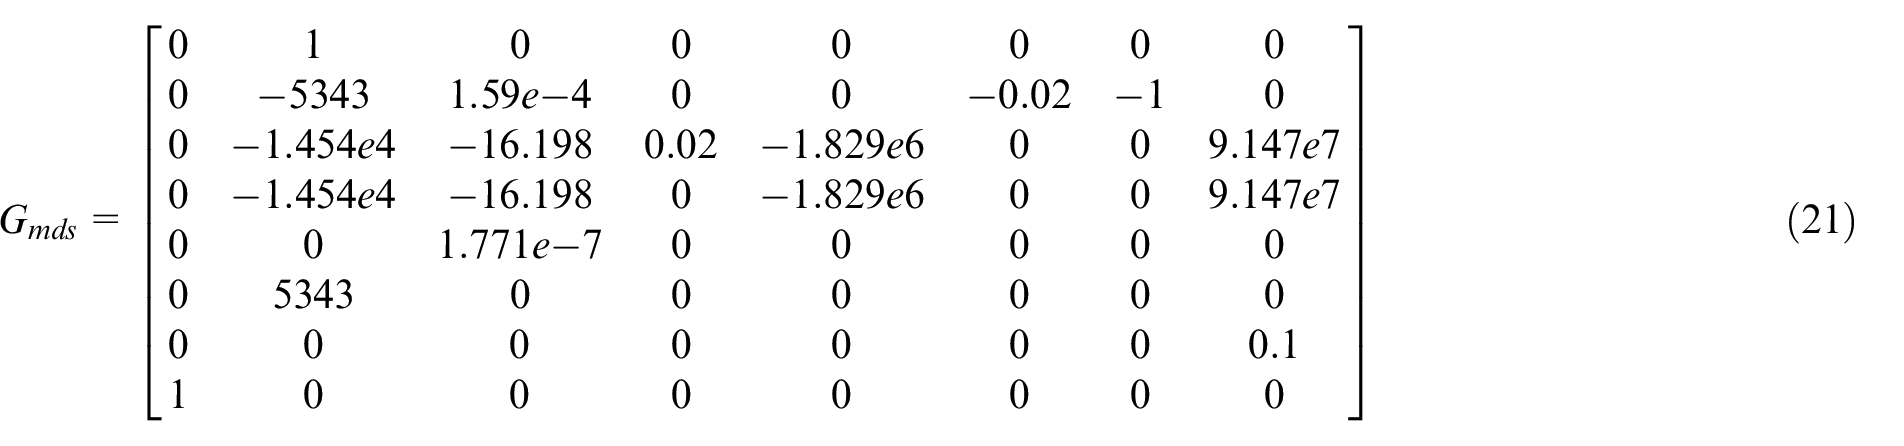
According to the robust structural parameters and the structural uncertainty model of the system shown in Figure 4, the system structure can be converted to a standard robust problem. Therefore, the generalized closed-loop system of the continuous rotary motor with structural uncertainty in Figure 5 is established, Gmds is the system nominal model, the dotted line in the figure indicates that input weighting function Wu is included by Gmds .Wu is the input weighting function, which can suppress the high frequency component in the control input, Wp is the weight function of performance to suppress the low frequency components in interference, er is the evaluation of control input, ep is the value of performance evaluation, then Gmds is the nominal state equation of the system which can be further transformed into the following formula by formula (17), including the weight function of input Wu, the state quantity of the system [x1, x2, PL], the inputs of parameters perturbation [ua, ub, uc], and the input of the electro-hydraulic servo system [TL u].
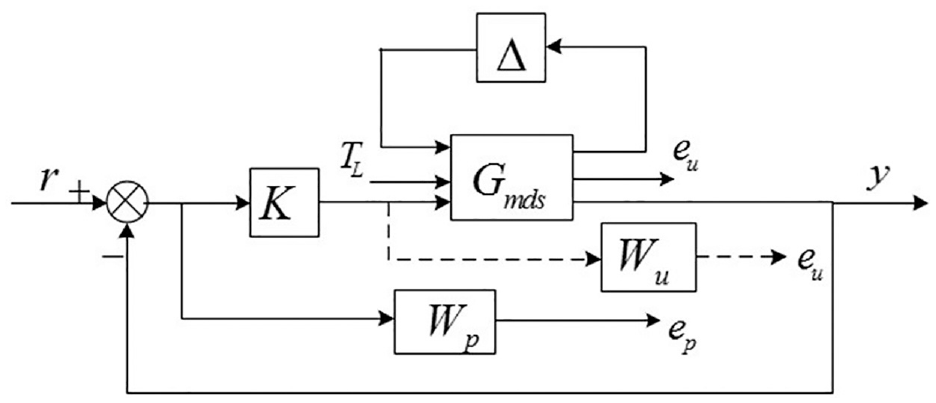
The generalized closed-loop system of the continuous rotary motor.
The design of controller
The robust controller design for electro hydraulic servo system
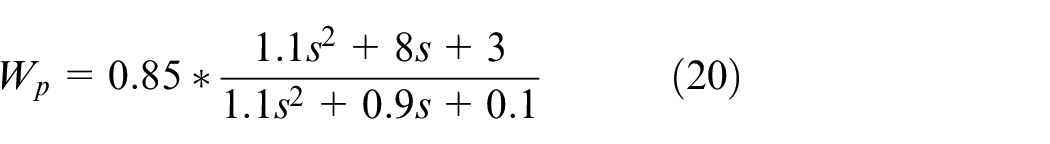
Because the saturation value of the input control voltage of the electro-hydraulic servo amplifier is ±10 (V), so the input weighting function wu = 0.1 is taken. When the low-pass transfer function is selected, the weighting function for system performance evaluation is shown below:
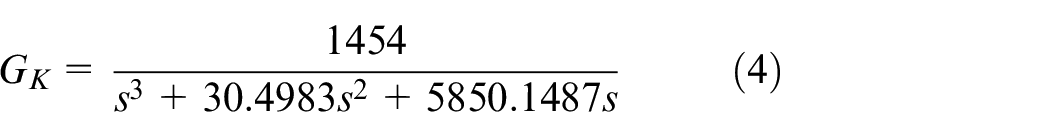
Therefore, the nominal model of the continuous rotary motor can be obtained, the expression is as follows:
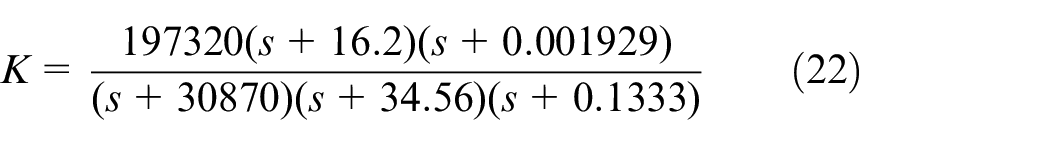
The open-loop system of the continuous rotary motor shown in Figure 6, the “hinfsyn” command in MATLAB is used to solve the known open-loop control system. The H∞ robust controller of system is as follows.
The generalized open-loop system for continuous rotary motor.
In addition, it is necessary to test and verify whether the design of robust controller meets the robust performance requirements of the system, the robust controller K, the system nominal model Gmds, the weight function Wp, Wu must meet the following conditions:
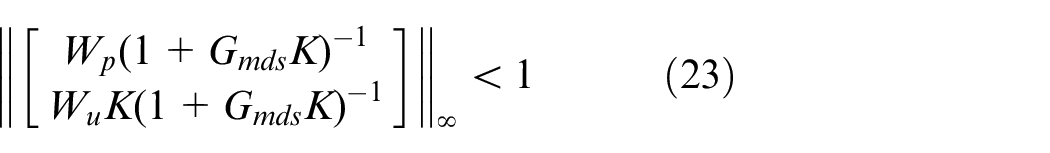
where,
In order to verify the inhibition ability of the robust controller on the input end of the system, the continuous rotary motor electro-hydraulic servo system can meet the performance requirements. The response characteristics of the system under step interference are compared, as shown in Figure 7 shown, the response curve of simulation parameter perturbation is
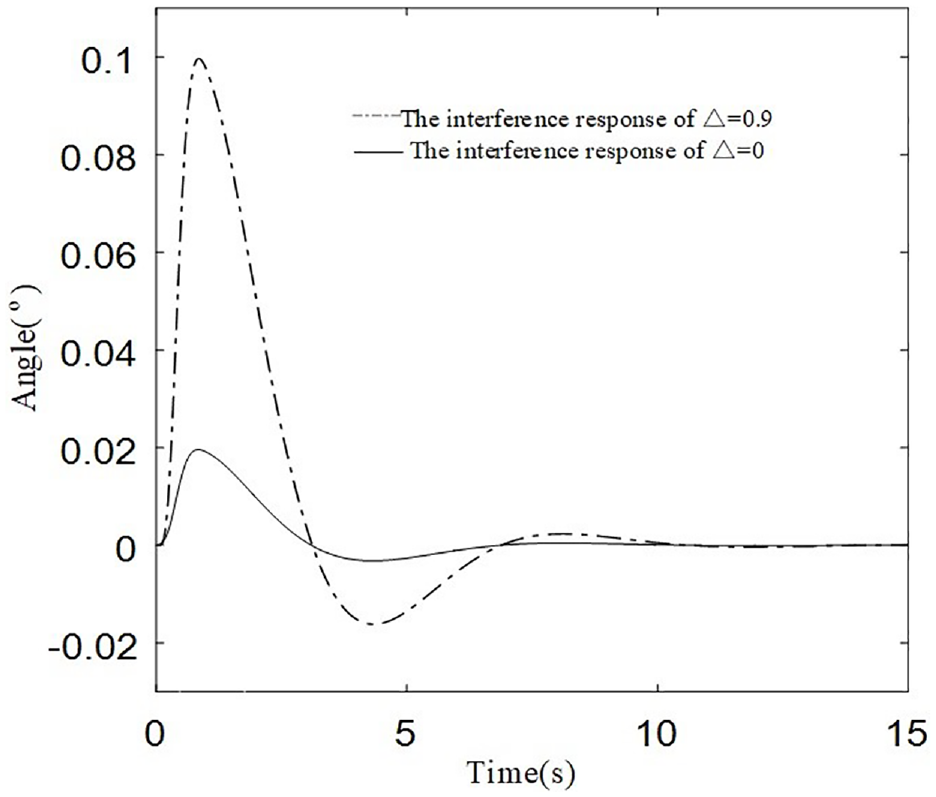
The step disturbance response of system.
The design of adaptive learner based on RBF neural network
In Figure 8, r is reference input signal for the system and θ is output angle value of the continuous rotary motor. The RBF neural network regression model is used as the learner model of the Adaboost algorithm. The RBF network with structure of 2-4-1 is selected in this paper, the implicit layer activation function is a Gaussian transfer function, and the maximum learning times of the training algorithm is set as 1000 times, the learning rate is 0.1, the cut-off condition of this algorithm is that the mean variance is not greater than 0.001. The algorithm steps are as follows:
Step 1: Combined with the control block diagram of the system as the Figure 8, the output of system is regarded as a time series, then the training set is established, and outputs and inputs date of the system at the past 10 couples are selected to obtain a training set,
Step 2: The sample set in step 1 is randomly divided into five sub training sets, each of which has five data pairs, the weight of five samples is initialized
Step 3: Under the initial weight distribution of training samples, the sample training the first network neti was randomly selected, that is, the weak learner, where, t is the trained network of the tth times.
Step 4: In Step 3, the mean square error of the weak learner neti in each sample is calculated mset(i) = ys − yi, in which i is the mean square error of the ith sample, ys is the learning output of weak learner neti, the sum of the product of the mean square error of each sample and the sample weight are calculated, that is,
Step 5: The samples’ weights can be updated, and
Step 6: Return to Step 3, loop iteratively, until the end after five times.
Step 7: Finally, the weak learners obtained by training are combined into a strong predictor. That is,
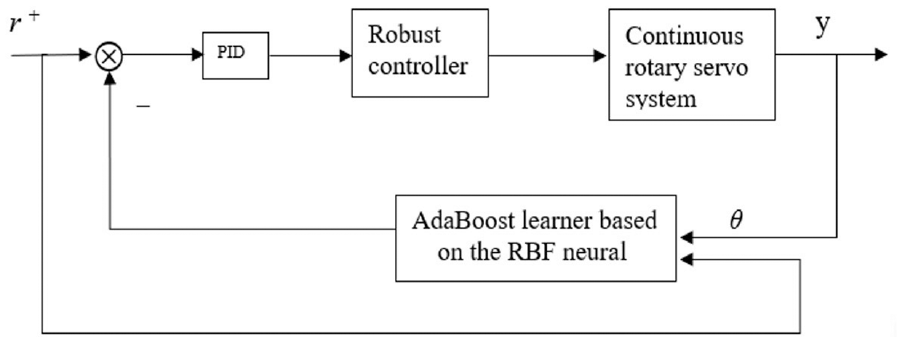
The block diagram of control structure.
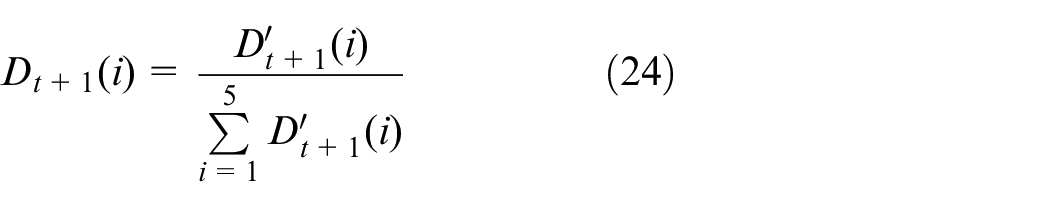
The weight of each sample need to be normalized, after the normalization of the sample, Di+1(i) is the sample weight value of the next round, the calculation formula is as follows:
The simulation research
According to Figure 8, combining the robust controller and the RBF neural network predictor based on the AdaBoost algorithm, a robust controller based on Adaboost prediction is designed. It is verified by simulation that the controller can effectively realize the precise control of the electro-hydraulic servo system.
The simulation analysis of slope response
In order to study the low-speed following performance of the system, a slope signal with an input signal of 0.001°/s was adopted to simulate and compare the control effects of the self-tuning wavelet neural network controller and the robust controller based on AdaBoost prediction. Then, the slope response characteristic curve of the electro-hydraulic servo system was shown in Figure 9. Among them, the large image is an overall contrast effect diagram and a small image is a partial enlarged image. The curve 1 shows the upper error band and the curve 2 shows the lower error band, the error range is ±0.0005°. The solid line represents a slope signal with an input signal of 0.001°/s, the dot line represents the output response curve under the control of the self-tuning wavelet neural network, and the dashed line represents the output response curve based on the AdaBoost predictive robust controller.
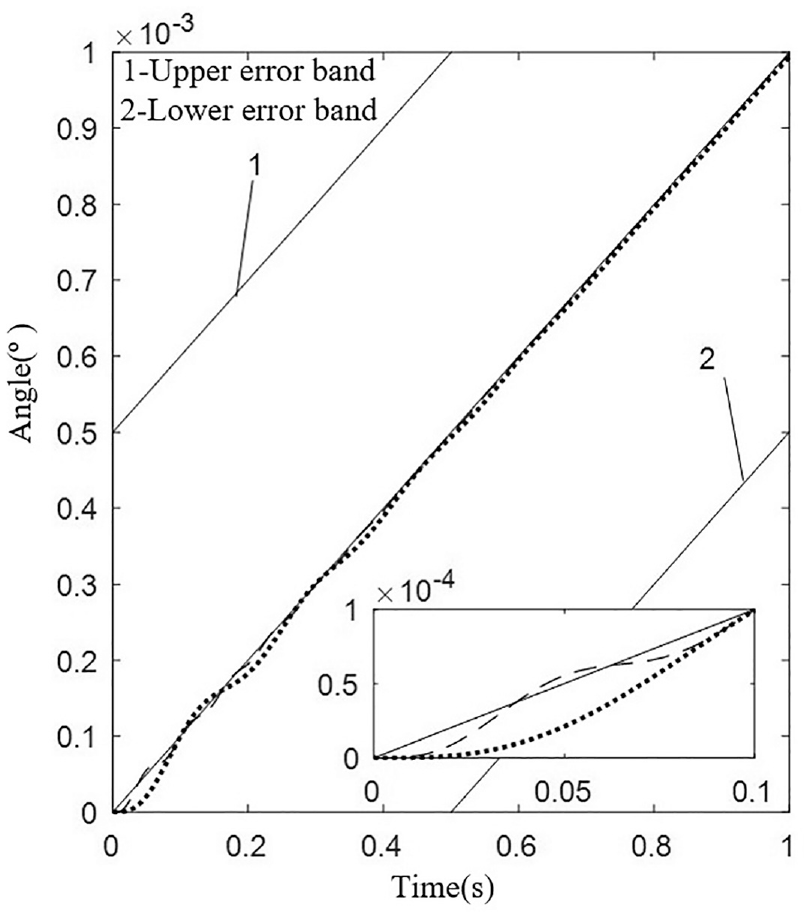
The response curve of 0.001°/s slope signal.
From Figure 9, under the action of self-tuning wavelet neural control, the continuous rotary electro-hydraulic servo motor has a long time to approach the steady state of the system and a large error fluctuation. The robust system based on the AdaBoost prediction has high tracking accuracy and eliminates the steady state errors well, the comparison shows that the robust controller has good ultra-low speed control performance for the continuous rotary motor electro-hydraulic servo system.
The simulation research of sinusoidal response
Frequency domain analysis is another widely used method for analyzing the performance of linear time-invariant systems. It is the core of classical cybernetics. Compared with the time domain analysis method, the frequency domain analysis method is not as intuitive and clear as the time domain analysis method, but it makes up for the deficiencies of the time domain analysis method. The frequency characteristic of the control system reflects the response performance of the system to the sinusoidal input signal. Frequency domain analysis is a graphic analysis method, which analyzes the system performance (such as stability, rapidity, and accuracy) according to the system rate characteristics. The outstanding advantage of the frequency domain analysis method is that the quality of the system can be analyzed by directly obtaining the frequency characteristics through experiments. The qualitative and quantitative conclusions can be obtained by using the frequency characteristics analysis system, and it has obvious physical meaning.
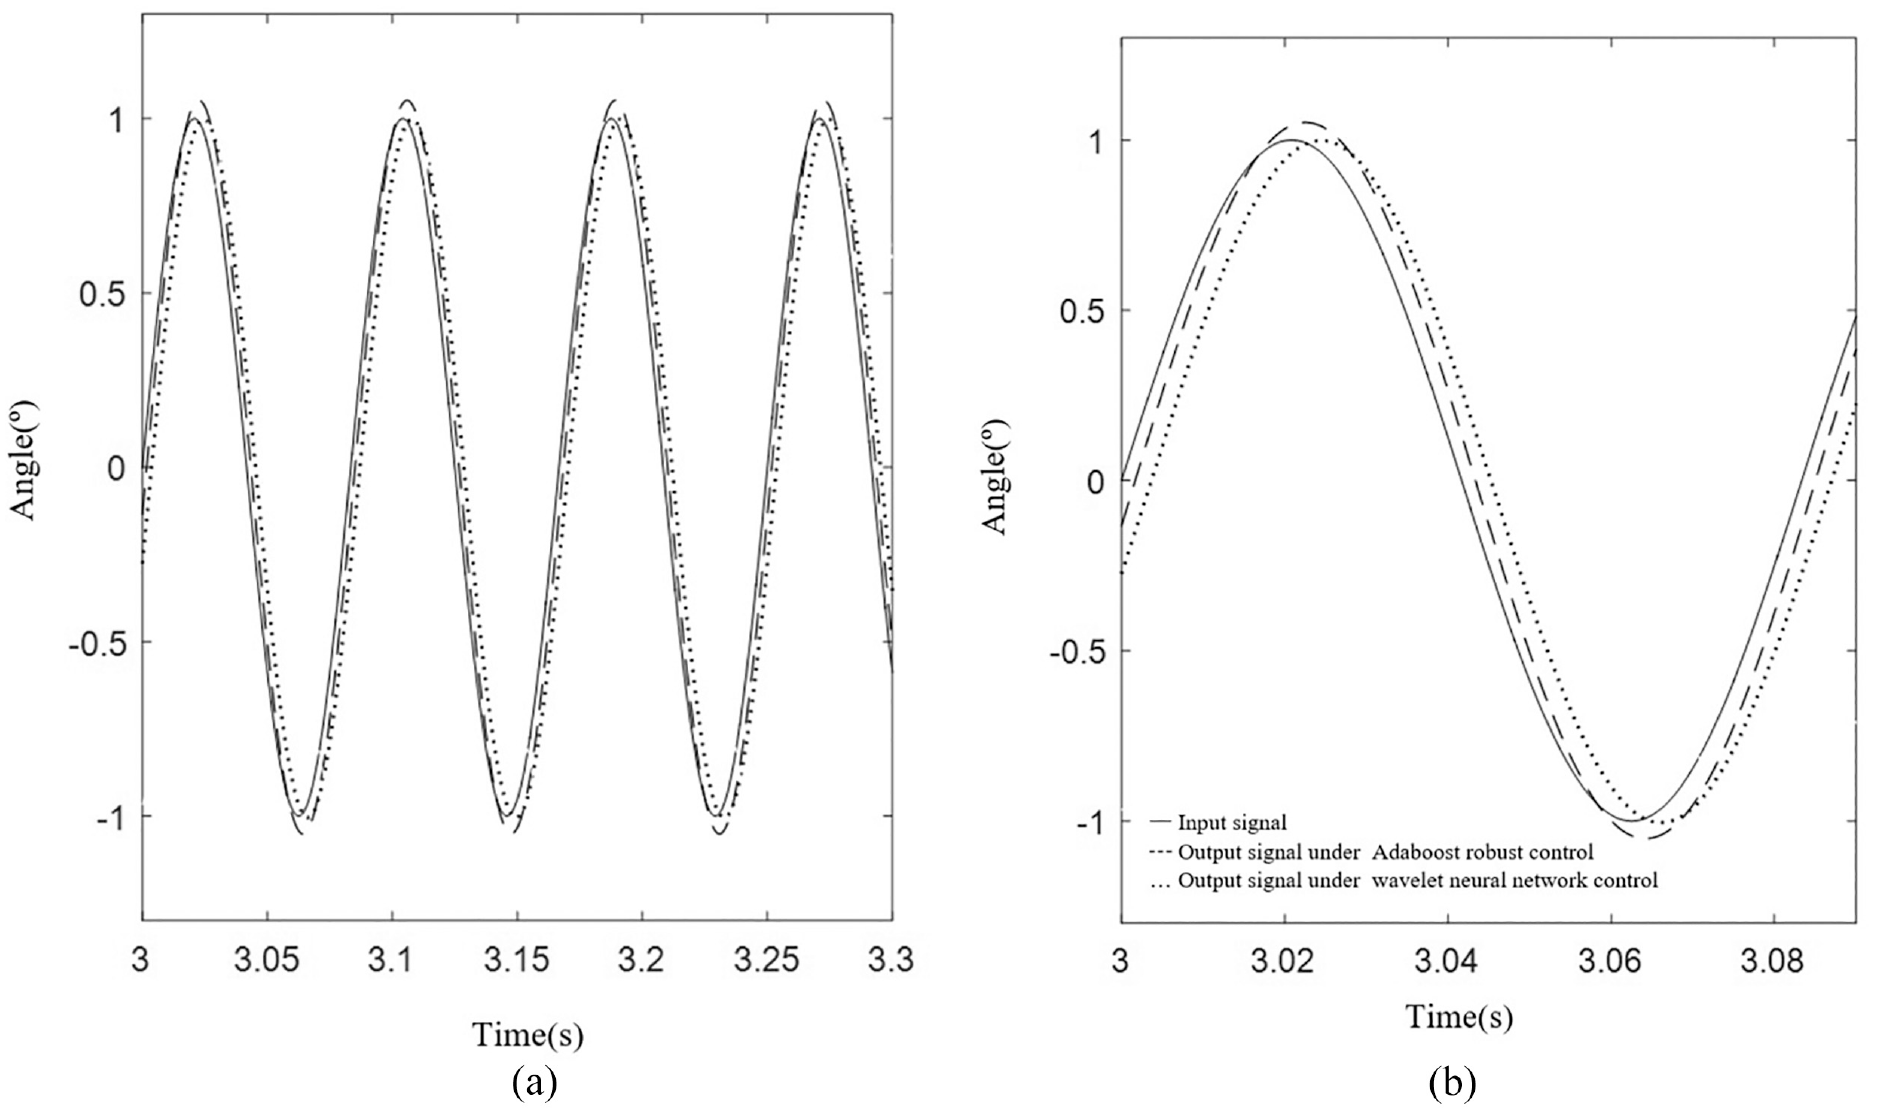
The following figure shows the sine response characteristic curve under the robust control based on AdaBoost prediction and the self-tuning wavelet neural network control. Figures 10 to 14 show the amplitude is 1 and the frequency response of the sinusoidal input signals of different frequencies. Among them, Figure (a) is the overall response curve, and Figure (b) is the local magnification diagram. The solid lines represent sinusoidal input signals of different frequencies, the dotted line represents the output response curve under the control of the wavelet neural network, the dashed line represents the output response curve under AdaBoost predictive robust control.
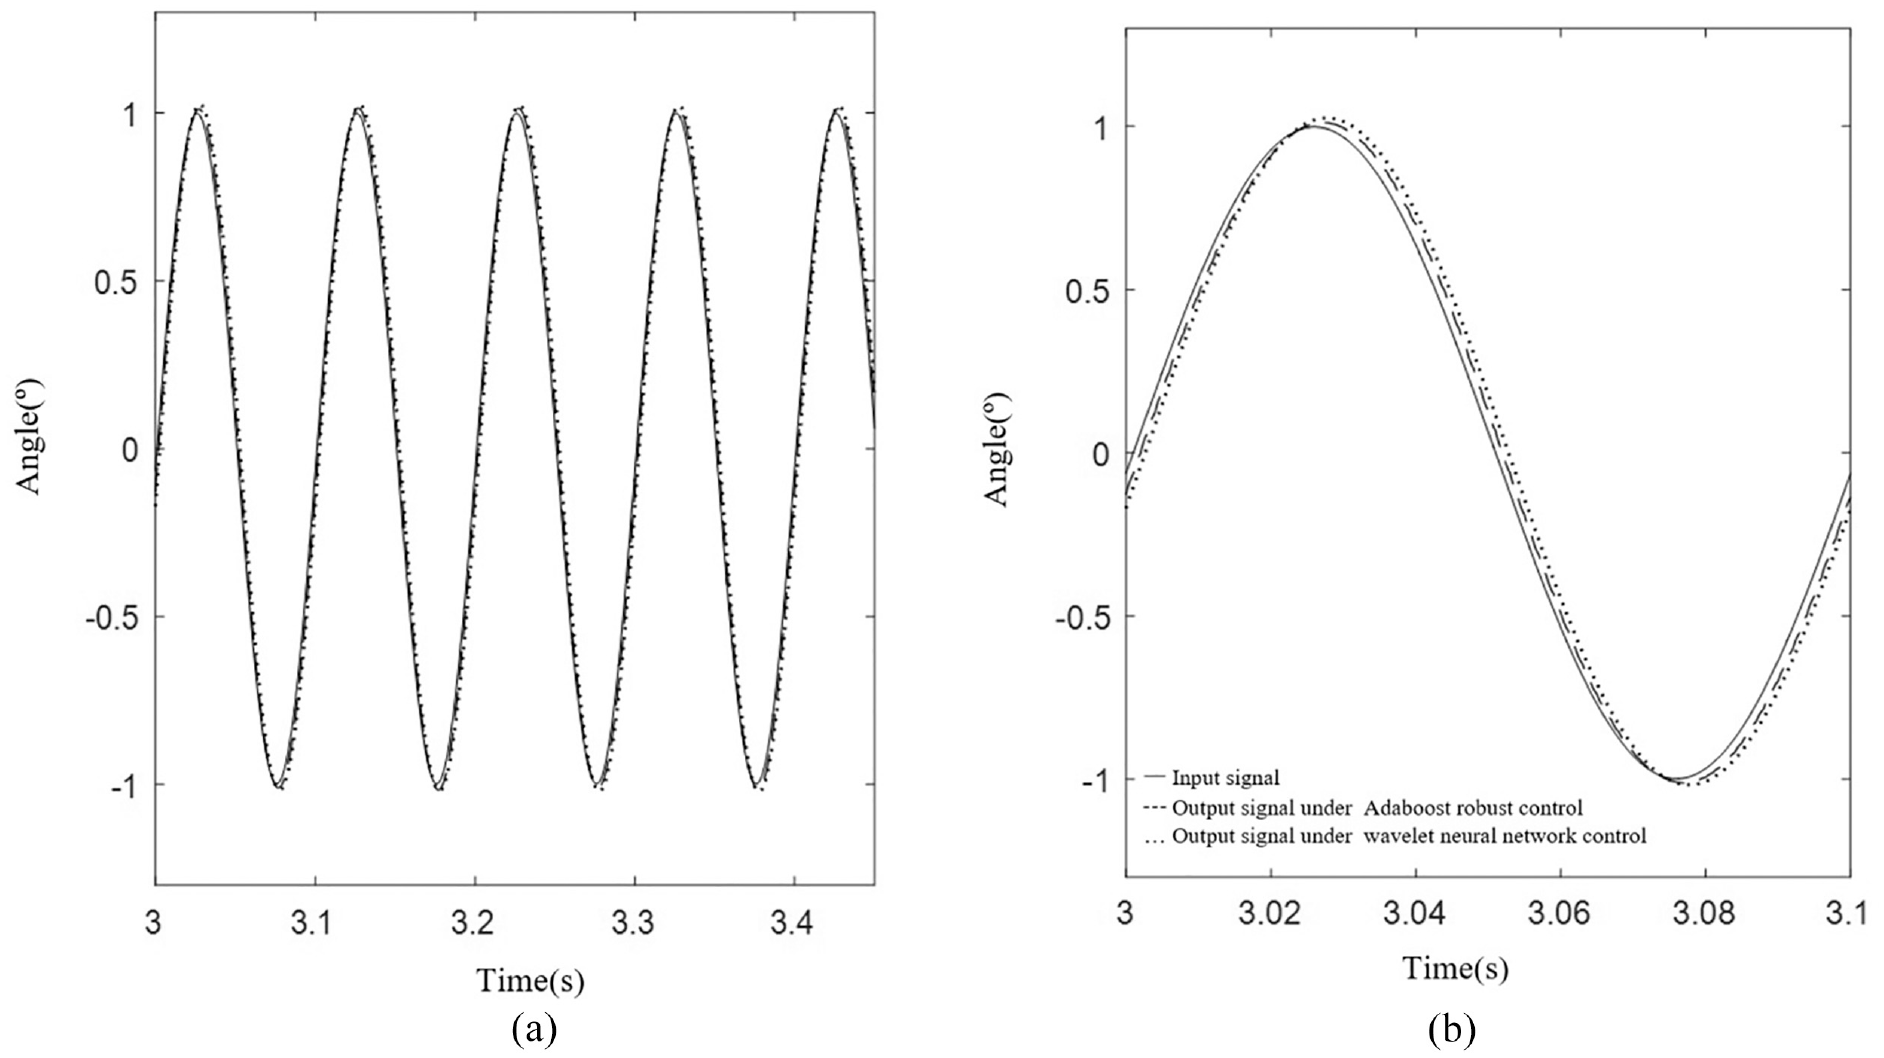
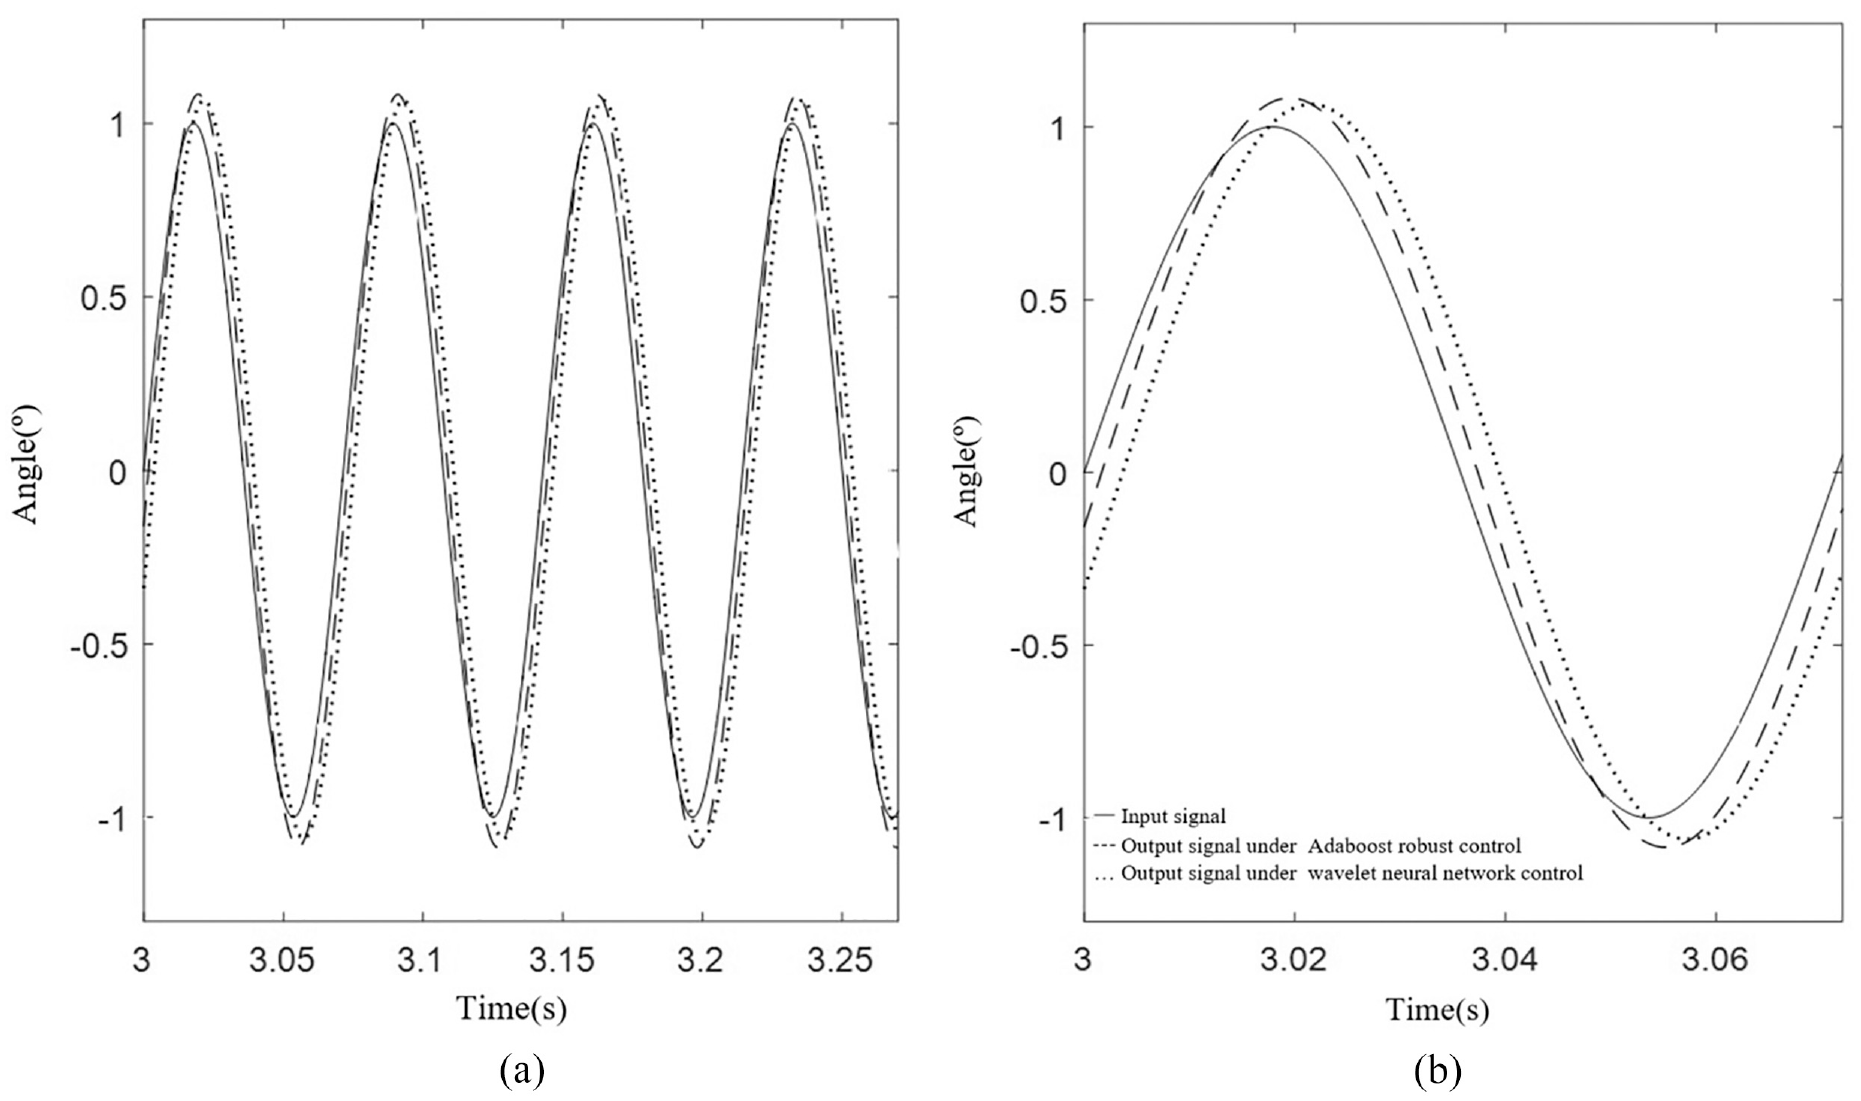
The sinusoidal response curve of 10 Hz, 1°: (a) the sinusoidal response curve of 10 Hz, 1° and (b) the locally magnify response curve of 10 Hz, 1°.
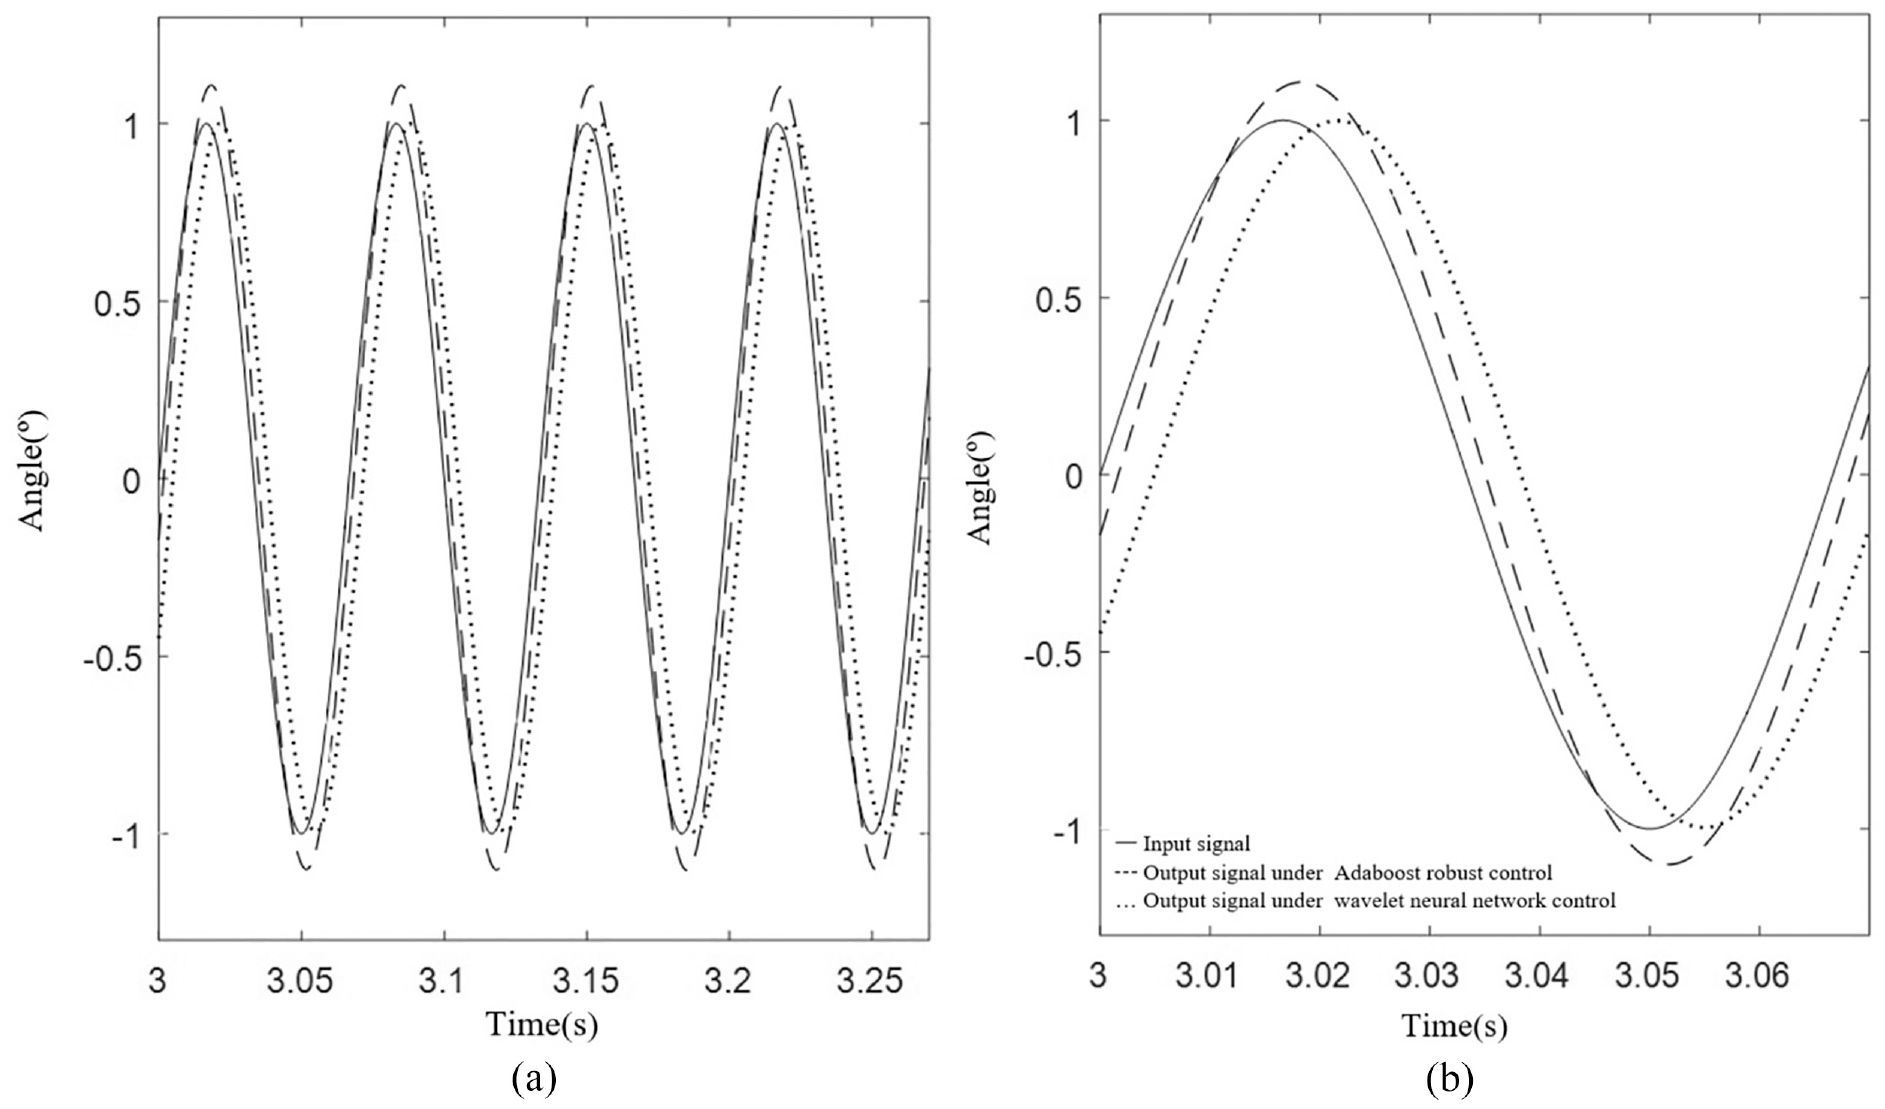
The sinusoidal response curve of 12 Hz, 1°: (a) the sinusoidal response curve of 12 Hz, 1° and (b) the locally magnify response curve of 12 Hz, 1°.
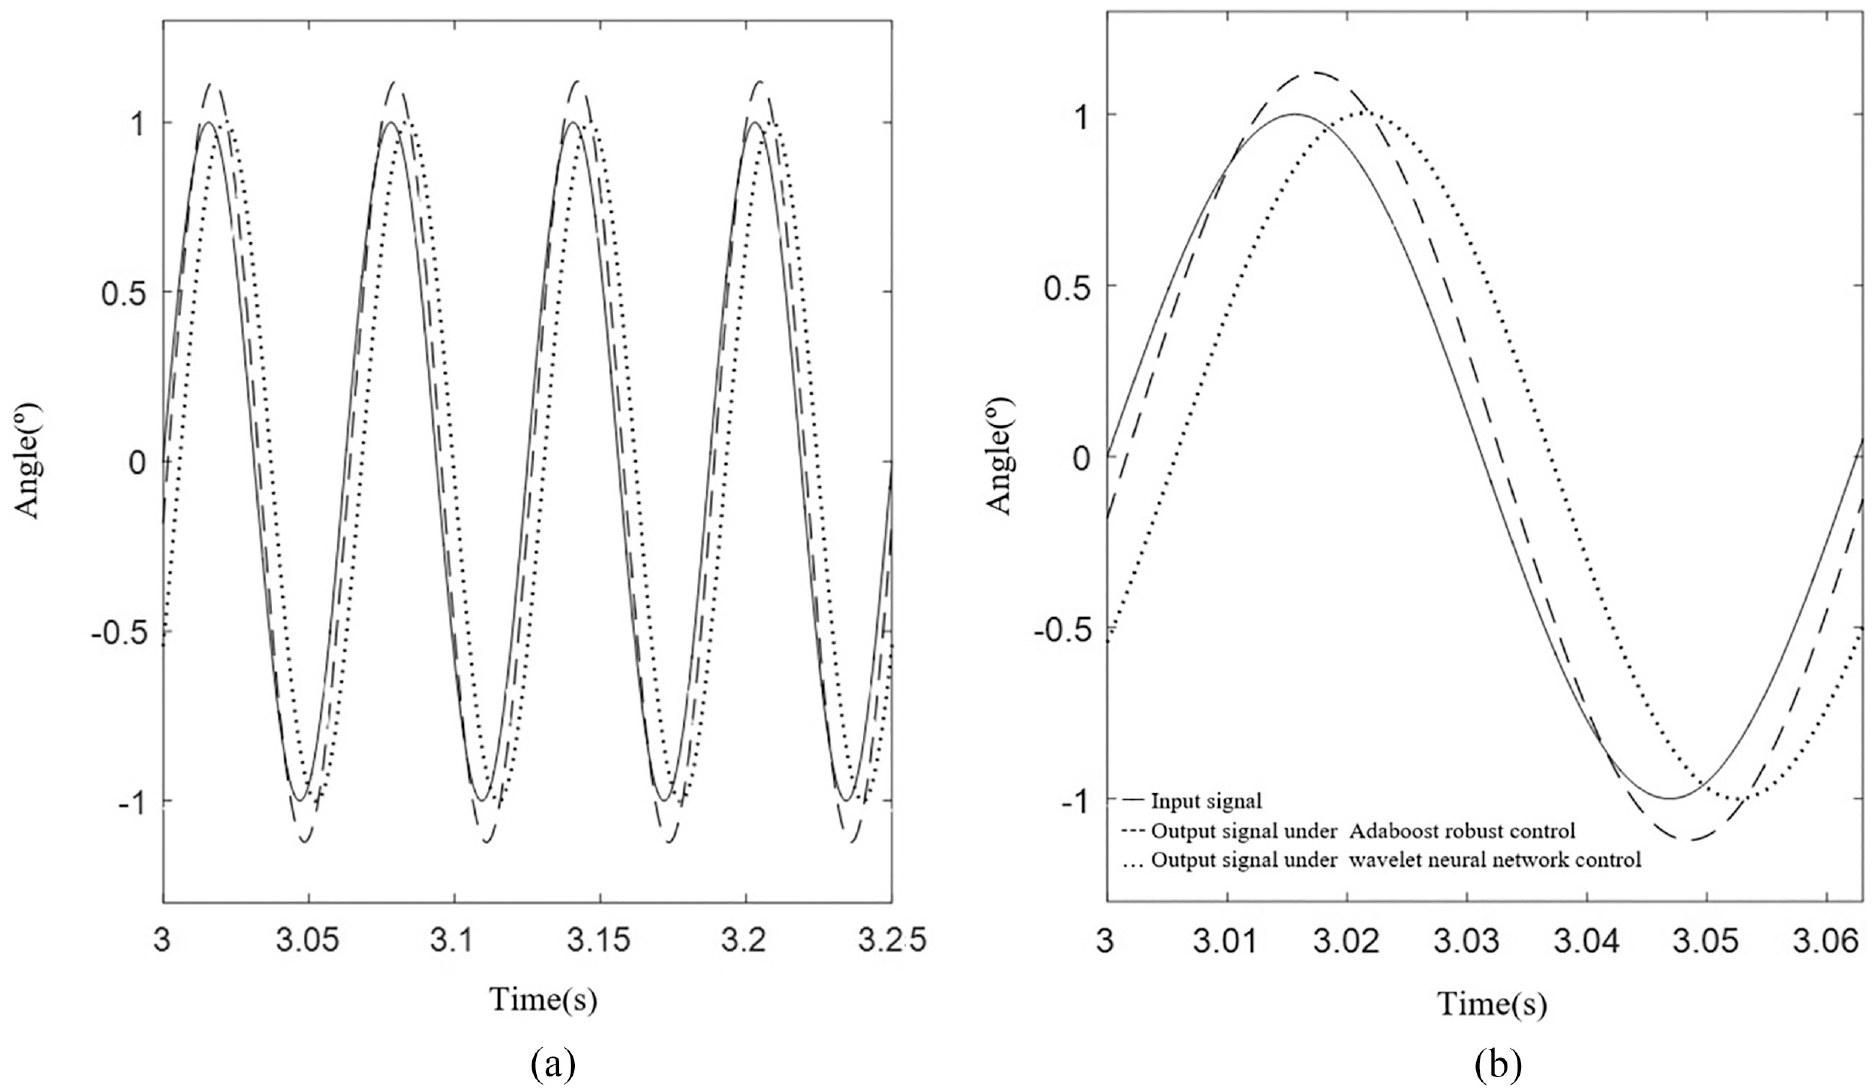
The sinusoidal response curve of 14 Hz, 1°: (a) the sinusoidal response curve of 14 Hz, 1° and (b) the locally magnify response curve of 14 Hz, 1°.
The sinusoidal response curve of 15 Hz, 1°: (a) the sinusoidal response curve of 15 Hz, 1° and (b) the locally magnify response curve of 15 Hz, 1°.
The sinusoidal response curve of 16 Hz, 1°: (a) the sinusoidal response curve of 16 Hz, 1° and (b) the locally magnify response curve of 16 Hz, 1°.
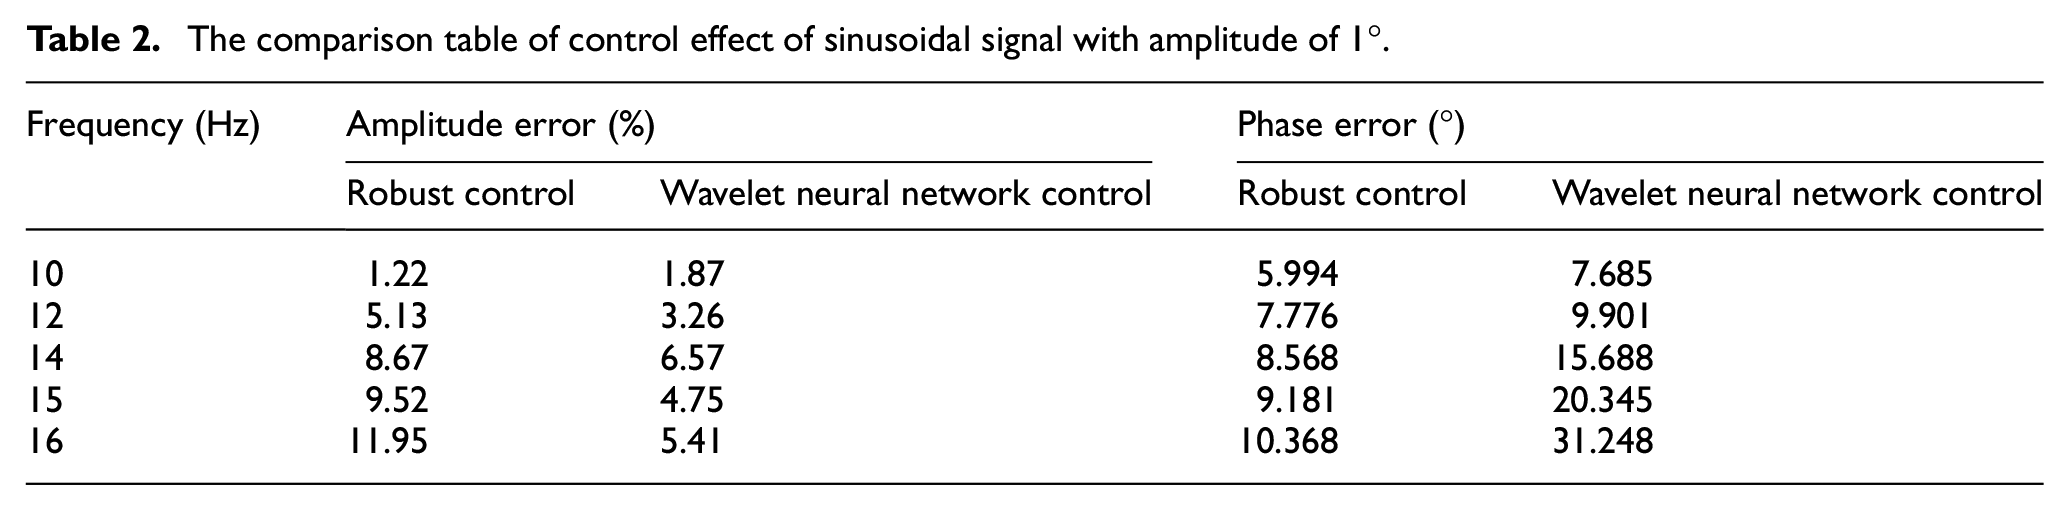
The specific quantitative indicators of the simulation results are shown in Table 2. It can be seen from the table that with the increase of the frequency of the sinusoidal input signal, the amplitude frequency characteristics and the phase frequency characteristics of the two controllers are variable, and the control effect of the wavelet neural network controller and the robust controller becomes worse and worse. Under the robust control based on Adaboost prediction, with the increase of the frequency of the sinusoidal signal, the amplitude error and phase error of the output characteristic curve are getting bigger and bigger, and the maximum sinusoidal response frequency satisfying the double 10th index can reach 15 (Hz), while the self-tuning wavelet neural network control can only make the maximum sinusoidal response frequency of the system reach 12 (Hz). Analyzing the control effect, the wavelet neural network controller has a smaller error value in amplitude error, the control effect is far less than the robust control in the phase error.
The comparison table of control effect of sinusoidal signal with amplitude of 1°.
All in all, the robust controller based on AdaBoost prediction has a better control effect on the follow-up of sinusoidal signals. The comparison simulation shows that the controller effectively improves the low-speed stability and tracking accuracy of the continuous rotary motor electro-hydraulic servo system, greatly expands the frequency response of the system, and realizes the precise control of the servo system, and have high robustness and anti-interference ability.
Experimental research
The introduction of experimental platform
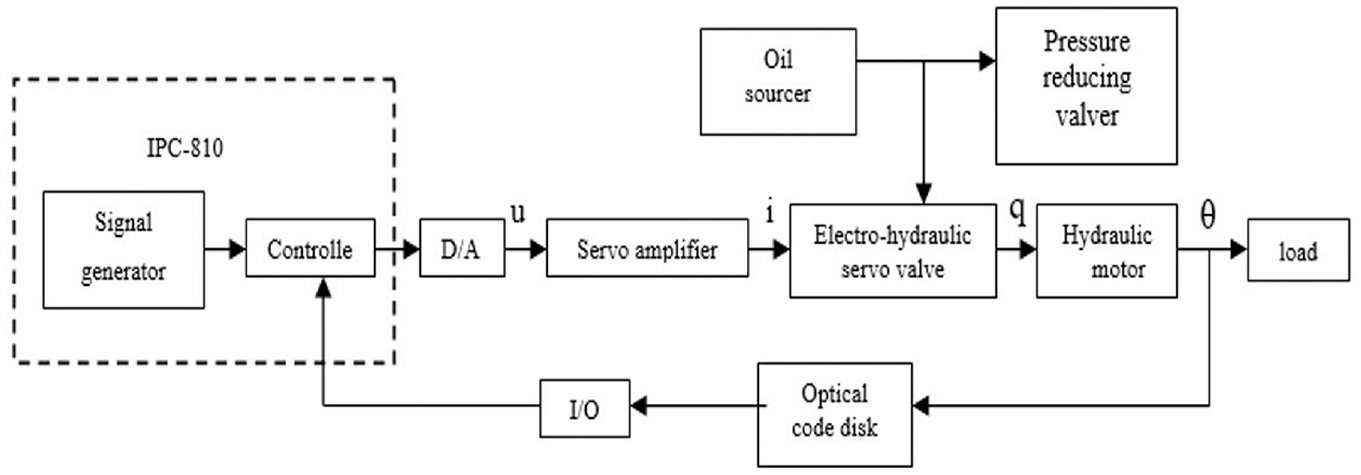
In order to realize the precise control of the continuous rotary motor and improve the response frequency of the system, the laboratory built a continuous rotary electro-hydraulic servo motor experiment platform, and used C++ Builder to design the interactive interface of the verification experiment. Experiments are performed on the designed predictive robust controller based on Adaboost, and the corresponding control algorithm program is written. Finally, the experimental results are compared with the simulation to illustrate the rationality and effectiveness of the predictive robust controller based on Adaboost. The continuous rotary electro-hydraulic servo motor test bench is shown in Figure 15.The composition principle of the continuous rotary electro-hydraulic servo motor experimental system is shown in Figure 16.
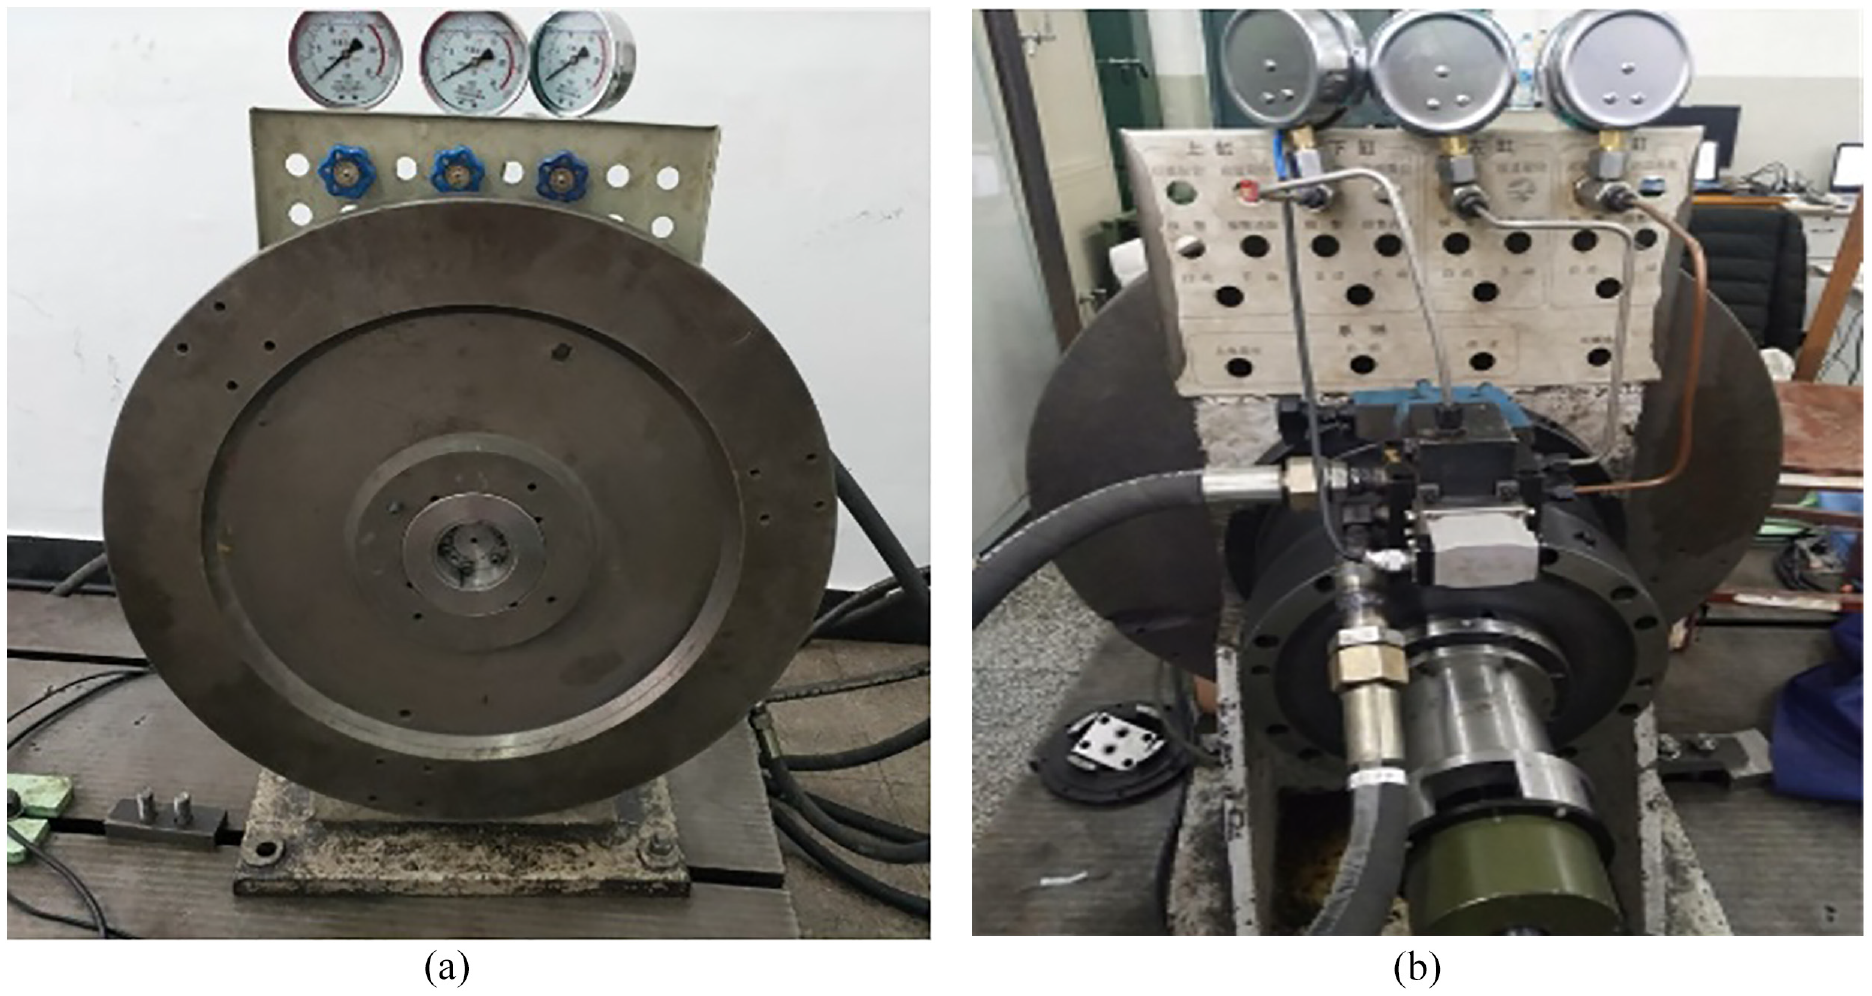
The continuous rotary electro-hydraulic servo motor test bench: (a) continuously rotating motor load plate and (b) electro-hydraulic servo valve and code plate.
The composition principle diagram of continuous rotary electro-hydraulic servo motor.
The introduction of system hardware
The hardware part of the motor test bench in the laboratory includes pumping station, pipelines, sensors, incremental encoders, terminal boards, etc. The computer control part mainly refers to the control program based on C++ Builder, etc. Figure 17 shows the schematic diagram of the hydraulic system used in the laboratory. Its working principle is as follows: after connecting the oil source pump station, turn on the oil supply switch and the oil flows into the hydraulic motor to drive the motor to run. The angular velocity of the motor rotation is measured by the photoelectric encoder of the feedback device, and the angular displacement of the motor rotation is converted into a digital quantity. It is fed back to the control system of the system to form a closed-loop feedback system, which is convenient for the system to monitor real-time output angle and feedback control.
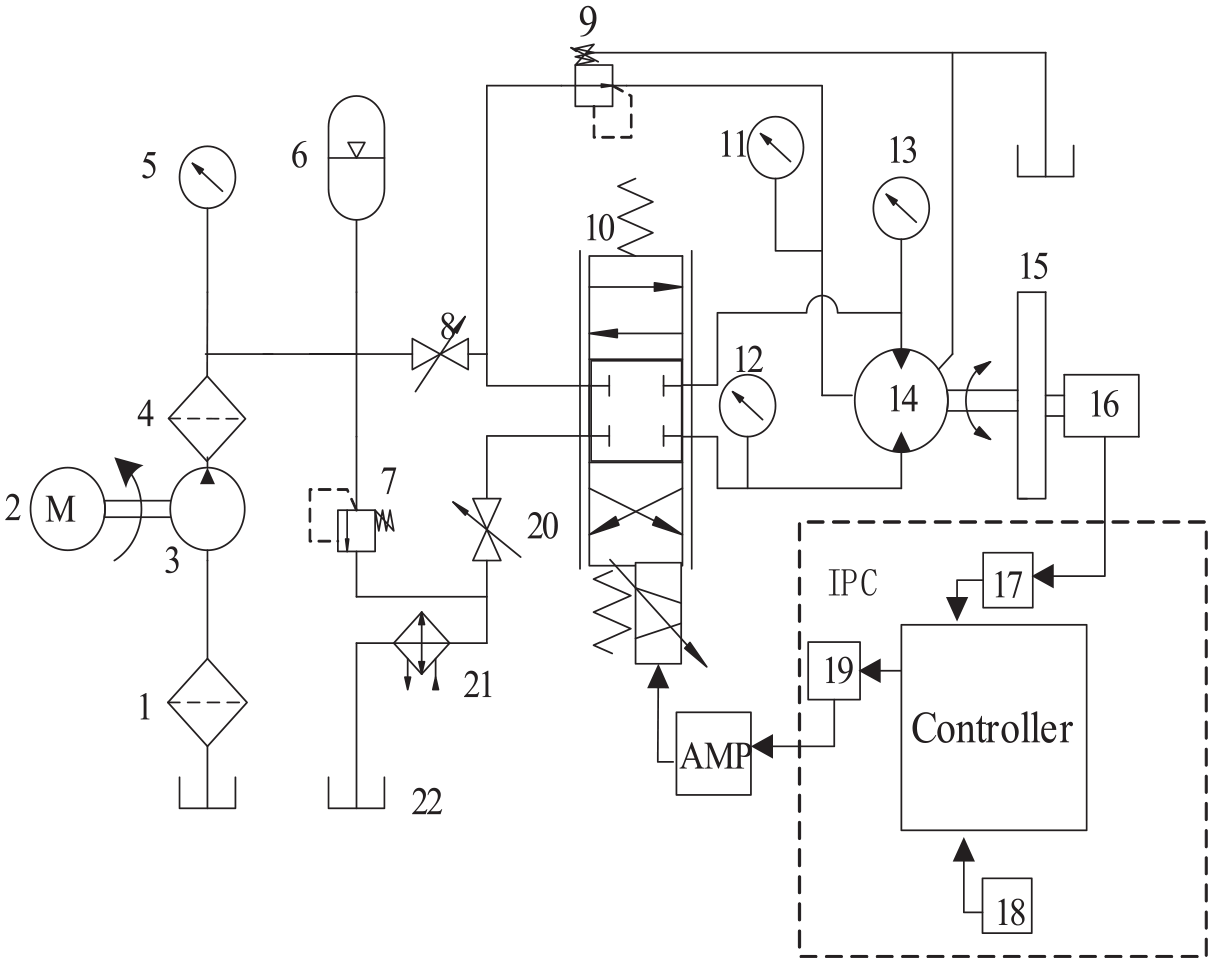
The schematic diagram of hydraulic system.
In addition, the common hardware of the Industrial PC of the test bench includes the following components:
Servo amplifier circuit. Since the electro-hydraulic servo valve has a zero offset, the hardware method is usually used for zero adjustment, including the vibration circuit and amplifying circuit, etc.
Electro-hydraulic servo valve. This article selects the electro-hydraulic servo valve model SFL-10. And the maximum output current of the servo amplifier connected to the servo valve should be controlled within 8 mA. When the industrial computer is started, if the input voltage saturation value in the circuit is 10 V, then the amplification factor of the servo amplifier should be 0.8 mA/V.
PCI-1716 data acquisition. In the experiment, the PCI-1716 multifunctional data acquisition card produced by Yanhua Company was selected, its function is to convert the output digital signal of the industrial computer into an analog signal, that is, the current signal is transmitted to the servo amplifier circuit. The performance parameters of PCI-1716 data acquisition card are as follows:
It has a high 16-bit resolution, and a sampling rate of 250 KS/s, and has the function of A/D conversion;
Each input channel gain of the acquisition card has a variety of input ranges;
There is a PCI data bus;
The single-ended input channel of the acquisition card has 16 channels, and the input channel of the differential analog quantity has 8 channels;
Single/bipolar input range;
The acquisition card has 2 AI ports, 16 DI/DO ports, and a FIFO buffer with excellent input and output. The sampling frequency of the buffer is 1 K;
It has a programmable logic timer or counter, with 16-bit counter channel;
There are three trigger forms, namely software, timing, and external trigger.
Photoelectric encoder: The encoder used in the experiment is a digital angular displacement sensor, which can convert the angular position signal of the motor shaft into digital storage, and has high resolution and noise suppression ability, as well as better low-speed performance, etc.
Hardware equipment of the control system: The control circuit of the industrial computer of the test bench includes: DC power supply, amplifier, terminal board, etc.
The introduction of system software
The continuous rotary electro-hydraulic servo motor test bench adopts the IPC-810 industrial computer as the controller of the experimental system, the programing software C++ Builder is selected to carry out algorithm programing, and it is run under Windows XP environment. The visual control operation interface provided by C++ Builder provides a good operation platform for users. They can access the computer kernel through the software program supported by the background, so as to achieve the required functions. In this confirmatory experiment, the algorithm program of the robust controller was designed, and the experiment was verified based on the sinusoidal input signal. Figure 18 control program flow chart to further explain the programing steps.
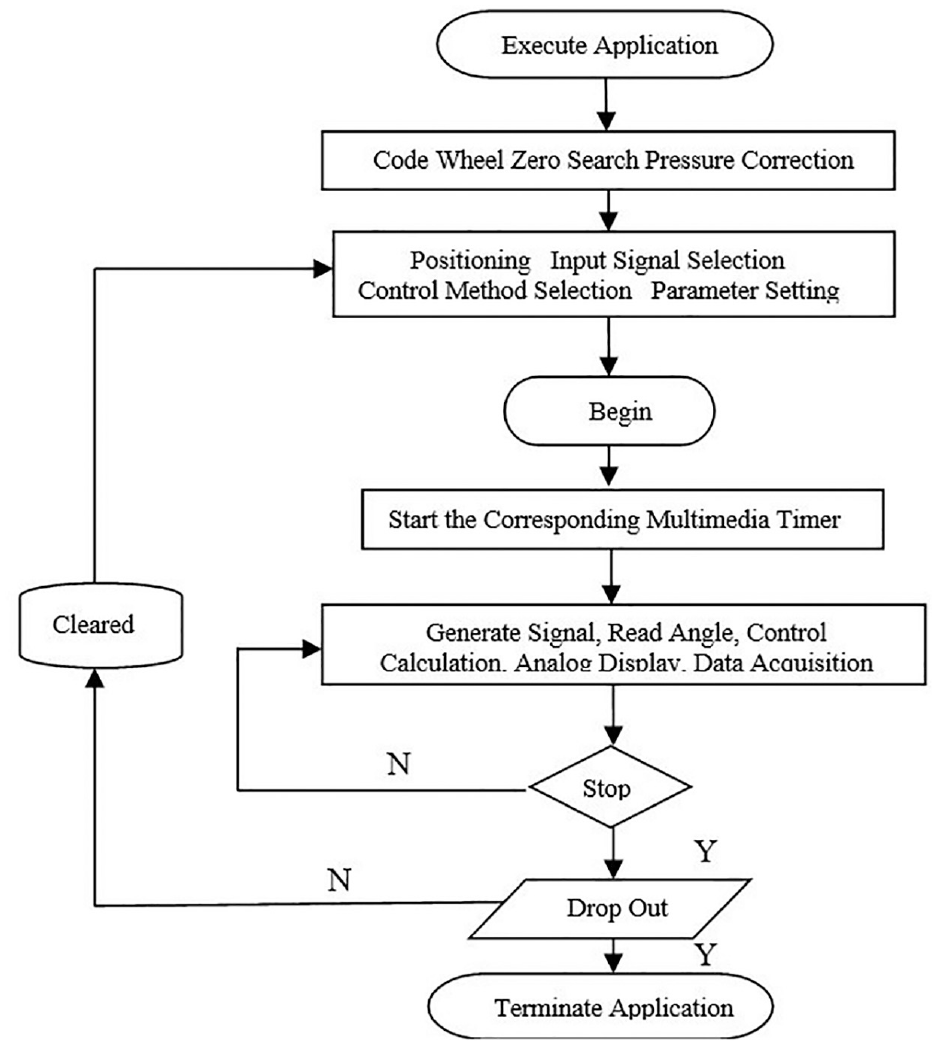
The flow diagram of control program.
The experimental verification of sinusoidal response
In order to verify the feasibility and availability of the proposed robust controller based on the Adaboost prediction algorithm, the experimental verification of the controller was carried out for the sinusoidal response signal. Sinusoidal responses with sinusoidal frequencies of 8, 10, and 12 Hz were selected for the experiment. The results are shown in Figures 19 to 21, the sinusoidal input signal of the system is represented by the curve 1, the experimental verification output is represented by the curve 2.
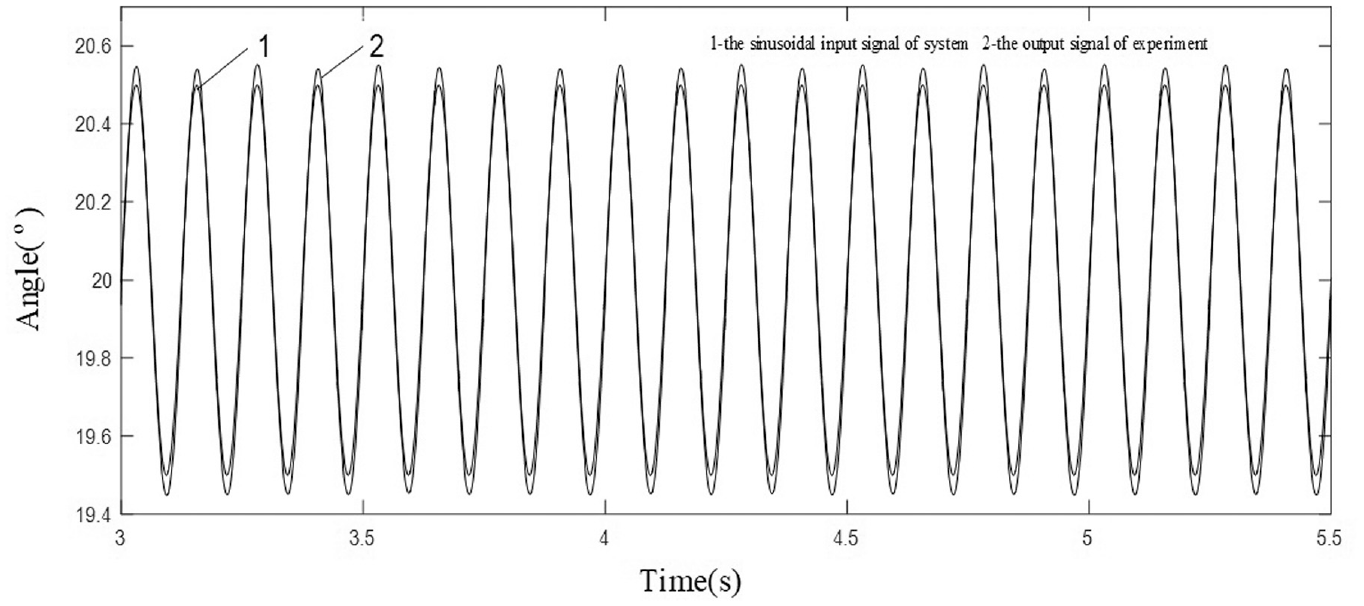
Actual output curve and model simulation output curve of motor at 8 Hz and 1°.
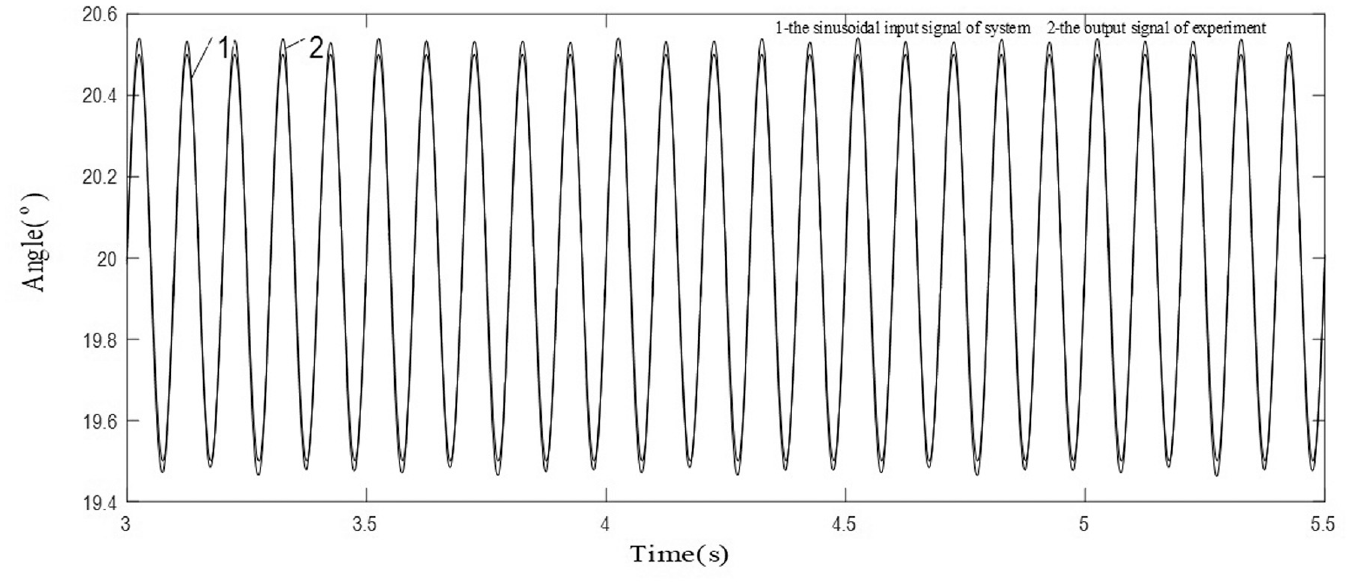
Actual output curve and model simulation output curve of motor at 10 Hz and 1°.
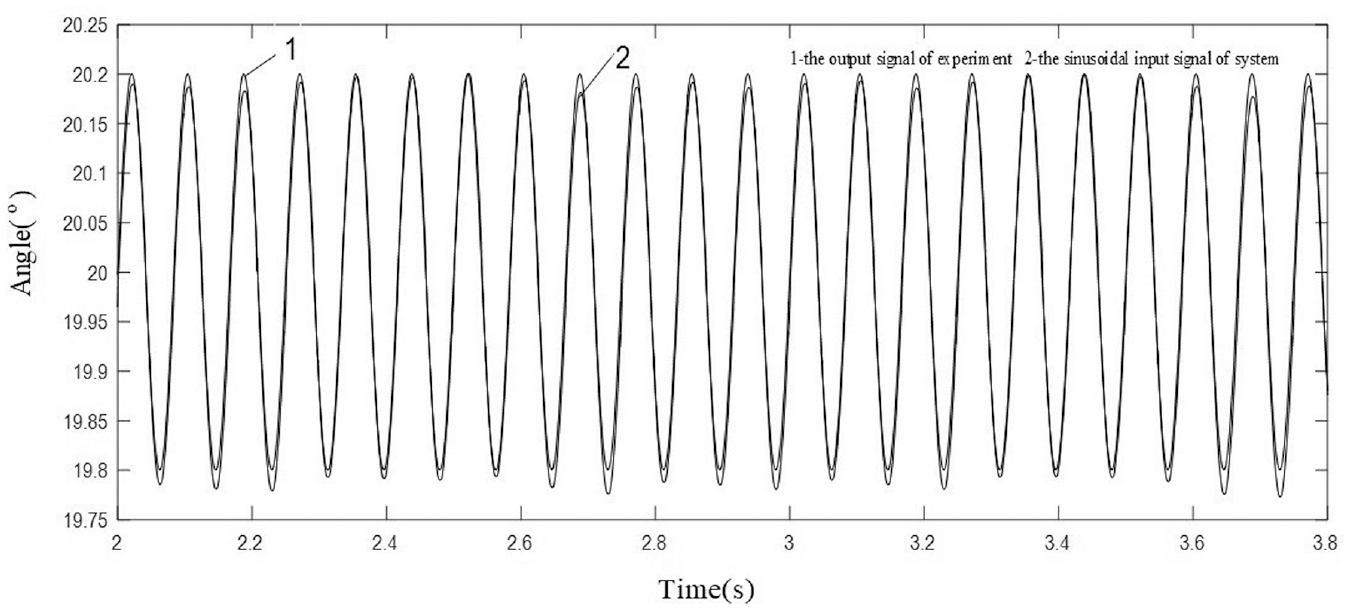
Actual output curve and model simulation output curve of motor at 12 Hz and 1°.
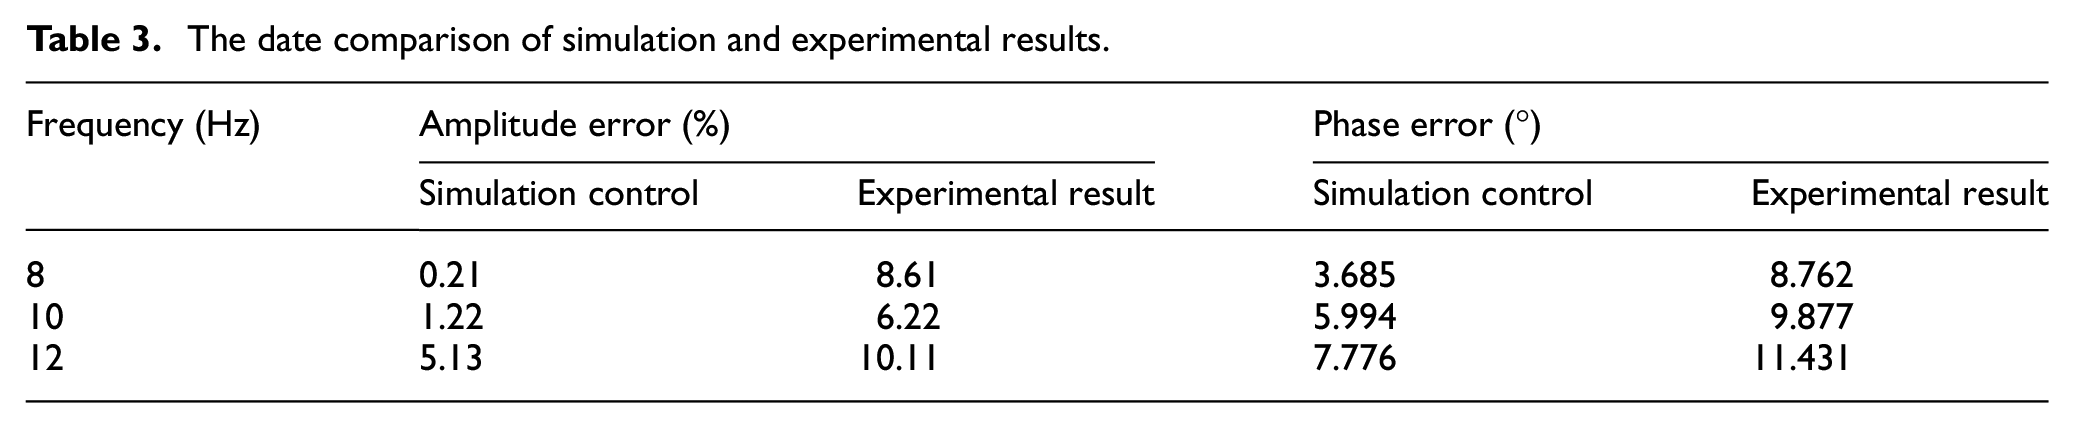
Due to the zero-skew pressure and the oil source pulse at the start time of the system, the error value of the response curve is studied and evaluated when the system is stable. The experimental results are slightly different from the simulation results by comparing simulation results with experimental output data. The maximum response frequency of the system simulation is 15 (Hz), and can meet the requirements of double 10 index, but the experiment is 12 (Hz), the phase lag and amplitude error have exceeded the standard range.
After sorting out the experimental results, the comparison table of the experimental output data and simulation results is shown in Table 3. It can be seen from the table that the robust controller based on the AdaBoost prediction algorithm has deviation in the experiment and the simulation. By analysis, it is concluded that the reason for the deviation is that the internal seal failure of the continuous rotary motor causes a large amount of leakage in the system and leads to poor tracking performance of the system. Therefore, the experimental results show that the control performance of the robust controller designed in this paper is relatively stable in the electro-hydraulic servo system. The response frequency can reach the system’s natural frequency range.
The date comparison of simulation and experimental results.
Conclusions
A robust controller based on Adaboost prediction is designed for the uncertainties of the system, such as parameter perturbation and external disturbance. Simulation and experiment results show that the controller has good tracking performance to the slope signal with an input signal of 0.001°/s and has a high response speed to sinusoidal signal. Under the condition of satisfying the requirement of double 10 index (The amplitude error is within 10%, and the phase error is within 10°),42–44 the maximum response frequency reaches 15 Hz, which effectively widens the frequency band of the system. Compared with the wavelet neural network control, the robust controller effectively reduces the influence of parameter disturbance, external disturbance and other uncertain factors on the system performance, which greatly improves the frequency response and low speed performance of the electro-hydraulic servo motor, and the system has better robustness.
Footnotes
Declaration of conflicting interests
The author(s) declared no potential conflicts of interest with respect to the research, authorship, and/or publication of this article.
Funding
The author(s) disclosed receipt of the following financial support for the research, authorship, and/or publication of this article: This project was supported by National Natural Science Foundation of China (Grant No. 51975164) and Outstanding youth of pyramid talent training project of Beijing University of Civil Engineering and Architecture(No: JDJQ20220806).