
Abstract
The study proposes a way of developing granular models based on optimized subsets of data with different sampling sizes, in which three generally used models, namely Support Vector Machine, K-Nearest Neighbor, and Long Short-Term Memory, are designed and transformed into granular version for achieving a good performance with sufficient functionality. First, a collection of subsets are determined using different sampling methods, which are subsequently applied to play as an essential prerequisite of the proposed models. Then, the principle of justifiable granularity is utilized to the design of interval information granules based on the subsets of data. The design process is associated with a well-defined optimization problem realized by achieving a sound compromise between two conflicting criteria: coverage and specificity. To evaluate the performance of the granular models, two aspects are considered: (i) sampling methods used in determining suitable subsets of data; (ii) different models applied to be transformed into granular models. A series of experimental studies are conducted to verify the feasibility of the proposed granular models.
Introduction
When dealing with large amounts of data, it is necessary to pay attention to its accuracy and interpretability to improve the performance of system modeling. Granular computing1,2 is one of the emerging information processing tools in computational intelligence. It is capable to solve complex problems by simulating human’s thinking behavior and opens a new and attractive direction for system modeling. Granular computing includes a series of concepts, methodology, algorithms, and applications for reasoning and computation realized on a basis of information granules, which are genuine generalizations of numeric data (experimental evidence). 3 To be more specific, granular data modeling is commonly realized based on information granules rather than numeric data, and the outputs of granular models are also expressed in forms of information granules. Information granules provide more effective solutions to express data by considering both the completeness and accuracy, by which data analysis can be formalized at a higher level of abstraction. As a collection of elements carefully designed according to their characteristics and similarity, information granules can well reveal the inherent topological structure of the data and be used for the realization of system modeling.
To improve the efficiency of granular modeling, it is considered to use a subset of data to represent the characteristics of the entire dataset. Through sampling, we can effectively reduce the computational complexity and increase the processing speed. The challenge brought by data computation means that data sampling is indispensable, and it is critical to determine which sampling methods to choose. 4 Due to the overall characteristics represented by the subsets of data, the performance of data analysis can be ensured.
It is well recognized that data modeling and processing are playing a significant role in traditional computational intelligence. However, a commonly encountered situation is that most of the data modeling is developed based on numeric data. It is of great interesting and challenging to implement the designing process in the framework of granular computing. In the era of big data analysis, it is not a good idea to deal with individual samples, and the understanding and cognition of the main characteristic of the entire data set is far more important than each individual sample. It is worth noting that granular computing plays as a fundamentally mechanism in data analysis and modeling. Numeric data often fails to meet the requirements of data completeness and accuracy when expressing uncertain information. Information granules provide more effective solutions to such uncertain problems. Information granule is a carefully designed and abstracted collection of elements based on the characteristic and similarity of the data. It can express the meaning of the data completely and accurately. In essence, granular computing solves complex problems by dividing complex problems into a series of sub-problems which are easier to manage.
The contribution of this paper is to develop a framework of granular data modeling and analysis based on a subset of data. There are several vital steps. First, different sampling methods are used to obtain a series of subsets of data. Second, based on these subsets of data, granular models with good performances can be obtained. A granular model constructed with a subset of data is anticipated to not only guarantee its functionality but also improve its efficiency. The significance of this study is to obtain an accurate and reliable granular model by which the computational complexity can be effectively reduced. In the development of granular models, a two-objective optimization problem is encountered: the coverage criterion is implemented by requiring that the available experimental evidence be included in the obtained information granules as many as possible, while the specificity implies an information granule should be as specific as possible. In this case, it is anticipated to achieve a sound compromise between the two conflicting criteria of coverage and specificity. In the designing process, information granules are constructed and formed as the core part in representing data, which demonstrate the constructed model with good interpretability. To be more specific, the outputs of the granular model can be presented by information granules, thus to compensate the loss of features in the sampling process.
The remainder of this paper is organized as follows. In Section II, we provide a brief review of the related works. Granular models are designed and evaluated in Section III. Experimental studies concerning a synthetic dataset and a collection of publicly available machine learning datasets are reported in Section IV. Conclusions and future research are offered in Section V.
Related works
Processing large-scale data sets consumes a large time consumption and brings huge challenges to system modeling. Therefore, data sampling is considered to effectively solve this problem. He et al. 5 use MapReduce to sample uncertain data, and propose a block-based sampling method for large data sets, assigning the entire data set to a distributed system. 6 It is well known that data sampling is a method of extracting a part of sample units that are sufficient representative of all samples to be studied. Through sampling, one can estimate and infer all samples’ characteristics from the analysis and research results of the sampled units. However, if the sample size is too small, wrong conclusions may be drawn. Singh and Masuku 7 discuss some traditional methods in detail for determining a suitable sample size. Albattah 8 studies the role of data sampling in big data analysis. He believes that even if we can process the entire dataset, there is no necessary to do in this way. When data sampling is conducted in machine learning, the most appropriate samples are that which can be used to obtain the best performance. It indicates that an increase of sample size will not benefit to improve the accuracy of data analysis. 9 It is convincing that sampling methods can help improve the efficiency of essential data analysis and become a necessary step for big data preprocessing in future research.
It is well known that data sampling can definitely reduce the computational complexity of data modeling, however, it will result in a loss of features to some extent. As a novel platform of representing and describing data, granular computing emerges to deal with complex problems.
The concept of granular computing was firstly proposed by Zadeh 10 in 1979. He believes that there are information granules in many knowledge fields, but the manifestation of knowledge is different in different fields. Lin 11 regard the information granule as a descriptive name to summarize available information in the form of granules. In subsequent research, 12 he introduces granular computing into data mining and machine learning. Currently, many researchers focus on applying granular computing to data mining. For example, Chen et al. 13 propose a new ML-KNN algorithm under the framework of granular computing, the results of which show that the model is superior to most traditional algorithms. In pattern classification based on granular computing, Panda and Tripathy 14 and Mehmood et al. 15 combine fuzzy logic, neural network, and Support Vector Machine to develop an efficient granular information processing paradigm. The concept of the granular neural network was firstly proposed in 2000, 16 and it is further formalized and discussed in Pedrycz and Vinovich. 17 In recent years, granular neural networks attract attentions of many researchers.16,18,19 The granular neural network is formed on the basis of a given (numeric) neural network, and it is implemented in a way that can be used to process information granules. In order to find patterns and rules in big data analysis, many methods are used in data mining, and data sampling plays an irreplaceable role. This paper proposes a granular model based on the obtained optimal subset. It can effectively reduce unnecessary processing time while ensuring the performance of granular models.
Design and evaluation of granular models
In this paper, we consider using representative subsets to improve the efficiency of system modeling while ensuring its sufficient performance.
Figure 1 presents a framework of the proposed granular model in this paper.
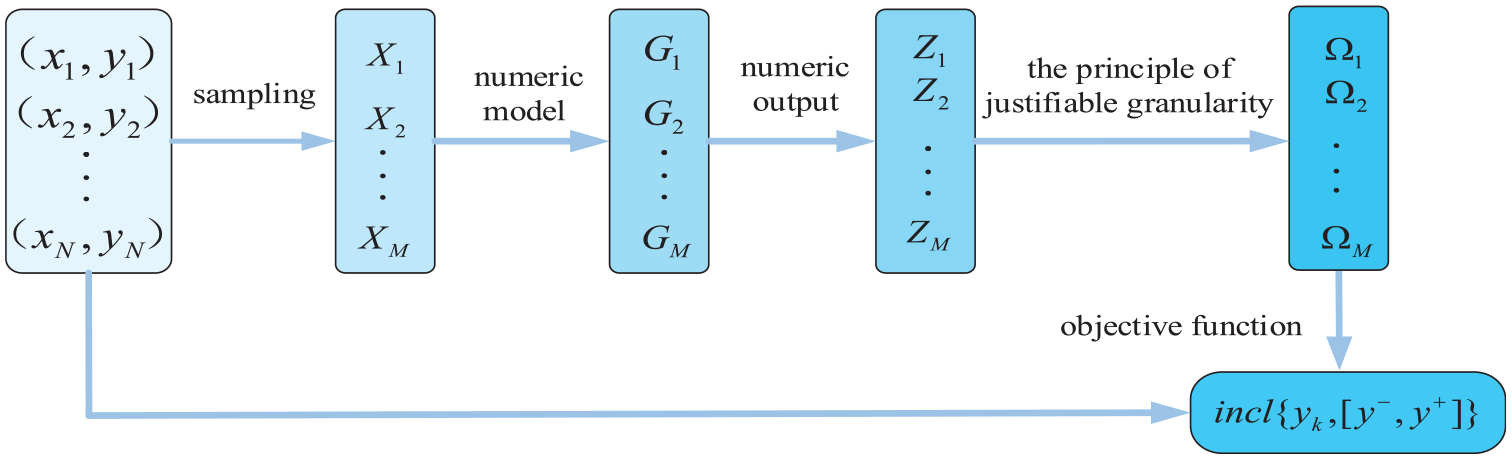
Development framework of a granular model.
Selection of data subsets
Given a dataset composed of n-dimensional input and single-dimensional output,
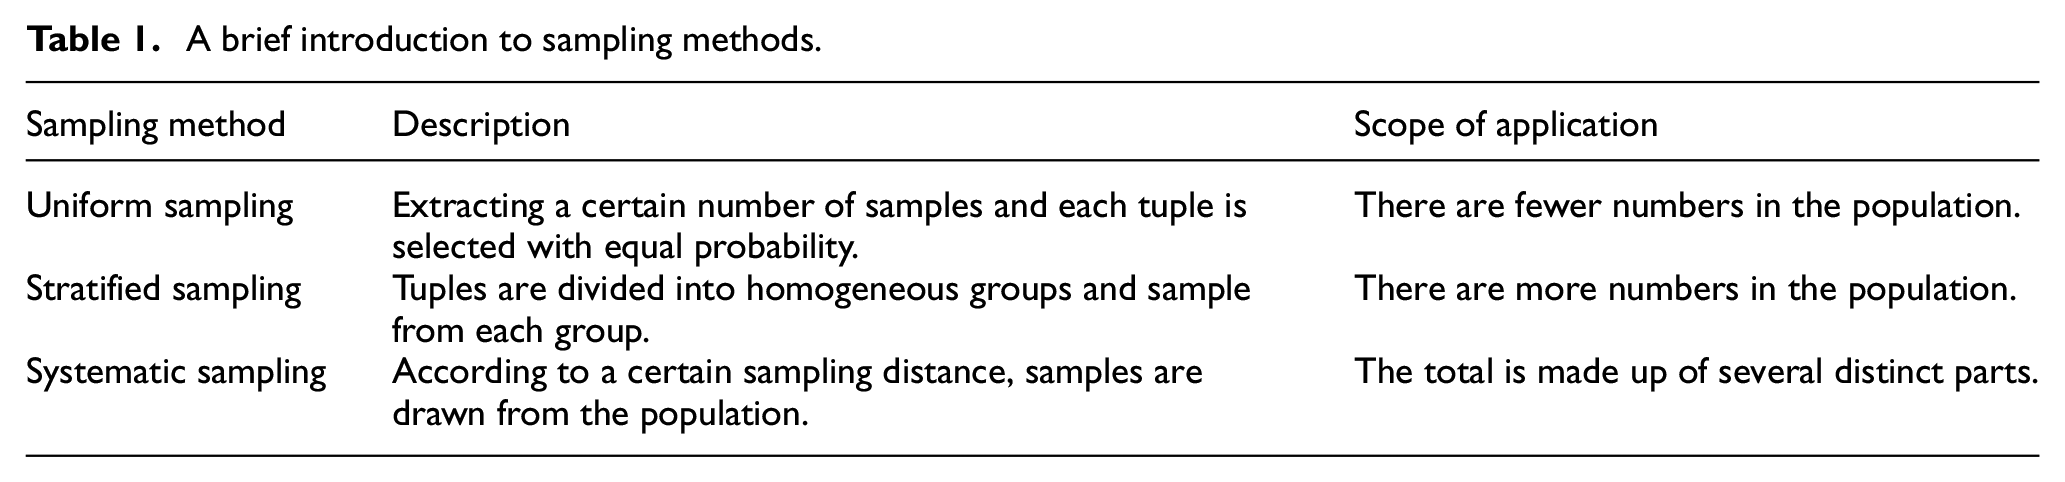
First of all, a brief introduction to the three sampling methods used in this paper is shown in Table 1. It should be noted that when the stratified sampling method is used in a data set with no obvious stratification, it could be simply stratified according to the data distribution.
A brief introduction to sampling methods.
Based on a series of subsets
Design of interval information granules with the principle of justifiable granularity
The principle of justifiable granularity is one of the leading paradigms offering a solid guideline of forming information granules. 20 The essence of the paradigm is to form a single meaningful information granule based on available experimental evidence (data), and it is required that such a construct adhere to two intuitively compelling requirements: coverage and specificity. 21
Here we assume that an information granule Ω=[a, b] represents an interval with an upper bound b and a lower bound a.
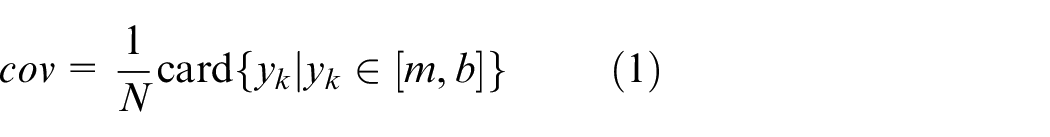
(a) Coverage (cov): The numeric experimental data accumulated within the information granules should be as high as possible, which means that this information granule is well justified (supported) by available experimental evidence. 3 Let us consider the elements of data located to the right side of the numeric representative m (it could be the mean or median value of the experimental evidence), coverage is determined as the cardinality of the elements contained within the range [m, b],
(b) Specificity (sp): Specificity measures the degree of accuracy of information granules in expressing experimental evidence. 22 It is expressed as follows:
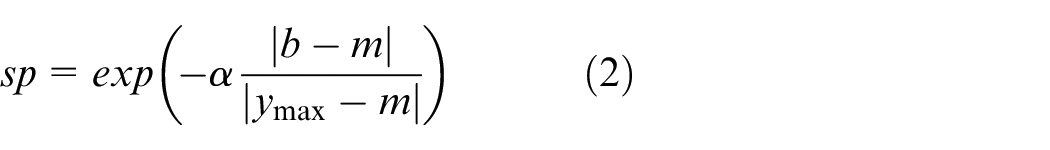
where ymax is the maximal value of
The value of α has a certain impact on the calibration of the specificity criterion in the construction of information granules. It is worth noting that if α = 0, sp=1, and the specificity criteria is completely excluded (ignored). In this case, the upper bound is obtained as b = ymax. The value of α emphasizes the influence of the specificity criterion. 23
It is noted that the expression of both the coverage and specificity are not unique. However, the increase of coverage is corresponded to a decrease of specificity.24,25 Since the two requirements are in conflict, we are interested in achieving a good balance between coverage and specificity. 26 Therefore, we can resort to a two-objective optimization problem and look at the resulting pareto front. 27 One can consider the aggregation of the two requirements, which can be succinctly completed as a product of coverage and specificity,

By maximizing V(b), the optimal upper bound b can be obtained, that is, bopt = argmaxbV(b). A similar process is carried out for the lower bound a.
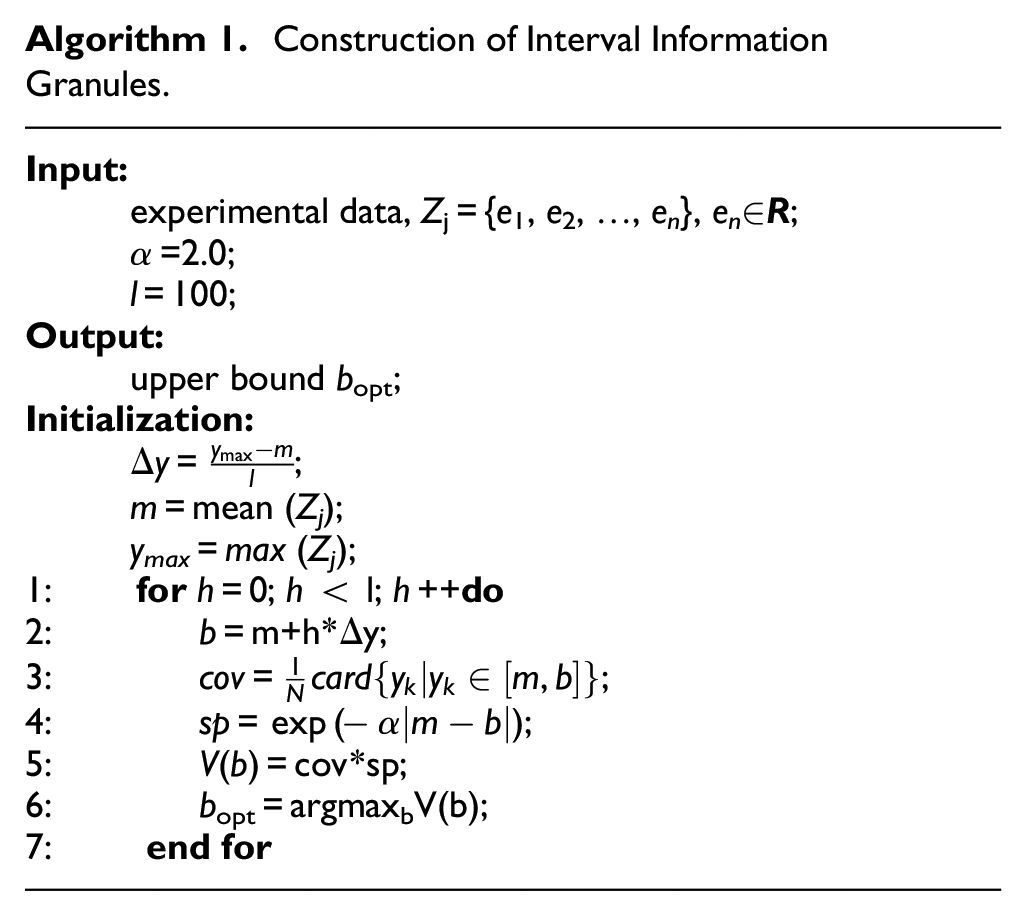
In summary, the entire design process of information granules with the use of the principle of justifiable granularity is summarized in Algorithm 1.
Construction of Interval Information Granules.
Evaluation of granular models
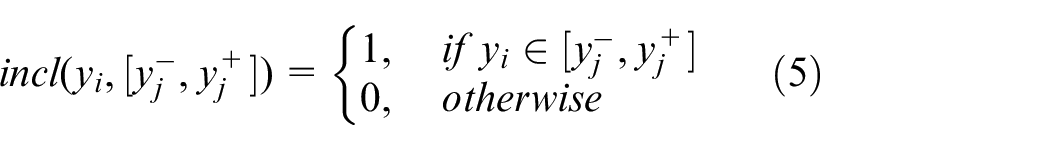
To evaluation the performance of the designed granular model, the general idea of the coverage and specificity are augmented to consider both the completeness and accuracy of the outputs of the model. Here, the coverage is defined as the degree of original data
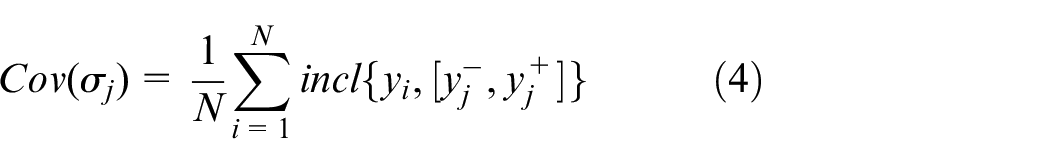
where
The specificity is quantified by the length of the interval, which is calculated as the average specificity of all intervals 28 as follows:
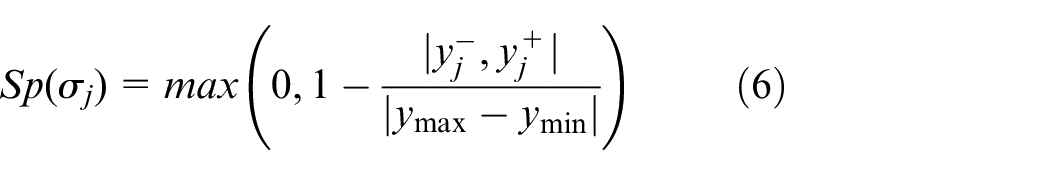
where ymax and ymin represent the maximum and minimum values of the output space, respectively.
The overall performance index can be expressed as a product of the coverage and specificity criteria:

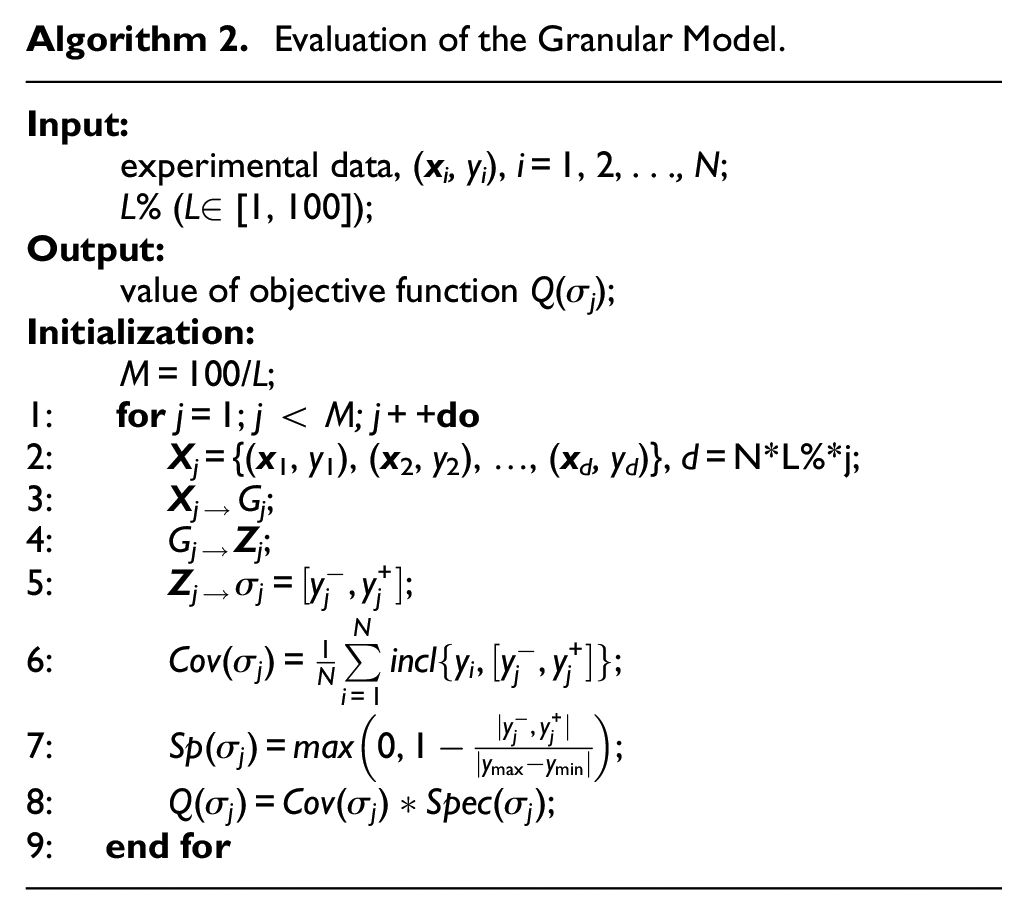
By evaluating the performance of the objective function based on different sample size of subsets, an optimal subset can be obtained. The evaluation process is summarized as shown in Algorithm 2:
Evaluation of the Granular Model.
Experimental studies
In this section, we present a series of experiments completed based on a synthetic dataset and several publicly available datasets coming from the UCI Machine Learning Repository (http://archive.ics.uci.edu/ml) to illustrate the performance of the proposed models. The experiments are carried out based on a Windows10 operating system, and the processor used in the experiment is AMD Ryzen 7 4800U with Radeon Graphics 1.80 GHz. Meanwhile, Python 3.6 version is used as the programing environment.
Synthetic data
The randomly generated 2-dimensional input and single-dimensional output data set are experimented. The function is described as follows:

where x1 is in [0,50] and x2 is in [−10,10]. In the experiments, a dataset containing 3000 pairs of input and output data is used (following uniform distribution over the input space). The dataset is divided into a 90%–10% proportion of training and testing data sets.
Experimental regression models and parameters setting
In this study, three regression models, namely KNN, SVM,and LSTM are selected as the numeric models. Both KNN and SVM are classical supervised learning algorithms. KNN considers each sample while SVM aims to find a function that achieves the separability of samples in the designing process. Moreover, KNN cannot handle high-dimensional data sets, while SVM is good at processing high-dimensional data. The naive KNN will not learn feature weights on its own, while the essence of SVM is to find weights. LSTM is a classical deep learning recurrent neural network model that has emerged in recent years, and it has excellent capabilities in the field of time series processing. 29
In the experiments, we use grid search method and cross-validation method to avoid overfitting, which is an exhaustive search method for specifying parameter values.30,31
Firstly, use the grid search method to traverse each pair of hyperparameters in the search grid. Secondly, use the cross-validation method to evaluate each pair of hyperparameters to obtain the evaluation score index. The evaluation indicators of each pair of hyperparameters are compared to obtain the optimal hyperparameter pair, which is selected for model training. Grid search is used to search for parameters, that is, within a specified range of the parameters, it can be applied to realize the searching process according to the following steps: adjust the parameters in sequence according to the step length; use the adjusted parameters to train the learner; find the parameter with the highest accuracy on the verification set from all the parameters. K-fold cross-validation divides all data sets into k parts; takes one of them as the testing set each time; uses the remaining k−1 parts as the training set to train the model; calculates the score of the model on the testing set; and record the average score as the final score.
(a) KNN: For two n-dimensional vectors
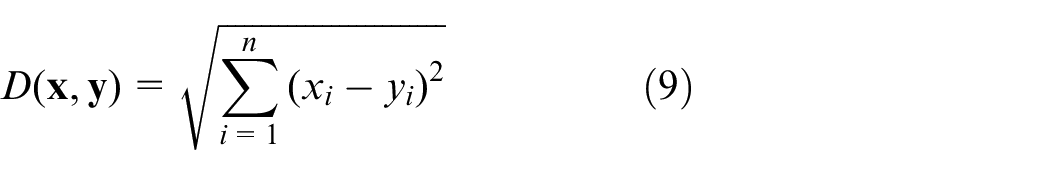
For a given testing sample, find K closest samples in the training set based on the Euclidean distance, and then make predictions of these K neighbors.
Through the verification and analysis of the grid search method, the prediction effect is the best when the value of k in KNN is set as 10.
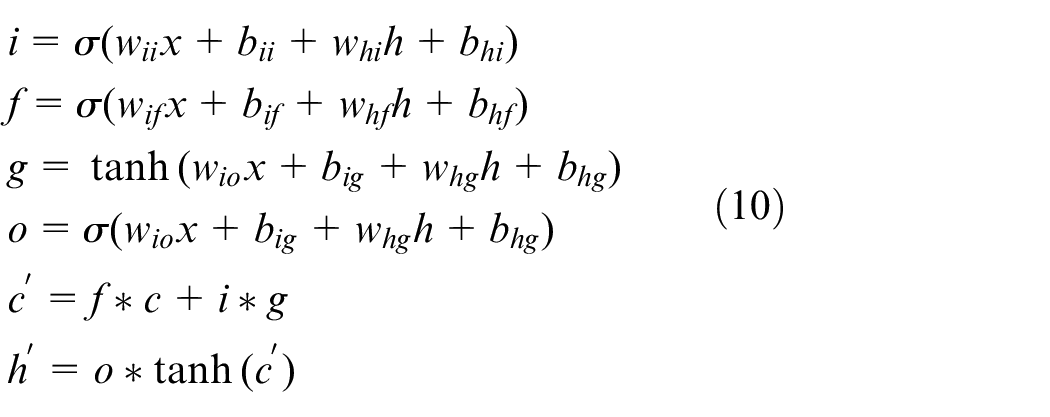
(b) LSTM: There are three gates in LSTM, namely the input gate, forgetting gate, and output gate. When a piece of information enters the LSTM network, it can be judged whether it is useful or not according to the pre-determined rules. I, F, O are the degree parameters of the three gates, and g is a conventional RNN operation of the input. It can be seen from Equation (10) that there are two outputs of LSTM, namely cell state c′ and hidden form h′. c′ is the product of the input and forgotten gates, that is, the contents of the current cell itself. h′ is obtained through the output gate, and it is also the content that is transfered to the next unit.
The LSTM uses a multi-layer LSTM structure. The input layer LSTM structure of the prediction model uses 32 units; the hidden layer LSTM structure uses 16 units; the output layer uses a fully connected layer; the number of nodes in the output layer corresponds to the length of the predicted data; and the activation function uses the sigmoid function. Grid search and cross-validation are used to determine the time window parameters. Through the verification and analysis process of the grid search method, the best performance can be obtained when the batch size is 10 and the epochs is 100.
(c) SVM: The problems of Support Vector Regression can be formalized as:
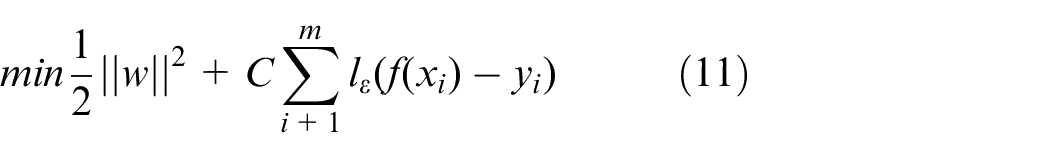
where C is regularization constant, and lϵ is the function of the insensitive loss shown in the following formula:
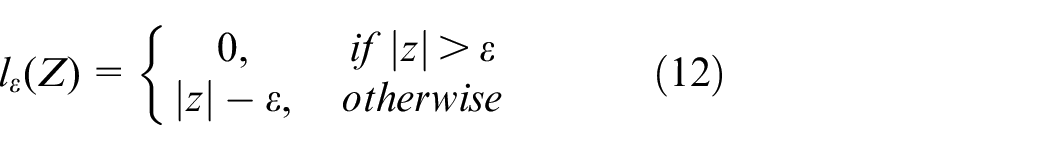
With the value of γ increasing, the regression effect of the testing set gradually decreases, and the generalization errors is easily overfit. By applying the grid search method to obtain the optimal parameters, the RBF function is used in the kernel function and the best accuracy can be obtained when γ = 0.01.
Analysis of experimental results
The predicted outputs obtained with the three regression models compared with the original output are shown in Figure 2. Here, the neural network model is chosen as an example for analysis. Based on its numerical output, we use the principle of justifiable granularity to guide the construction of information granules. For the construction of information granules, we consider the determination of upper bound b of the interval. The plots of the performance index V(b) regarded as a function of b as well as the curve of coverage and specificity are as shown in Figure 3.
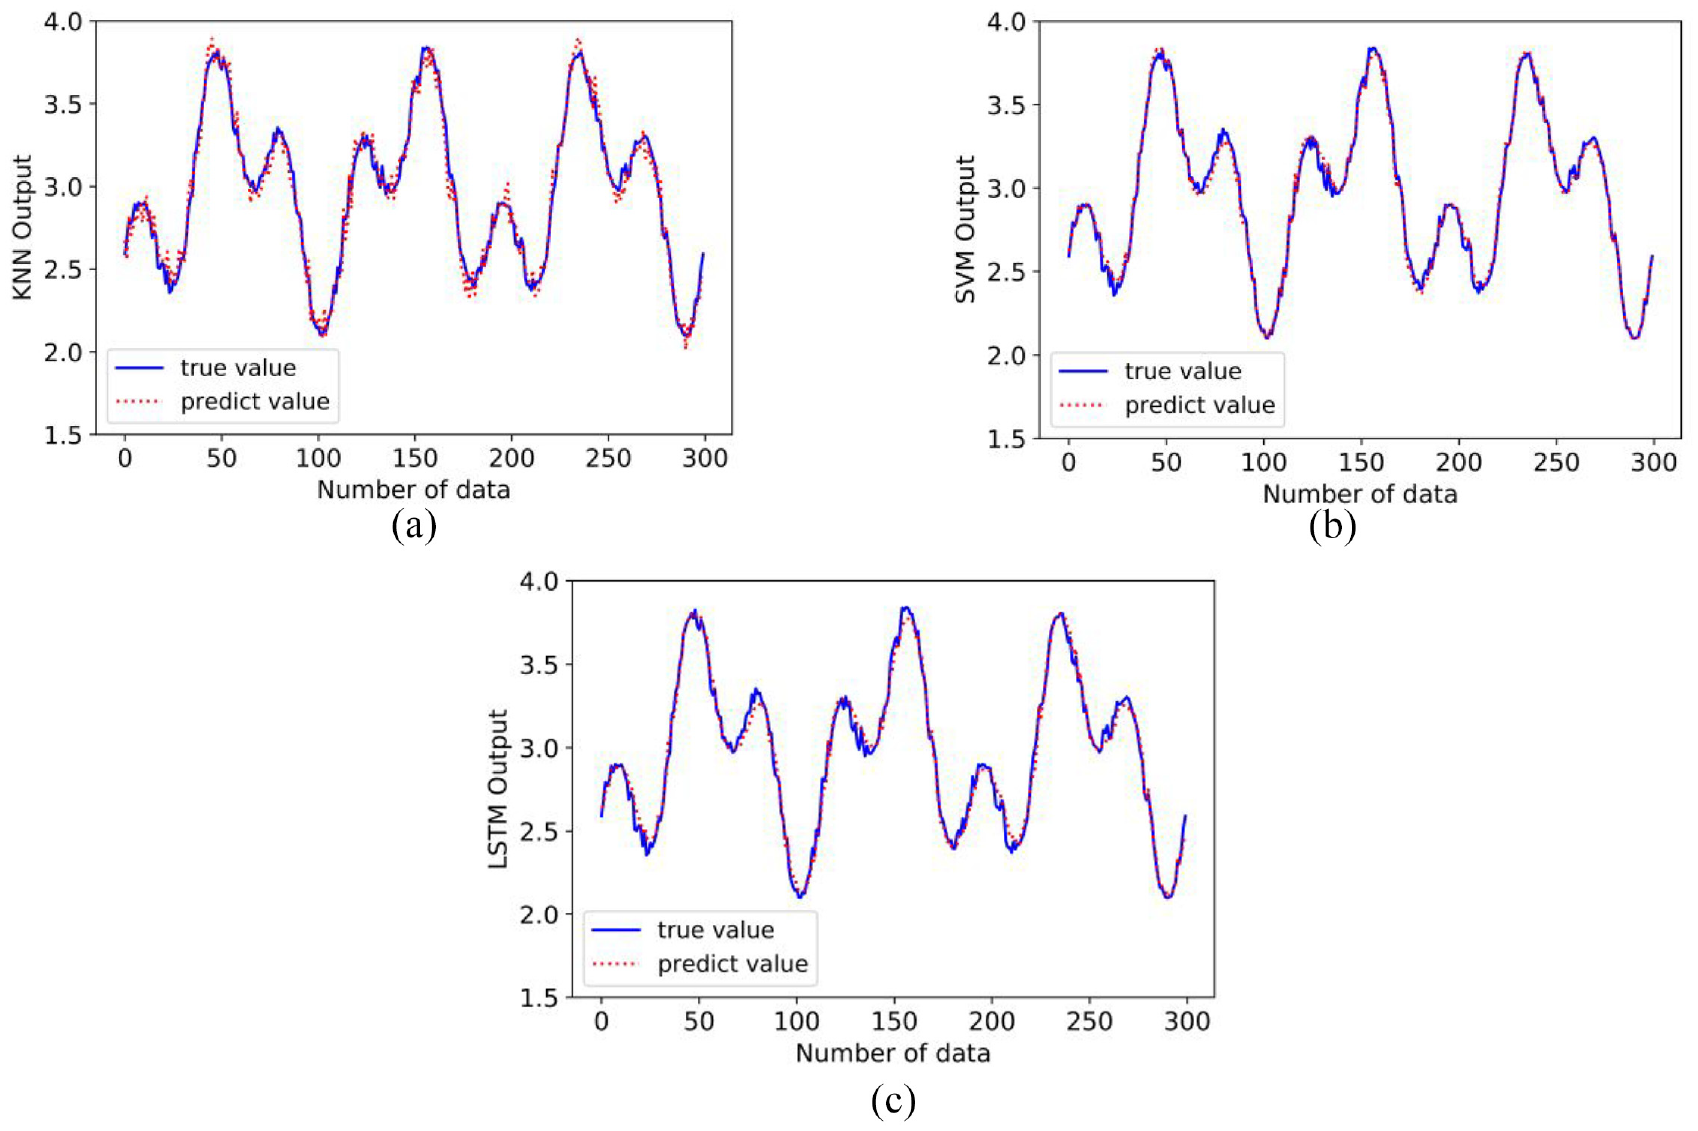
Curves of original data set (true value) and the output of the model (predict value): (a) KNN model, (b) SVM model, and (c) LSTM model.
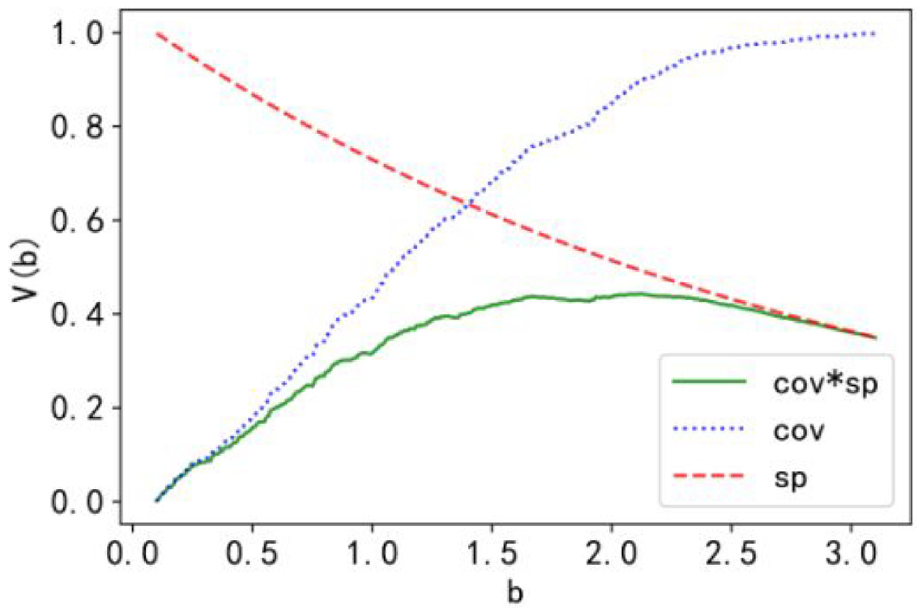
Plots of V (b) treated as a function of “b” as well as coverage and specificity with selected value of α = 2.0.
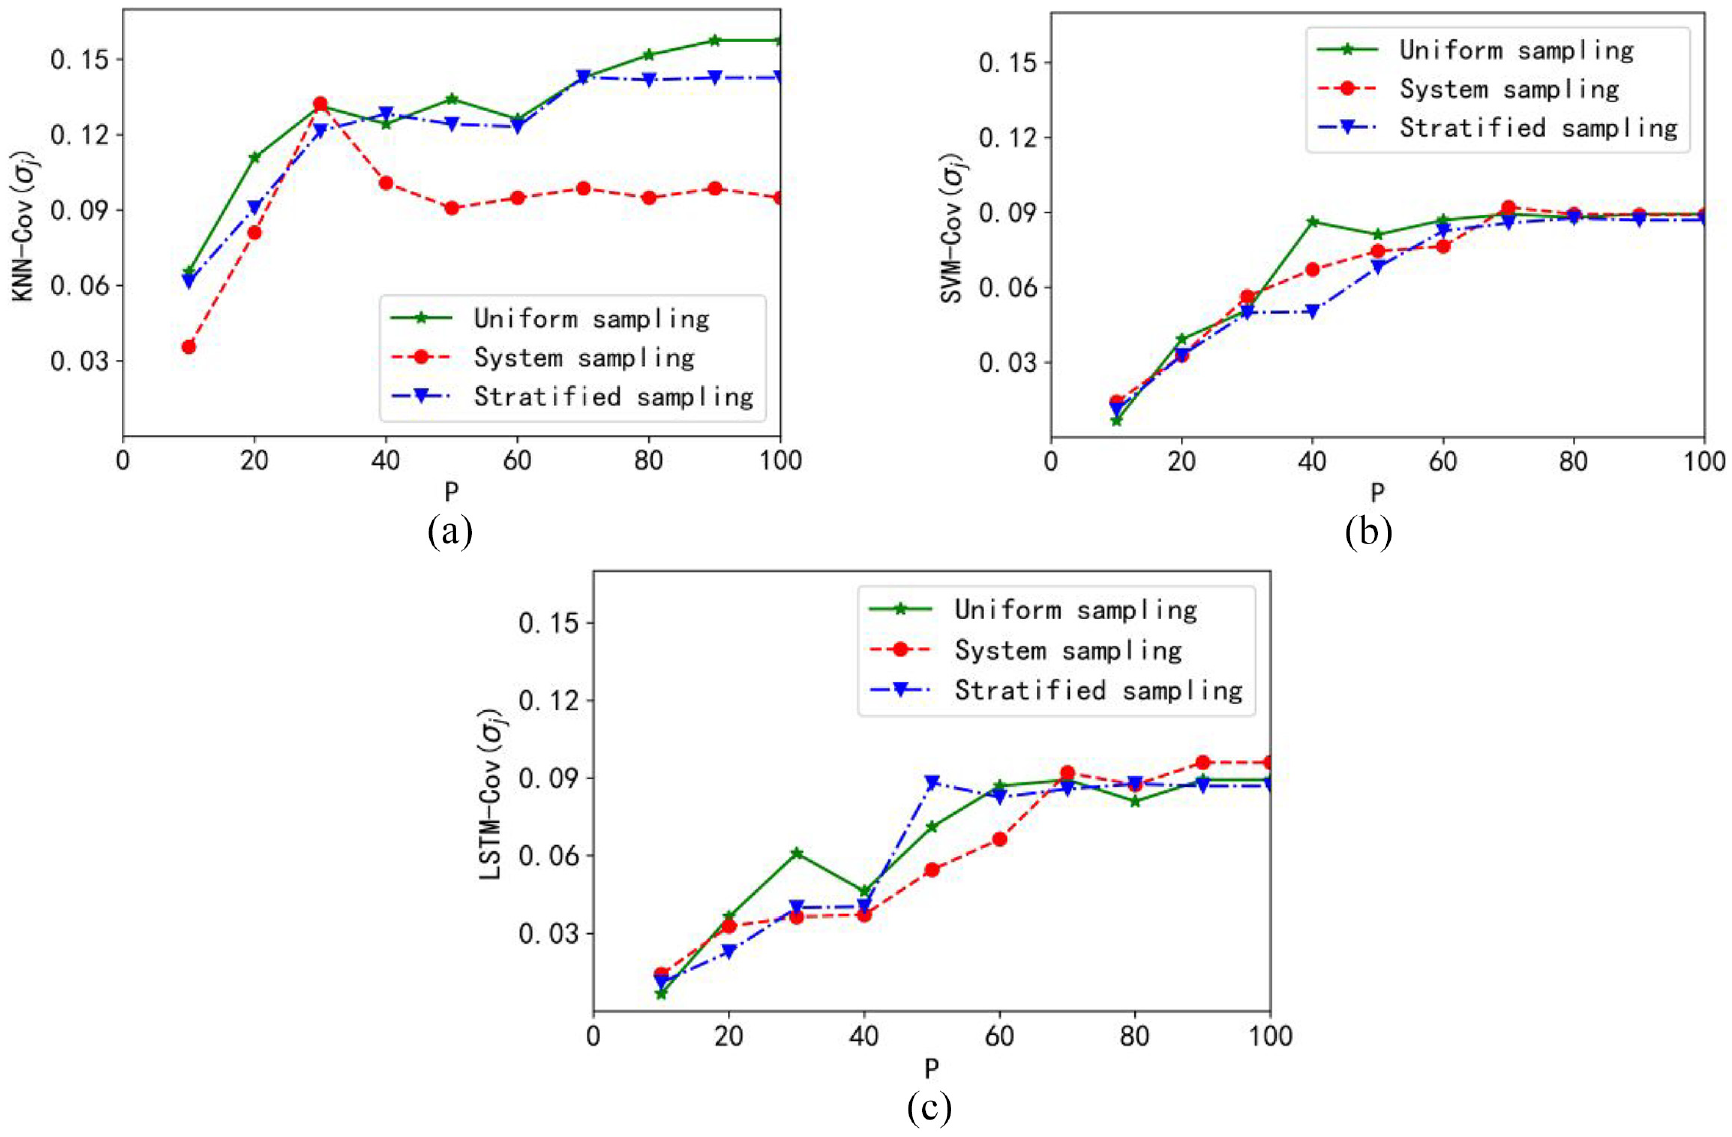
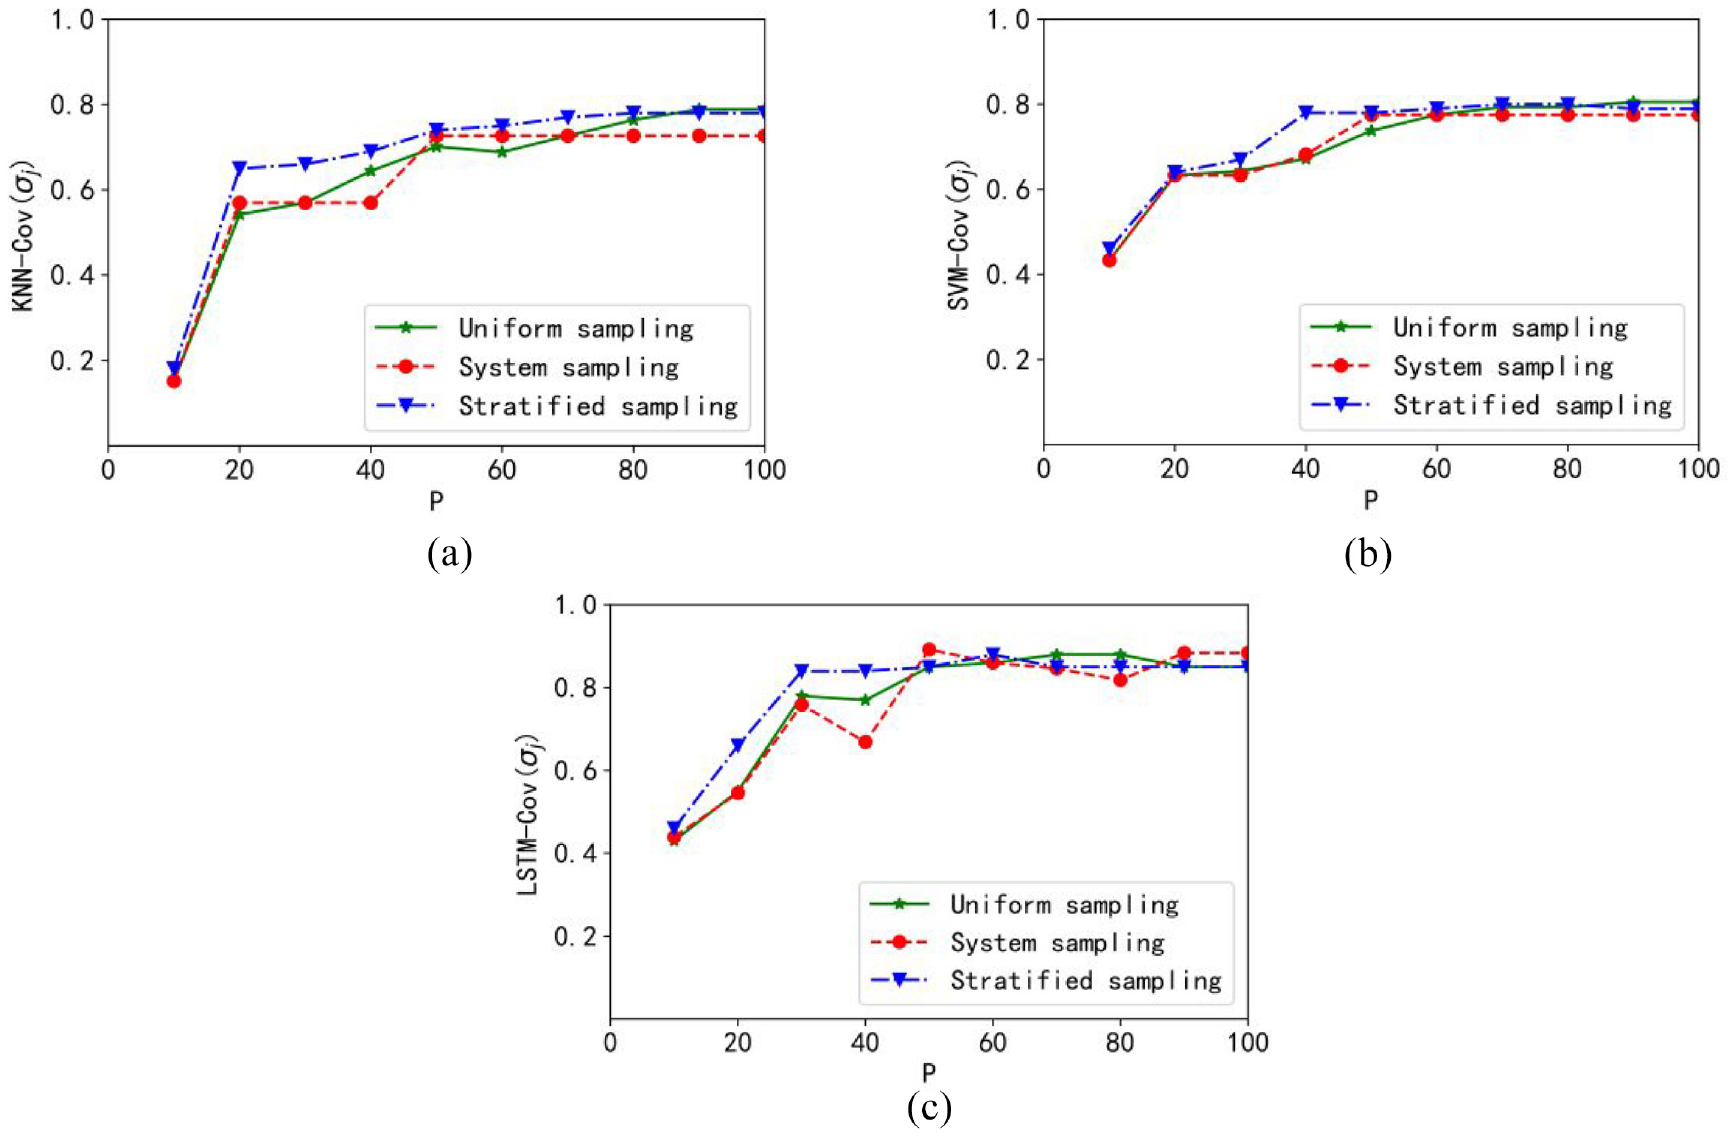
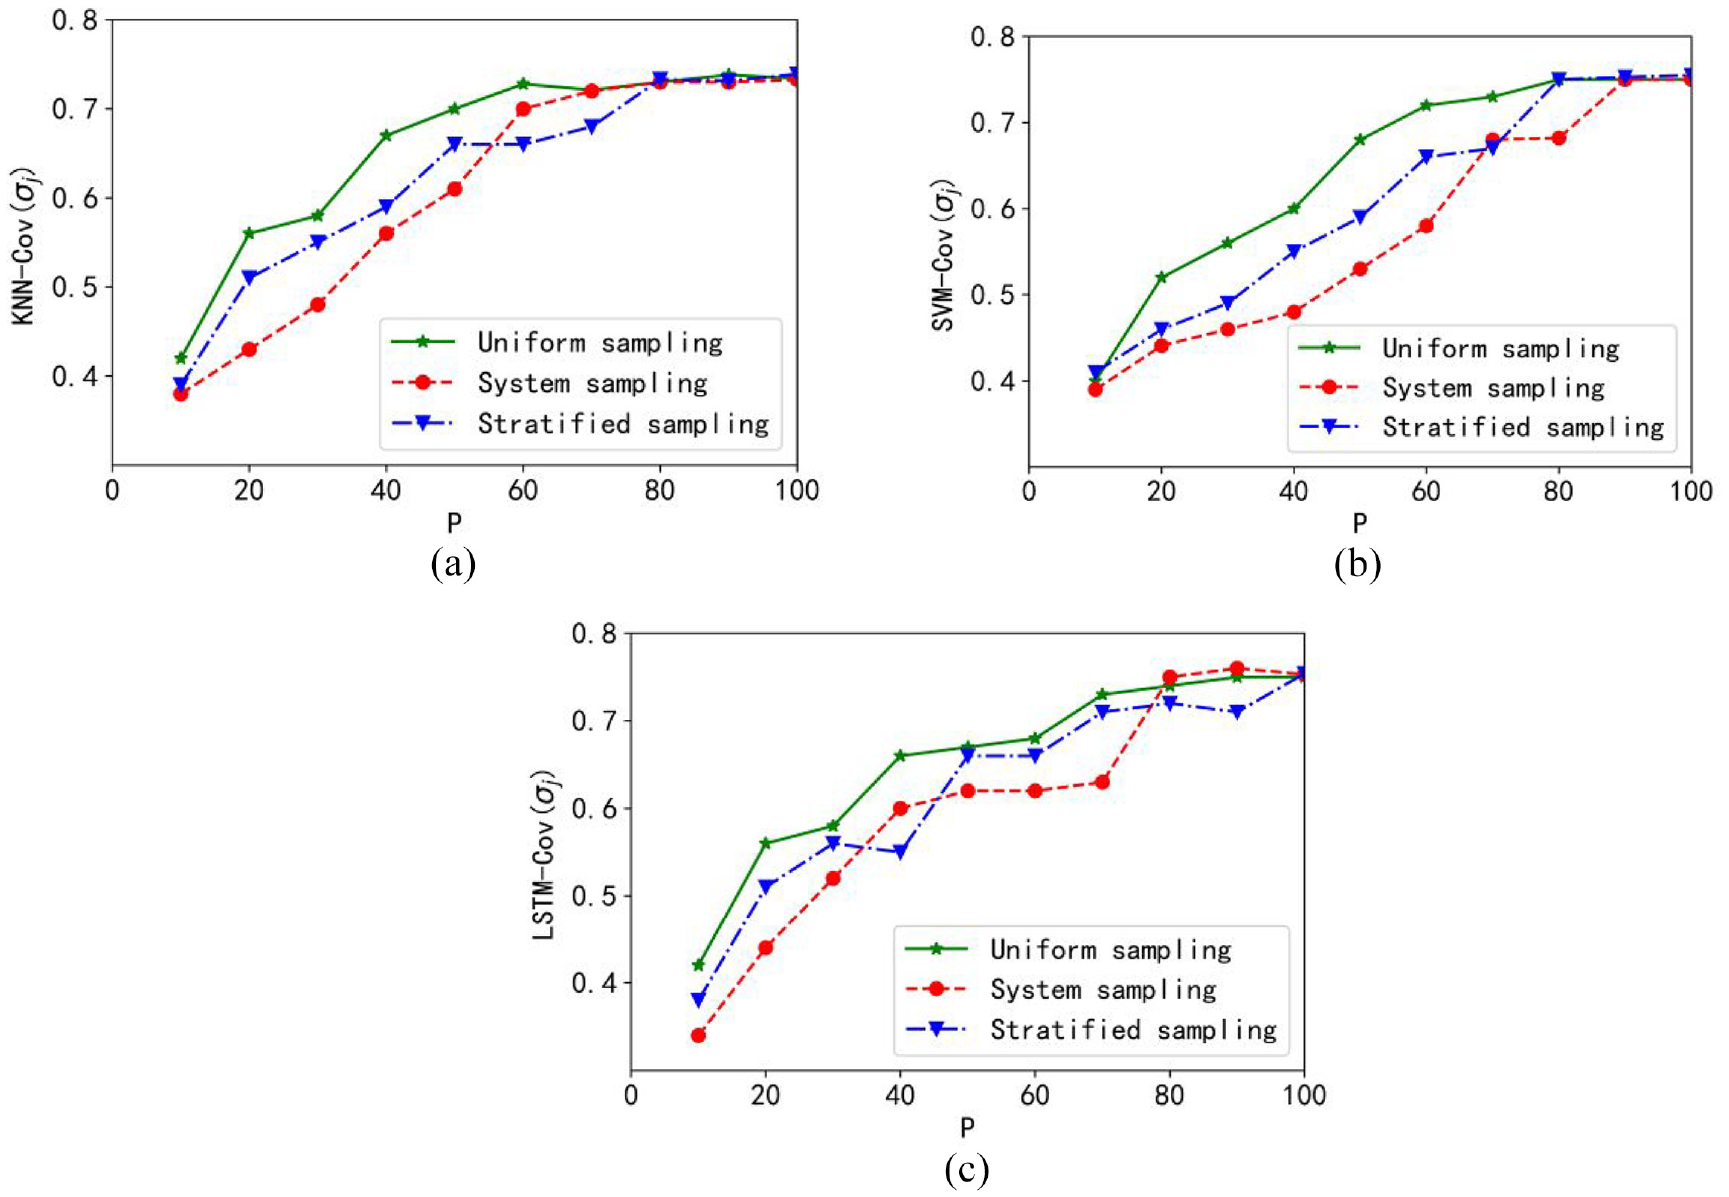
The coverage curves obtained with the three regression models are included in Figure 4.
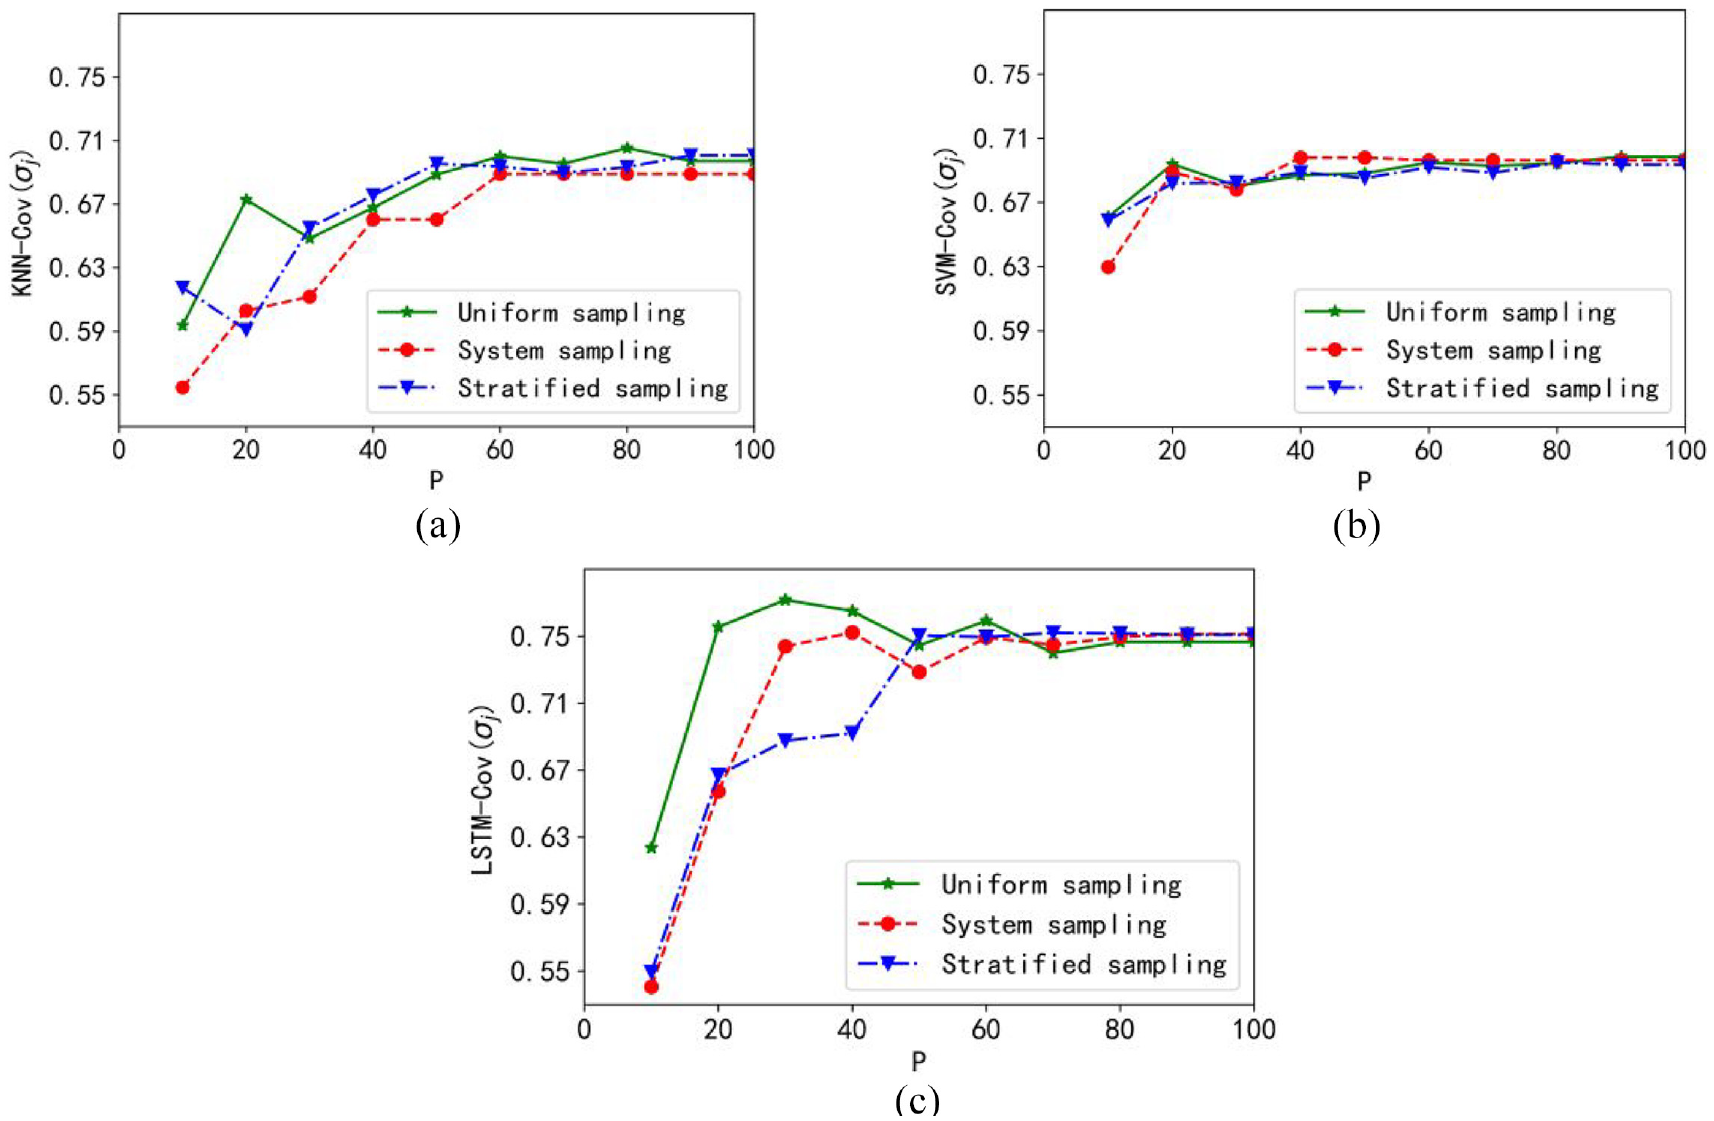
Plots of the coverage cov: (a) granular KNN model, (b) granular SVM model, and (c) granular LSTM model.
Obviously, with the sampling ratio increases, the coverage value of the constructed granular outputs increases as well. It is found that the coverage of the granular KNN model is the best. Meanwhile, the coverage under uniform sampling increases fastest.
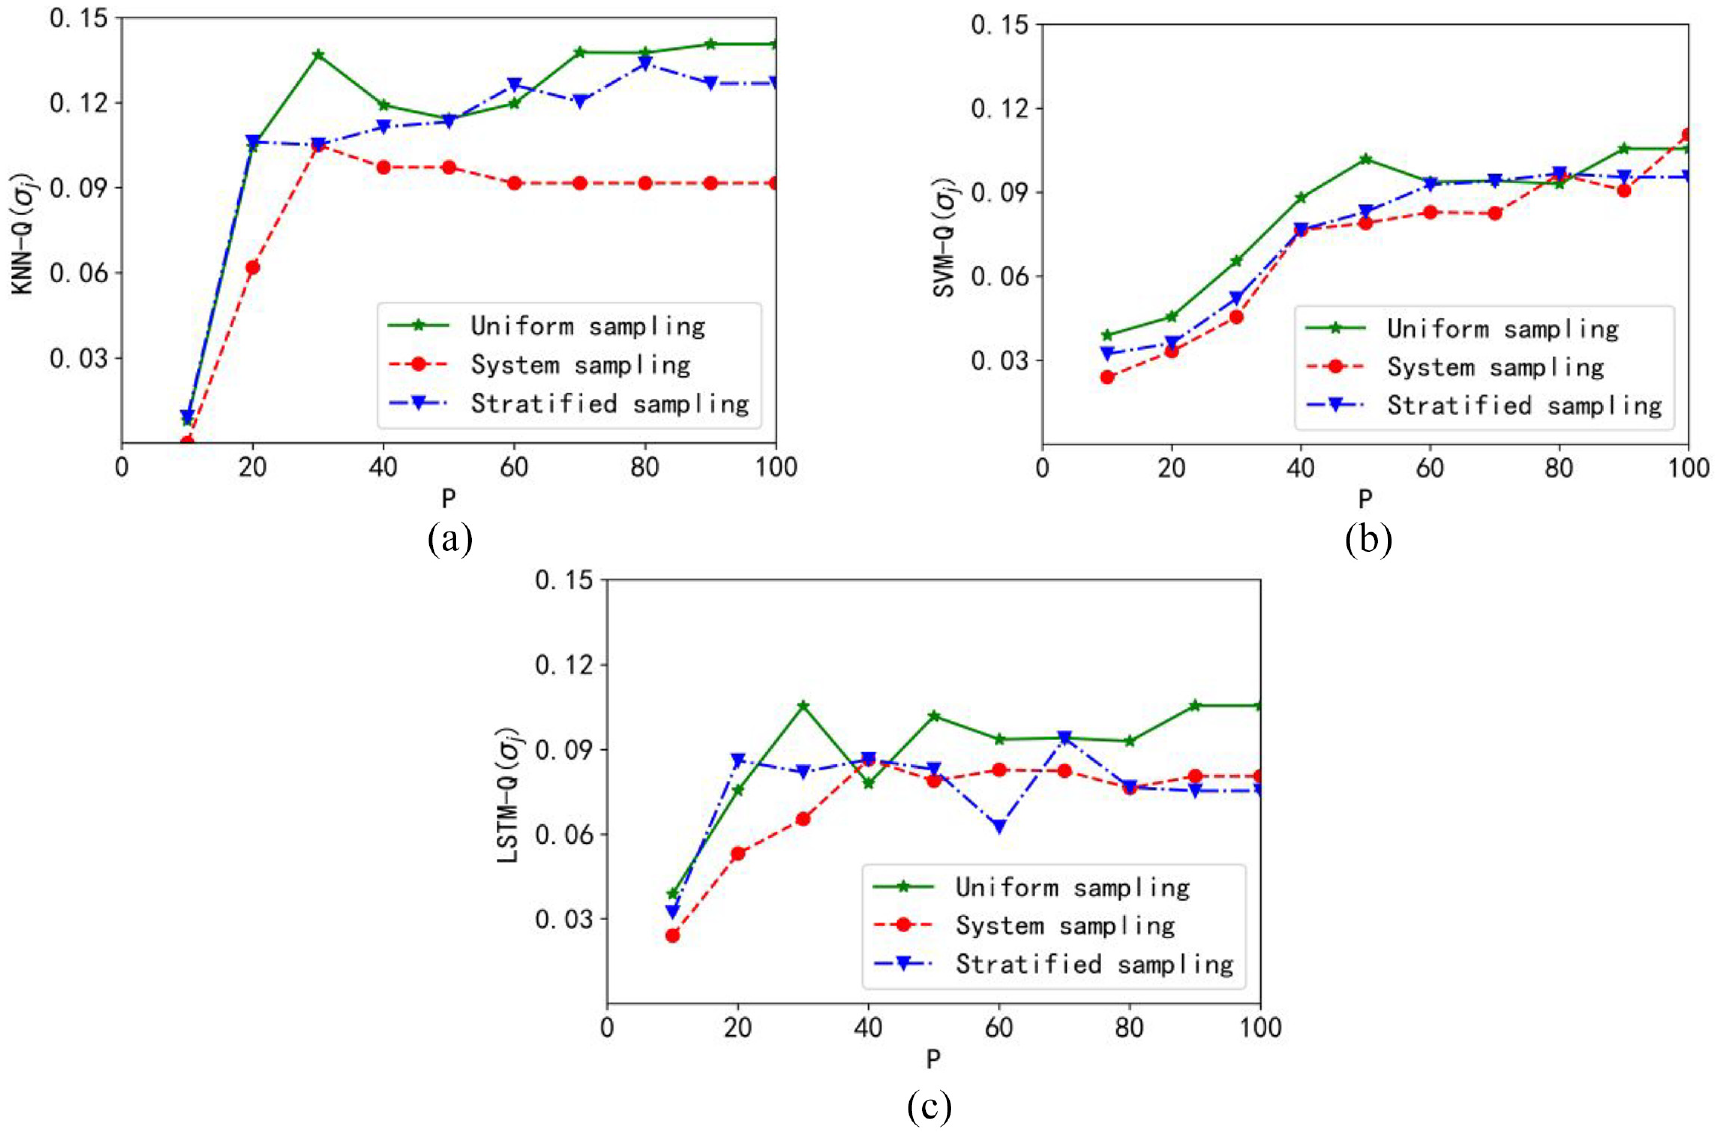
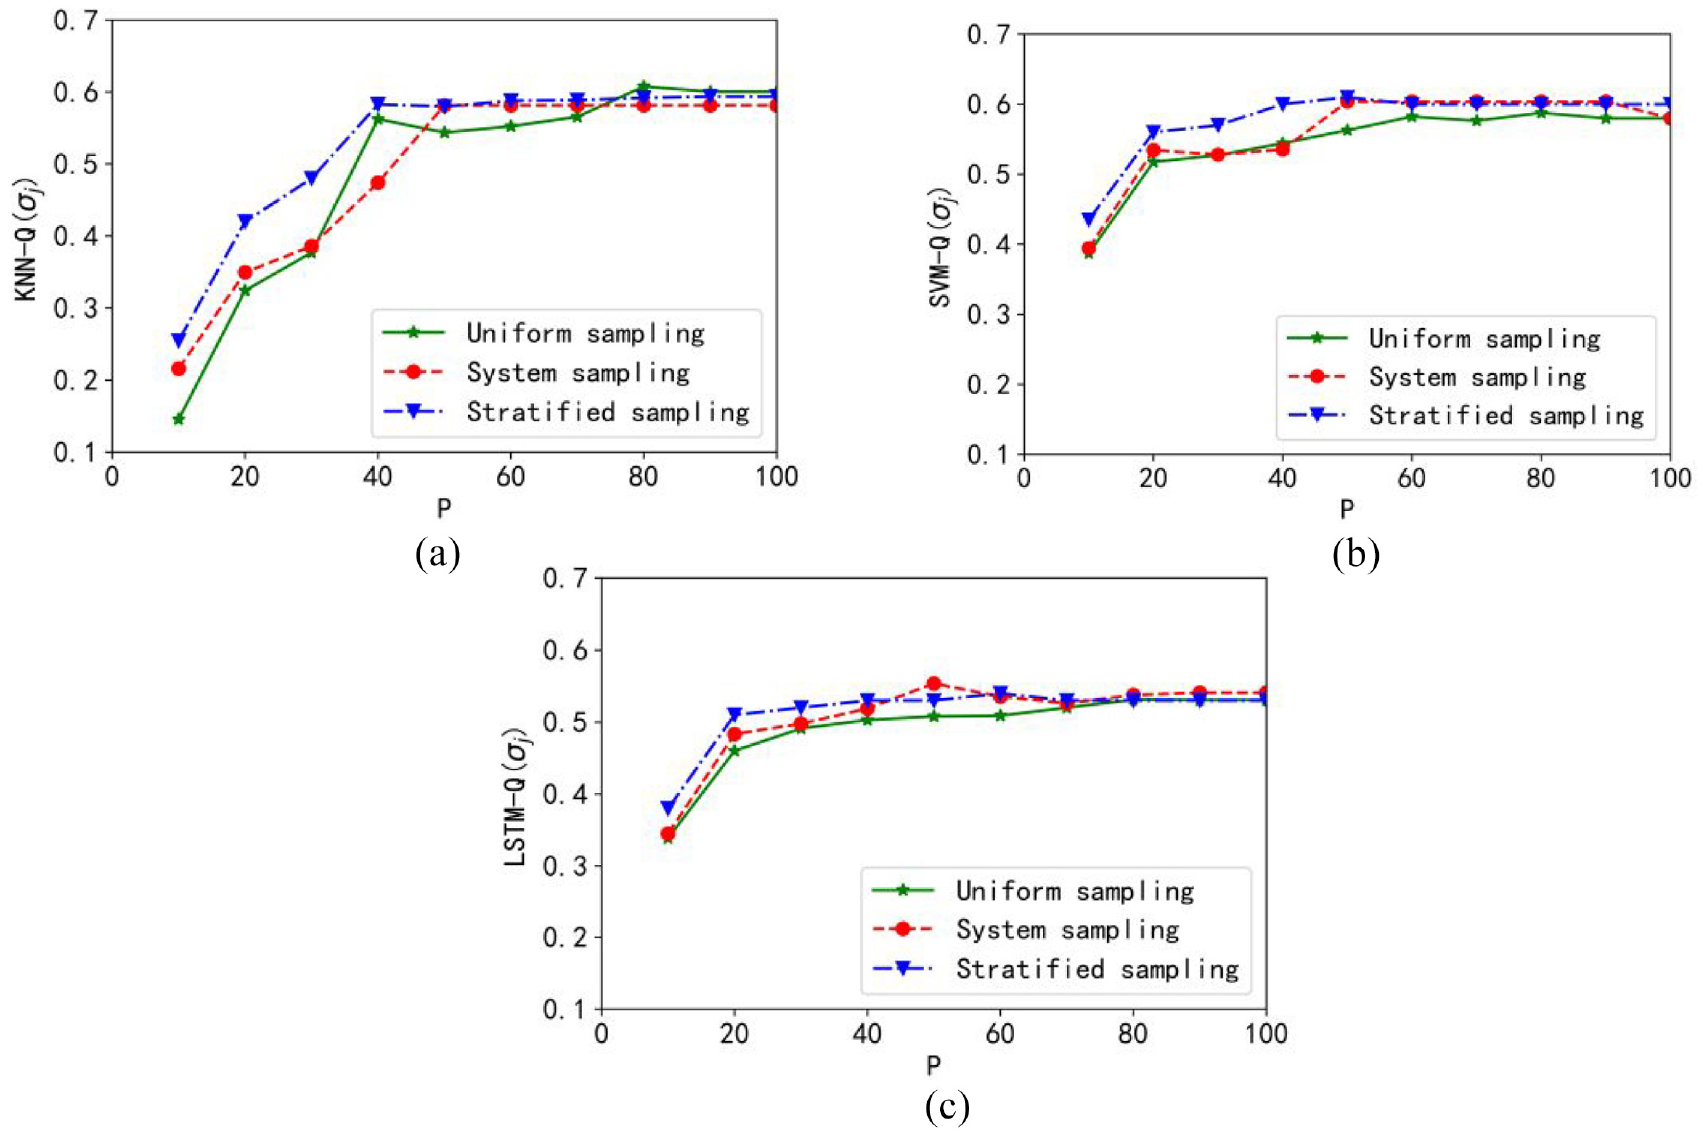
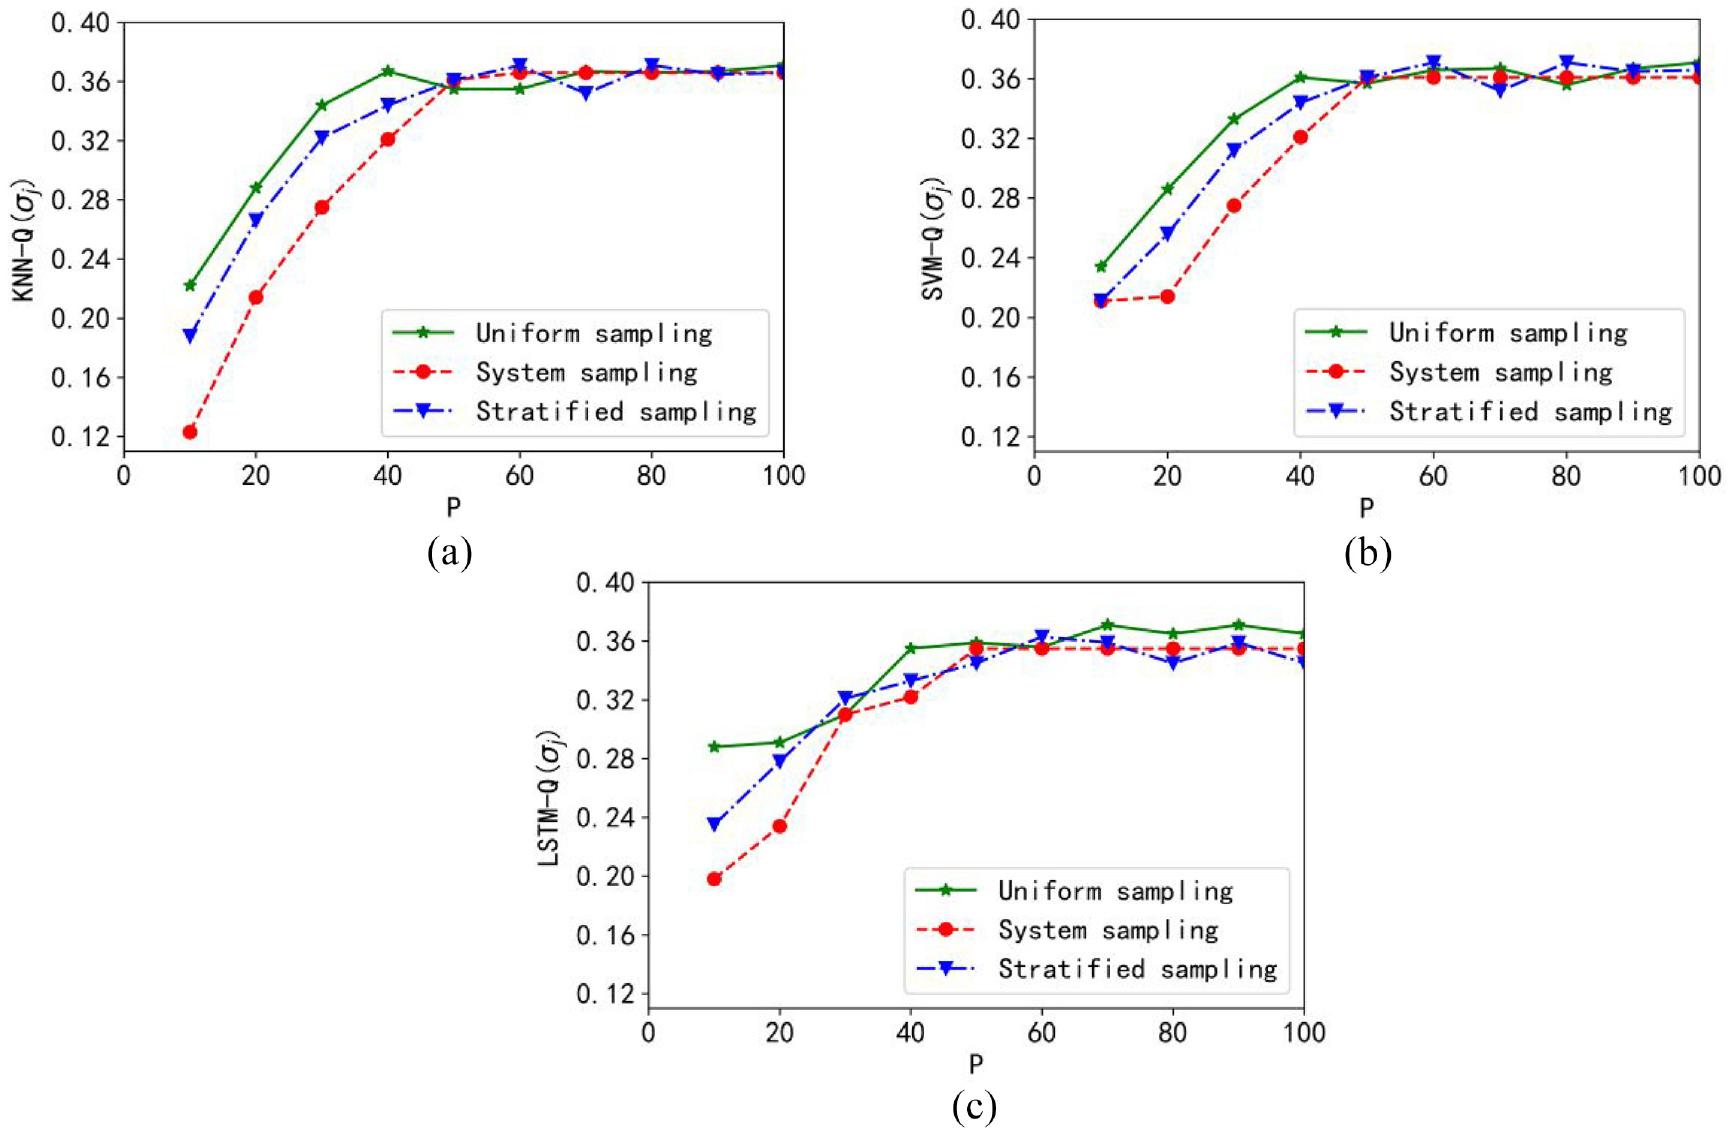
Figure 5 displays the plots of the performance index Q(σj). There is a visible “knee” point with which the optimal sampling scale can be determined. For the three granular models, the optimal sampling rate is positioned in the range of about 20%–40%. It is noticeable that the optimal performance index is obtained with the granular KNN model, and the uniform sampling can help to achieve the optimal value faster.
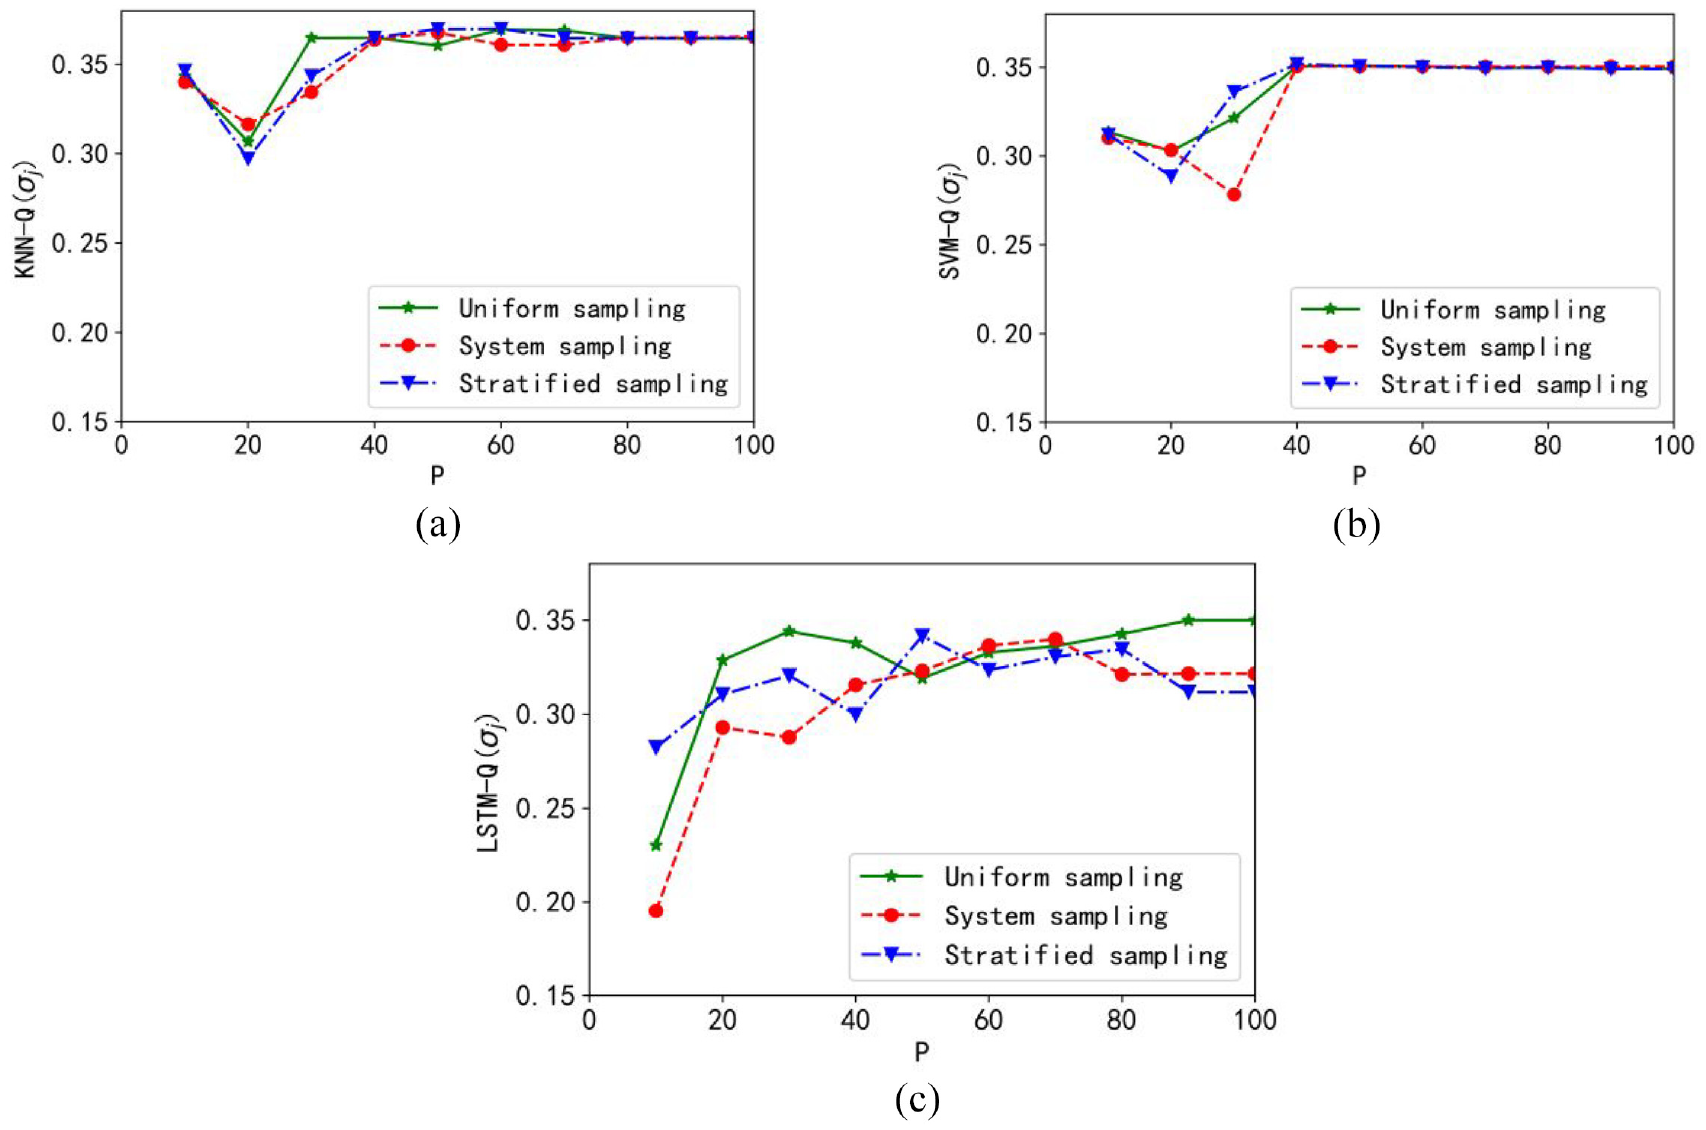
Plots of the performance index Q: (a) granular KNN model, (b) granular SVM model, and (c) granular LSTM model.
Time consumption of sampling
The running time based on different subsets under each sampling method and the results are presented in Table 2.
Overall running time of different sampling methods.
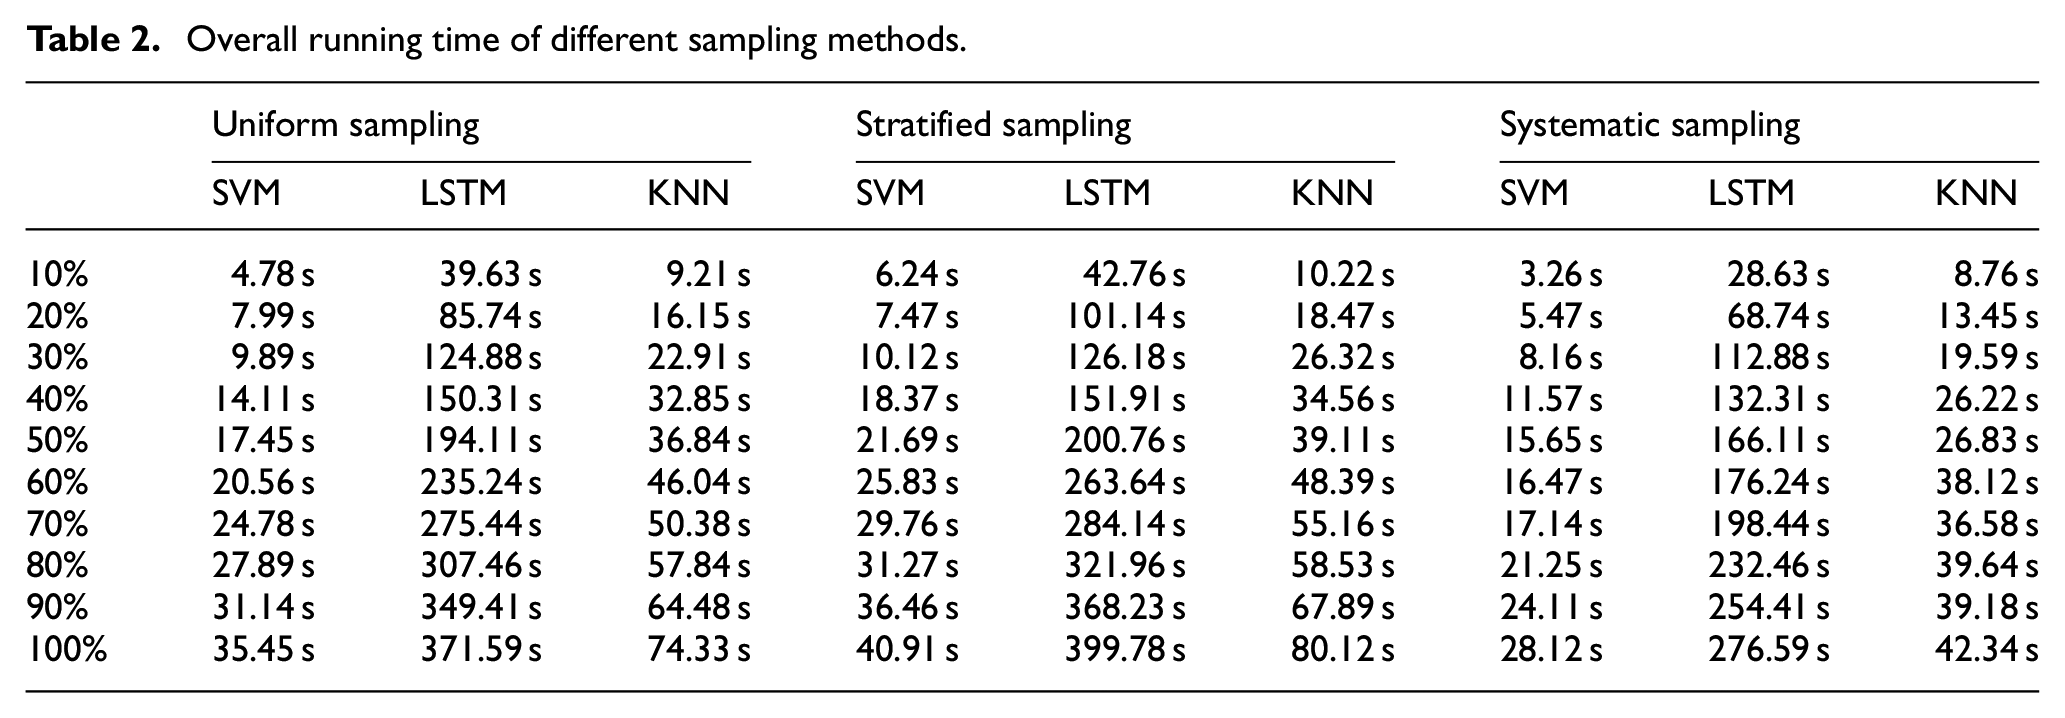
As shown in Table 2, it can be concluded that the running time of uniform sampling and stratified sampling is relatively long, and the time consumption of systematic sampling is the lowest.
Analysis of experimental results
For comparative analysis, we show the numerical outputs of the neural network model in Figure 6. Here 10% of the original data set is selected as the testing sets for experiments.
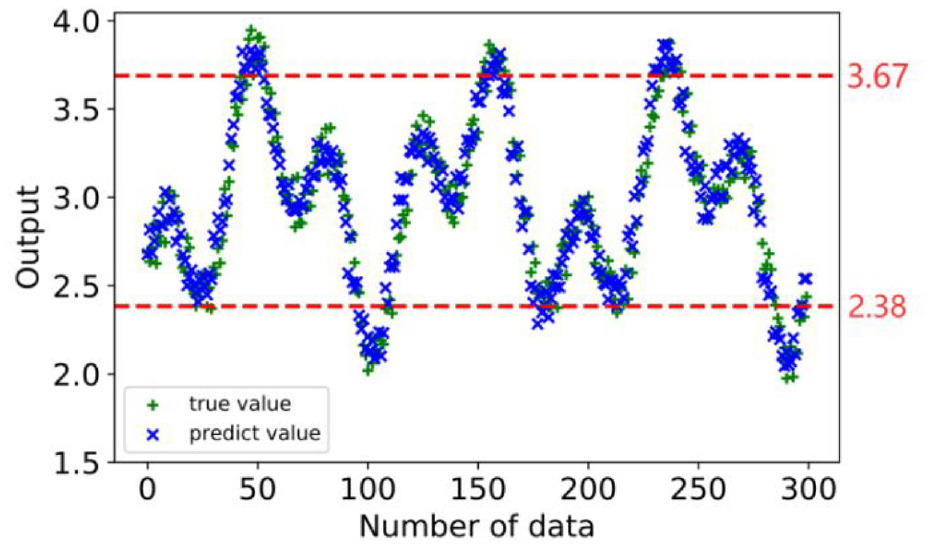
Numerical model comparing of granular model.
The accuracy of the information granule as well as the numeric outputs in predicting the original data are expressed as follows, respectively.
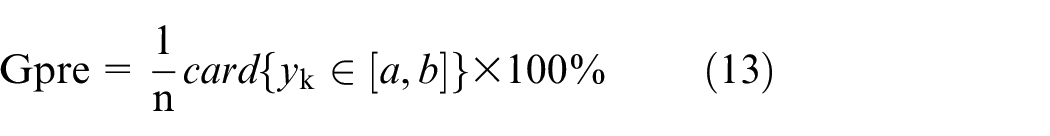
It is calculated that 86.6% in the original data is included in the interval. However, only 68.7% of the predicted values obtained by the numeric model are the same as the data in the testing set, which indicates that in this case, the granular model performs better than the numeric model.
Experiments based on UCI machine learning
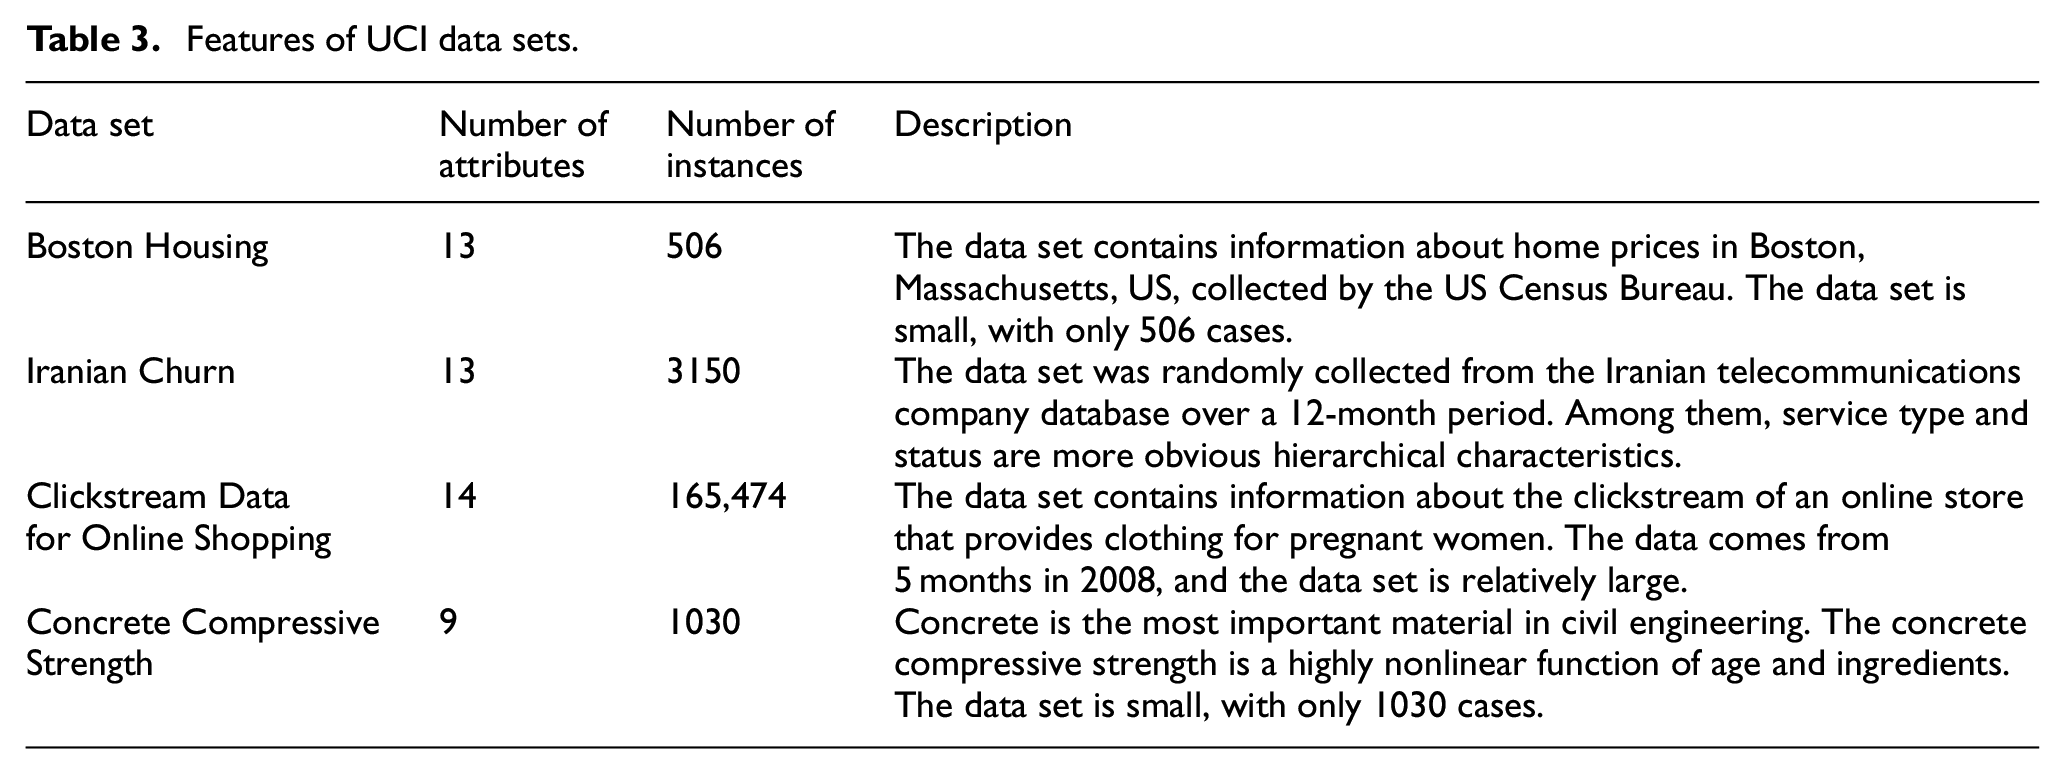
In this part, we conduct the experimental analysis based on four UCI data sets. The detailed information of each data set is shown in Table 3.
Features of UCI data sets.
Boston housing data set
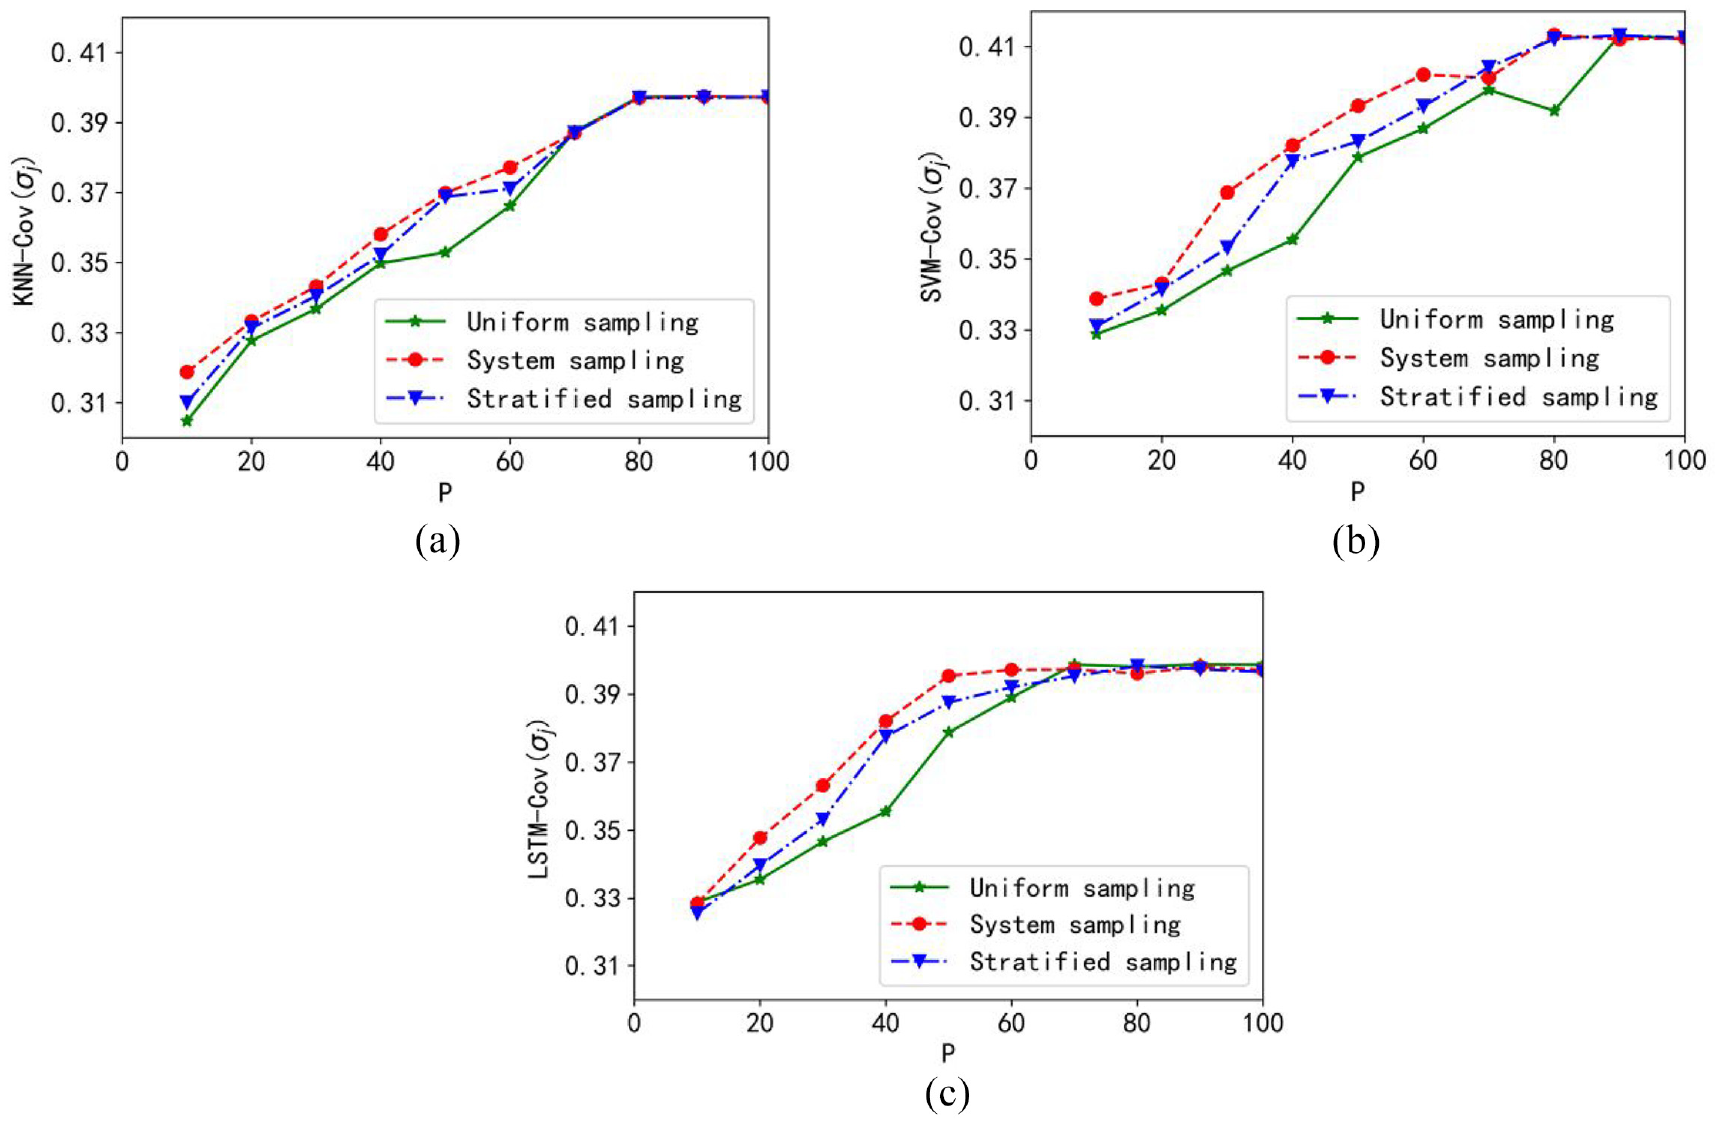
We report the curves of coverage in Figure 7. It is shown that increasing sampling sizes will result in increasing values of coverage, and the best coverage can be obtained with the granular SVM model and uniform sampling can help reach the maximum value fastest.
Plots of coverage: (a) granular KNN model, (b) granular SVM model, and (c) granular LSTM model.
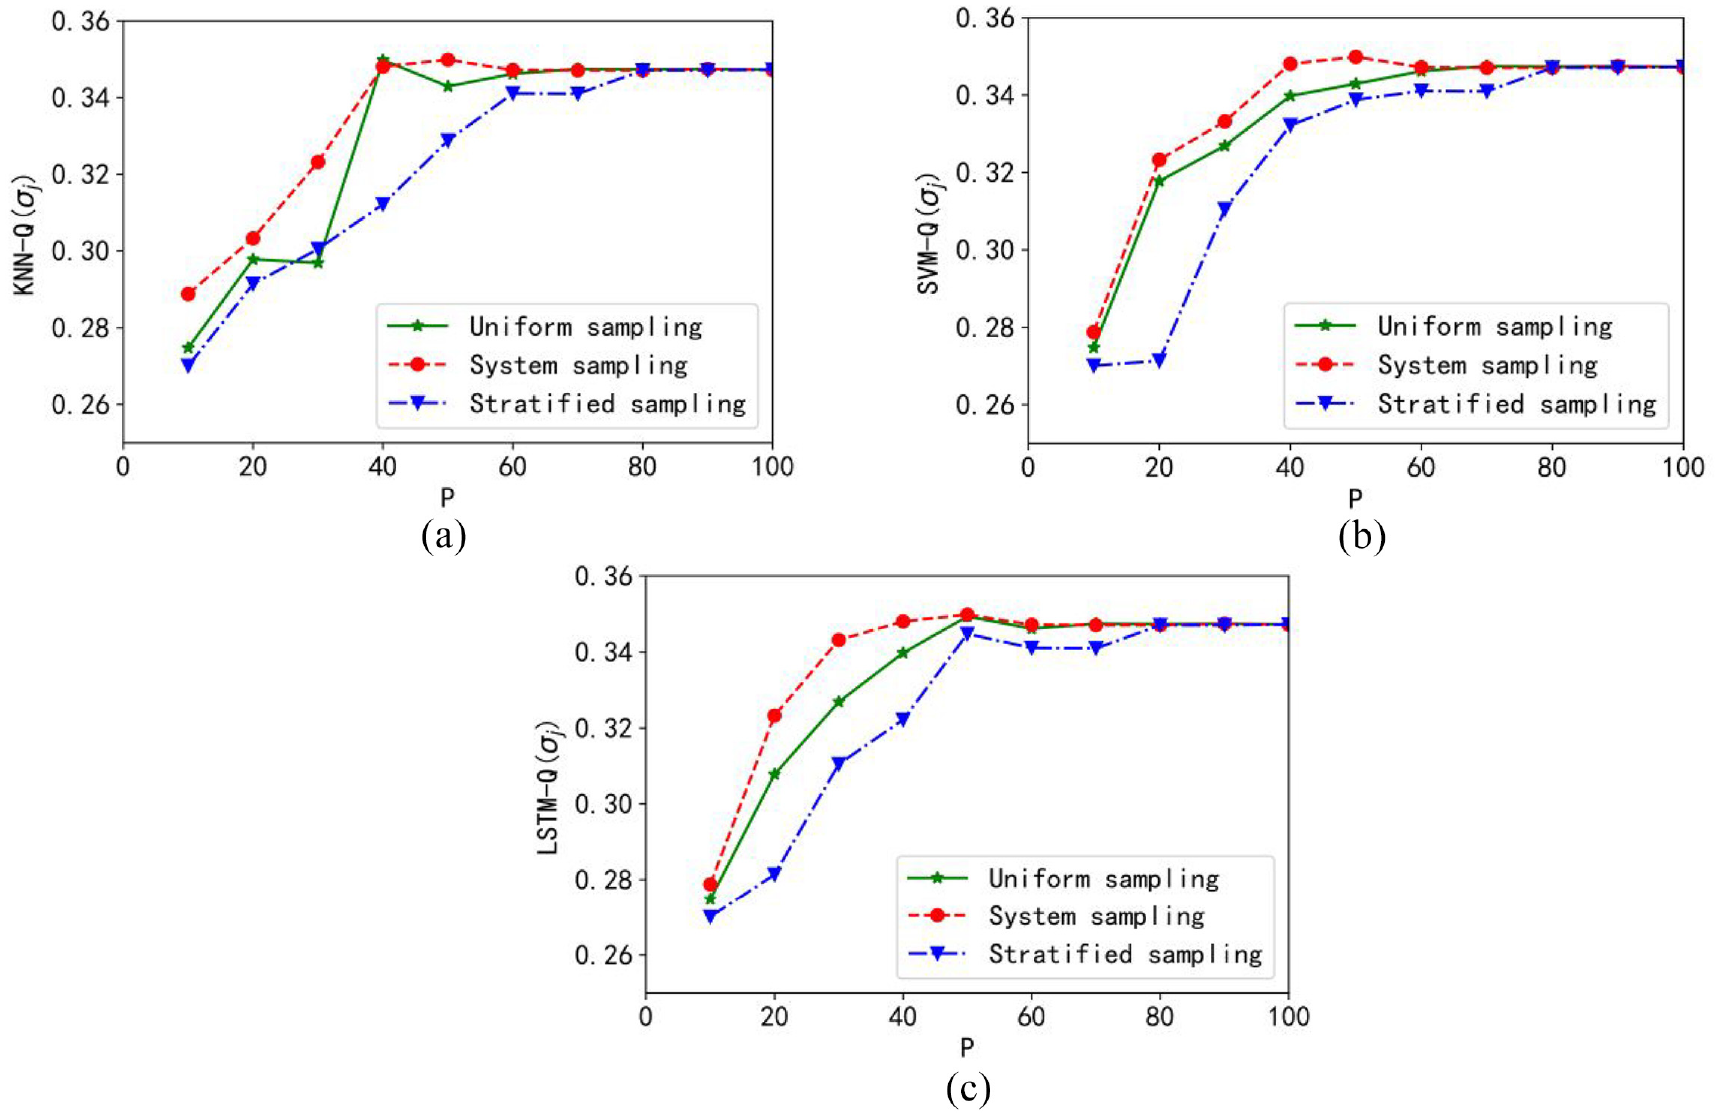
The curves of the objective function are shown in Figure 8. The optimal value is obtained when the sampling ratio is about 20% with the granular KNN model. For the granular SVM model, the optimal performance index is obtained when the sampling ratio is between 60% and 80%. In granular LSTM model, the optimal target value is obtained when the sampling ratio is about 40%–60%. The optimal value of the objective function is obtained when using the granular SVM model. Moreover, the fastest trend of the objective function is obtained under uniform sampling.
Plots of the objective function: (a) granular KNN model, (b) granular SVM model, and (c) granular LSTM model.
Therefore, for the Boston Housing data set, the best performance is obtained with the granular SVM model when using uniform sampling.
Iranian sprint data set
Coverage curve of the Iranian Sprint data set is shown in Figure 9. Some vital information is obtained by observing the coverage curve. For example, as the sampling ratio increases, the coverage increases gradually. The coverage rises fastest when using stratified sampling. The best coverage value is obtained with the granular LSTM model. The fastest increase in coverage is obtained when stratified sampling is used.
Plots of coverage: (a) granular KNN model, (b) granular SVM model, and (c) granular LSTM model.
The curve of the objective function is shown in Figure 10. It is easily to find that for each granular model, the best performance is obtained when sampling 40%, 60%, 50%, 60%,15%, and 20%. A meaningful conclusion obtained from the experimental results is that the best value of objective function can be obtained with the granular LSTM model. Also, the fastest rise of the objective function is determined when using systematic sampling.
Plots of the objective function: (a) granular KNN model, (b) granular SVM model, and (c) granular LSTM model.
For the Iran Sprint data set, stratified sampling and granular LSTM model can be considered to obtain a granular model with excellent performance.
Clickstream data for online shopping data set
The coverage curve of the Clickstream Data for Online Shopping data set is shown in Figure 11. As the sample size increases, the coverage also increases as a trend is shown on the coverage curve. The best coverage is obtained with the granular SVM model. In addition, when the used subset is obtained through system sampling, the fastest coverage rate can be obtained.
Plots of coverage: (a) granular KNN model, (b) granular SVM model, and (c) granular LSTM model.
Figure 12 displays the target function curve of the Clickstream Data for Online Shopping data set. We find that the value of “knee” in the granular KNN model is between 40% and 60% of the sampling, and the best performance is obtained at this time. The knee values in the granular SVM model and the granular LSTM model are between 50%, 60%, 15%, and 20%, respectively. Meanwhile, the best objective function value is obtained under the granular SVM model. The best performance increase is first obtained with systematic sampling.
Plots of the objective function: (a) granular KNN model, (b) granular SVM model, and (c) granular LSTM model.
Therefore, for Clickstream Data for Online Shopping data sets, a granular model with excellent performance can be obtained through systematic sampling and granular SVM model.
Concrete compressive strength data set
The coverage curve of the Concrete Compressive Strength data set is shown in Figure 13. As the sampling size increases, the trend of gradually increasing coverage can be observed in the Figure. The best coverage is obtained based on the granular LSTM model. Furthermore, the maximum coverage is first obtained in uniform sampling.
Plots of coverage: (a) granular KNN model, (b) granular SVM model, and (c) granular LSTM model.
The curve of the objective function is shown in Figure 14. The value of the optimal objective function of the granular KNN model is obtained when sampling 40%–60%. The size of the data subset required by the granular LSTM model is similar to that of the granular KNN model, while the granular SVM model requires the subset. The minimum sampling is about 40%–50%. Among them, the best performance is obtained in the granular LSTM model. The best objective function value is first obtained under uniform sampling.
Plots of the objective function: (a) granular KNN model, (b) granular SVM model, and (c) granular LSTM model.
Considering the above experimental results, under the Concrete Compressive Strength data set, a granular model with excellent performance can be obtained through uniform sampling and LSTM granular model.
Conclusions
In this paper, granular models are proposed and analyzed by selecting subsets with different sample sizes. Several regression models, including KNN, SVM, LSTM, are utilized in the development of different granular models. The optimization process is carried out by considering two conflicting criteria: coverage and specificity. A synthetic dataset as well as four publicly available datasets from the UCI machine learning repository are used for experimental studies. First, subsets with different sample sizes are obtained with several sampling methods. Second, a series of numeric models are built based on each subset. By using of the principle of justifiable granularity, interval information granules are constructed with the outputs of the numeric models. Experiments show that for different data sets, the optimal sampling scale required under different sampling methods is not the same, and the granular model that can obtain the best performance is also different. Therefore, we can get the best granular performance by using the best model and best sampling method of each data set. At the same time, the required time consumption is effectively reduced.
In further studies, the proposed granular models are anticipated to be applied to the analysis of time series on basis of information granules from different levels of abstraction. We are also interested in the segmentation of time series, which is decomposed according to the similarity of the time series, and information granules are subsequently constructed to ensure the model with high efficiency. To be more specific, the proposed granular models can be employed to predict the spread of malicious software 32 and COVID-19.33-35
Footnotes
Declaration of conflicting interests
The author(s) declared no potential conflicts of interest with respect to the research, authorship, and/or publication of this article.
Funding
The author(s) disclosed receipt of the following financial support for the research, authorship, and/or publication of this article: This work was supported in part by the Shaanxi Natural Science Project FundKey Technology of Top-level Design for Intelligent Coal Mine Construction under Grant 2019JLM-11 and in part by the Deanship of Scientific Research at King Saud University under Grant RG-1439-009.