
Abstract
The assimilation of Distributed Generation (DG) into the electric power system (EPS) has become more attractive as the world is following a trend to reduce greenhouse gas emissions by introducing more renewable energy forms resulting in high penetration scenarios. This high penetration of DGs brings several challenges to the protection philosophy of the EPS which compromises its reliability, availability, and efficiency. Under high DG penetration scenarios, conventional islanding detection methods (Idms) fail to detect an island as the grid loses its inertia to leverage a significant frequency and voltage mismatch necessary for Idms to effectively detect an islanding event. This has given rise to the birth of Artificial Intelligent (AI) methods that are found to perform better in islanding detection. AI Idms are computationally intensive and require a lot of data to operate accurately. Because the computational burden of these methods requires fast computing hardware, the current trend of AI Idms are integrated with Wide Area Monitoring, Protection, and Control (WAMPAC) system. This paper aims at reviewing all these Idms and the WAMPAC’s system latency when hosting AI Idms which are currently the best in islanding detection. This is done to determine if the WAMPAC system latency plus Idms computational time meet the islanding detection time specified by the IEEE Standard 1547 framework.
Highlights
Challenges of integrating Distributed Generations (DGs) is reviewed, and the islanding phenomenon is taken to be the area of focus.
Conventional islanding detection techniques are reviewed in detail
Wide Area Monitoring, Protection, and Control (WAMPAC) system is reviewed to establish if it can host islanding detection algorithms and still conform to the IEEE 1547 framework detection time of 2 s from the instance of fault inception.
Based on experimental results obtained by other scholars, advancements in Artificial intelligence islanding detection algorithms, the WAMPAC system can host some of the algorithms and still satisfy the IEEE 1547 framework.
Introduction
In modern times, technological advancements have led to an explosion in the production of consumer electronic gadgets and appliances, electric vehicles, and automation in both light and heavy industries. 1 This puts enormous pressure on the electric power system (EPS) and increases the greenhouse effect. 2 As an attempt to cut back and reduce reliance on natural resources, renewable Distributed Generations (DGs) are installed at residential, commercial, and industrial power distribution levels to relieve the EPS. 1 DGs are defined as a variety of power generating technologies in close proximity of where that power is used. These technologies include solar photovoltaic panels, wind turbines, natural-gas-fired fuel cells, and hydropower. 3 DG networks benefit conventional power networks and their load’s in several ways. DGs eliminates the need to erect transmission lines toward new settlements as they can be installed near loads and deliver reliable power onsite, this adds flexibility to the traditional centralized model. 1 DGs located not far from loads also reduces line losses, increases the reliability of the EPS, and cuts costs of having to erect new transmission infrastructure.2,4 DGs become beneficial in emergency response and disaster recovery strategies to supply power to affected areas easily. 3
However, integrating DGs into the grid bring challenges to protection schemes that were initially designed for unidirectional radial systems. 5 Some of these challenges are outlined in this paper but the core of the paper is anchored around islanding in which a disconnected portion of the distribution network continues to be energized by power from DGs. 2 Islanding can be a planned and intentional action taken with all the necessary precautions in place to reroute power or for routine maintenance. Islanding can also be unplanned or unintentional, which in most cases manifests due to a fault upstream on the EPS side 5 and that is the type of islanding this paper focuses on. Loss of mains (LOM) or unintentional islanding leads to damaged equipment and pose a serious safety threat to operatives.1–3 When a section of the distribution network gets islanded, that potion of the grid losses control of voltage and frequency as DGs are grid following in nature, meaning voltage and frequency control lies with the utility. 6 This may result in cascading trips as the islanded section will reach undesirable operating limits. 6 As such, there is a need for technological advancements for successful integration of DGs with the EPS to ensure stability, quality of service (QoS), and reliability to the ever-rising power demands without widespread blackouts and outages that may be due to a combination of interrelated events occurring on the EPS side or DG side.3,7 To archive this, power systems generation and substation automation must be improved as this will ensure visibility of all power generating sites, thus enhancing monitoring, protection, and control of the entire power system. There are continuous efforts to resolve unintentional islanding issues through early detection of active and reactive power mismatch as per IEEE 1547-2018 and IEC 62116. 4 However, all the existing IDMs have two prominent limitations especially under high penetration which results in near null power mismatch between DG generated power and its local loads. 8 These limitations are associated with difficulty in the threshold setting and the Non-Detection Zone (NDZ) region. 9 Furthermore, renewable energy resources are intermittent, this makes it even more difficult for threshold-based islanding detection algorithms to effectively pinpoint an island. 8
Different islanding detection methods (IDMs) in literature have been widely adopted all over the world. 6 These IDMs are categorized into remote and local methods, remote IDMs relies on the communication between the grid and the DG while local methods tap measurements and act directly at the PCC.1,5 Passive techniques rely on local power indices parameters in detecting islanding. 9 These techniques are fast operating, and do not affect the power quality of the utility, are affordable, easy to implement on both inverters based and synchronous systems. 1 Passive methods have some drawbacks that get amplified under high penetration systems as the DG generation and local load power demands get closely matched.10,11 Passive techniques tend to have a significantly wide non-detection zone (NZD), thus these techniques fail to detect the mode of operation when the system operates in that region.11,12
Active methods, mostly inverter-based methods inject a perturbation signal into the utility network and based on how the grid responds to the signal, islanding gets detected.13,14 Under grid-connected mode (GCM) the response of the injected signal will be negligible, and the system operation will not get affected while under islanded mode (IM), this response will display a large change in operating parameters due to loss of mains. 15 Even though these techniques have a very small or almost zero NDZ region,16–19 whenever applied to the system, the power quality gets degraded because of the signal introduced into the system. 19
Signal processing techniques have also become attractive over the years, this is because they are versatile, affordable, and can be modified easily. Data from the power measurement system is fed into signal processing algorithms were not so obvious features are extracted and processed using signal processing techniques to identify an island. 20 The cornerstone of this method is the use of Wavelets transform that enables time-frequency examination of the measured signal from PCC. In this manner, passive islanding detection methods can be enhanced by minimizing the NDZ as small voltage and frequency deviations can be detected. 11 However, WT may still fail to detect islanding due to low time-frequency resolution 21 and batch processing step 22 under noisy conditions.
Communication-based methods tend to have less reliability. They are expensive and require extra hardware like a transmitter located on the EPS side linked to the DG receiver through a communication link. To deal with this, researchers came up with intelligent IDMs. Intelligent methods are essentially of Artificial intelligence and data mining origin. 23 Unlike signal processing and communication-based methods, Intelligent islanding detection methods do not need predefined threshold setting and do not have an NDZ, 1 and for this reason, they outshine all of the method classes, this implementation is echoed by the recent research efforts that promote their use under high DG penetration scenarios. 24 However, they require a lot of data to produce a reliable and intelligently trained model with a lower generalization performance as they use data mining and machine learning classifiers. 1 WAMPAC seems to be the best system to have these AI islanding detection algorithms run on as it can provide over 2.5 k data samples per second from a single point of measurement. 6
In a WAMPAC system, local information is carried to a remote location for state estimations using Phasor measurement units (PMU) which are sensors deployed over a wide area to capture voltage, current, and frequency, rate of change of frequency measurements. All of this measured data is synchronized with universal time coordinated (UTC) Time 25 Phasor Data Concentrators (PDC) processes PMU data streams and monitor power indices. 7 Because the introduction of more DGs into the power system increases its non-linearity, and intense islanding due to data deficiency, PMUs eliminates this by being very accurate and advanced in data synchronization. Singh et al. 25 proposed a method that used Integer Linear Programming (ILP) for the Placement of PMUs to insure the entire observability of the system while using a minimum PMU number possible to detect Islanding. Castello et al. 26 the authors proposed an Active PDC with an adaptive with latency management of the data streams received by all PMUs on its periphery, this was tested in Castello et al.27,28 to establish its applicability in finding faults that may lead to Islanding using different PDC vendor technology. WAMPAC system latency is of major concern when considering the use machine learning based Idms since the Idms need some computational time. The 2 s window of islanding detection and isolation is very short considering that the WAMPAC system has the potential of having so many bottlenecks that may introduce more system delays. 29 The WAMPAC system is therefore reviewed at all levels to assess its applicability for islanding detection. Over the years, enough has been done in reviewing the merits and limitations of Idms,1,9,30,31 however, no reference details a comprehensive review of the state of the art in AI-based Idms as well as considering the latency and reliability of the WAMPAC system which most researchers are working tirelessly to implement. Henceforth, the contributions made by this paper are as follows
A comprehensive review of AI Idms to determine their benefits and expose their limitations with a strong emphasis on accuracy, computational burden, and detection time.
To review the WAMPAC system and determine if its latency allows it to be applicable for islanding detection scenarios while still conforming to the IEEE Std.1547-2018 time specification of 2 s.
This paper is organized as follows: Section 2 looks into some of the main challenges in integrating DG into the utility. Section 3 narrates the islanding phenomenon as the main problem, explores the NDZ as a method of accessing the performance of Idms, looks into different standards for islanding detection, and lastly reviews all the existing Idms in detail. Section 4 reviews the WAMPAC systems, all its components to expose its vulnerabilities for reliability assessment and WAMPAC latency analysis warps up this section. In Section 5, conventional and AI synchrophasor-based Idms are discussed and compared to assess the marriage of Idms and the WAMPAC system. Section 6 concludes this paper.
Challenges of distributed generation integration into the grid
Reverse power flow
Introducing DGs at the load side is encouraged since it relieves the EPS system as it can handle some if not all its power demands, for example, if it’s a photovoltaic system, this may depend on the time of day and the available irradiance. 32 While this is a great benefit, it reduces the line loses in the transmission line and improves the voltage profile of the system if the DG produces more power that exceeds the local load demands, now power starts flowing toward the substations, the overall performance may get compromised as voltage limits may be broken adding stress on the equipment, so there is a tradeoff in levels of DG penetration that must be taken into consideration when designing the network and DG sizing. This Reverse power flow contradicts the radial design of the EPS unidirectional protection due to the change in voltage gradient in the line. 33
Recloser-fuse coordination
A fuse deployed for feeder protection operates during permanent faults in the feeder line within its set reach, however for transients big enough to raise system flags, 32 the recloser should disconnect the feeder and start the counter to allow the fault to clear then reconnects it again to resume normal feeder operation, however, DG presence in a radial distribution feeder results in the loss of coordination by the fuse recloser unit, this is the case as the fuse may get exposed to more fault current than rated and melt before the recloser kicks into action to disconnect the feeder there the reliability of the network gets lost. 5 To coordinate recloser-fuse properly, Coster et al. 34 suggests the fuse must follow the recloser in their response to a fault so that the recloser gets to disconnect before the fuse sees the fault current.
Islanding
There is a phenomenon in which part of the utility network is disconnected but the DG remains connected, this is Islanding. Islanding can be intentional or unintentional, in this context, this paper is focusing on unintentional islanding which usually due to a fault in the network. Islanding is also referred to as Loss of Mains (LOM), 32 the biggest problem of islanding is that voltage and frequency spiral out of control of the utility, and in inverter tied systems, and the inverter continues to send power toward the point of common coupling (PCC). If an embedded generator or a photovoltaic system continues feeding the grid feeding arcs, faults may not get cleared, reclosers may fail, re-striking arcs may occur and circulating currents may occur and damage the systems further. 4 It is also important to note that since voltage control is in the DGs will then fail to keep the voltage within manageable limits and the frequency will also spiral out of control since it might follow the inverter. 4
Single phase connection
Domestic DGs are generally of a small scale and even though some are designed to input single phase power into the utility network, in some cases lack of regulation in single-phase power input, this has an adverse effect on the grid as it disturbs the balance of three-phase current, then all of a sudden there are stray currents in the system, these stray current are detrimental to all domestic motor application like hovers and washing machines as they damage winding insulation by overheating. 35
Grounding
In an EPS, grounding should be continuous all the way to the source however integrating DGs into EPS results in multiple grounding current path being created as pointed out. 36 If a transformer with delta wye configuration is connected to a DG, and this transformer is grounded on the wye, utility ground faults may lead to ground currents propagating both directions, to the utility and the DG transformers. This also prevents a reliable and smooth operation of the system. Arritt and Dugan 37 different interconnection transformers can be used with low voltage relays to eliminate the voltage phase shift while monitoring primary side voltages at the same time. However, these interconnection transformers cannot effectively ground the source when in islanding mode even though both windings may appear to be grounded with a solid connection since the ground reference has shifted to be at the generator or any load connected after it. 36
Economical challenges
DGs have become very attractive especially when considering their low greenhouse gas emissions, however, considering DG installation and running costs at both domestic and industrial levels as opposed to utility costs yields very interesting results. The range for capital and running costs for large DGs is approximated to be $ 0.07–0.15/kWh while the utility will only incur $ 0.02–0.04/kWh as a marginal cost for the same load. 38 This is because the utility uses the already available infrastructure to meet the additional load demand. The utility also has a better comfort margin in relation to power generation, transmission, and distribution which is one of the most important determinants in DG economic assessment. 38 Based on these reasons, DG installations are not seen as an economic solution, especially when the utility is favored by the site, regulatory, and political climate. However, small-distributed grid-tied PV systems in the US have some Levelized cost that is competitive with utility rates. 39 This is because technological advancement and scaling have led to a reduction in solar PV module prices. 39 This price reduction is also seen in battery technologies as shown in Figure 1 which projects all the battery associated costs from 2016 to 2030.
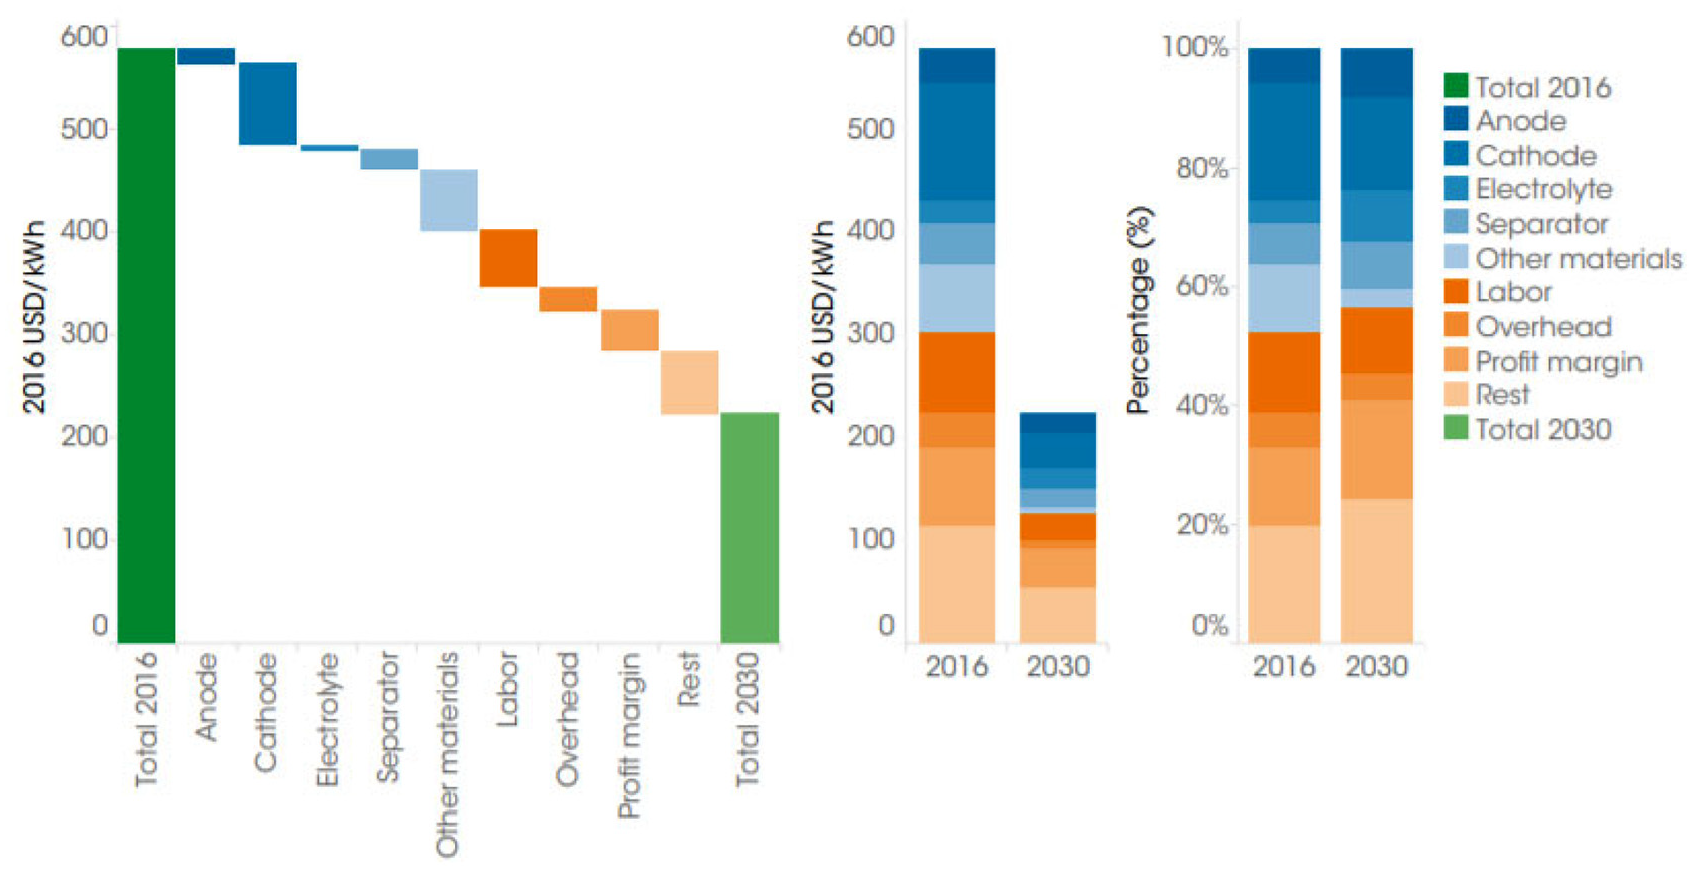
Potential cost reduction for lithium iron phosphate battery energy storage systems, 2016–2030. 40
Islanding phenomenon
Islanding occurs when a DG persists to feed a portion of the EPS systems while it is disconnected from the main power grid as in Figure 1, this is referred to as loss of mains (LOM), and this can be intentional or unintentional.
6
As it has already been established, islanding detection becomes particularly problematic under high penetration where the utility does not have the inertia to leverage the frequency divergence at the instance of disconnection, DG penetration level (
The DG installed capacity is the total sum of all the maximum outputs of each DG in the network and the capacity factor is the ratio of the produced energy by the DG in a given time, to the energy that the DG could produce for the same time duration when running continuously at full power.41,42 With intentional Islanding, the main aim is to protect the microgrid from system-wide disturbances while unintentional islanding shown in Figure 2. Islanding occurs due to an upstream fault and therefore the grid protection system kicks into action disconnecting the affected part of the grid henceforth there is a need to halt any supply into that section from the DGs. 43
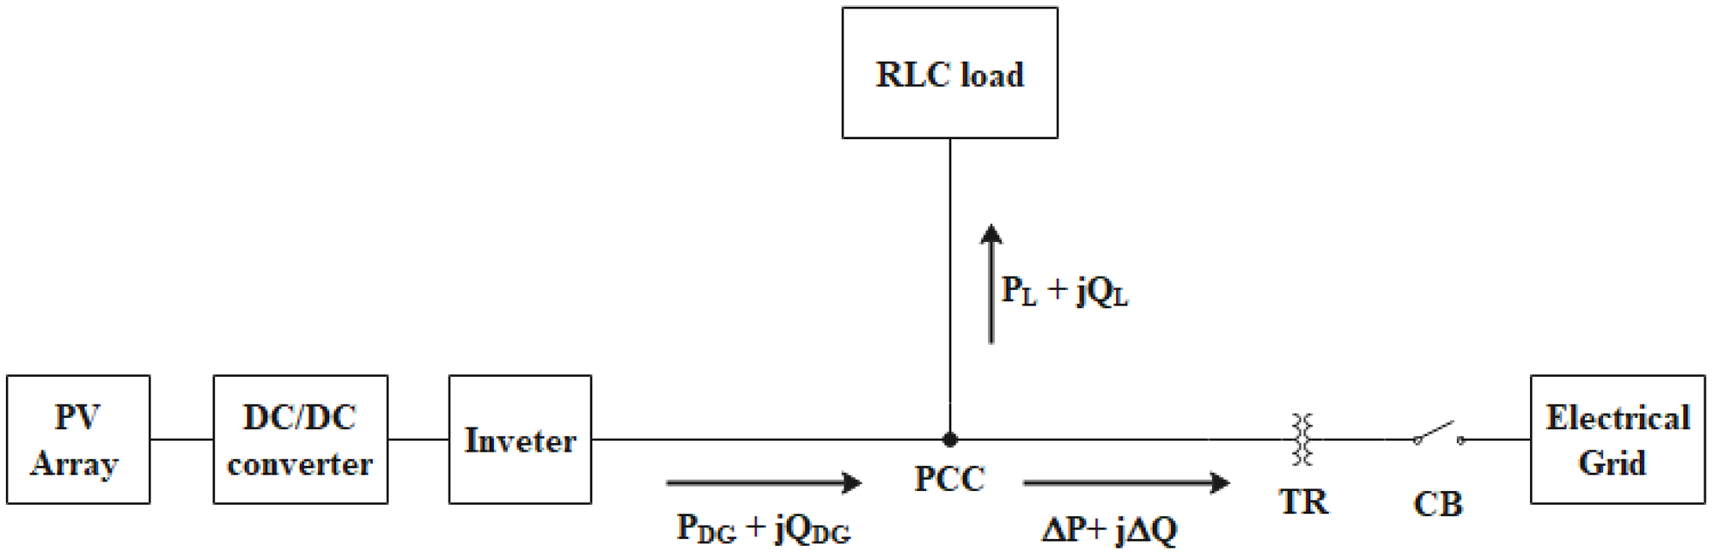
Islanding phenomenon. 44
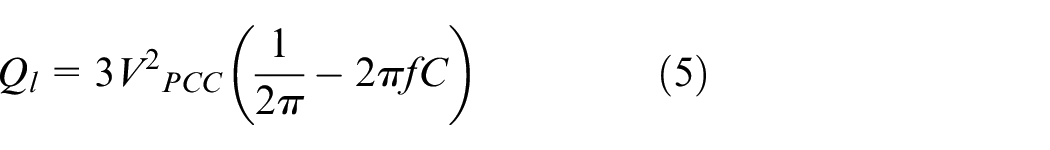
Unintentional Islanding results in loss of control for both voltage and frequency, the Island settles at a new operating point with active power and reactive power balance between the local load demands and the DG power supply.
4
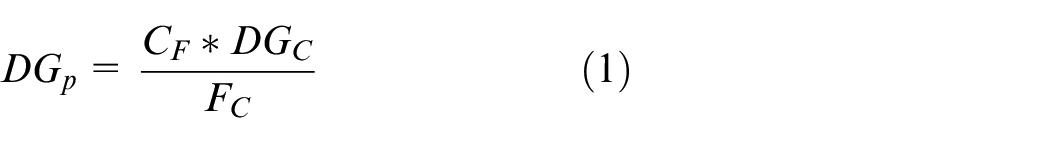
The resulting new difference between the active and reactive power generated and dissipated by local customers is the active


where
This power mismatch at the Point of Common Coupling (PCC) provides a window of opportunity for different islanding detection methods to identify any deviation that satisfies the islanding detection criterion. 45 For active power mismatch at the time of disconnection from the utility, the utility will affect the voltage magnitude at the PCC while reactive power mismatch affects frequency. 4 This is true if a parallel RLC load is assumed as a local load then active power and reactive power experienced at PCC is represented as follows
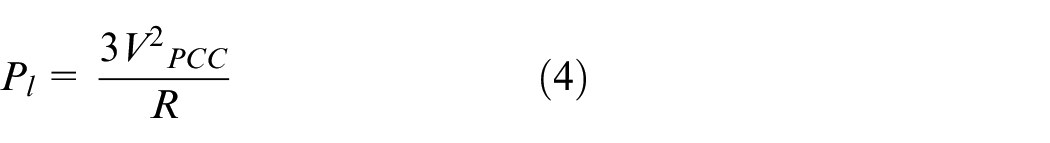
As such, when there is an unpredictable operation the systems may reach unacceptable limits, rapid and high back to back transients may damage local load customer equipment especially when reclosing into an island, 46 operatives working to restore the faults in the EPS are also in danger even when they perform isolation lockout procedure since there may be a power source they are unaware of. IEEE standard 1547-2018 dictates that any islanding event should be detected and isolate the affected section within 2 s.4,47
Non-detection zone
The Non-detection zone (NDZ) basically lays out an active and reactive power mismatch relationship of the DG power generation and dissipated power by the local load for which the islanding detection method at hand will fail to successfully identify whether the system is in Islanding Mode (IM) and a Grid Connected Mode (GCM).20,48 How well an Islanding detection method performs is defined by the (NDZ) concept.
4
Based on this concept, a large mismatch between generated power and dissipated power results in most techniques is sufficient, especially passive methods, but as it shrinks, the variations of frequency and voltage at PCC get drastically reduced making it impossible for passive methods to detect islanding condition.
47
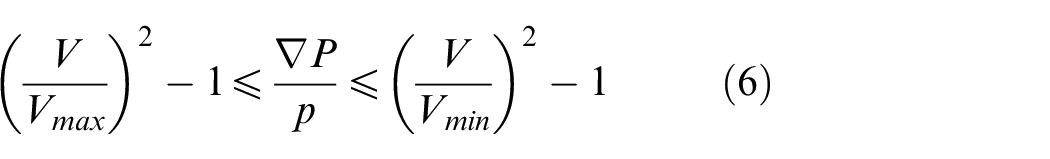
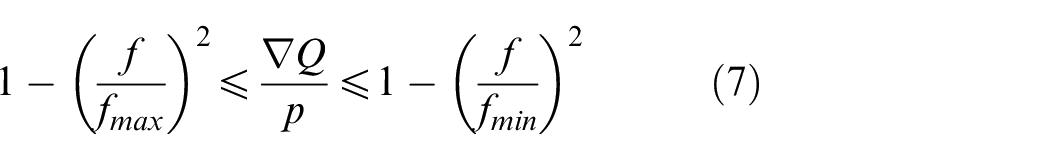
The NDZ thresholds for islanding detection are set by voltage and frequency amplitudes that form the extremes that should not be exceeded. These extremes create an NDZ region shown in Figure 3 and the corresponding UOF and UOV forming the NDZ thresholds at PCC can be expressed as in equations (6) and (7) where
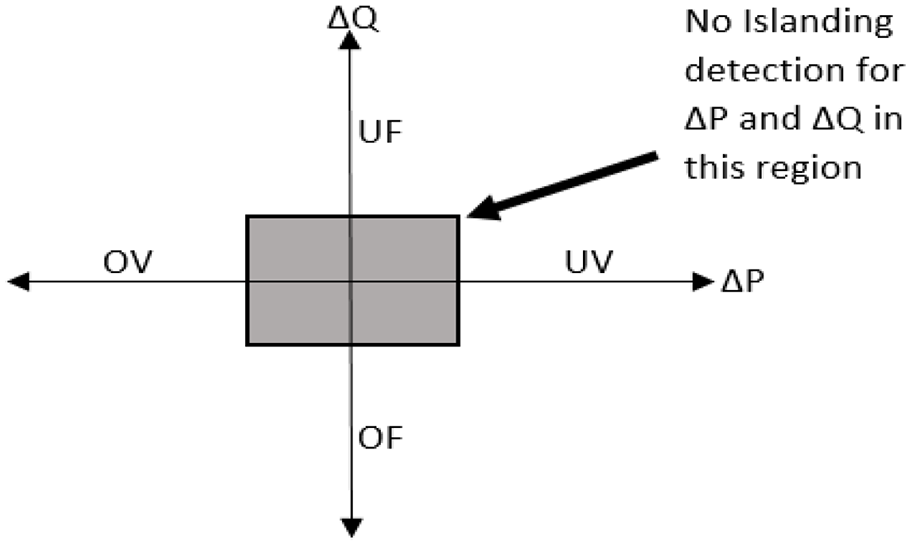
Non-detection zone.
Islanding detection standards
Islanding detection standards serve as guidelines for assessing performance evaluation of Islanding detection methods.
50
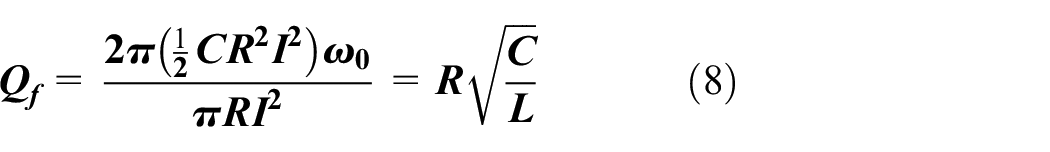
These standards specify with emphasis on operation, interconnections, and control of power indices like voltage and frequency for DG units, islanding detection times, the direction of power flow identification, safety, and maintenance. The main parameters governed by these standards are compared in Table 1 with consideration of the load Quality factor and detection time. IEEE Std 929-2000 specifies that the Quality factor is the ratio of the energy dissipated per cycle to the maximum energy stored at nominal frequency multiplied by
Islanding standards parameters.
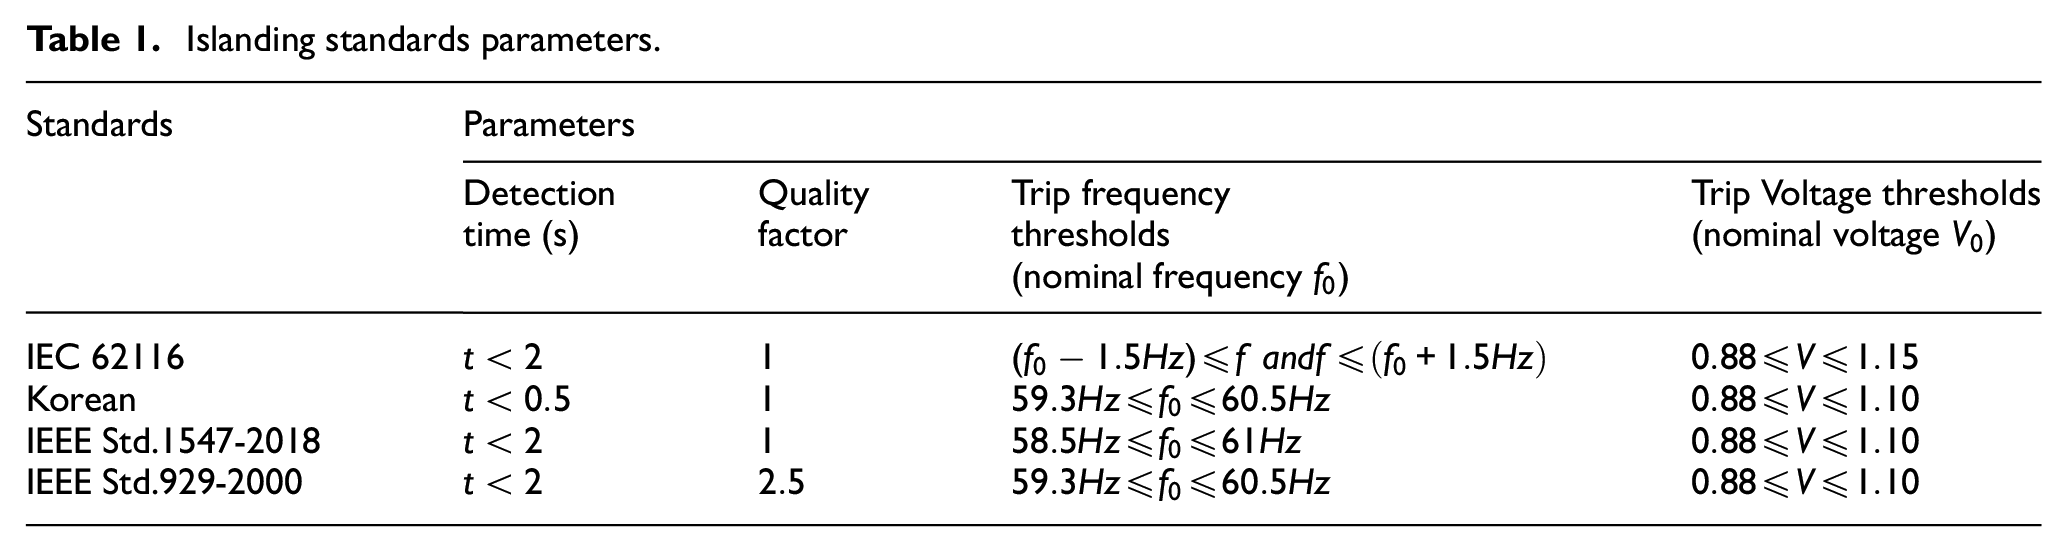
These standards align with the islanding detection time of 2 s from the instant of fault inception except the Korean standard. IEEE Std.1547-2003 was superseded by IEEE Std.1547-2018. The latter outlines guidelines on active voltage regulation, voltage ride-through capabilities, and interoperability. 51
Islanding detection methods overview
The need for DG installation at both the industrial and domestic level is growing daily. This has caused a significant increase in intensive research to develop and improve islanding detection methods. Islanding detection methods are classified as; remote and local Idms, Remote techniques further break down into Intelligent, communication-based and signal processing-based IDMs, with each having several techniques under it as shown in Figure 3. Local techniques on the other hand divides into two major classes; Active and Passive techniques. Active methods get further divided into Rotating and Inverter based Idms while the Passive class of IDMs splits into Convectional and Modified Passive IDMs. Modified Passive are the first evolution of islanding detection methods. In recent times most of these methods have blended to produce hybrids that violate most of the classification in Figure 4.
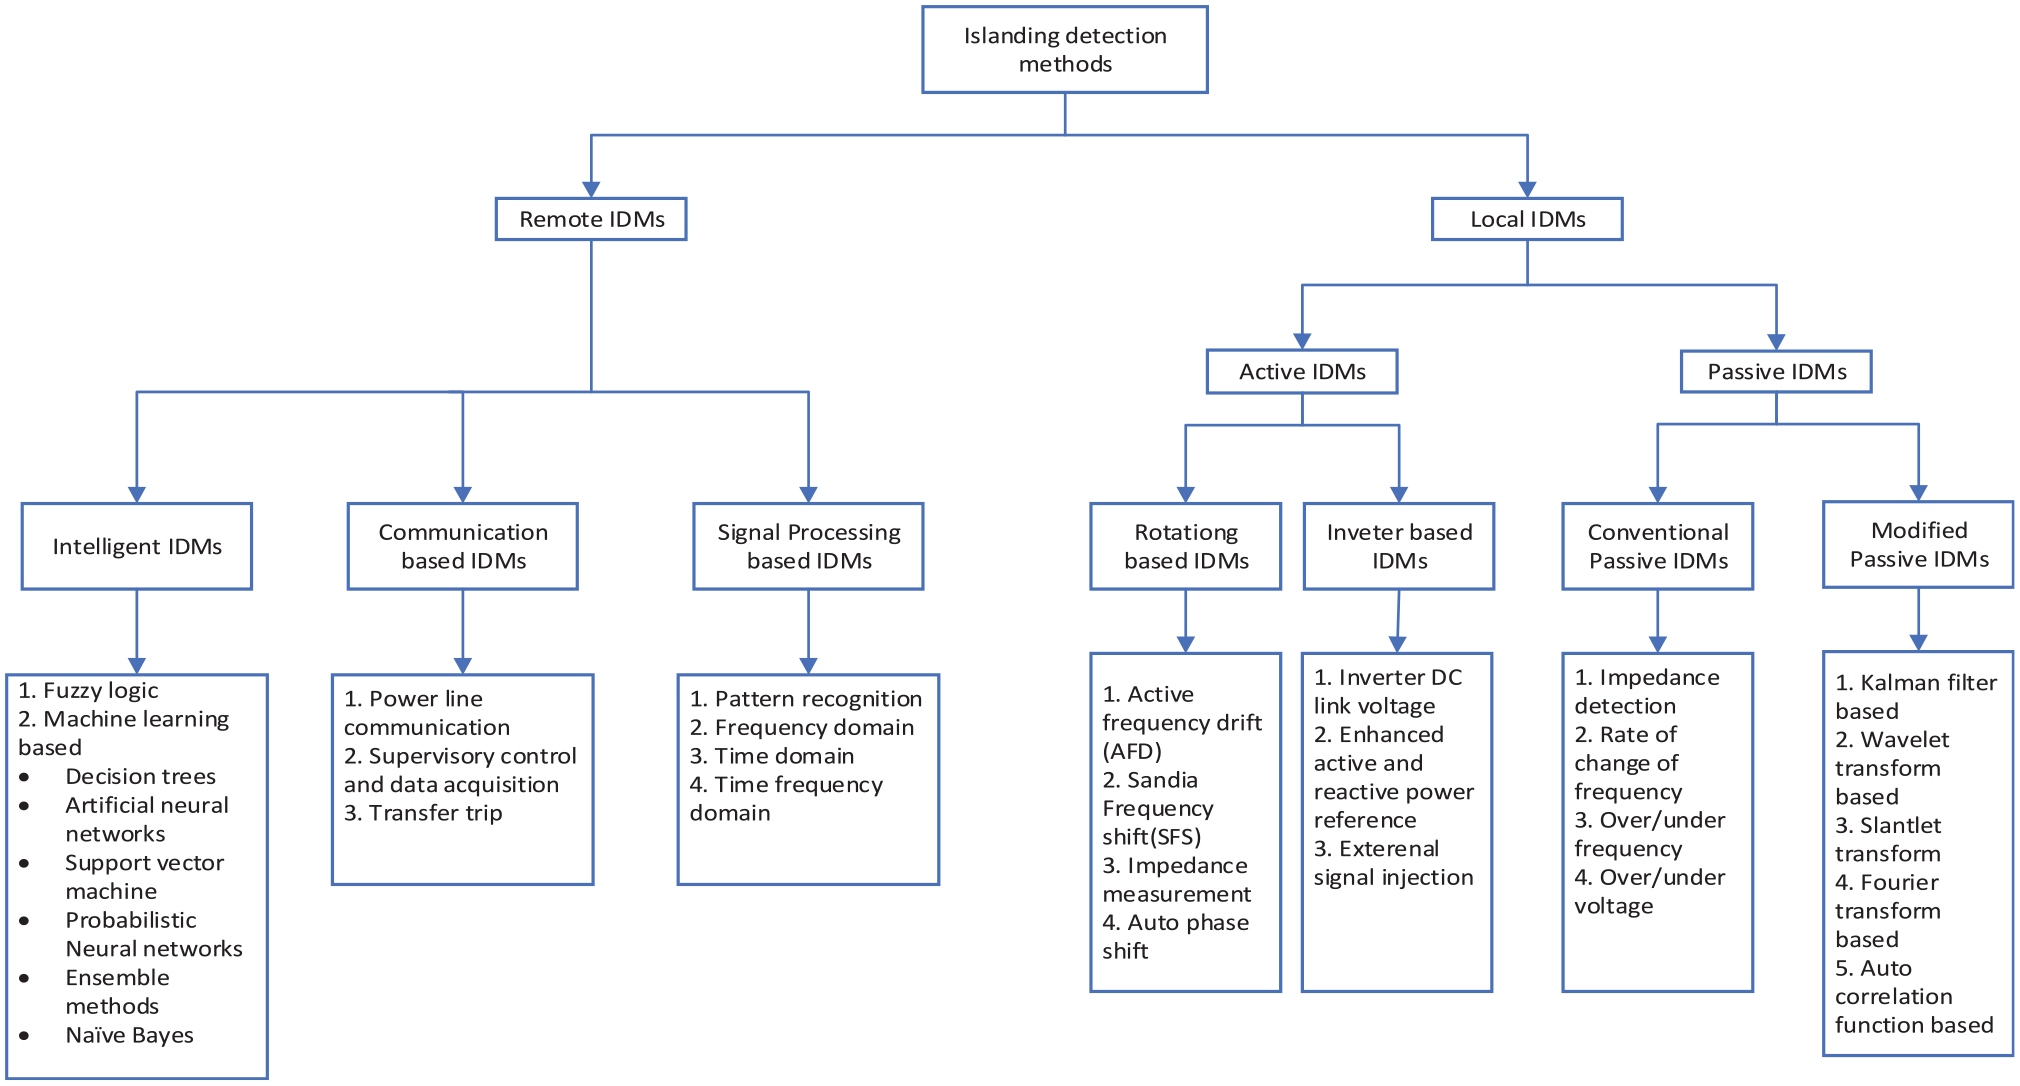
Classification of islanding detection techniques.
Passive methods
Passive methods detect islanding conditions through locally monitoring network parameters like voltage, current, frequency, and total harmonic distortion (THD) to identify any abnormalities at PCC. In most cases, these methods will issue a trip signal when the disturbance is large. The common methods are based on over/under frequency, rate of change of frequency (ROCOF), phase monitoring, over/under voltage, and Voltage Vector Shift (VVS). ROCOF and VSS are the two predominant methods in the industry, both methods depend on the change in power parameters should the grid be disconnected, which then increases or decreases the speed of the governor which depends on the DG power generation and the load power demand in the island.
52
ROCOF does well when there is a large frequency deviation, with a common setting

where

Where
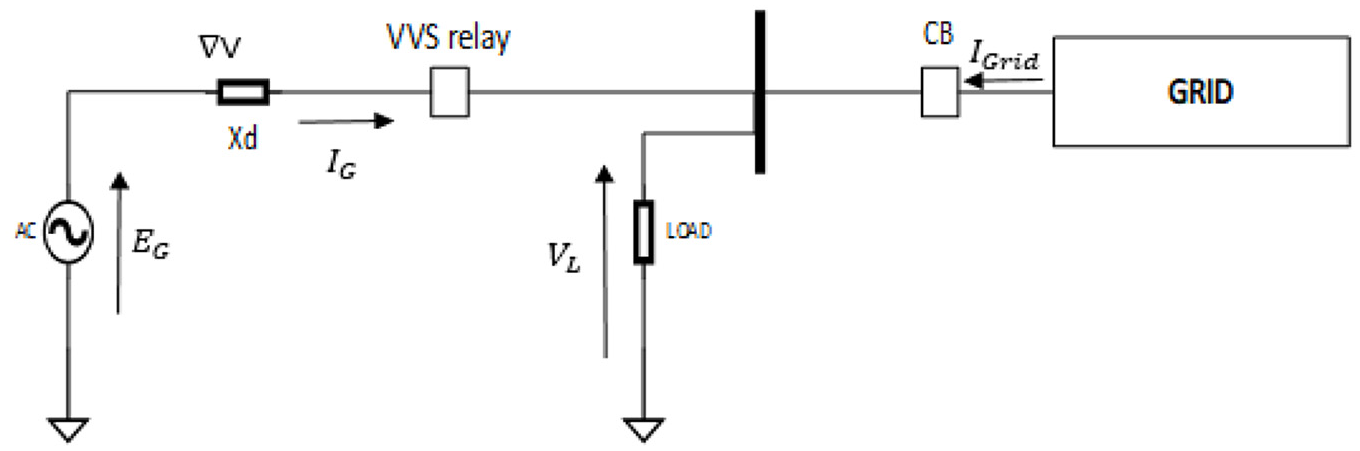
VVS method.
This method fails to detect an island under an insignificant displacement angle which is the case in high penetration setup. 52 Even though these methods are generally easy to implement, fast operating, and do not affect the power network, 47 they have a large Non-Detection Zone. There have been some efforts using advanced signal processing toolboxes to decrease their NDZ in Dehghani 57 which uses Wavelet Transform (WT) and Slantlet-Transform (ST) but these methods are computationally intensive.
Modified passive methods
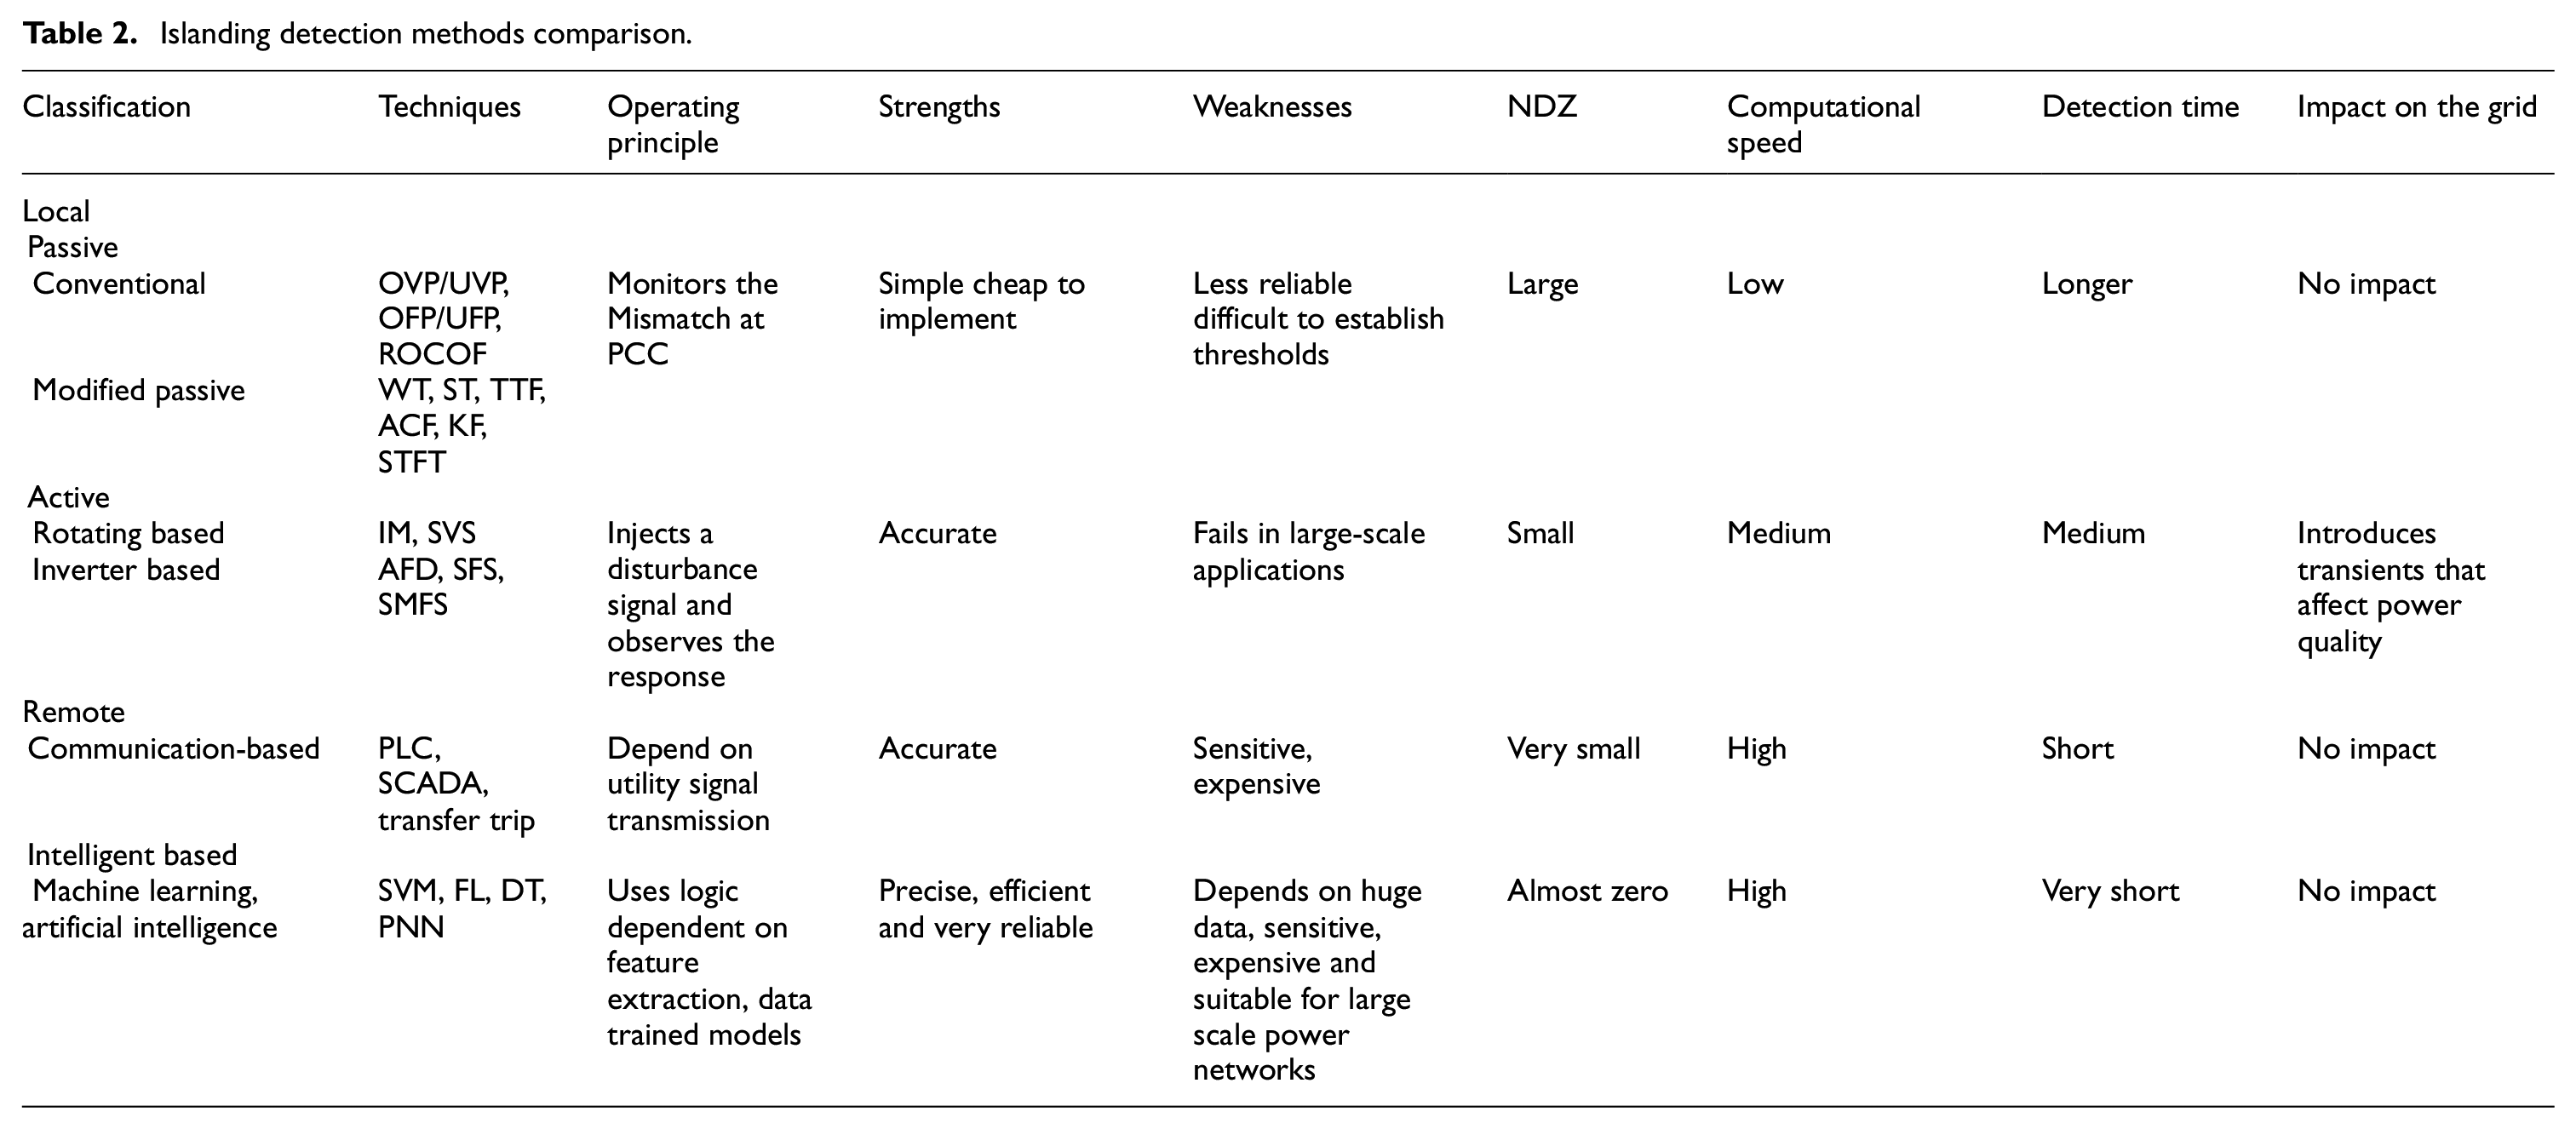
This class of detection methods employs different signal processing toolboxes and techniques intending to improve the NDZ of passive methods by reducing it as well as reducing the islanding detection time. These methods can be implemented on frequency, time, and frequency-time domains using Slantlet Transform (ST), Wavelet Transform (WT), Autocorrelation Function (ACF), and Time-Time Transform (TTF). 1 Researchers have used these tools to come up with fast operating and efficient methods, the effectiveness of their methods is presented in Table 2 in comparison with other methods.
Islanding detection methods comparison.
Active methods
The working principle of an active inverter-based islanding detection scheme relies on a small disturbance being injected into the grid and how the grid responds to the disturbance is used in detecting islanding conditions.36,58 Active rotation-based methods use the following parameters to identify an island: active frequency drift (AFD), change of impedance, and slip-mode frequency shift (SMS). 46
Slip-mode frequency shift is one of the most applicable methods in WAMPAC, 59 the inverter current phase angle changes with respect to the changes of frequency at the PCC, this relationship is dependent upon the positive feedback which the SMS algorithm applies to the angle current output of the inverter to identify islanding.60,61 The feedback applied can be expressed as follows
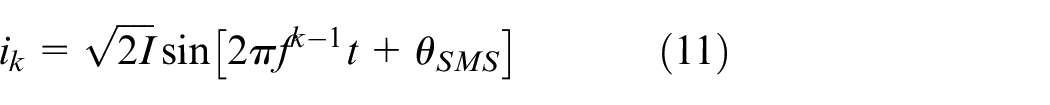
where
The SMS curve equation can be expressed as
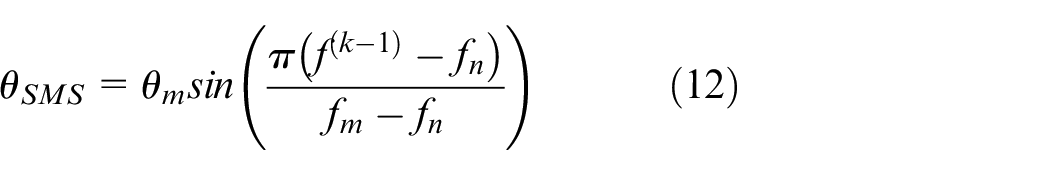
where
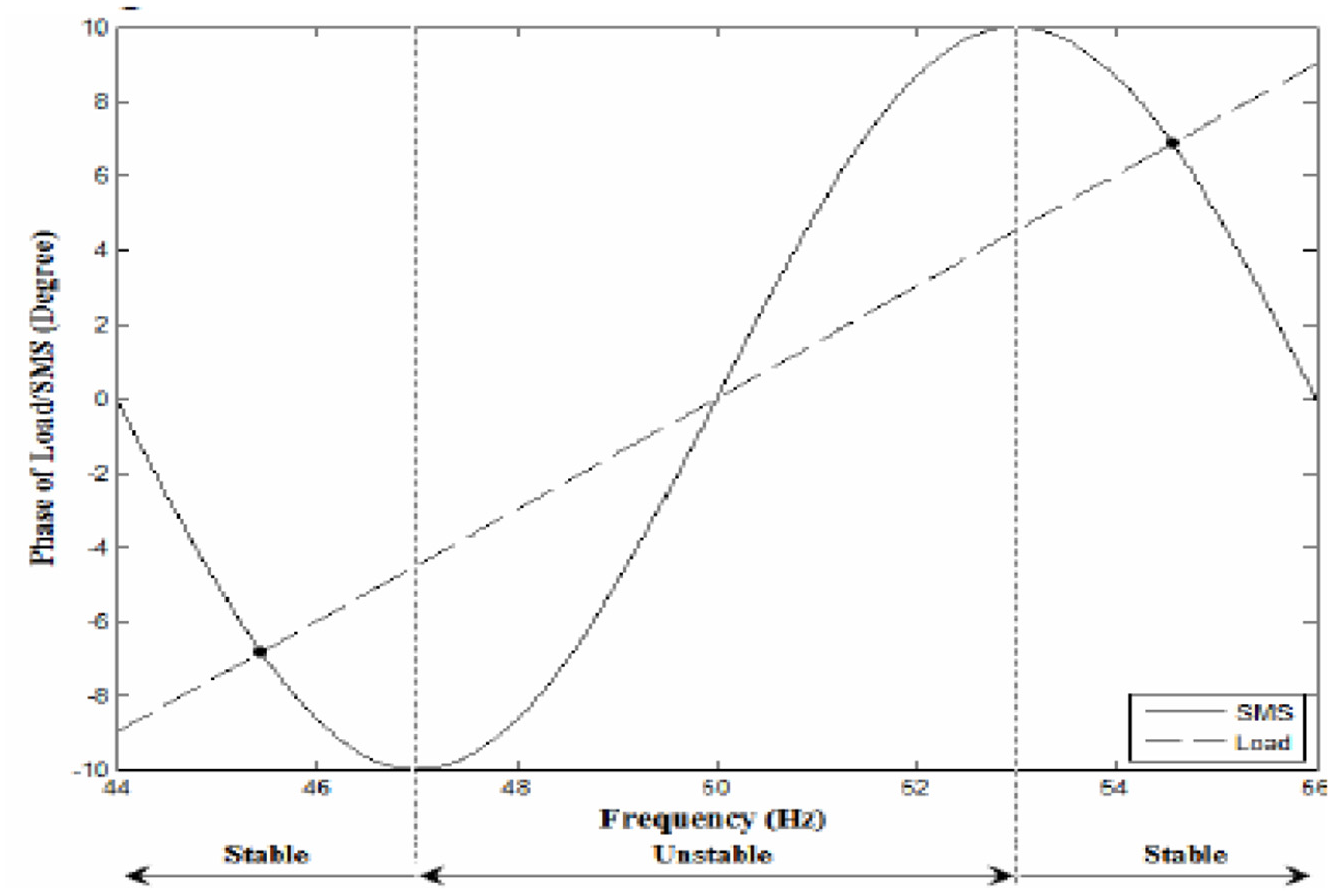
Local load and DG phase response. 60
Active frequency drift (AFD) is a method in which a small period of zero time is added to the inverter output current.
62
In zero or dead time (
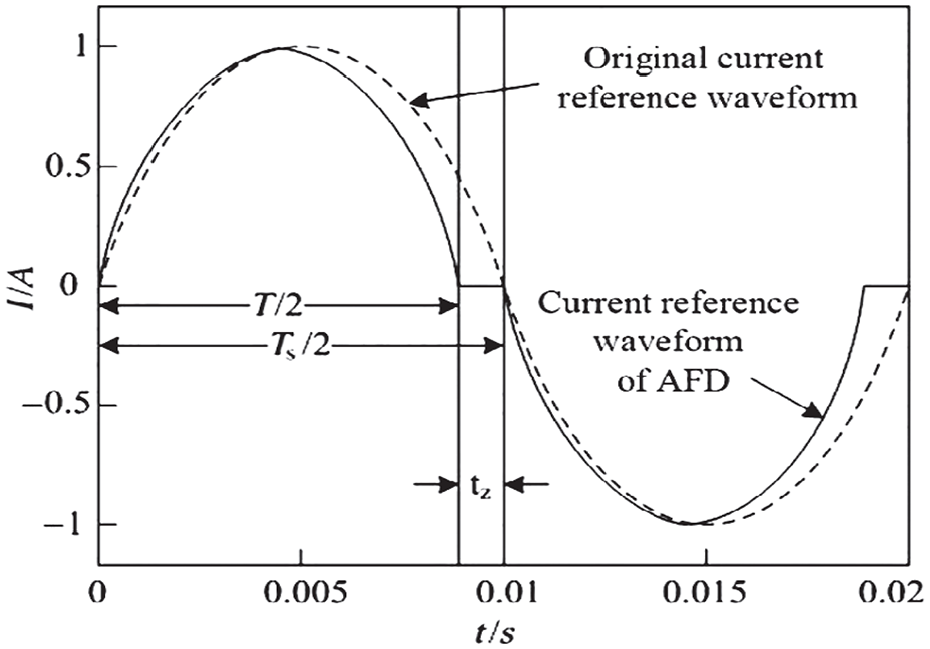
AFD methods waveforms distortion. 62
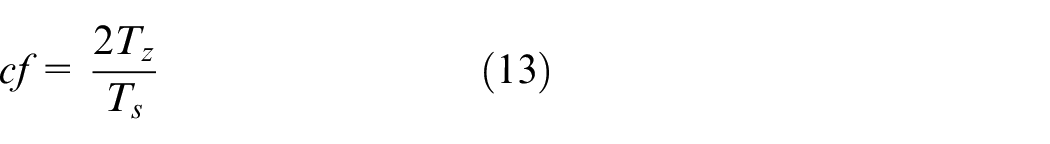
The NDZ of this method is dependent on the chopping fraction value used, if it less than 1%, then the NZD of the frequency bias is like that of the SMS method. For reactive power loads, an increase in the cf value results in NDZ shifting toward capacitive loads while loads with high reactive power do not shift significantly in PV integrated utility systems.31,65
In grid-connected mode (GCM) the DG can introduce some frequency, voltage, and phase angle disturbances into the grid that may cause a deviation from normal operation. This deviation should be rectified by frequency and voltage control on the grid side.36,66 However, there are large impedance faults that the voltage magnitude, phase angle, and frequency deviations fall outside controllable threshold and therefore islanding occurs, this is where these techniques are deployed to act. 67 Active methods have an NDZ that is almost, but their main issue is that they have a more complex power and tends to affect the delivered quality. 47
Communication-based methods
Communication can also be used to detect Islanding between the GD and the Utility. There are three methods, Power line communications (PLC), Signal emerging from the disconnection, and Supervisory control and data acquisition (SCADA). 68 PLC was first introduced in the 1950s, it is considered the most economic technology for data communications in power systems since it uses the same power systems infrastructure. PLC has few drawbacks though, it can only operate on simplex mode, has high noise levels, signal distortion, attenuation and has a narrow data bandwidth than the required for WAMS applications which have made it impossible for a widespread adoption. 4 In a PLC setup, a continuous signal is transmitted via the power line from the grid to a receiver that is connected to the DG. In the case of LOM, the DG receiver will not receive the signal hence islanding will be detected. Another method is the signal produced by the disconnect. This method relies on the assumption that a recloser has a transmitter which sends a disconnection signal to the DG in a case of loss of mains, this method is known to have negligible NDZ but its greatest limitations are high implementation costs, hardware issues, and low reliability due to communication failure. 69 SCADA deploys voltage sensors through the DG network and those sensors feed the SCADA system parameters for real-time monitoring and raise islanding alarms. 69 However in recent literature, PDCs demonstrates protection and control abilities the grid at both distribution and transmission levels, thus saves time and protection decision and actions are taken quickly, thereby eliminating the need to directly send all the data to the SCADA or Energy management systems (EMS) as it is sufficient and fast to send an alarm online to higher levels and further information for event playback and system data storage can be distributed later. 69
Intelligent islanding detection methods
Intelligent islanding detection methods mostly utilize data mining and machine learning techniques. They normally do not require threshold settings to identify an islanding phenomenon. 1 Intelligent methods have the capability to solve an objective function with more than three power indices in a multi-objective problem often going through many iterations to get to the solution. It is for this reason that they are computationally intensive. In most cases to get around this problem, the voltage or current signal harvested from the PCC is input to offline data training and feature extraction algorithms, this also saves time, the output of this process is a trained intelligent classifier model that is then used with the online process to make islanding detection decisions.
Machine learning islanding detection methods
Machine learning started as an obscure topic and sparked a lot of curiosity among engineers and scientists. Machine learning is a subfield in computer science in which computers can learn without a clear-cut set of lines of code to direct them on a stepwise learning process. 70 Even in that case, a clear distinction must be made that machine learning depends on the upfront programming of the computer and does not follow direct commands to carry out a task. 70 It uses Self learning which forms the central pillar of machine learning. 71 Self-learning uses statistical modeling for pattern recognition to enhance performance and detect anomalies from the input data. Machine learning has Reinforcement, Supervised, and unsupervised learning as its main categories as shown in Figure 8. Supervised learning techniques or induction models deciphers patterns by connecting and evaluating relationships between properly labeled data, its variables, and the known outcomes.71,72 Unlike supervised learning where the algorithm exploits known information and the expected outcome is known, unsupervised learning is the total opposite. The learning process is performed using unlabeled feature vectors, unsupervised learning algorithms decipher underlying patterns from the input data, and creates labels by grouping similar patterns together. Supervised learning Idms are the most common in literature and most of them are reviewed in detail in this paper.
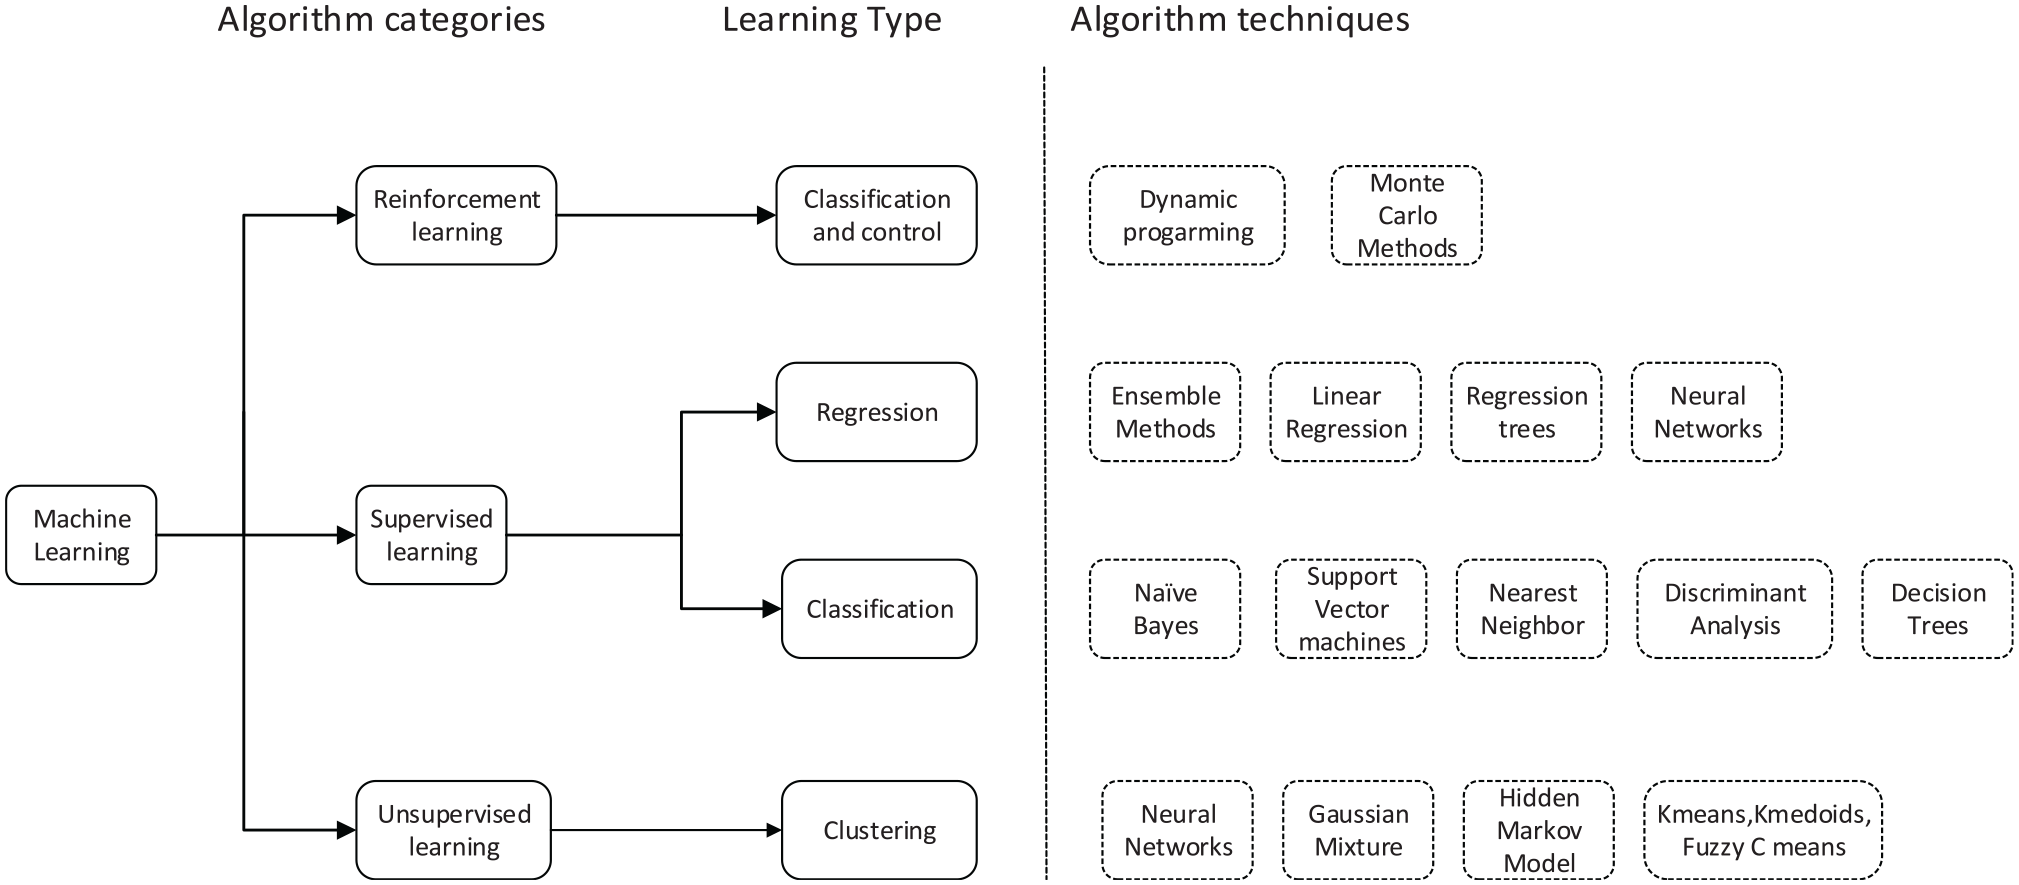
Machine learning categories.
When using machine learning for Islanding detection purposes in power systems, just like most of its applications, the data set is split into three batches, the training and the test dataset. The training data set is fed into a machine with a machine learning algorithm that carries out an analysis to identify patterns in the data, the output of this training process is a machine’s data model. This model can be used to predict future islanding conditions but first, it must be tested for accuracy since the model might have some assumptions that will result in wrong predictions.73,74 It is for this reason that after successfully developing the model using the training data, the remainder of the data; the test data set, is used for cross-validation and testing the accuracy of the model before it can be deployed. 74 The learning process workflow is summarized in Figure 9.
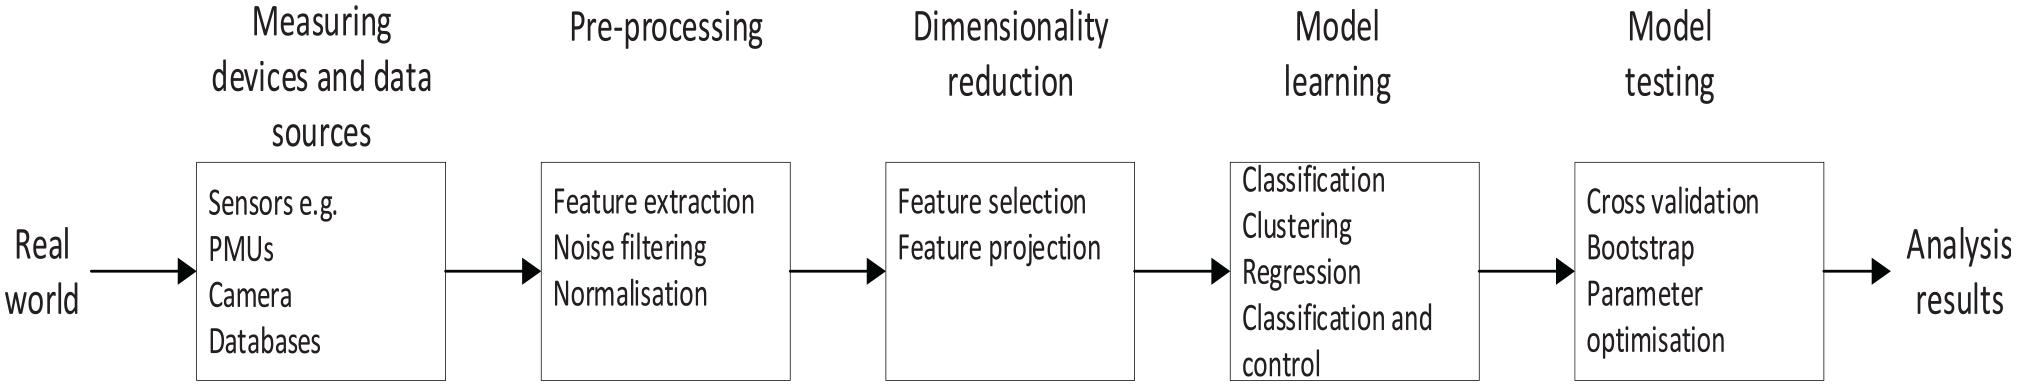
The learning process workflow.
Classification methods
Support vector machines
One of the very first formal publications on Support vector machines was on recognizing optical characters. At first glance, SVM can be confusing as one may think of machines but it has no hardware. SVM is a classification method that unifies data science, mathematical optimization theories, and statistical methods with applications ranging from pattern recognition to Natural language processing (NPL).
26
SVM as a classification method works by fitting a boundary/hyperplane through points separating them based on classes they belong to Abdelsalam et al.
75
To put this in perspective, an optimal hyperplane solution of a constrained linearly separable optimization problem given by equation (14), where

The class separation process is such that the evaluation of the decision boundary function
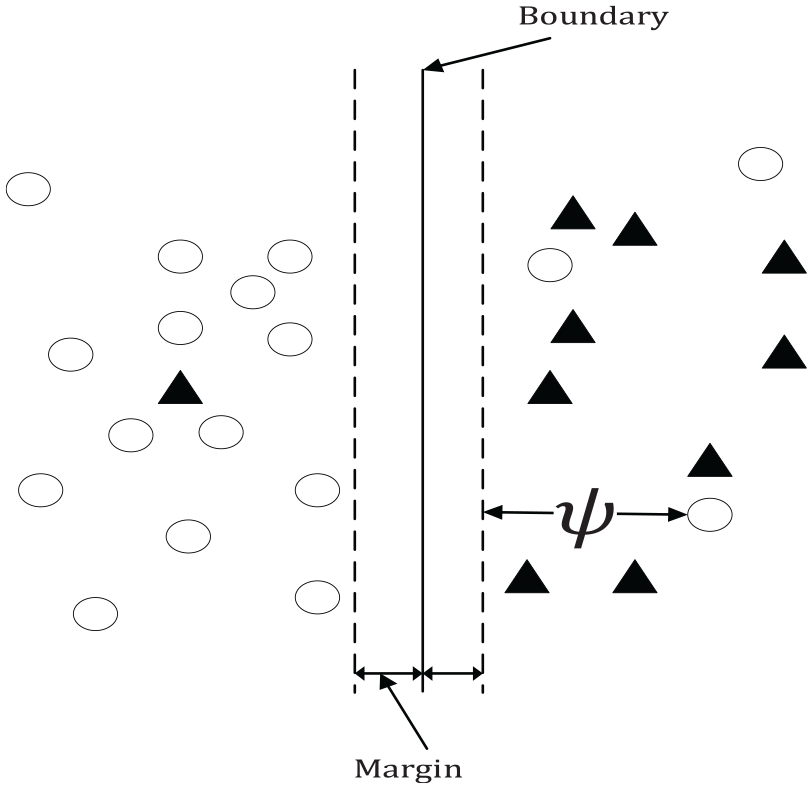
SVM misclassification example.
So it becomes clear that the SVM algorithm aims to optimize the classification process by maximizing the margin in linearly separable classes and use a kernel trick approach to separate classes according to non-linear boundaries.25,29 Maximizing the margin achieves the lowest misclassification and avoids converging to local minima. 27 So, in consideration of SVM islanding detection algorithms, if the classes are linearly separable, which is quite rare, we will assess them based on the notion that the most sensible selection of the hyperplane classifier is the one that ideally leaves the maximum distance between classes. The second criterion investigates the number of feature vectors within the margin. The best hyperplane will be the one that has minimum contaminants within the margin as this ensures that the chosen hyperplane has the lowest penalty cost aggregate. 29 In Figure 10, ψ shows the penalty charged for every misclassification error, and the aim is to minimize all this misclassification to achieve the best separation of classes.
As for the islanding problem at hand, consider a binary classification of normal power grid operation and islanding scenarios as considered by Ashish et al. 30 the SVM mathematical equation (15) is the optimal decision boundary for the GCM and IM classes.

The weight vector normal to the hyperplane is represented by

Otherwise, islanding data belong to the class

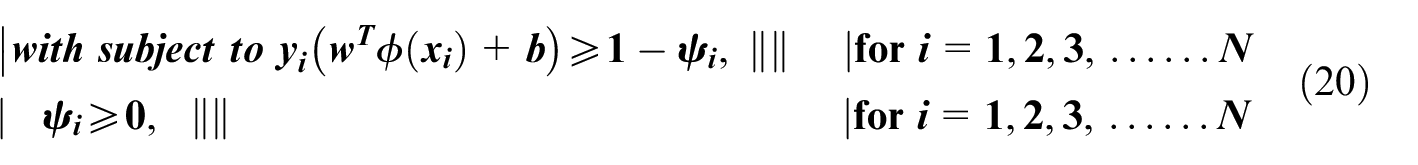
As mentioned already, SVM is a larger margin classifier that aims for a hyperplane with the maximum Euclidean distance from the closest training data point, while dealing with non-separable classes, Castello et al.
28
and Ashish et al.
30
extended the concept in equation (19) by introducing a slack variable ψ and the regularization parameter

Naïve Bayes
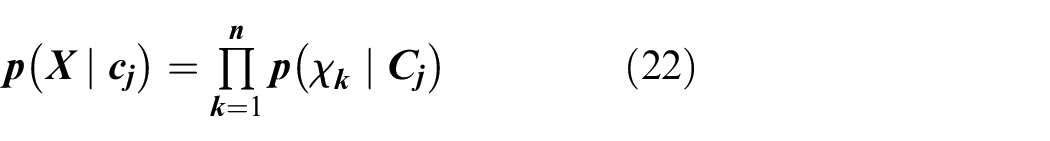
Naïve Bayes is a statistical method from a family of probabilistic classifiers exhibiting strong (naïve) independence assumptions. This independence assumption is very useful because Naïve Bayes classifier is widely used in classification application with high input data dimensionality
76
and this makes it very difficult to calculate the joint probability
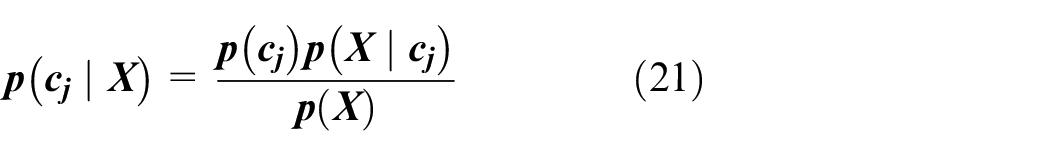
where the posterior probability
Decision trees
Decision trees are used to classify the dataset into different classes of the response variable. The response variable may be of discrete-valued target functions, each learned function can be symbolized by a decision tree. 78 A branch emanating from a node resembles possible values of the attribute. To classify an event, the process starts from the tree root note, test the node function attribute, the descends forming a tree branch corresponding to the attribute value. 30 This process of testing each attribute at each node forms a decision flowchart. The decision tree path ends with a leaf (Terminal) node where the make-up/conditions of the leaf node predicts the target variable.30,79
The work of authors in Iman et al. 80 is summarized in Figure 11, where a sychrophasor based islanding detection relay is developed. In this method, the implemented DT uses a number of indexes including Entropy and Gini criteria. For the islanding detection part of the relay, voltage and current from PMUs are fed into a DFT processor. Several extracted features consisting of frequencies, magnitudes and angles are used in DT based relay which are used at the leaf node for IM and GCM detection. The proposed method achieves fast detection and clears the fault at 1.5 s.
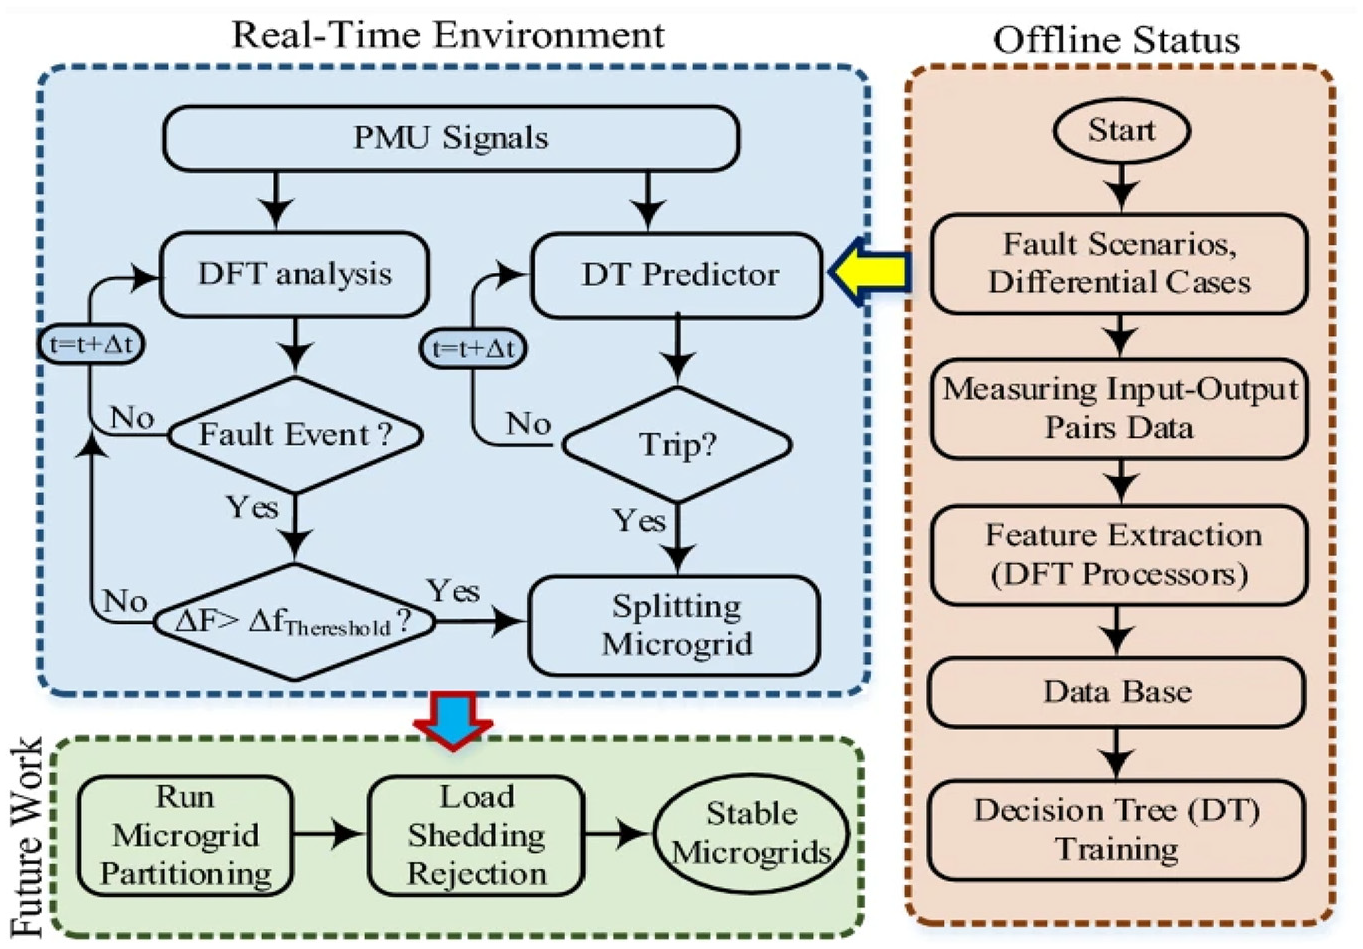
DT intelligent differential relay. 80
Wide area monitoring protection and control (WAMPAC)
Wide area monitoring entails a systematic distribution of data sensing equipment in a power system to collect time-synchronized measurement of the phase angle of the sinusoid measured, frequency, and magnitude and conveyed through a robust communication network of PMUs, PDCs and control centers spanning the entire power network to monitor and protect power network. 7 The most integral synchrophasor technology used for the collection and processing of the desired measurements is Phasor Measurement Unit (PMU). The PMU streams serial data over a synchronous optical network (SONET) path toward the Phasor Data Concentrators (PDC). 81 All these seats on high-speed communication that in most recent applications deploy MPLS Ethernet in a wide area network with several redundant routers and a mesh of communication links as alternatives, all connecting to a central monitoring and control station, the WAMPAC control center. 22 The WAMPAC system must cover all points of the power system to ensure reliable, secure data sharing, and different classes of Quality of service (QoS) capabilities. 82 Multi-Protocol Label Switching (MPLS) is capable of transporting synchrophasor data streams as Ethernet packets. Over the years dropping transport latency below 10 ms in the network makes suitable for WAMPAC applications. All the instantaneous current, voltage, and frequency measurements collected at different locations of the power 83 are used to characterize the delivered power to end-user loads from all the generating plants, and the frequency is normally used to monitor the demand-supply ratio of the grid. All of the above-measured synchrophasor data is time stamped with respect to the Global positioning system (GPS) clock which increases systems accuracy. 83 PMUs and PDCs require time synchronization, and as such, they exhibit an architecture shown in Figure 12. This ensured that all measurements are collated accurately and can be used to construct a snap picture of the transmission system at any given time. 43
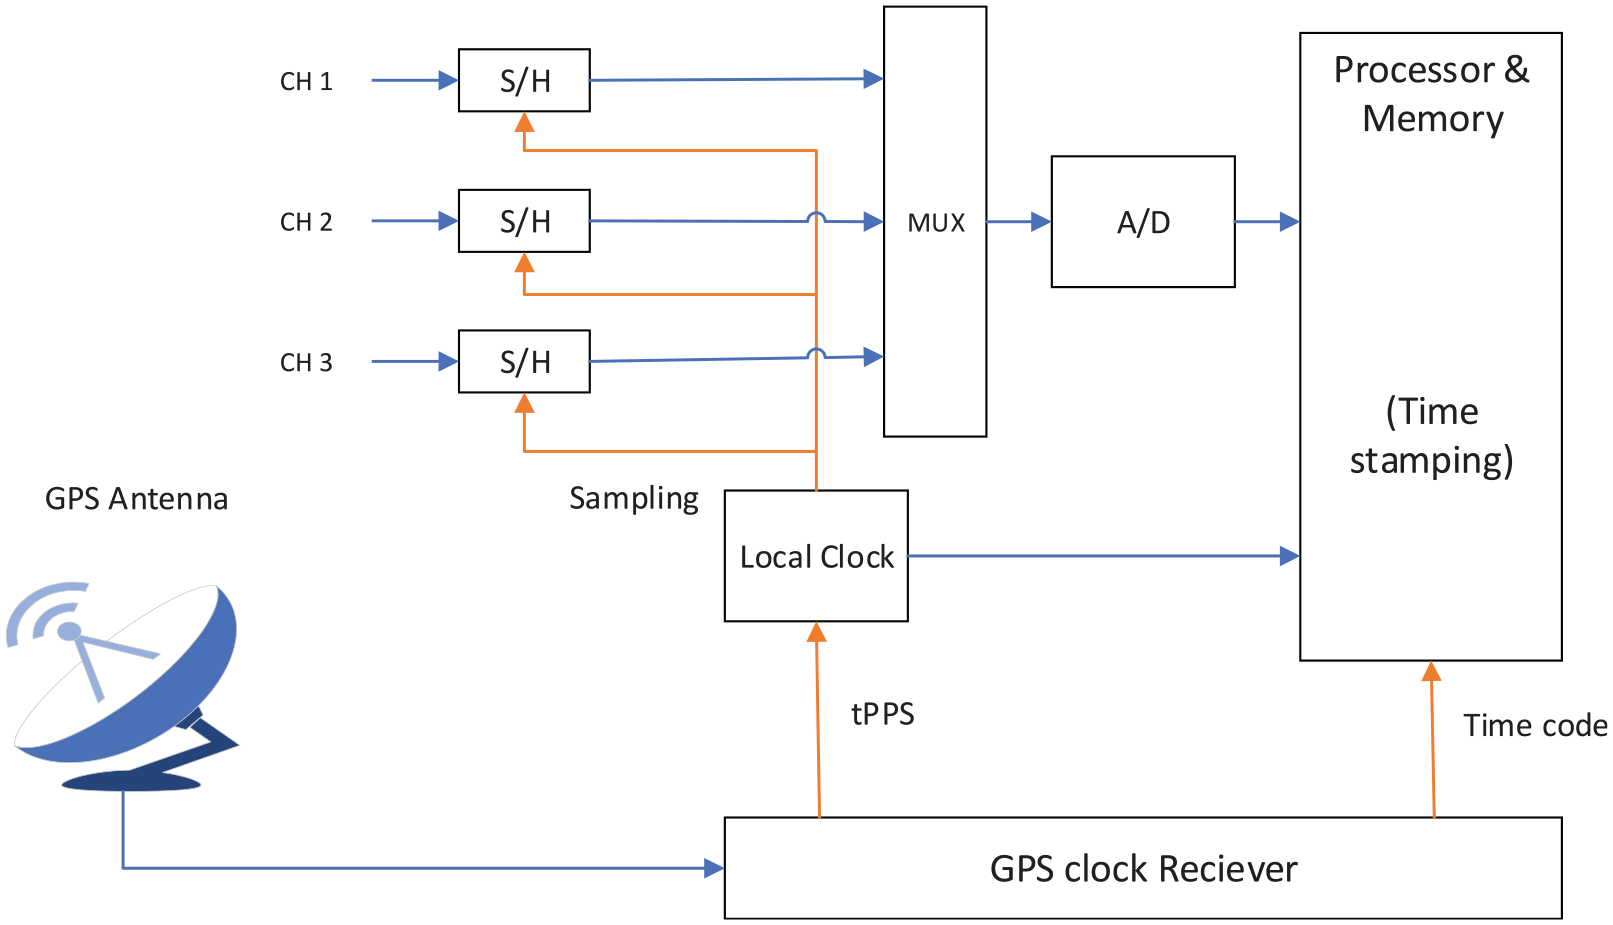
WAMPAC device architecture.
WAMPAC main component devices
Phasor measurement unit
In WAMS, PMUs measure voltage, current, frequency and compute the rate of change of frequency (ROCOF) from the phasor network. It synchronizes all these measurements with a shared time reference, the Coordinated Universal Time (UTC). 69 It can be deployed as a standalone device or form part of some protective relaying devices.84,85 A PMU has the advantage of high accuracy recording of synchrophasor measurements in real-time from a power system covering a wide geographical location when deployed for WAMS which makes it ideal for dynamic state monitoring in DG integrated EPS.
Synchrophasor definition
Phasors are commonly used in the mathematical analysis of power systems, consider a sinusoid in figure 13 below.

Then the phasor representation will be as follows
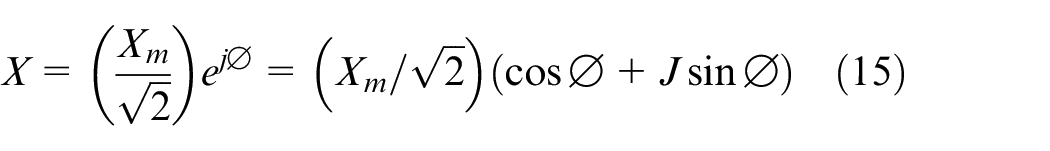
where
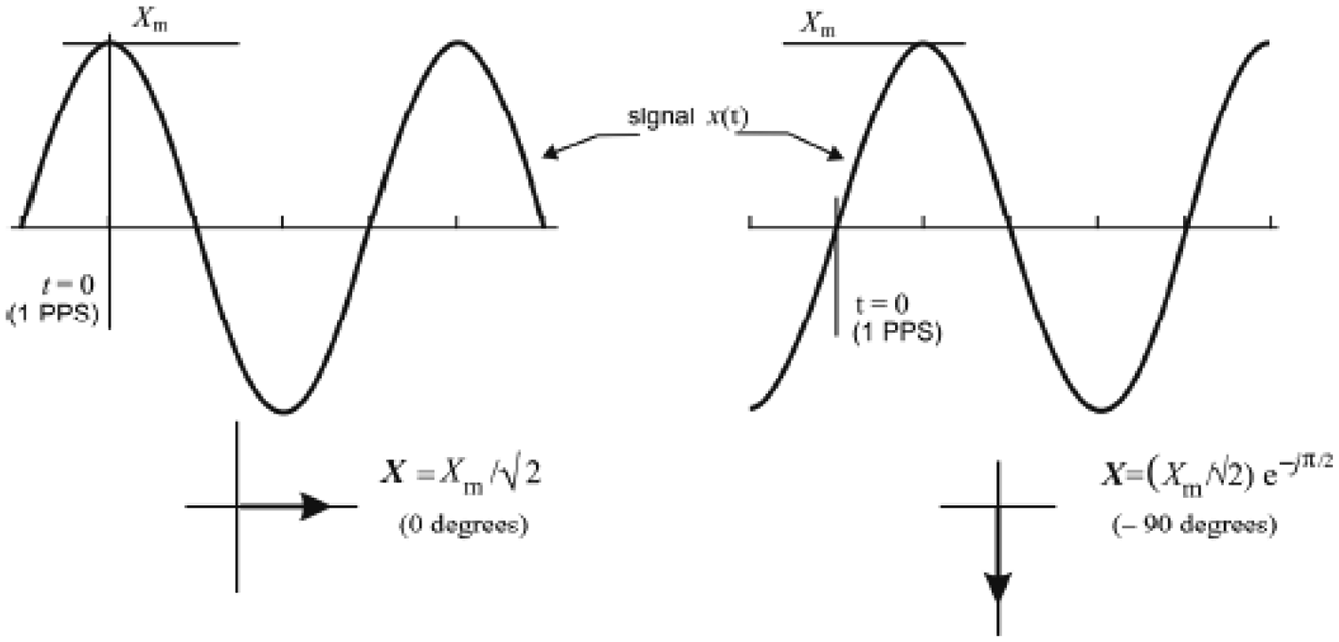
Synchrophasor representation. 88
Equation (16) shows the above relation as it develops

where the nominal angular frequency in figure 14 represented by
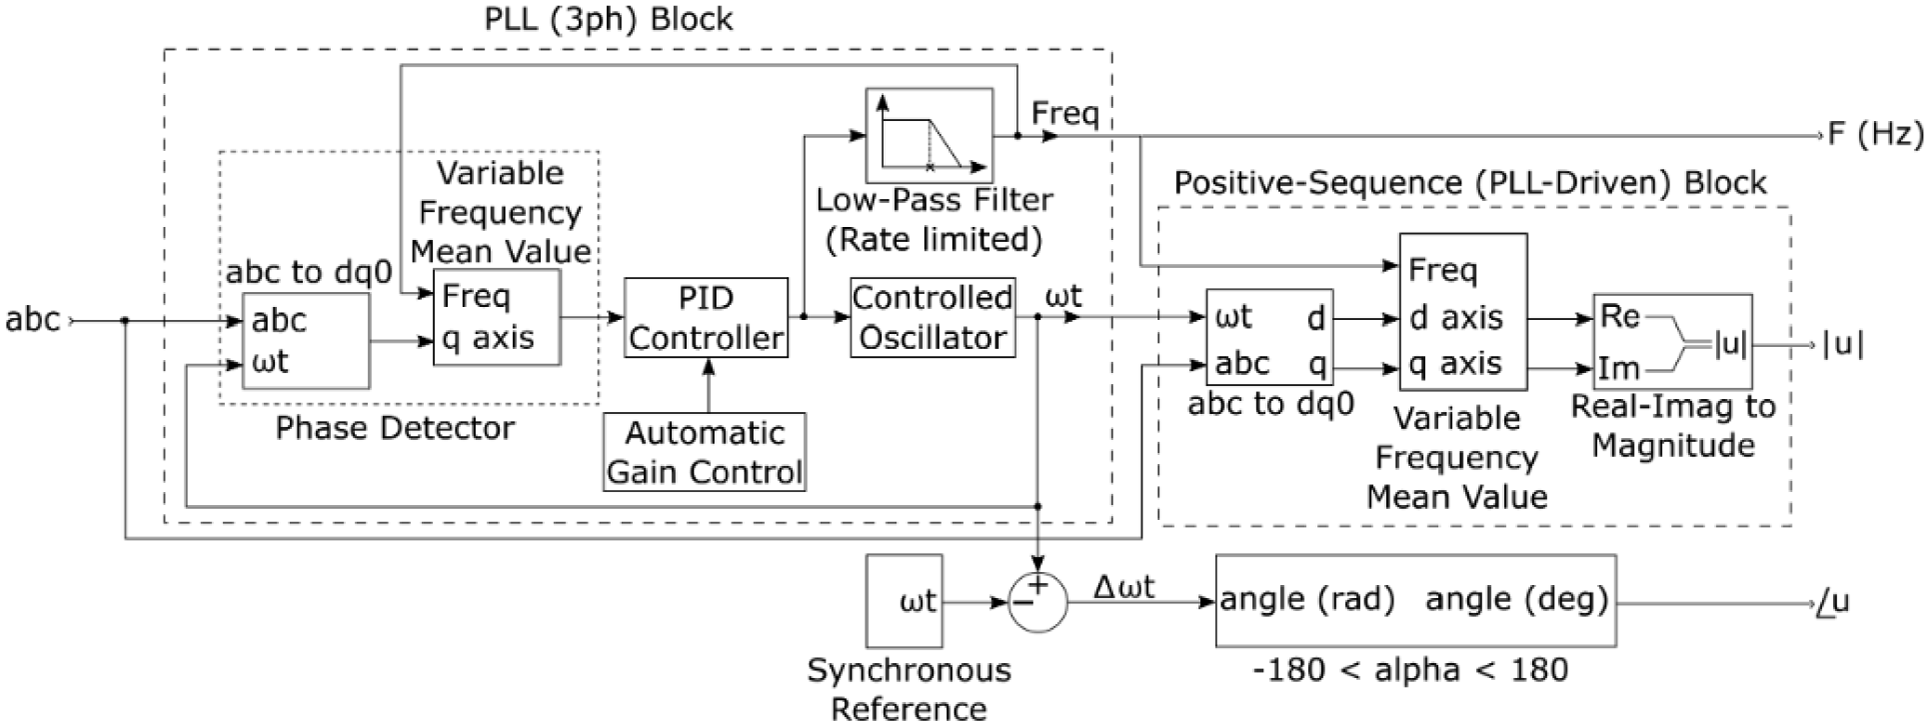
PMU (PLL-based, positive-sequence). 89
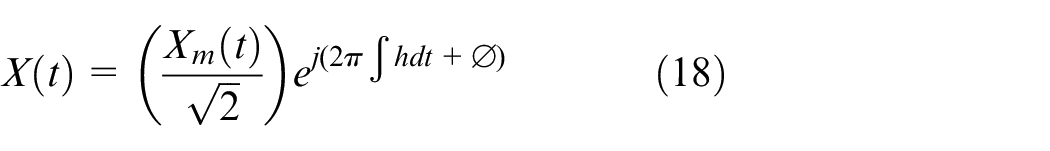
The Synchrophasor for the waveform then becomes
Measurement time synchronization
For the PMU to fulfill the time synching of measurements it should receive a reliable time for a very accurate source like the Global Positioning System (GPS), the received time should be traceable to UTC while the accuracy ensures that Total Vector Error (TVE) and the Rate of Change of Frequency (ROCOF) errors are kept at a minimum. 88 The block diagram in Figure 14 is the MATLAB version of the PMU, which is based on the Phase-Locked Loop.
Based on this method, the measured three-phase input, PLL block uses an internal frequency oscillator to track the phase and frequency.
89
The phase difference is kept at 0 by the PID controller by adjusting the internal oscillator frequency. The magnitude and the phase of the three-phase (ABC) components are computed by the Positive Sequence (PLL-driven) block, this is done through one cycle of the fundamental frequency that was tracked by the previous PLL (3 ph) closed-loop control system. The angle measured in radians of range 0 to 2π is used as the reference frame for computation and is synchronized on the zero crossings of fundamental which is taken as phase A.
89
The angle is also tracked by the same PLL (3ph) closed-loop control block. This PMU model gives three outputs, the magnitude same units as the input, the phase-in degrees, and the frequency of the positive sequence of the input at the fundamental frequency.
89
The sampling time,

Rate of change of frequency estimation
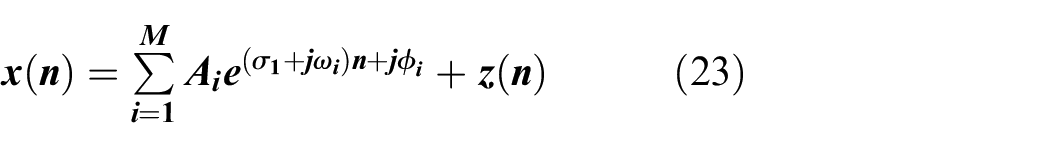
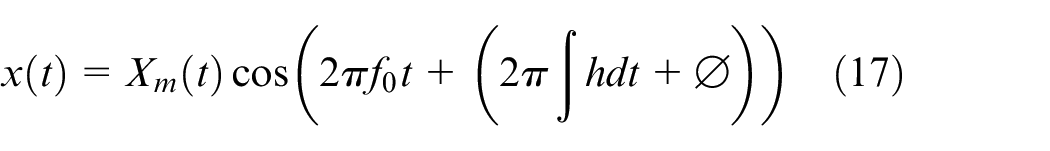
The rate of change of frequency becomes useful in monitoring the impedance value of the power system and therefore the stability of the system can be observed. The above PMU reports frequency from which Rate of Change of Frequency (ROCOF) can be estimated. 88 Consider the sinusoid

frequency of equation (18) is
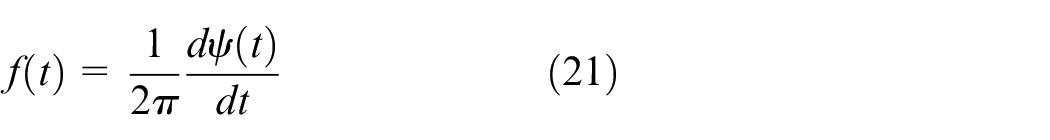
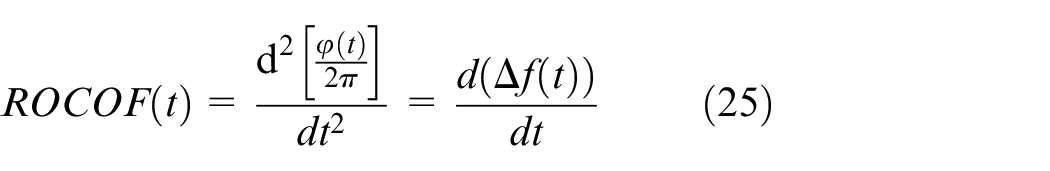
Then ROCOF becomes

This calculation must consider system nominal frequency (
With this consideration, the cosine argument
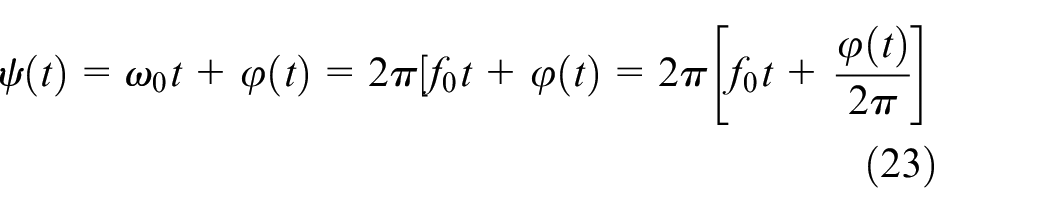
Then the formula for frequency becomes
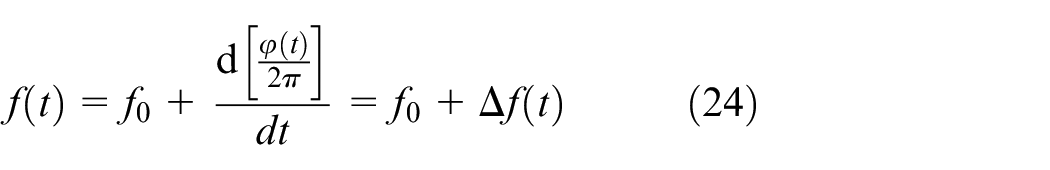
where
PMUs continue to find more applications in state estimation, instability prediction, fault recording, and adaptive relaying applications. 90 As per the IEEE Standard C37.118.1a-2014 (Amendment to IEEE Standard C37.118.1-2011), the PMU can measure 50/60 Hz AC waveforms at a rate of 48 samples per cycle which generates up to 2880 samples for a 60 Hz waveform. Chakir et al. 91 suggest finite impulse response (FIR), Kalman filter (KF) approach, and a Discrete Fourier Transform (DFT)-Based Demodulation Approach PMU algorithm as an attempt to better the performance of the IEEE standard C37.118.1 framework. It turned out that Extended Kalman Filter (EKF) PMU algorithm is better in the narrow-band application as it has a self-tuned adaptive notch that is used to reject narrow-band out-of-band interference, it comes at a cost as it is more complicated to implement than FIR algorithm because of the adaptive narrow-band interference rejection. 91 However, all other mentioned PMU algorithms are center frequency adaptive. When compared to the IEEE standard C37.118.1, they have a wider frequency range useful in microgrid applications. In the end, all the algorithms can be tuned to meet the requirements of the standard, the FIR bandpass filtering satisfies the current C37.118.1 framework better as it outperforms its protection (P) class and monitoring (M) class quite significantly.
PMU placement strategies
PMUs are expensive devices, and the limitation is that a PMU has several current channels it can take as incident lines to measure. This means saving costs depends on how well installed PMU numbers can get reduced without compromising the topological observability of the network. 92 This is taken care of by optimal PMU placement (OPP) strategies. Assuming that’s some of the line impedances are known, some bus parameters do not need to get measured directly by PMUs but can be estimated with Kirchhoff’s current law and Ohm’s law. 92 This saves costs of installed telemetry and maintenance. To achieve total EPS observability with a minimum PMUs, Tengpeng et al. 93 investigated the use of more robust estimators such as the Root square, Multiple-segment, Schweppe-Hubber Generalized-M estimators instead of using techniques based on weighted least squares (WLS)estimator and Gaussian noise assumption. Amir et al. 94 a PMU security-based observability (SBO) methods and the related communication infrastructure (CI) is proposed. Findings of the SBO method proved that under Economic-based observability, without zero-injection buses (ZIBs) consideration, 12 PMUs can cover IEEE 37-Node test feeder, but this will leave the system with compromised security level so some trade-off between cost-effectiveness and security must be considered as in Figure 15.
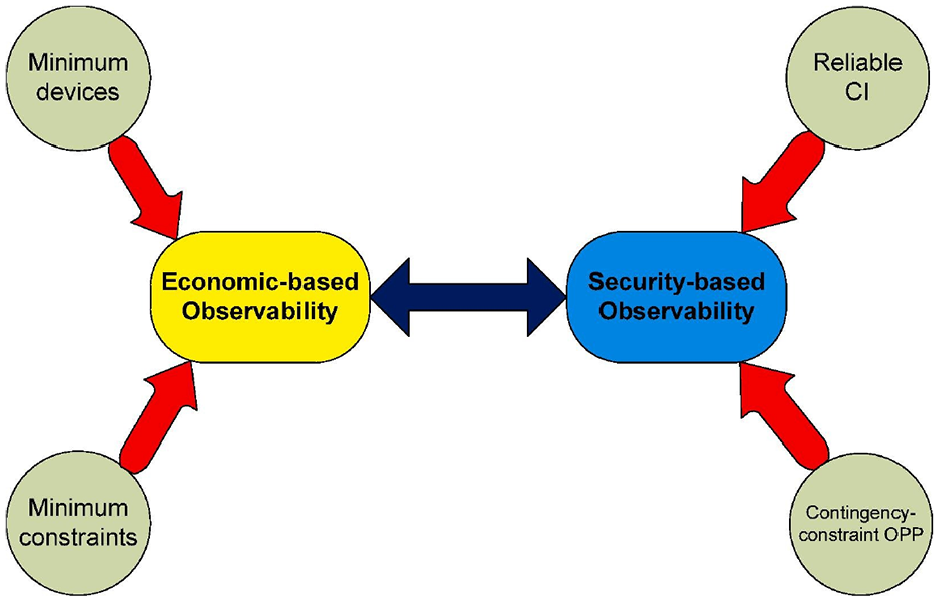
Observability scenarios. 94
Ravindra et al.
95
proposed an Upgraded Binary Grey Wolf Optimization (UBGWO), with the flowchart in Figure 16 to solve the OPP problem. The UBGWO proposed is modeled with the network OPP observability constraints. The PMU optimum minimization problem is expressed as in equation (26), where
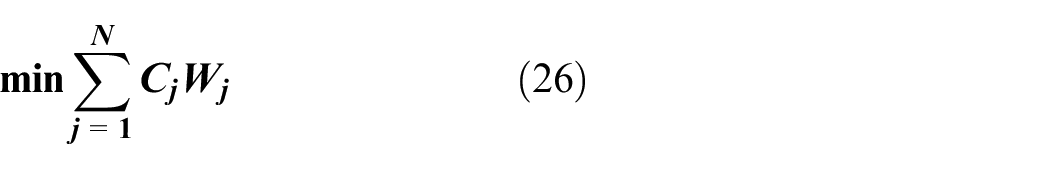

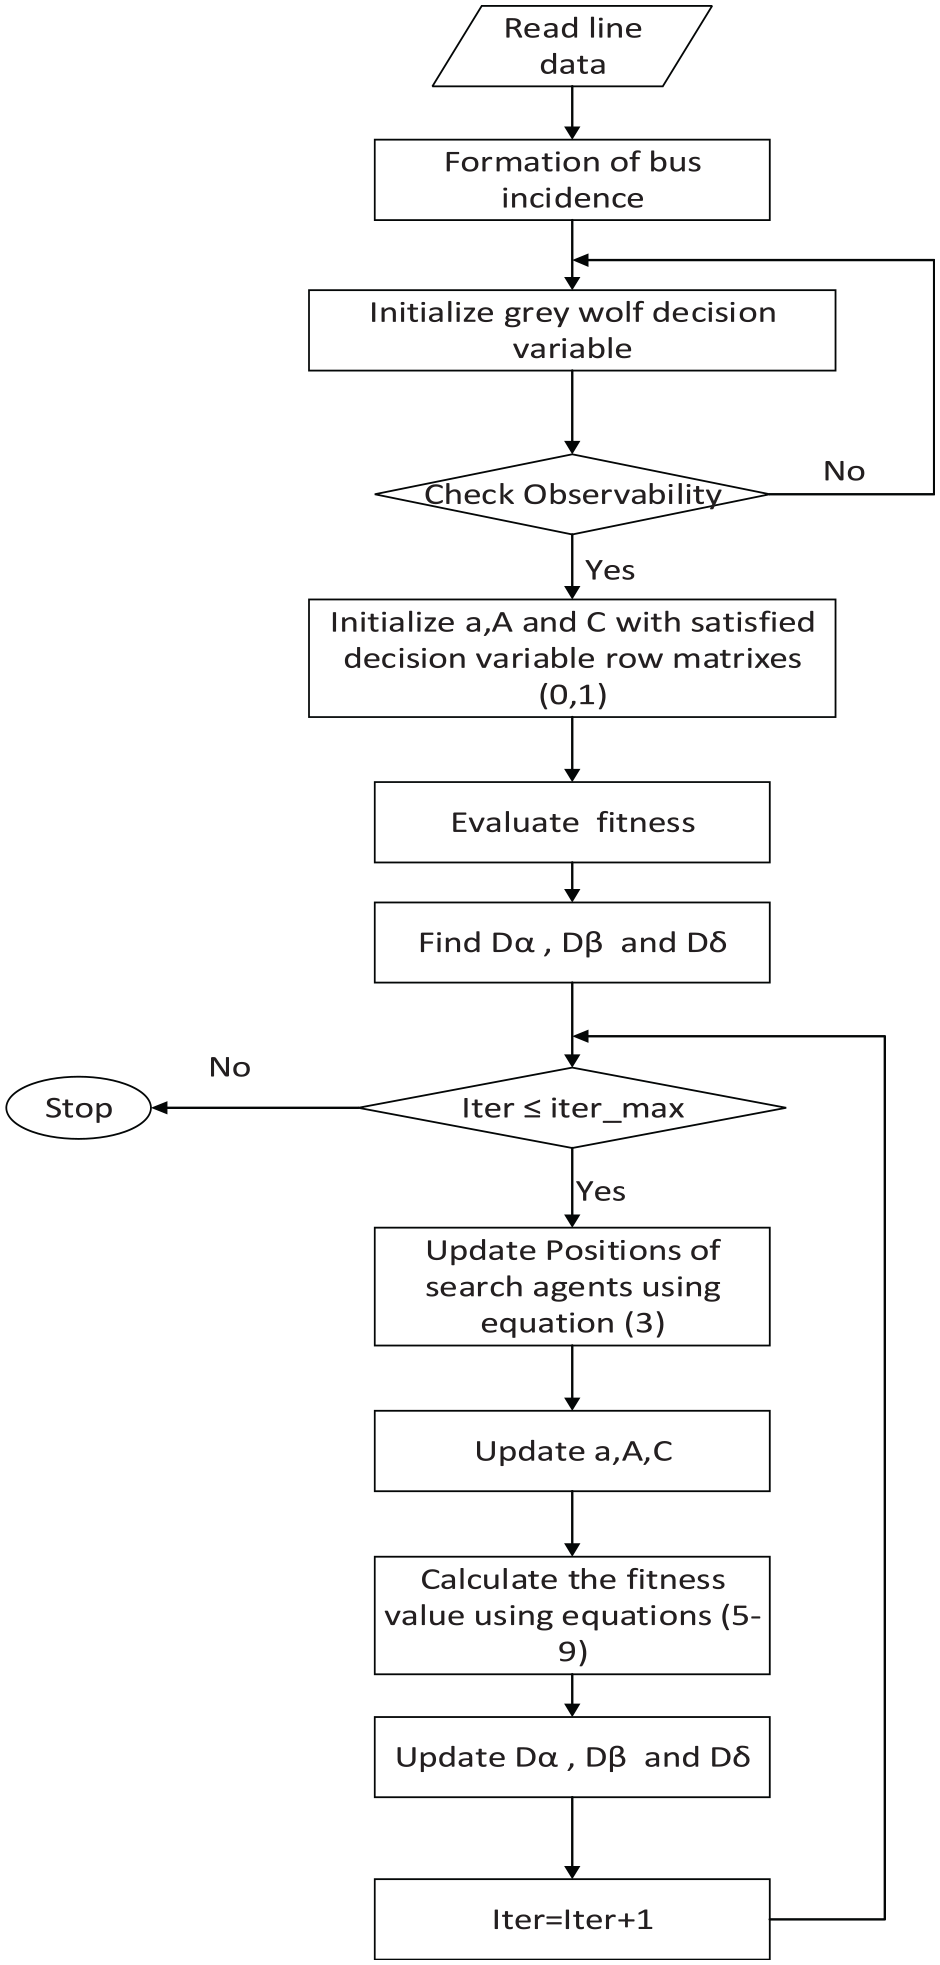
UBGWO optimal PMU deployment. 95
Phasor data concentrator
Another important component of WAMS is the PDC, it gathers data from all PMUs assigned to it. It also utilizes the GPS clock to synchronize incoming stream of data at 1-microsecond accuracy to UTC and align time stamps against data from PMUs. It checks for errors, rejects corrupted, and delayed data. The PDC can retrieve data on its own and monitor different parameters like active power and reactive power. IEEE C37.244-2013 for power systems equips the PDC with wide-area frequency monitoring, power swing detection, load shedding, and distributed generation anti-islanding functionalities. 96 The communication between the PMU and the PDC is defined by the IEEE standard for synchrophasor Measurement for Power Systems of 1995. The PDC has privileged order of seniority before control centers in the WAMS infrastructure architecture, as such it many researchers have implemented different approaches to improve its accuracy as its performance can determine the effectiveness of the overall systems. 97 Castello et al. 26 proposed an Active Phasor Data concentrator with an adaptive ability to manage the latency of the data streams received by all the PMUs on its periphery. This Active PDC approach was tested 27 with three PMUs connected to a PDC prototype and the WAMS setup simulated in a laboratory, a more realistic test scenario was performed 28 where the experimental setup was distributed in two geographical locations with more PMUs: First one in Lausanne, Switzerland and the second in Cagliari, Italy and the two were separated by a distance of 800 km. The experiment was set up as in Figure 17.
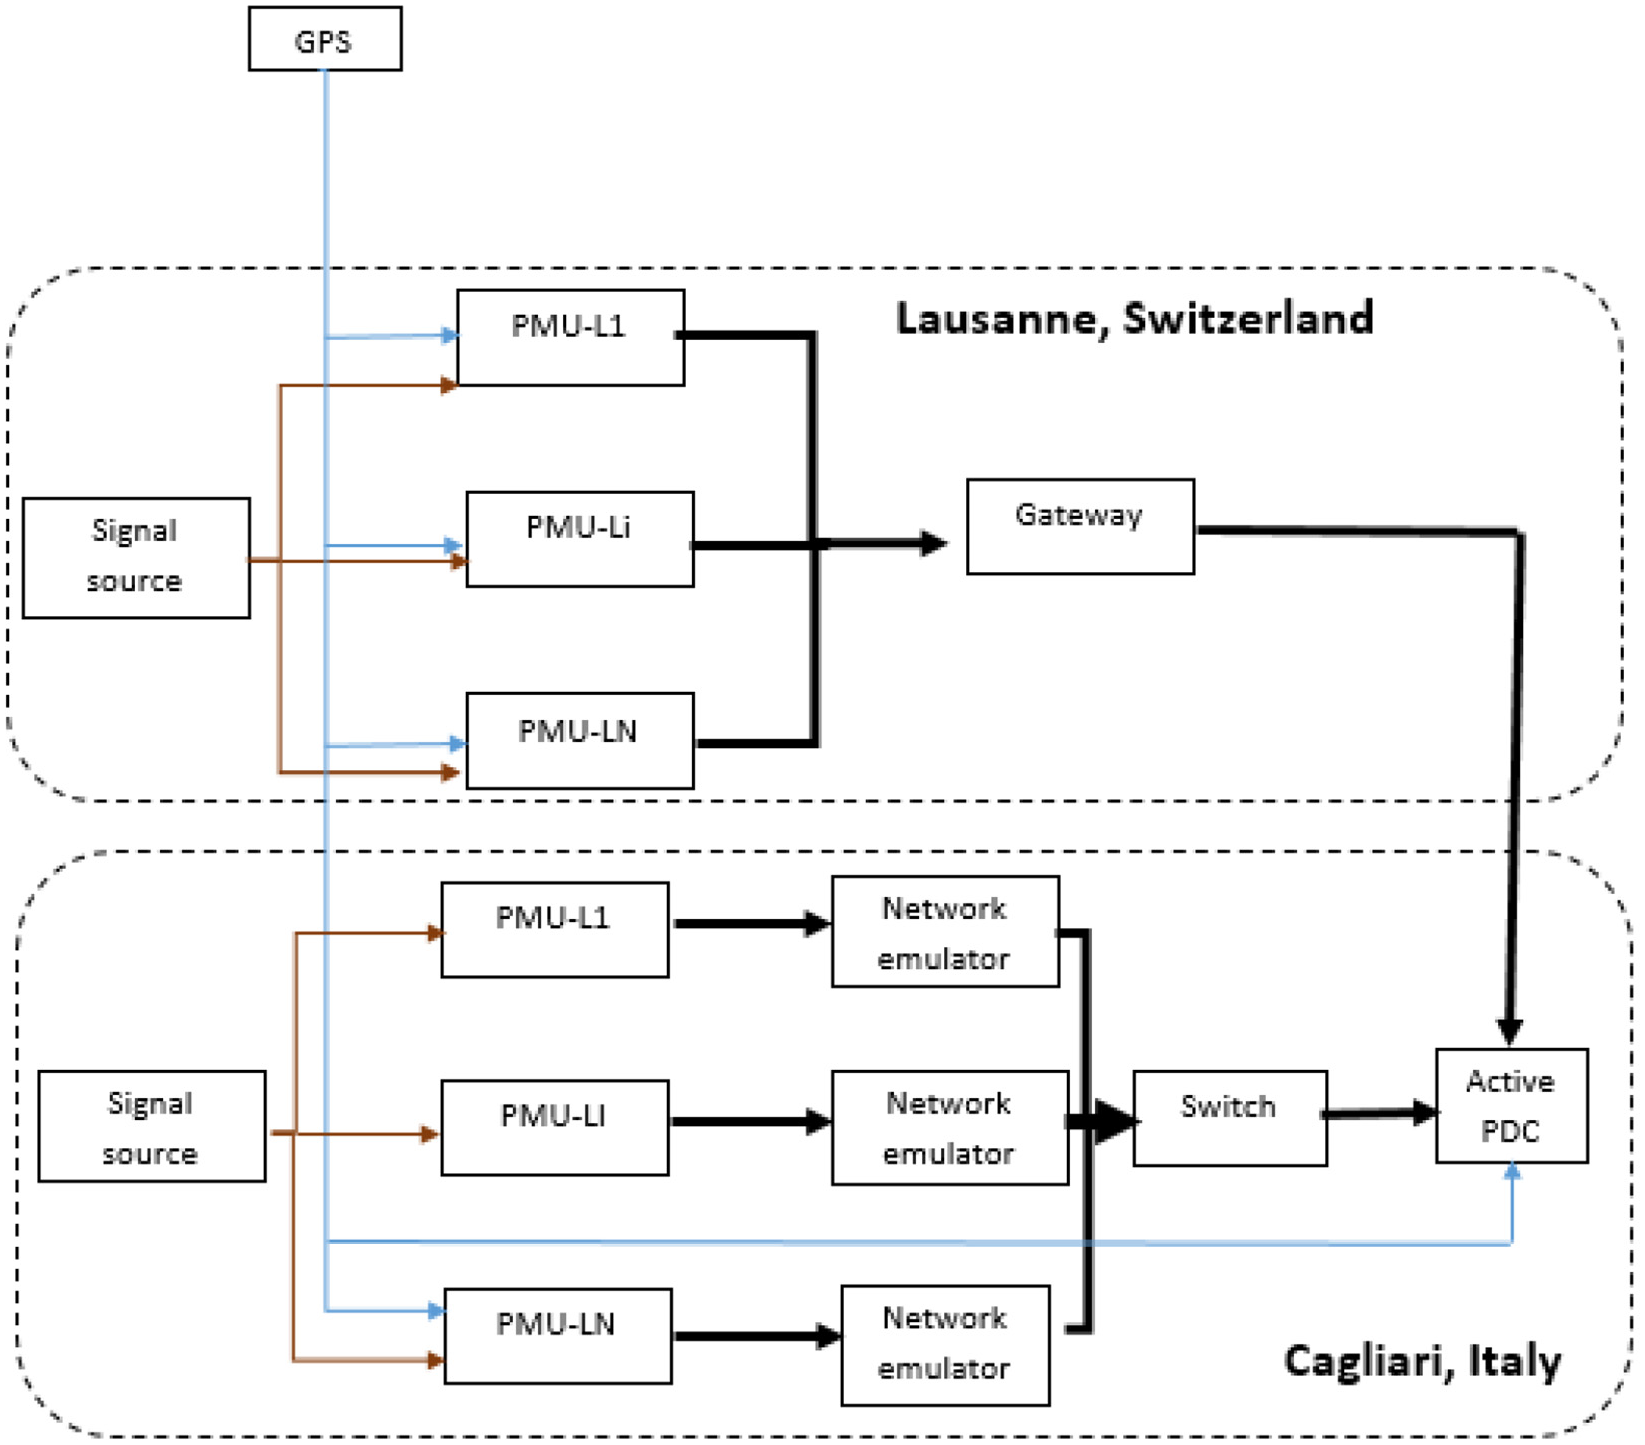
Experimental setup. 28
With the same PDC prototype in both places, Figure 18 shows the results of the first PDC processing time test scenario, which is the time interval the device takes to finish the task of processing the output stream, this time is referred to as the egress time. 98 The evaluation timer runs from when all the data from PMUs is received and times out when the aggregated data is ready to be forwarded. 98 The results of Figure 18 shows the time interval when a statistical evaluation of 1000 values of PDC processing time was performed. 28 In conclusion Active PDC from this test, even with ten PMU streams is below the PDC requirements. It is, therefore, suitable for control and protection functionalities in a WAMPAC setup. 28
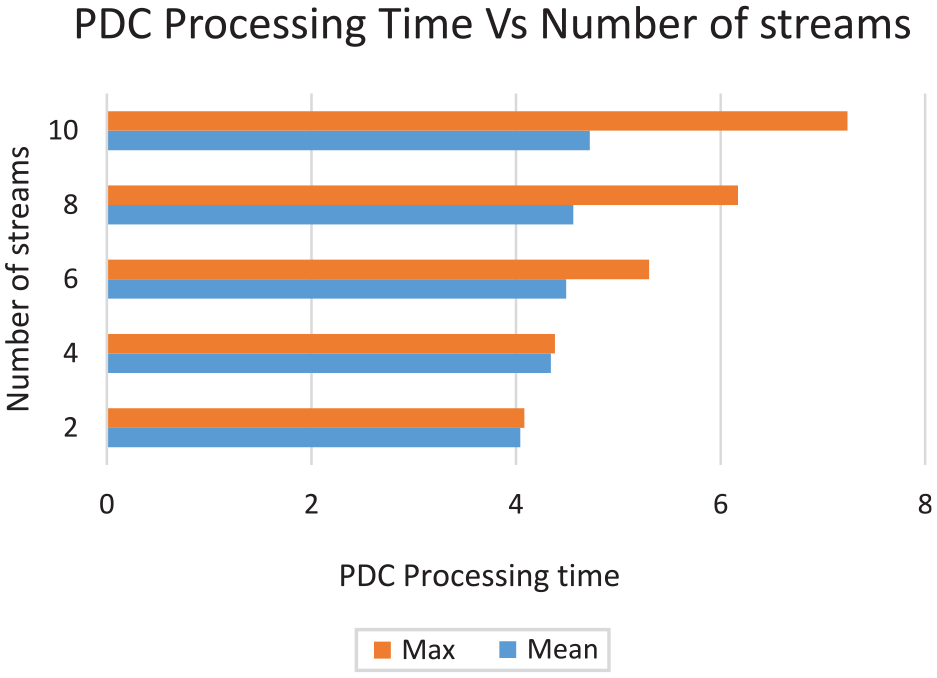
PDC processing time with latency management. 26
The second test scenario was a latency test with six PMUs from different vendors connected to the PDC. The latency for input streams was assumed to be 65 ms, which meant that if 70 ms is the set acceptable latency then 5 ms is for the PDC processing time. The latency between PMU and PDC depends on the distance between the two. The first two output streams met the latency limit, which meant the third stream is delayed gets sent with low priority, and arrives after the imposed latency had elapsed. Therefore, the results suggest that this application is not suitable for time-critical control and protection applications.
WAMPAC architectures
The WAMPAC system architecture relies on the WAMS system architectures. 99 The main components are PMUs, PDC, WAMS applications, and communication networks. 100 The components of the systems remain the same but different authors have documented different architectures. This system interfaces with the EPS in the first layer using PMUs which harvest their information directly from the substation and power; lines through the use of current and voltage transformers. In the second layer, the data management layer, the collected PMU data is sorted as time-synchronized datasets with UTC timestamps by the PDC. Layer 3 is where all the datasets are forwarded to the WAMPAC application where algorithms generate control signals like a trip, tap changer, and alarm signals. Zhu et al. 100 documents a basic architecture comprising of three layers as in Figure 19.
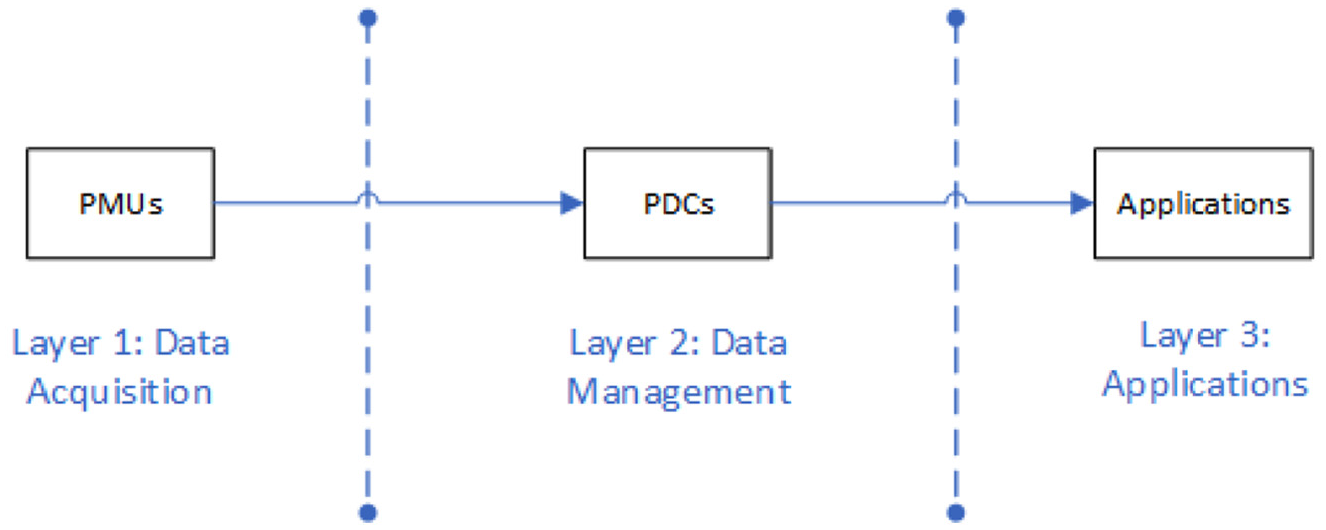
Layers and components of the WAMS.
From this basic architecture, there has been an evolution of architectures, the Unified and Integrate ICT solution which has a common data processing, and the “stove pipe” ICT solution which has separated data processing for each measurement path. From the two architecture, it’s evident that it is more convenient and cost-effective to go with a unified and integrated architecture where all the processed data sets get channeled in the same fashion and infrastructure as opposed to dedicated links, however, a “stove pipe” offers the advantage of reduced delays since data streams are in a dedicated link and processing center.
In a more recent publication 82 a WAMS centralized and WAMS decentralized architecture are documented and are the same as the ones discussed in Mukarram and Murkute. 16 However Rao et al. 82 introduce yet another architecture, the WAMS distributed architecture, it has both local and central controllers as it has PMUs placed at local areas and PDCs located at substations or regional stations in addition to the master PDC located at the main control stations. This appears to be the best set up for distributed generation resources of all domestic and industrial level as its application is echoed by Chaitanya et al. 101 as it proves that using ANN in conjunction with centralized micro-Phasor Measurement Units (µPMU) eliminates unnecessary tripping in shorter distributions lines with similar fault characteristics. Up until the third layer, WAMS architecture is a subset of a WAMPAC architecture as it has four layers,82,102 in which the third layer ensures that the data delivered to the fourth layer is appropriate for their respective application determinations. The fourth layer hosts real-time applications for wide-area like SCADA, Enhanced EMS, data archiving, real-time monitoring, control and protection. 82 The WAMPAC system connects to the circuit breakers in substations to offer alarms and protection functionality related signals through the SCADA.30,103 PDCs in the WAMPAC structure instructs hybrid EMS and automatic generation and control (AGC) applications directly. The most integral part of the WAMAPC architecture structure is the central protection system (CPS) which is divided into multifunctional line protection (MFLP) and central protection function (CPF) as its main components 99 as shown in Figure 20.
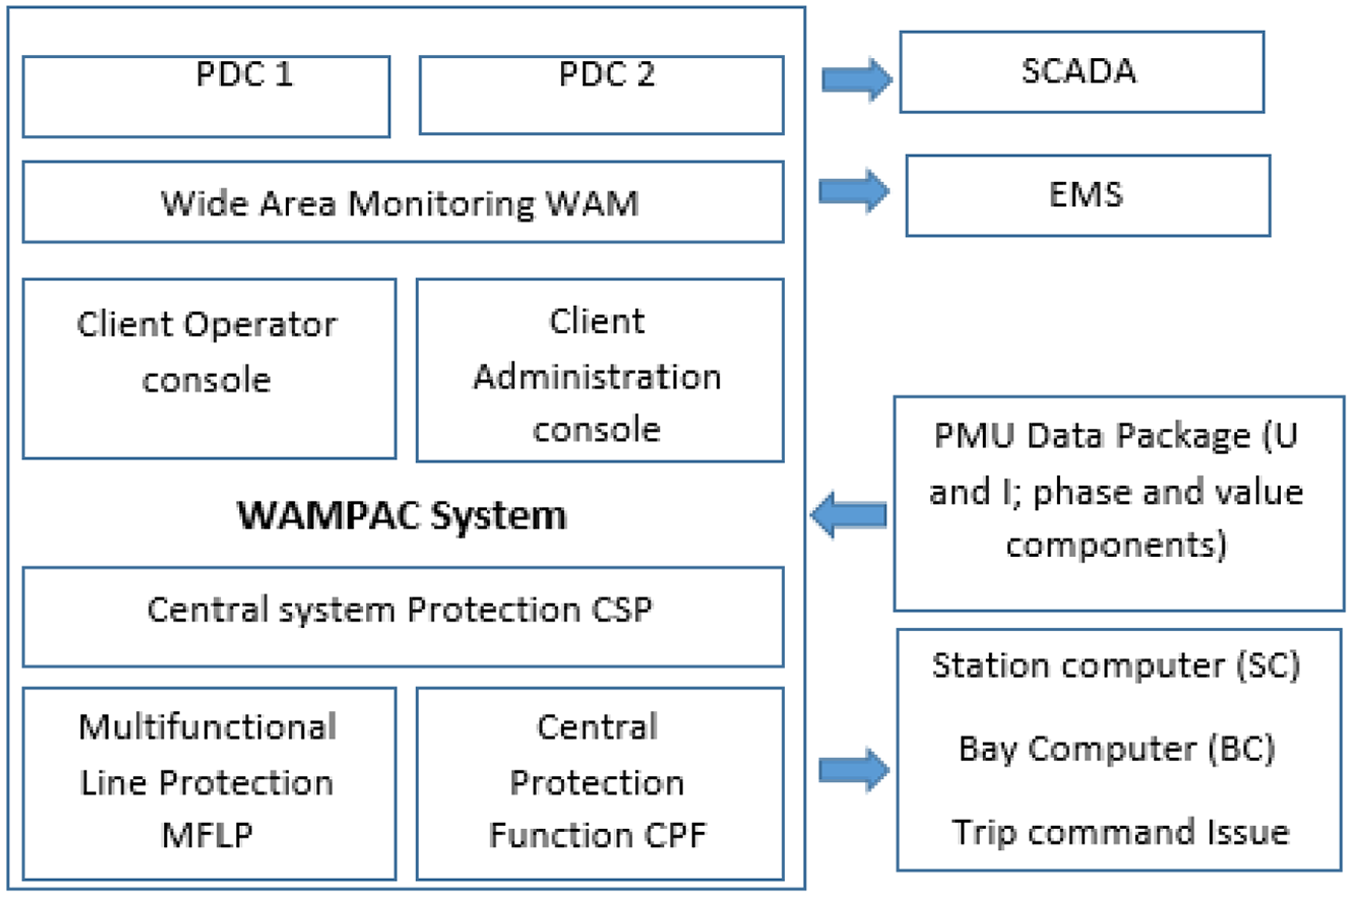
WAMPAC system structure. 99
WAMPAC communication network
In WAMPAC, a good communication infrastructure that is efficient and reliable is a prerequisite.
99
The most fundamental aspect of this communication is insuring reliability and very low time delays. The systems should be able to issue a final command signal in a time shorter than
Typical WAMPAC communication standards. 104
Communication requirements for WAMs
Communication requirements differ from one application to another, these may depend on different power system network layout and the sensitivity of the loads. However, in consideration of wide-area monitoring as shown in figure 22, a communication system that can pick up changes that may lead to Islanding conditions and send a counteractive signal should exhibit the following features; Security, to ensure that attackers do not manipulate measured data or the physical system itself, Reliability to ensure availability and reduced wide-spread system failures, Scalability to allow for future network expansions and assimilation of new technologies into existing ones, and lastly Responsiveness in real-time, this ensures reactions to stimuli is within the required time window.28,68
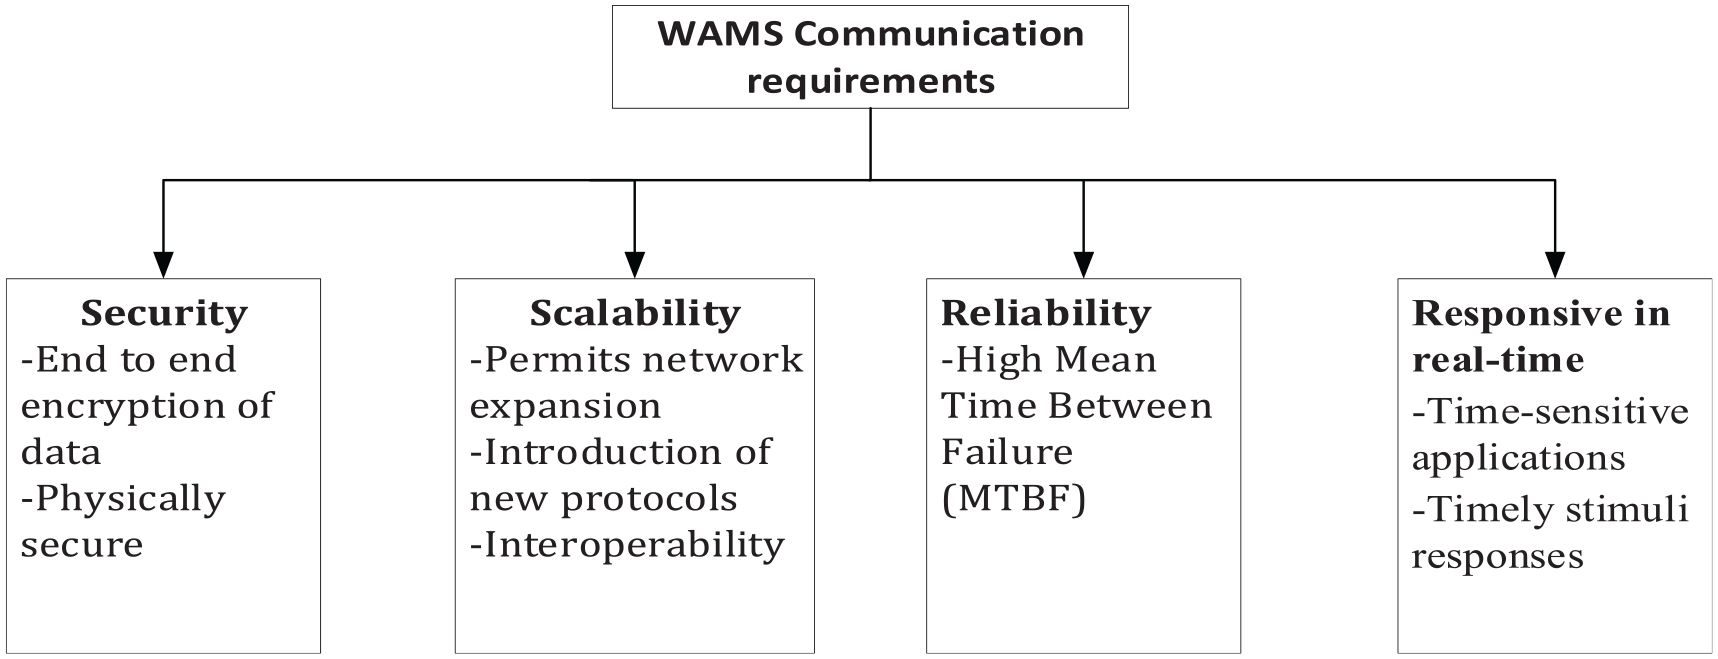
Communication requirements for WAMs.
Communication mediums
There has been a substantial evolution of communication mediums for WAMs and WAMPAC applications. Over the years these mediums were chosen based on the tradeoff between economic and technical performance. WAMPAC systems deal with a lot of grid data that need to be handled very well, securely, reliably, in a real-time responsive manner, and in a scalable network. 68 these factors form the basis of weighing the different communication methods against one another. Shaukata et al. 29 and Rao et al. 82 outlines different types of wired and wireless mediums that are used in smart grid networks for monitoring, control, and protection, some of them are reviewed below.
Wired communication
For WAMPAC applications, Power Line communications and Optical fiber communication are reviewed under wired connections but the communication mediums are not limited to the ones reviewed.
Power-line communication (PLC)
The application of Power line communication which is a modulated carrier signal transmitting data over power lines has existed since the 1950s as a data communication in EPS. It is very economic as it uses the same power systems infrastructure and taps from meters directly. 105 PLC has a data rate range of 2–3 Mbps and is divided into two mains categories which are Broad Band PLC (BBPLC) and Narrow Band PLC (NBPLC).106,107 PLC continues to see efforts of development and it has been applied to the smart grid in some places around the world because of its reliability, 108 but there are some tradeoffs as it has a fair share of limitations like limited bandwidth, noisy transmissions, and signals distortion, communication loses due to open circuits, low interoperability and lack standards, The above PLC disadvantage has limited it to less time-critical applications and its adoption in WAMPAC s still unrealistic.29,109
Fibre optical links
Optical – fiber communication has significantly proven itself against many mediums in the EPS data communication industry. This medium offers unlimited bandwidth, reliable end to end data transmission, it is immune to radiofrequency and electromagnetic interferences and can be installed in long distances without a repeater as light has low transmission loss when it propagates through fiber tubes. Data can be transferred at a very high speed which for WAMPAC is very beneficial as it reduces latency for real-time control and protection applications. Optical-fiber communication is very robust against side-channel data leakage, therefore it is very secure, and considering the requirements for WAMPAC communication, fiber communication is an overkill and it meets all the requirements as it has an unlimited capacity and new installations of synchrophasor network expansions can still tap from its infrastructure backbone. Fiber optics communication can be deployed along with communication methods as shown in Figure 23.
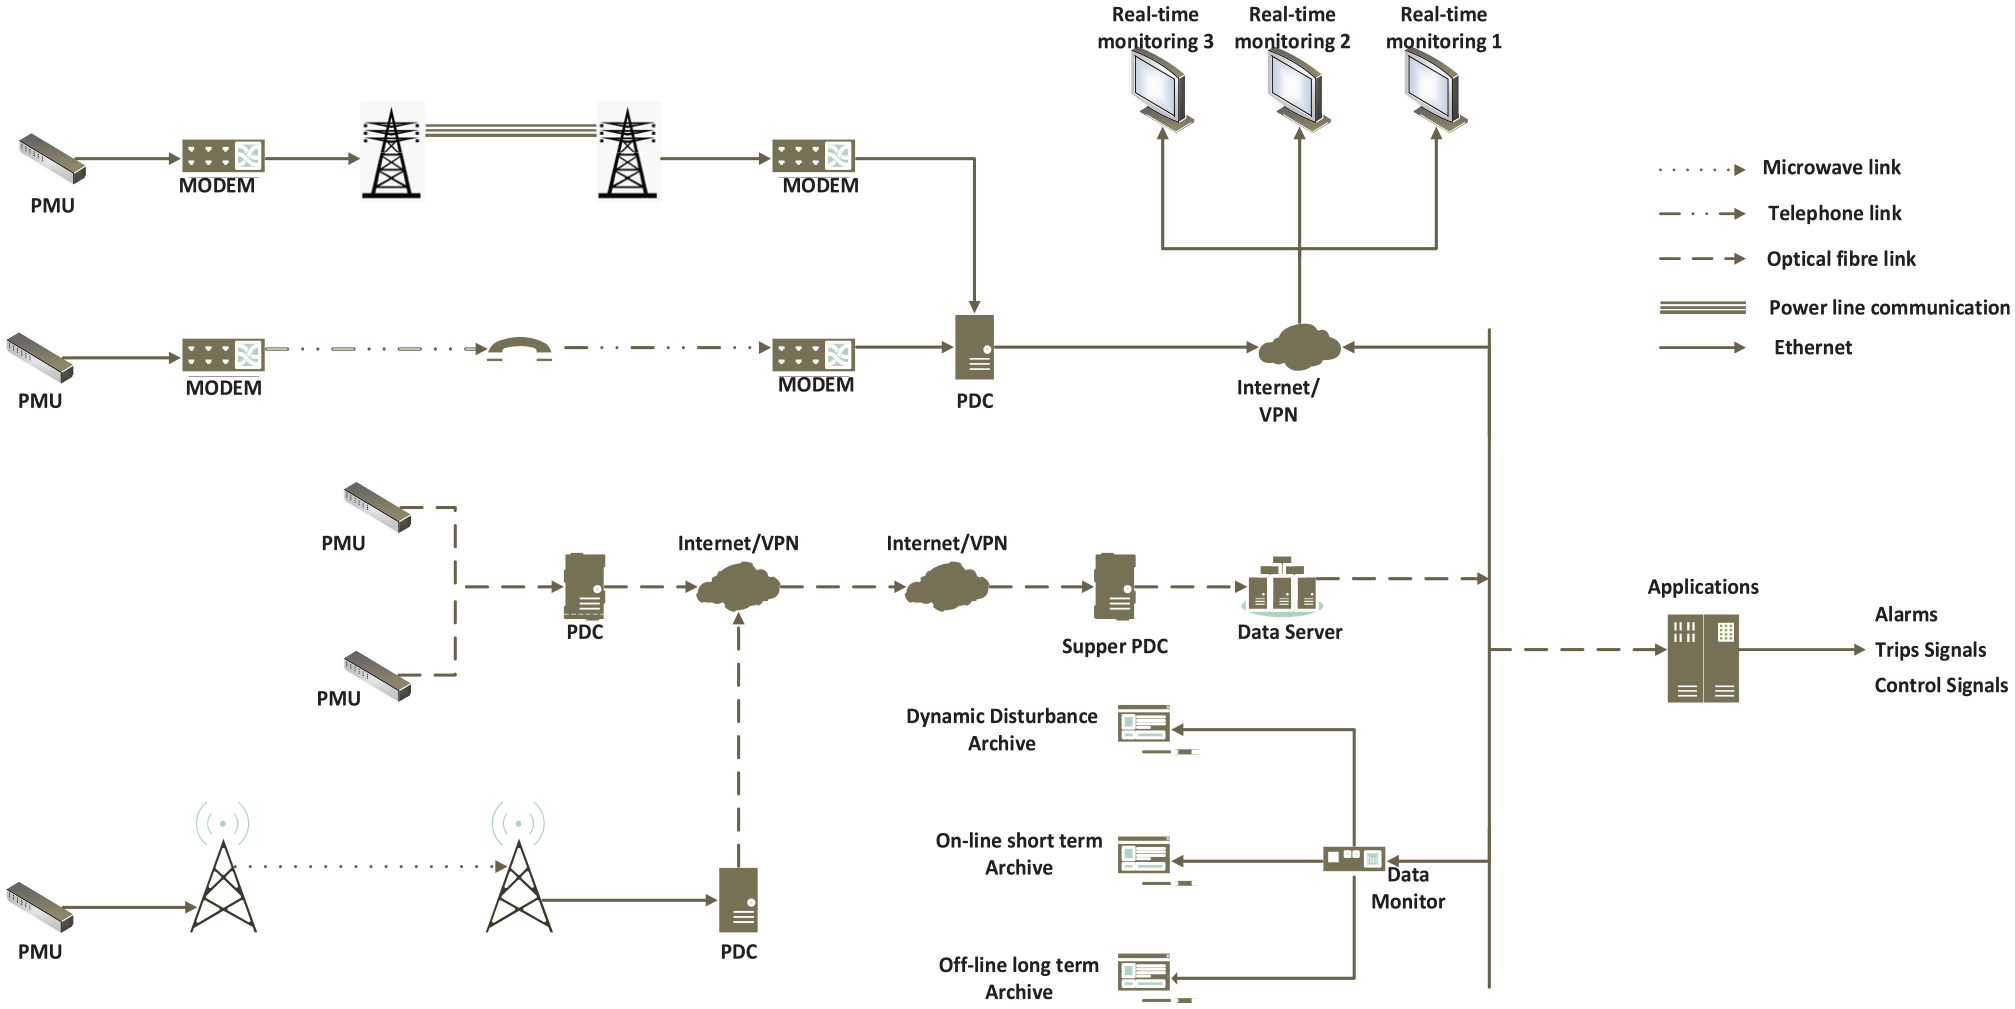
WAMPAC synchrophasor network.
Wireless communication
Satellite communication
Satellite communication provides one of the best remote control and monitoring solutions because of global coverage which a very attractive feature to the power system. 29 The second feature is convenient deployment which makes it very useful for remote DGs in areas without well-established communication infrastructure,29,110 mentions Very Small Aperture Terminal (VSAT) as an SC method used specifically for remote DG and substations. Several shortcomings are to be tackled to apply this system in WAMPAC, some of those are channel fading that is unpredictable since the weather affects its channel characteristics 111 and enormous transmission latency caused by long transmission paths from satellite receivers to geosynchronous satellite which renders it unsuitable for time-sensitive protection and control application like islanding detection. Ideas to mitigate these delays by using lower-obit satellites have been suggested but that is overweighed by the challenges that would arise like terrain impacts on the signals, interference from earthly electromagnetism sources, and rental fees. 110
WAMPAC security vulnerability assessment
The WAMPAC system has been applied to smart grids and this has propelled its security research efforts very high. WAMPAC largely relies on its cyber infrastructure for transmitting its data from one point to another by the use of communication protocols as security plays an integral role in the communication of synchrophasor data. 112 Depending on the motive behind the cyber-attack, the attacker’s objective may be to manipulate the metering process, the applications, the physical system, etc. Aditya et al. 113 classifies the WAMPAC attacks into Replay, Timing, and data integrity attacks.
Replay attacks happen when cyber attackers manipulate the PMU data by resending acknowledged data packets to gain access into the control center or hijacking control packets in transit from the applications to the actuators. Replay attacks can still occur even when the WAMPAC system data packets with the original message are encrypted, the only difference will be the timestamp and will get mistaken for delayed communication, this has become a window of opportunities for hackers to mimic trip signals into a healthy system. 113 For Timing attacks, the phasor communication network is flooded with data packets by the attackers with the motive of slowing down the network and ultimately shutting the whole network down hence its second name Denial of Service (DoS) attack. 113 This can cause drastic effects on the control and protection capability of the WAMPAC systems as it compromises time limits for time-sensitive protection actions like islanding detection and disconnection. Data integrity attacks corrupt data at all levels of communication, between PMU and PDC, PDC output streams, and lastly reverse control signals to actuators. This can result in blocked trip signals, corrupted sensor data, and unresponsive data centers. 113
WAMPAC system security is defined by availability, confidentiality, and integrity, IEC 61850-90-5 clearly addresses confidentiality by “perfect-forward” concept and by subscribers and publisher’s encryption key rotation, where PMUs are the publishers and PDC are subscribers. 112 In this security concept, the coordination of the symmetric key between the publisher and the subscriber is performed by the key distribution center (KDC), this is done by issuing the subscriber with a warning of the Time-to Next Key rotation. Integrity in the phasor network is achieved by the use of cyclic redundancy check (CRC) as included in the IEEE C37.118 framework. 112 CRC code checks packets for possible advisory modifications to ensure the integrity of the original bits, however, studies have shown that it doesn’t fully secure the data as intruders can still access it, IEC 61850-90-5 gets around this possibility by using asymmetric encryption and digital signatures to ensure authenticity and integrity, 112 however, the use of digital signature adds a latency problem because of its high computational burden which is not practical to employ in a high-speed WAMPAC synchrophasor network. 114 Aditya et al. 113 suggests a game theory approach security for the WAMPAC which allows to identify the most likely attack, attacker characterization, and helps in identifying measures to mitigate like coordinated security reinforcements and developing new security techniques to reduce impacts of the anticipated attacks.
Time-Synchronization Spoofing Attacks (TSSA) have sparked a huge concern about the WAMPAC system security.
115
PMUs and PDCs have an antenna connected to the substation clock, this antenna receives GPS signal and converts it to a time code format it uses for distributing timing signals. The problem arises when a PMU gets deceived by a counterfeit GPS broadcast, the deceived PMU will compute wrong synchrophasors leading to wrong decisions of all the WAMPAC applications that are PMU synchrophasor data-dependent.115,116 According to the IEEE C37.118.1-2011 standard for synchrophasor measurement, the level of uncertainty in PMUs is governed by the TVE factor in both time synchronization error and magnitude. This standard limit the uncertainty within 1% which corresponds to 0.573° phase angle error or
WAMPAC reliability assessment
Different WAMPAC system components may have different reasons for failing, this failure may be influenced by locations where measurements are taken, weather, cyber-attacks, and power system faults. A good example is when the local oscillator which the PMU relies upon experiences frequency drift due to heavy mechanical vibrations and ambient temperature changes, 115 this can lead to the destruction of the oscillator or erroneous time stamping that will affect all the computational activity of the WAMPAC system application leaving the system compromised. Yan et al. 119 the reliability is well elaborated and the importance of each component in the system can be calculated by using Birnbaum’s measure expressed as in equation (27).

Where

Where
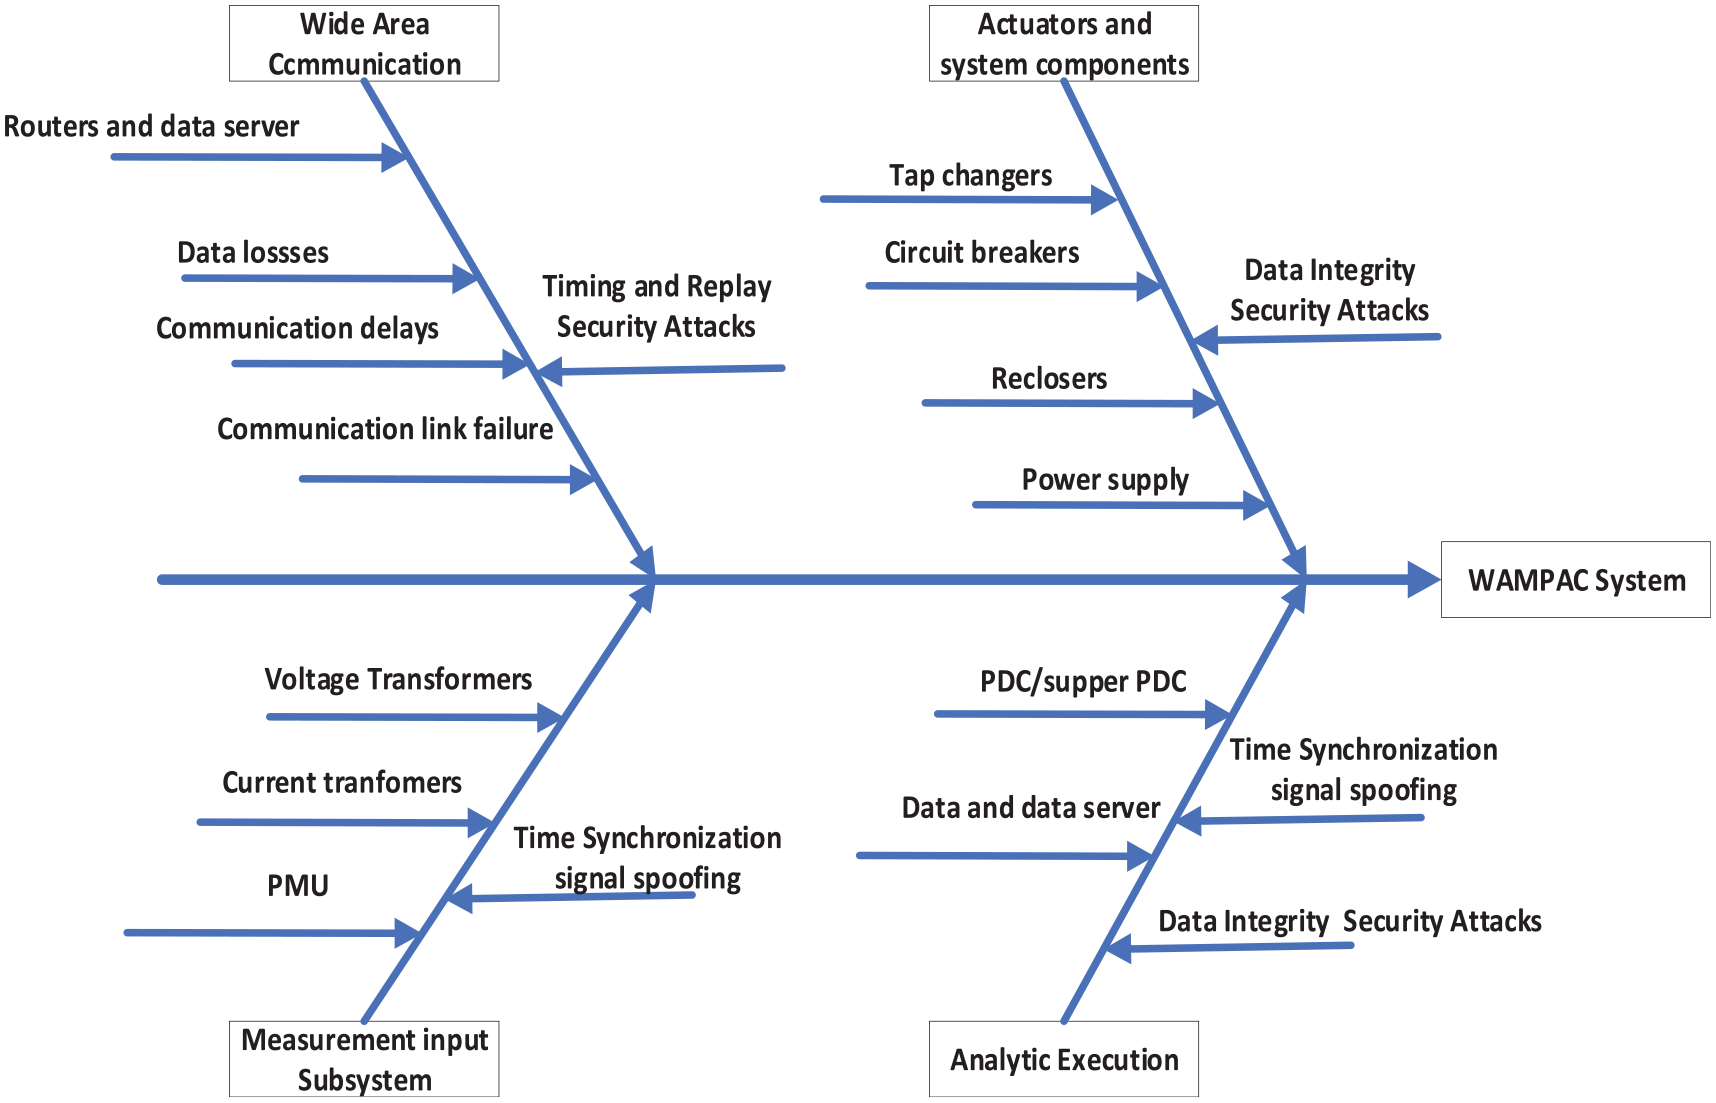
WAMPAC cause and effect diagram.
WAMPAC latency analysis
The components of the WAMPAC communication network can be viewed as a potential bottleneck that can slow down the whole WAMPAC process rendering it practically unsuitable to be used in islanding detection applications as it will not be good enough for critical time stimulus-response. So it is important to critically investigate the entire WAMPAC system in Figure 25 delays going component-wise. The communication latency of the WAMPAC systems can be approximated by the expression (29), where
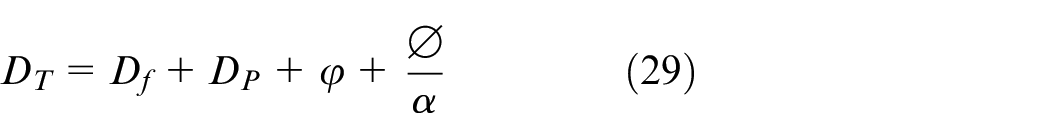
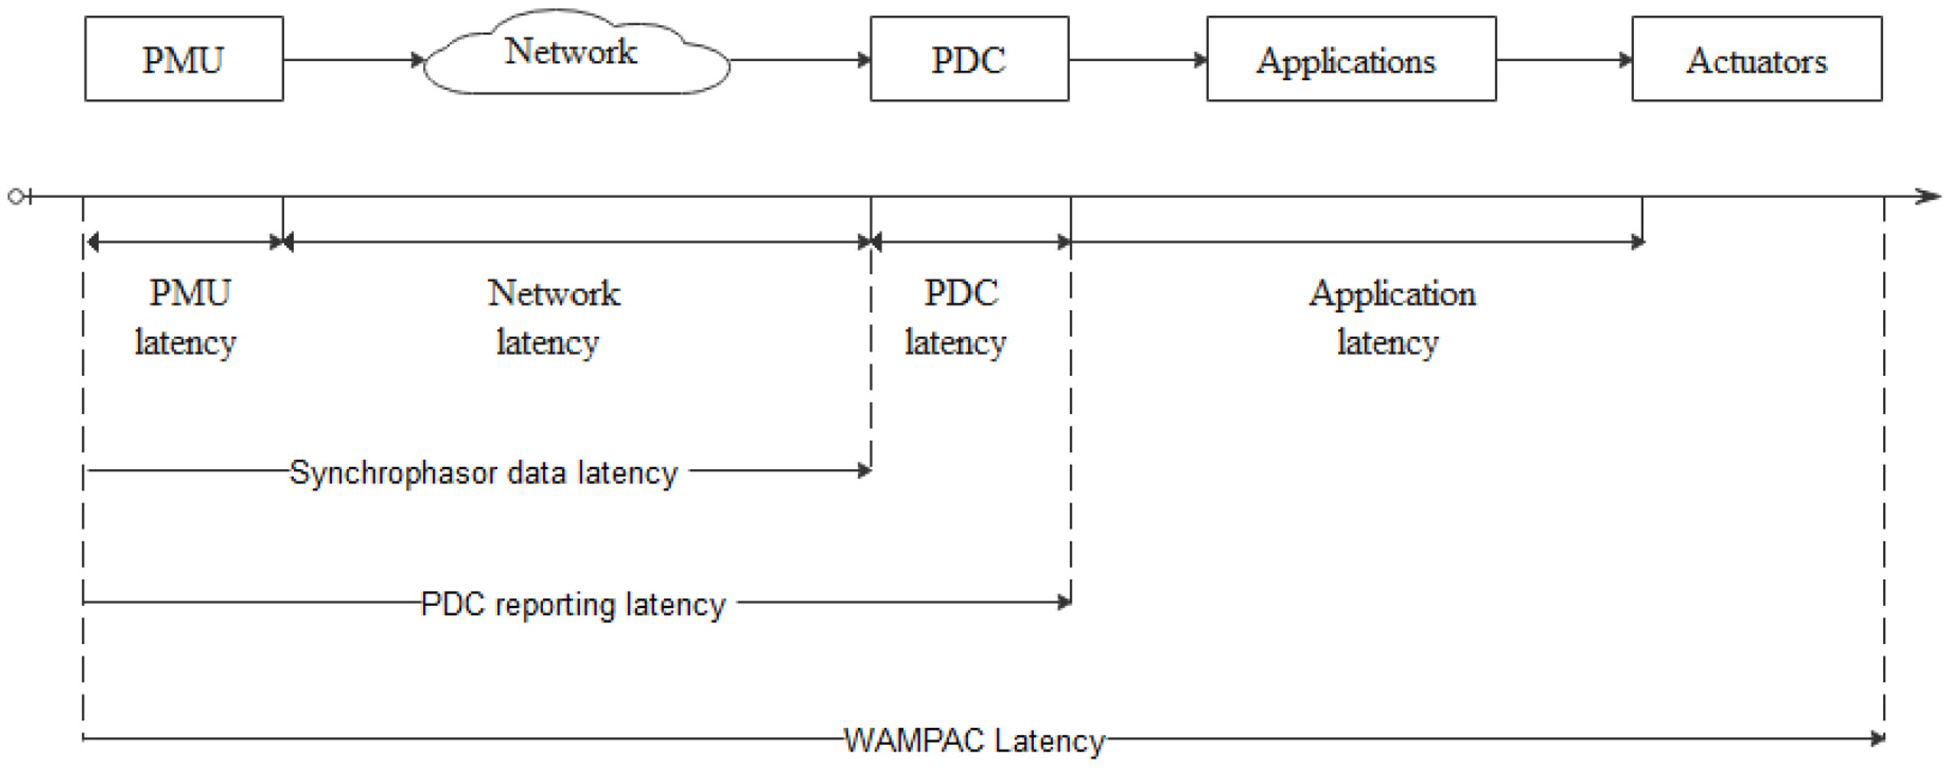
WAMPAC latency.
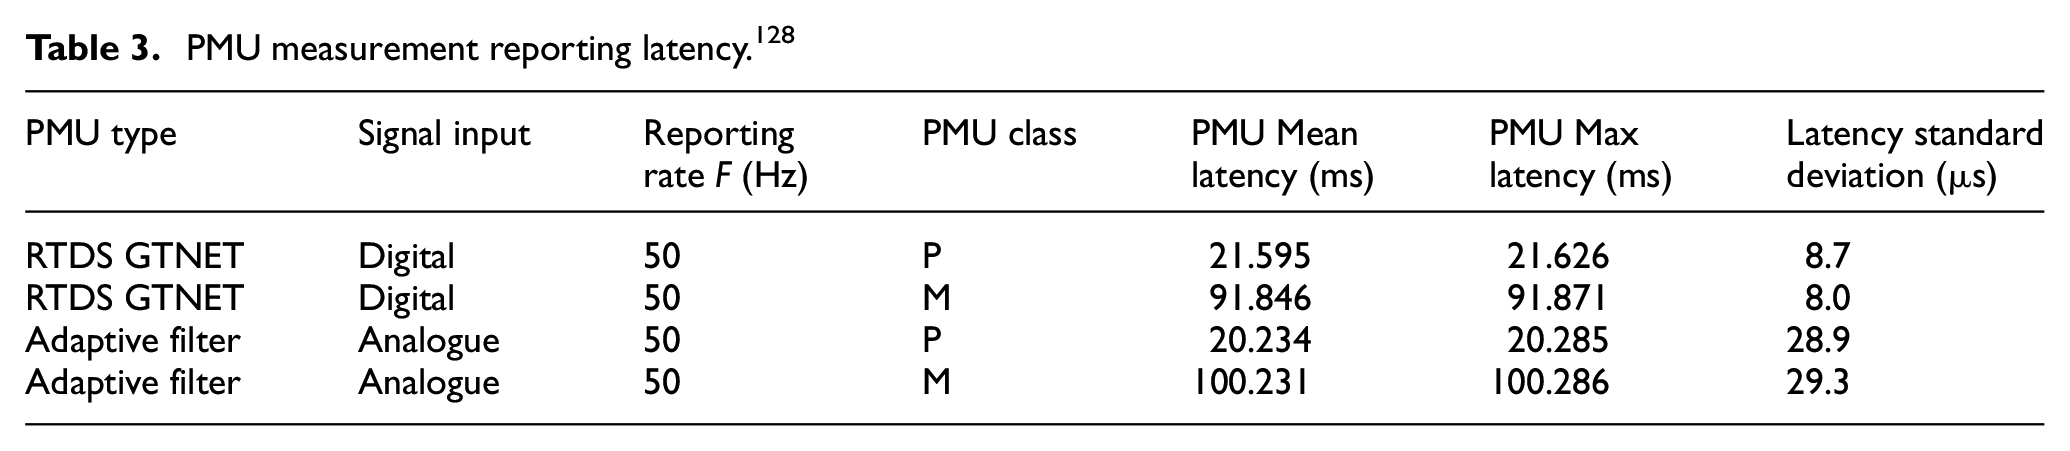
PMU measurement reporting latency delays
The first component is the PMU, its reporting latency for measurements is defined as the time between fault inception time in the EPS, and the time instant the PMU reports the same fault/event. The PMU reporting latency depends on the window length adopted to estimate synchrophasors and synchrophasor estimation time.
37
The PMU supports a synchronized high communication rate which is key for real-time state estimation (RTSE) that is essential for timely overall control of the entire system.
123
The increase in dynamic operating conditions demands a tight end-to-end communication delay requirement, in a few tens of milliseconds.
124
Yang et al.
125
and IEEE
126
each RTSE PMU has an overall data rate of
PMU measurement reporting latency. 128
PDC latency
PDC latency is the difference between an instant a time-stamped message arrives at the PDC and a point in time a dataset that is time-aligned is pushed to its destination application.
100
This time delay comprises two sections, the wait time and the processing time. The wait time kicks off when a new time-stamp hits the PDC and elapses when the timeout associated with it expires and the processing time delay is the time taken by the PDC to aggregate data from several PMUs into time aligned aggregated data set.
100
IEEE Guide C37.244-2013 specifies data aggregation and pushing as very crucial PDC functionalities that reduces the effects of variable latencies introduced by different devices into the phasor network.125,129 This is two functionalities are echoed in Zhu et al.
100
by that the PDC introduces little latency in the synchrophasor network, it can be visualized as a buffer that simply eliminates variable real-time latencies of the synchrophasor data, it achieves this by waiting arbitrarily to accumulate data frames of the same timestamp. Castello et al.
28
reports that the mean for PMU input streams has a latency of
Network latency
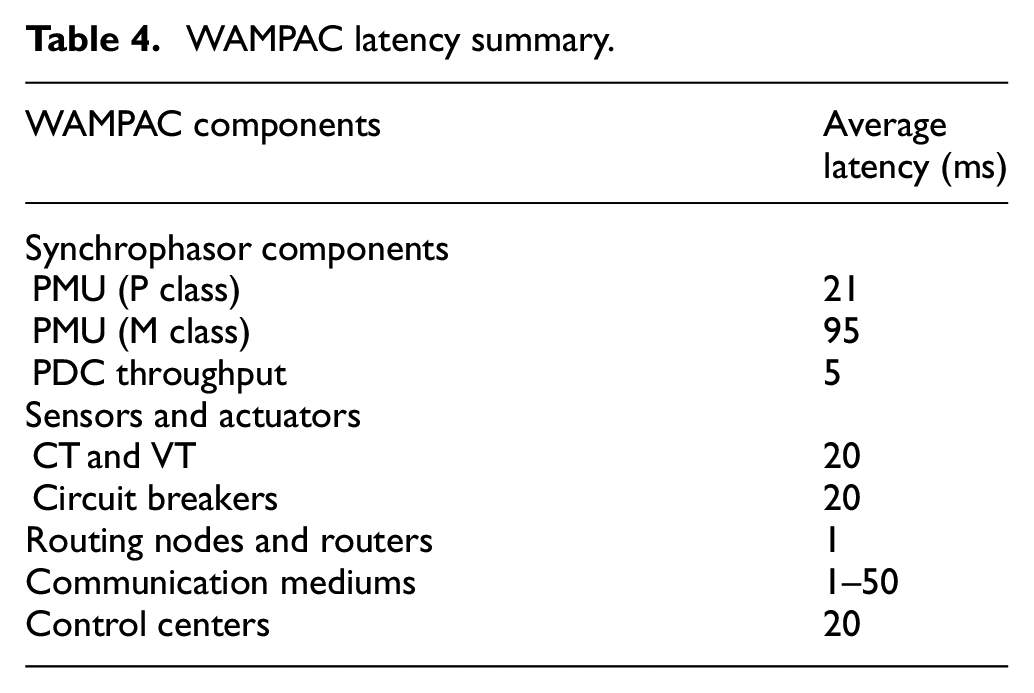
The time it takes for a PMU to transmit a specific data frame on a physical link from its end to the PDC is the communication latency of the synchrophasor network. This time delay, when combined with measurement reporting latency of the PMU, makes up the synchrophasor data latency. 100 Wired and wireless communication mediums have been used both in test benches and real-world set up to carry synchrophasor data, and these two different communication mediums have been thoroughly investigated to reduce the transmission latency. 129 The communication media average latency is summarized in Table 4 and it varies from the fastest communication mediums like optical communication to slower and bandwidth limited ones line PLC.
WAMPAC latency summary.
Discussion and comparison
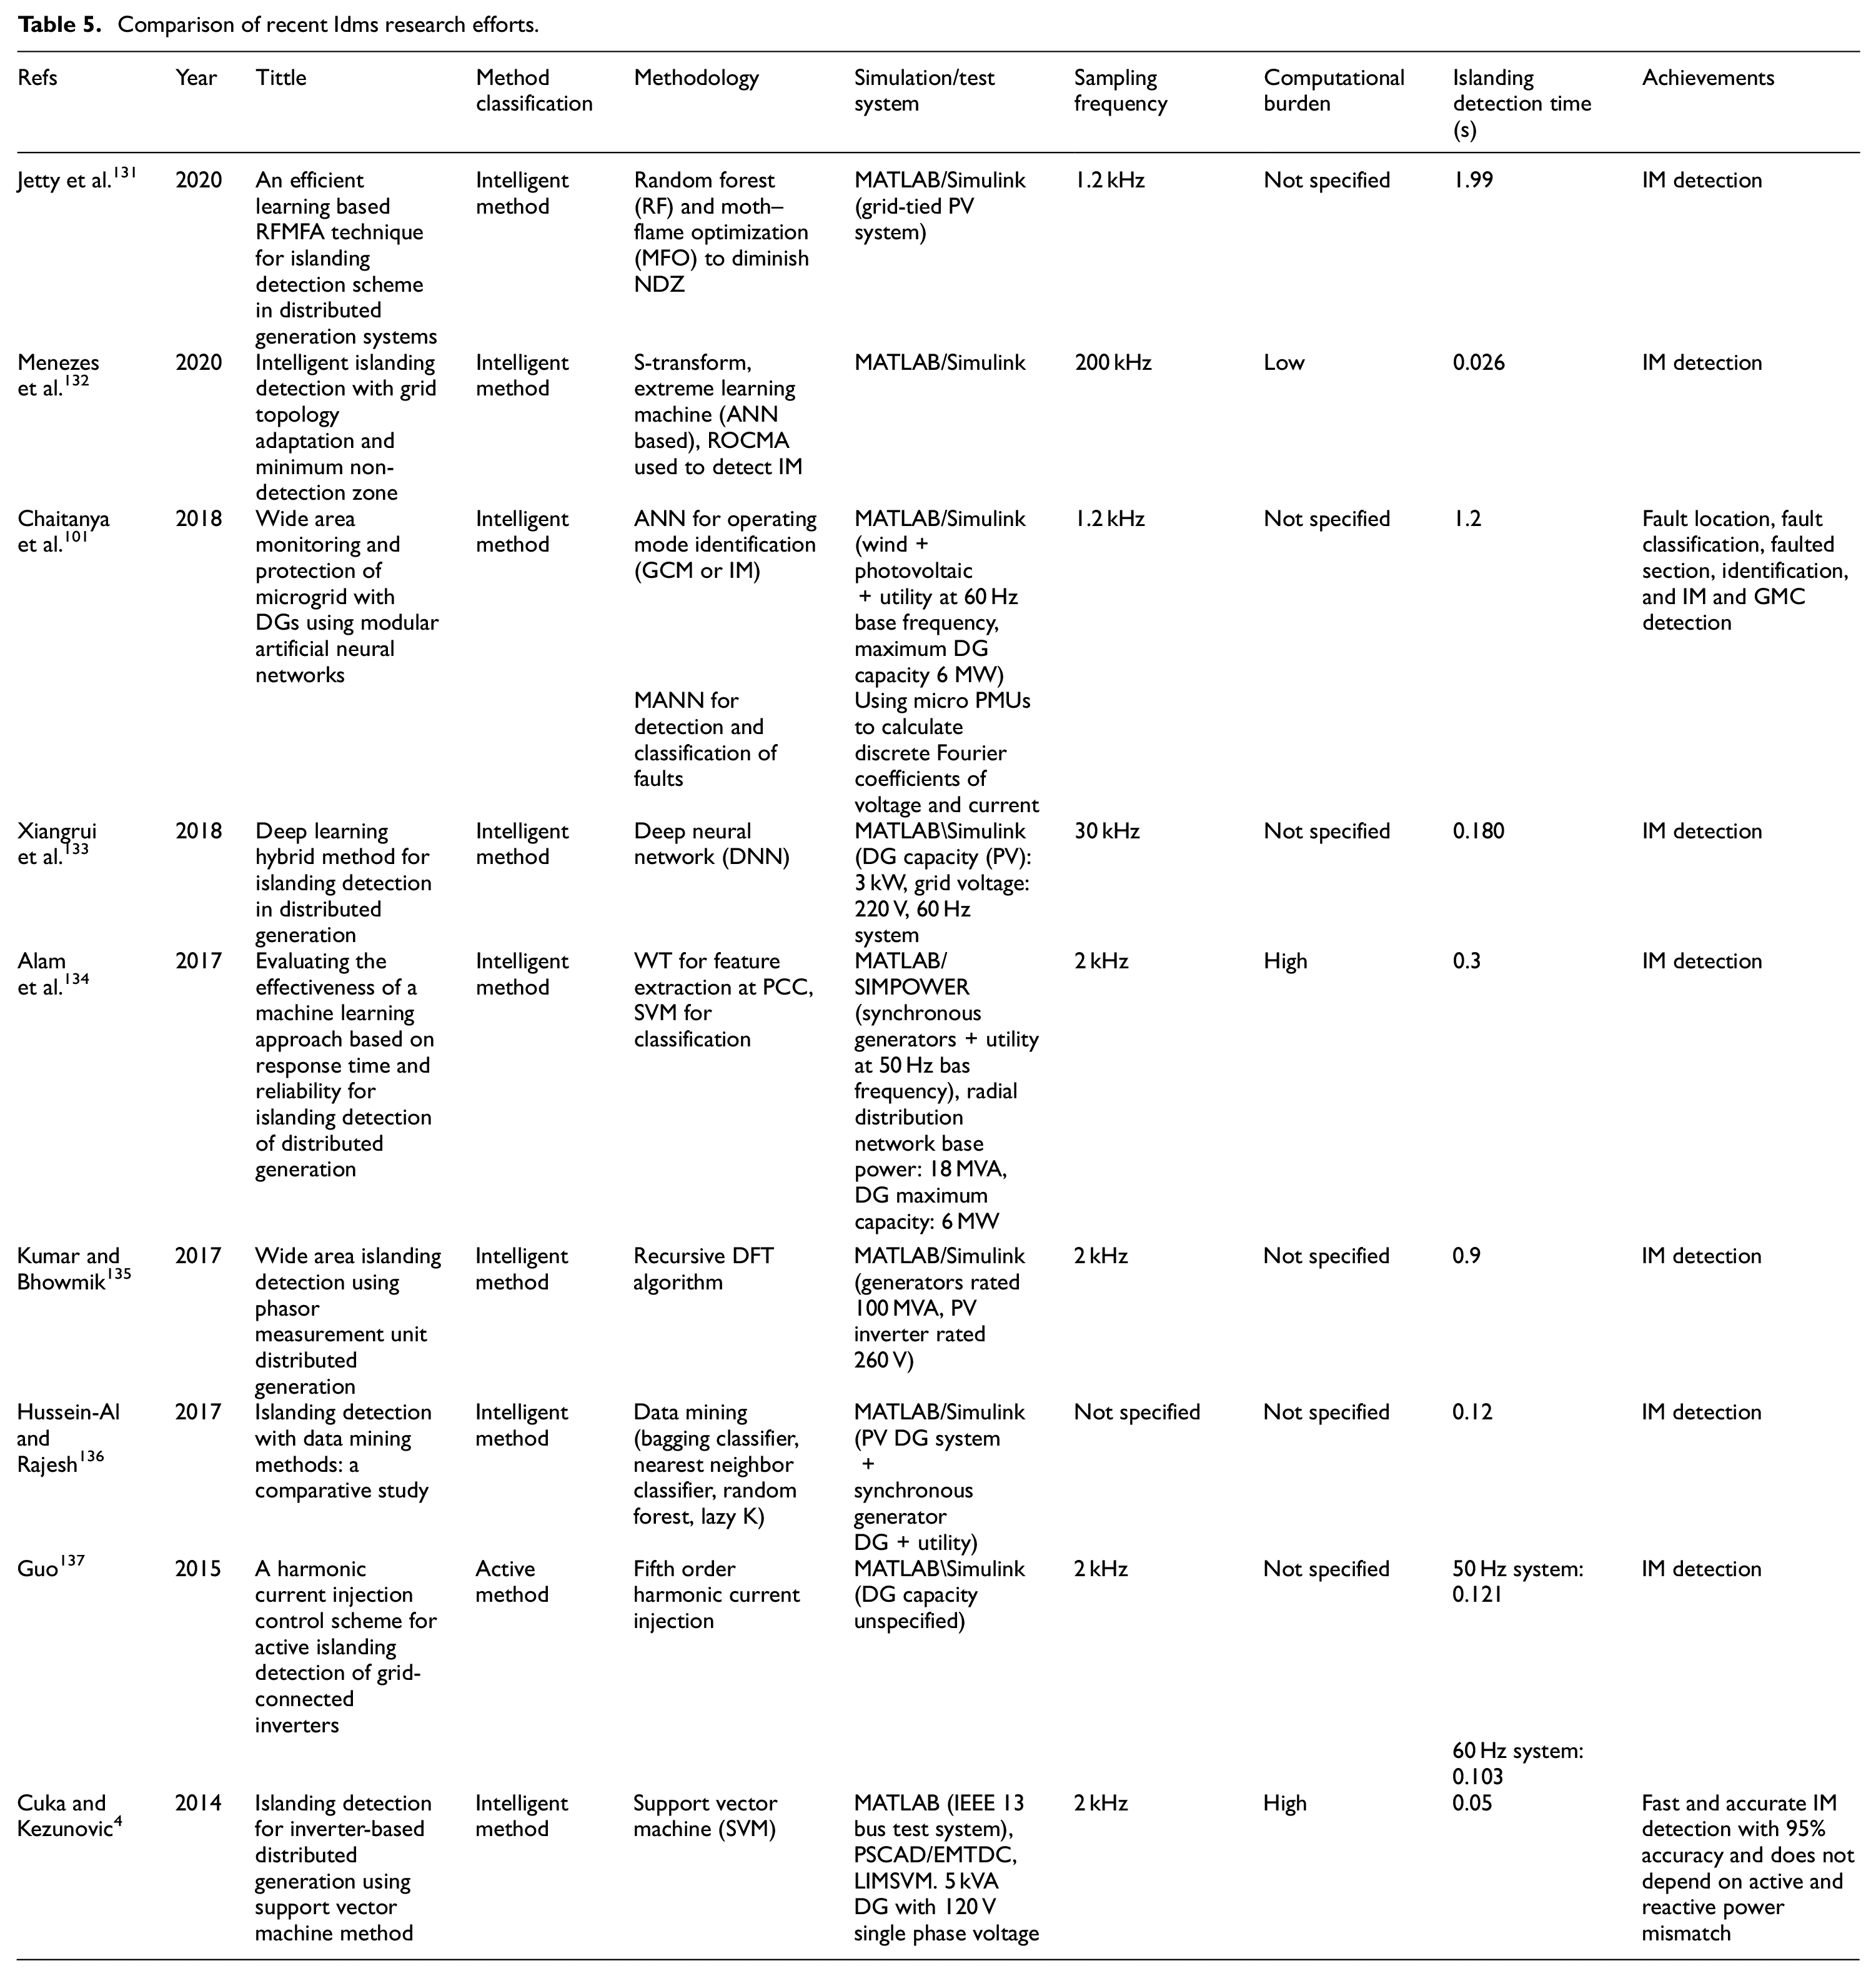
Different islanding detection techniques have been covered and can be classified mainly as local and remote depending on the nature of the deployment. Islanding detection methods continue to evolve as DG penetration levels increase since conventional methods fail to effectively identify islanding under closed matched systems. Remote islanding detection methods have been widely adopted and most of them are applied through the WAMPAC system. Most of the methods aim to satisfy IEEE 1547 islanding detection framework and the UL1741 standard, however comparative analysis from most of the considered literature when considering the reported values of accuracy, specificity, recall, and precision, SVM based methods ranges are relatively better compared to those of Naïve Bayes, Decision tree, ANN-based methods. Even though SVM performs better, the latest methods are showing a general improvement in the computing technology and as such, Random Forest (RF) and Moth–Flame Optimization Idms seem to beat all the above methods but fears are that it has a very high computational time and there cannot be used in WAMPAC based networks. The WAMPAC test scenarios for component latencies show that the WAMPAC system is the best platform for good geographical coverage and its measurement system has a very high accuracy compared to local methods. Computationally intensive methods can run in ultra-high-speed computing processors that make economic sense to deploy at control centers so that they can process a lot of measurements from a wide area.
Different PMU and PDC have been proposed, some perform well for monitoring but not for protection applications, this is because of the time-sensitivity of protection applications. On the considered solutions of the OPP problem, UBGWO seems to be much a better solution for achieving complete EPS observability as opposed to SBO method that under Economic-based observability leaves the security of the system compromised in pursuit of saving costs. On the technical operation of the WAMPAC system components, it is considered reliable with few failures in a year, however, on the security side, TSSA still presents a challenge and when the WAMAPC measurement system is deployed in a plant with a lot of vibrations the system oscillator may get damaged. Different methods from different authors are compared in Table 5.
Comparison of recent Idms research efforts.
Conclusion
This paper presents a review of islanding detection methods as well as the WAMPAC application to the unintentional islanding phenomenon. Issues arising from integrating DGs to the grid are reviewed at length, The Islanding Phenomena is explained in detail and how high penetration of the DGs affects different classes of islanding detection methods by using the Non-detection zone as the method of observing the method’s efficiency. Passive methods are associated with wide NDZ under closed matched DGs and the utility while active methods have a near-zero NDZ but may introduce transients into the system, Communication-based schemes, on the other hand, are expensive and unreliable. All of these methods were reviewed in the light of standards that hinders the operation of DGs in Islanded mode. Efforts to reduce the NDZ led to the development of other intelligent IdMs with a high computational burden but very accurate and reliable. SVM, Decision Tree and Naïve Bayes based algorithm seem to have a low classification errors when performance analysis of each method. Based on the findings from all the sources considered in this paper, SVM classifies IM and GCM better than most machine learning algorithms but it has higher computational burden. WAMPAC systems have been reviewed in-depth to identify all the recent developments to establish all the delays expected and henceforth it can be concluded from the findings that the WAMPAC system on average has a 100 ms latency, and of course depends on the size of the phasor network which is directly related to the number of PMU streams, the communication mediums and security protocols, therefore intelligent Islanding methods has room run in the WAMPAC system and still satisfy the detection time of 0.16 s as dictated by IEEE Std. 1547 framework, this also depends on the computational engine of the processor and the islanding detection method itself. To date, the WAMPAC system offers the best solution to unite huge power networks with DGs and still be able to deploy new intelligent islanding detection methods that are computationally intensive located remotely as per the distributed architecture on high-speed computing hardware and still identify unintentional islanding on record time.
In our future work, the intention is to come up with an SVM based islanding detection algorithm implemented on WAMPAC system improved with time-series based edge computing real-time analytics to ensure low latency, increased bandwidth, improved security and vast storage. This approach will be to ensure that there is enough processing time for SVM based algorithms since they perform better but have huge computational burden.
Footnotes
Appendix
Declaration of conflicting interests
The author(s) declared no potential conflicts of interest with respect to the research, authorship, and/or publication of this article.
Funding
The author(s) received no financial support for the research, authorship, and/or publication of this article.