
Abstract
The power battery simulator is important equipment in new energy vehicle test platform and other industrial fields, and the battery model is the key to emulate the battery characteristics accurately. A novel method of given voltage for the power battery simulator is proposed in the paper. According to the state of charge (SOC) of the power battery, three sub-tables with different resolutions are established corresponding to the initial, stationary, and final stage of SOC. To ensure the accuracy of a given voltage under small data capacity, a successive nearest-neighbor interpolation (SNNI) algorithm is proposed for processing battery model data and the iterative calculation is carried out for the data obtained by looking up the table until it approaches the required value. Simulations and experiments are done on various capacity data tables, which are obtained by employed different sampling ratios to reduce the data capacity, and the influence of iteration number selection on the accuracy of the algorithm is discussed. The results show that, after 4–5 iterations, the given voltage accuracy is controlled within 0.03 V by the SNNI algorithm with only 1.6% capacity of the standard model table, which is greatly improved compared with the traditional method, and the feasibility is verified by executing the proposed algorism in a DSP system.
Introduction
With the increasing pressure of energy crisis and environmental pollution, new energy vehicles, especially pure electric vehicles, have become one of the important solutions. 1 Some governments announced that they will completely ban the sale of traditional fuel vehicles within the next 20 years. China has also launched an exit plan for traditional fuel vehicles. The new energy automobile industry has been identified as one of the key development directions of strategic emerging industries. 2
To achieve the breakthrough of the key technology of electric vehicles, the electric vehicle manufacturers need advanced experimental conditions, and the test platform is the preferred way, which combines the advantages of software simulation and real vehicle test. 3 The software simulation can shorten the development time and reduce the demand for hardware resources, which is suitable for application in the stage of system modeling and algorithm verification. Although the real vehicle test mode is closest to the real environment, it is not flexible and costly. 4 The test platform can not only simulate the actual working conditions of the real vehicle to evaluate the performance parameters of the whole vehicle, but also test the key components. It is of great significance to reduce the test cost and shorten the development cycle. 5
Using a battery simulator instead of an ordinary DC power supply can overcome some shortcomings such as high cost and inconvenience. More importantly, it can simulate the characteristics of power battery which are not possessed by the ordinary DC power supply. 6,7 So the power battery simulator is indispensable equipment for electric vehicle test platforms.
Modeling is the basic step of all kinds of vehicle test platform, which can be divided into static model and dynamic model. 8 Compared with the static model, the dynamic model can reflect more details of the simulated object, but it is also relatively more complex. 9 The battery model, which directly affects the performance of the battery simulator, is the key factor to realize the high fidelity volt-ampere characteristic of the battery. 10 The main task of building the battery model is to set the reference voltage of the battery simulator according to the SOC and the load current.
The existing methods of establishing the battery model include (1) Using a standard battery model. Its accuracy is high, but the model contains exponential function, which is difficult to realize in the chip, so it is not suitable for the dynamic system. 11 (2) Fitting the volt-ampere characteristic curve of the battery by section. Although the calculation of the method is reduced, the error increases significantly. The higher-order equation is used to improve the accuracy, but it is necessary to fit multiple curves under the condition of a large range of working current. Therefore, it results in large computation and long algorithm time and difficult to keep up with the real-time dynamic response of the system. 12,13 (3) Look-up table: It just obtains the battery characteristic data from the standard table by calculating the standard mathematical model in advance or the experimental data. The method can calculate quickly, but there is a contradiction between accuracy and data capacity when directly using the look-up table data. 14,15
The look-up table method is easy to implement and widely used in practice. However, in order to reduce the storage cost, low-resolution data are usually used, so an interpolation algorithm is often used. Interpolation algorithm is generally used in the field of image processing, such as single-image super-resolution 16,17 and image reconstruction technique. 18 The traditional methods such as the nearest-interpolation algorithm 19 and the bilinear interpolation algorithm 20,21 are either not accurate enough or too much computation. Therefore, it is necessary to develop an interpolation algorithm with good performance for reducing the data sample and calculation under the premise of high-accuracy.
In this paper, a new method named successive nearest-neighbor interpolation (SNNI) is proposed to give the output voltage of the power battery simulation system. SNNI algorithm is employed to refine the resolution of the battery model table, so as to improve the precision of given voltage. The key processing of SNNI is iterative operation, which is widely used in many fields, such as optimal bidding strategy for power market, 22 configuration of autonomous CHP system, 23 model parameter estimation of the PEMFCs, 24 and robust control. 25,26 In an iterative way, a large extraction ratio can be adopted for the standard power battery model table to reduce the capacity of the model table; thus, the storage capacity requirement of the battery simulation system is reduced. The effectiveness of this method is proved by simulations and experiments, and the simulation results show that the proposed algorithm can control the absolute error within 0.03 V with only 1.6% capacity of the standard model table.
Background knowledge
Power battery simulator
The typical power battery simulator includes a bidirectional PWM rectifier and a bidirectional DC/DC converter. The controller of the bidirectional PWM rectifier in Figure 1 controls the rectifier unit to obtain a stable DC voltage, while the bidirectional DC/DC controller is used to control the output port voltage that conforms to the volt-ampere characteristics of the power battery. Block diagram of power battery simulator.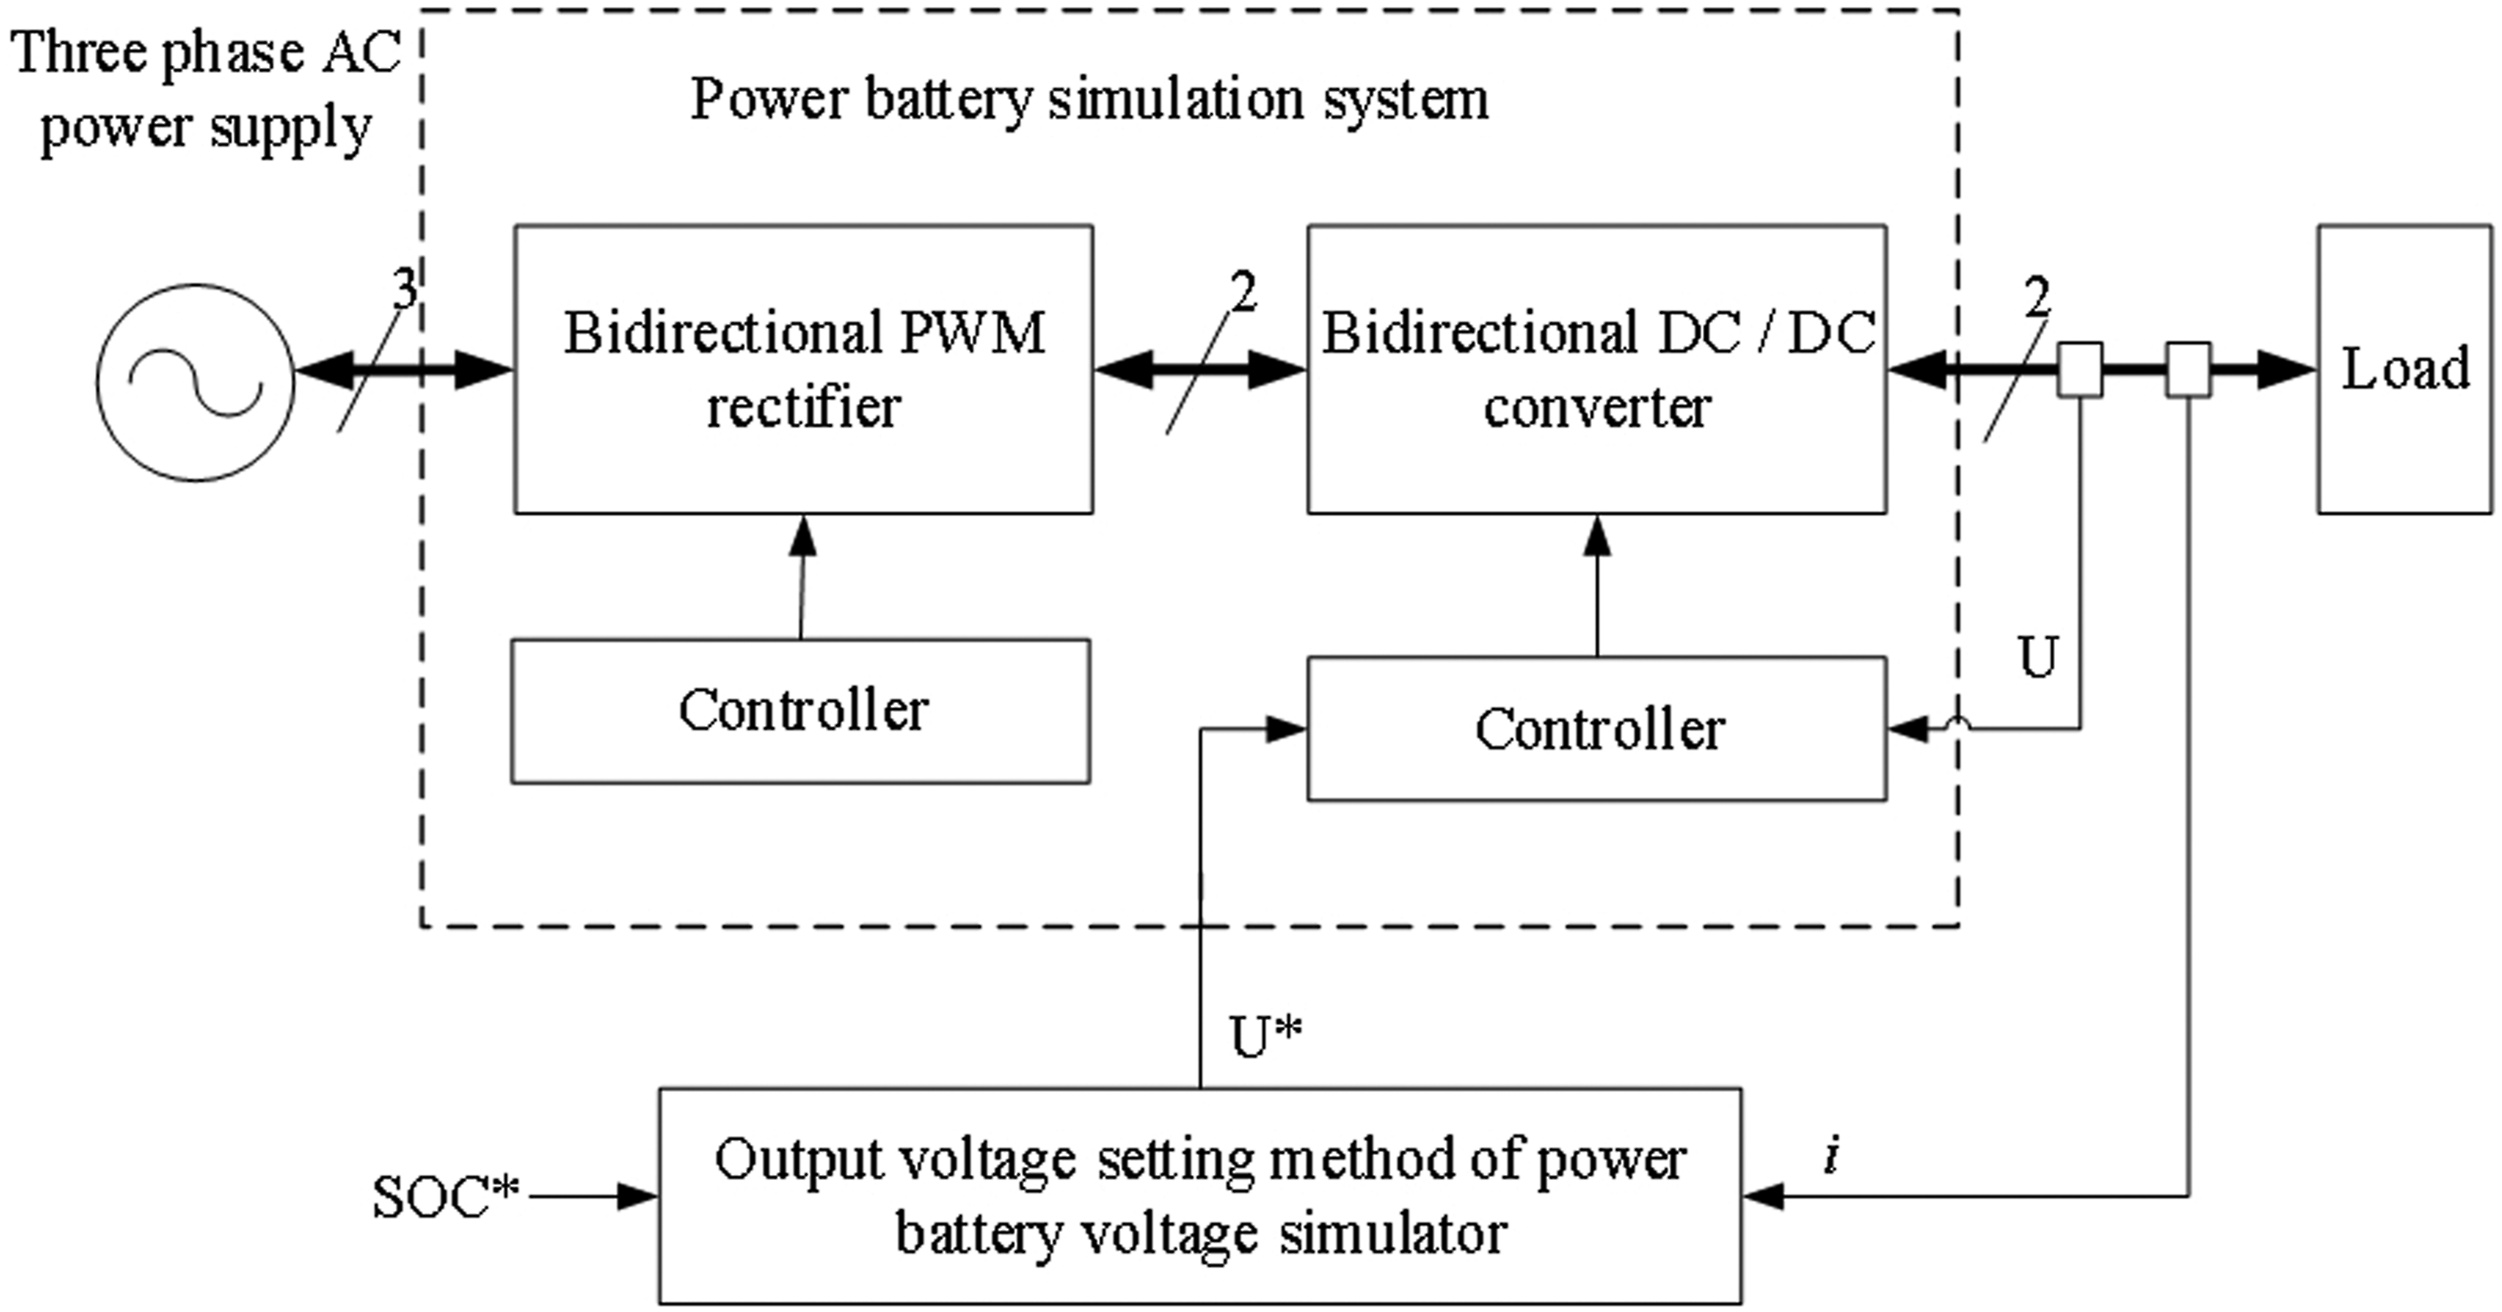
As shown in Figure 1, the output voltage of the bidirectional DC/DC converter is controlled to accurately track the given voltage U* of the battery model. Therefore, the performance of the battery simulator is determined by the voltage tracking ability of the controller and the tracking accuracy of the look-up table algorithm. In this paper, the reduced data capacity battery model tables are established to meet the memory saving requirements, and the traditional interpolation algorithm is improved to meet the accuracy requirements.
Common interpolation method
The battery model tables are built based on the estimated SOC and the sampled current i. They are the indexes employed to locate the corresponding output voltage values in the model tables, which are obtained from the standard battery models or the test data. The system can only save limited data because of the limited memory, so the reduced model tables are set up to meet the system realization. Therefore, an interpolation algorithm is needed to apply the battery model table to improve the accuracy of output voltage.
The battery model table data is similar to the pixel gray table in digital image processing, so it can draw lessons from the interpolation algorithm in image processing. The commonly used interpolation algorithms include the nearest-interpolation algorithm and the bilinear interpolation algorithm. The nearest-neighbor interpolation algorithm locates the point according to the principle of shortest distance and takes the point value as the output. As shown in Figure 2, the U point to be obtained as the output voltage by carrying out interpolation algorithm on the four voltage values U1、U2、U3, and U4 which are adjacent to the U points in the model table. Since the coordinate position of the U1 is the shortest distance from the U point, it is assigned to the point as the output value. The procedure of the nearest-neighbor algorithm.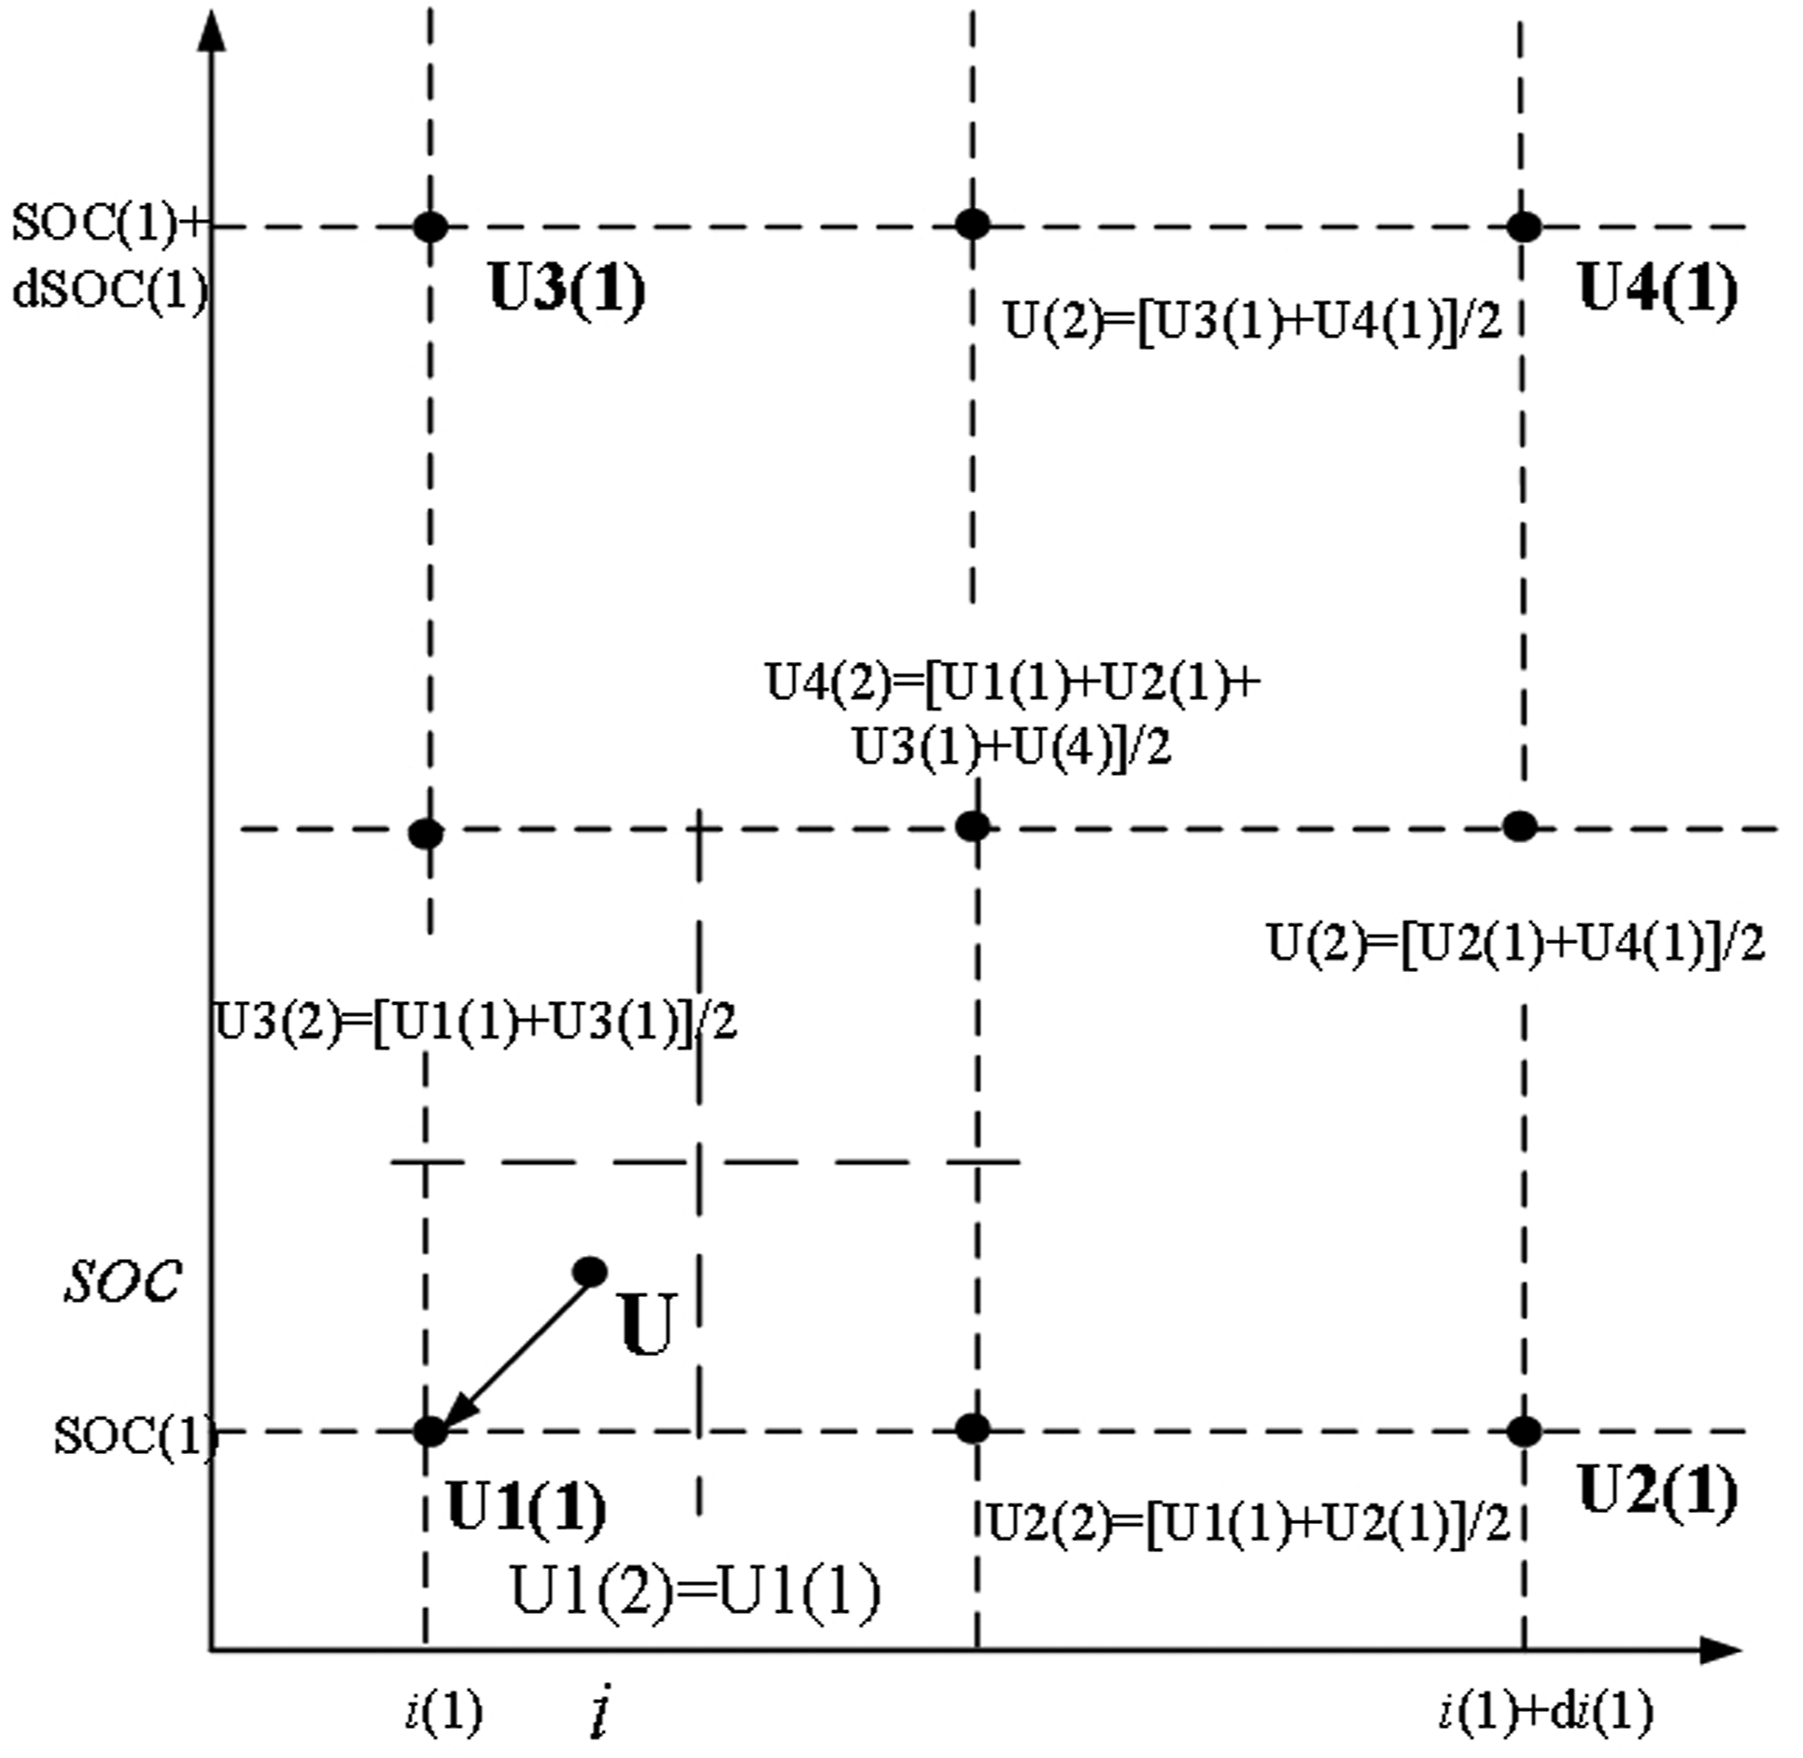
The bilinear interpolation is a linear interpolation in two directions by using the four adjacent voltages in the model table. Taking Figure 2 as an example, the four adjacent U points in the model table are U1 (i1, SOC1), U2 (i1+di1, SOC1), U3 (i1, SOC1+dSOC1), and U4 (i1+di1, SOC1+dSOC1), respectively. To obtain the voltage value of the point U (i, SOC), two linear interpolations are carried out in the i direction and the SOC direction. The specific calculation process and related formulas are illustrated in Ref. 15.
SNNI algorithm
From the above introduction, it can be seen that the calculation burden of the nearest-interpolation algorithm is light, but it can only output the voltage value in the model table, which will cause the output voltage of the battery simulator to be discontinuous and inaccuracy. The bilinear interpolation algorithm can give a smooth output voltage, but the calculation burden is heavy. In this paper, based on the nearest-interpolation algorithm, multiple iterative operations are used to make the output voltage value close to the output voltage value of the original model data, which is very close to the actual battery output voltage value. Because the method approximates the actual value by iteration, it is named as successive nearest-neighbor interpolation (SNNI) algorithm.
Workflow
Figure 3 is the flow chart of the voltage given method for power battery simulator in this paper. As can be seen from Figure 3, it includes three parts: SOC estimation, power battery model tables, and the SNNI interpolation algorithm. Among them, SOC estimation is realized by using ampere-time method according to the initial value SOC* and the load current i. Workflow diagram.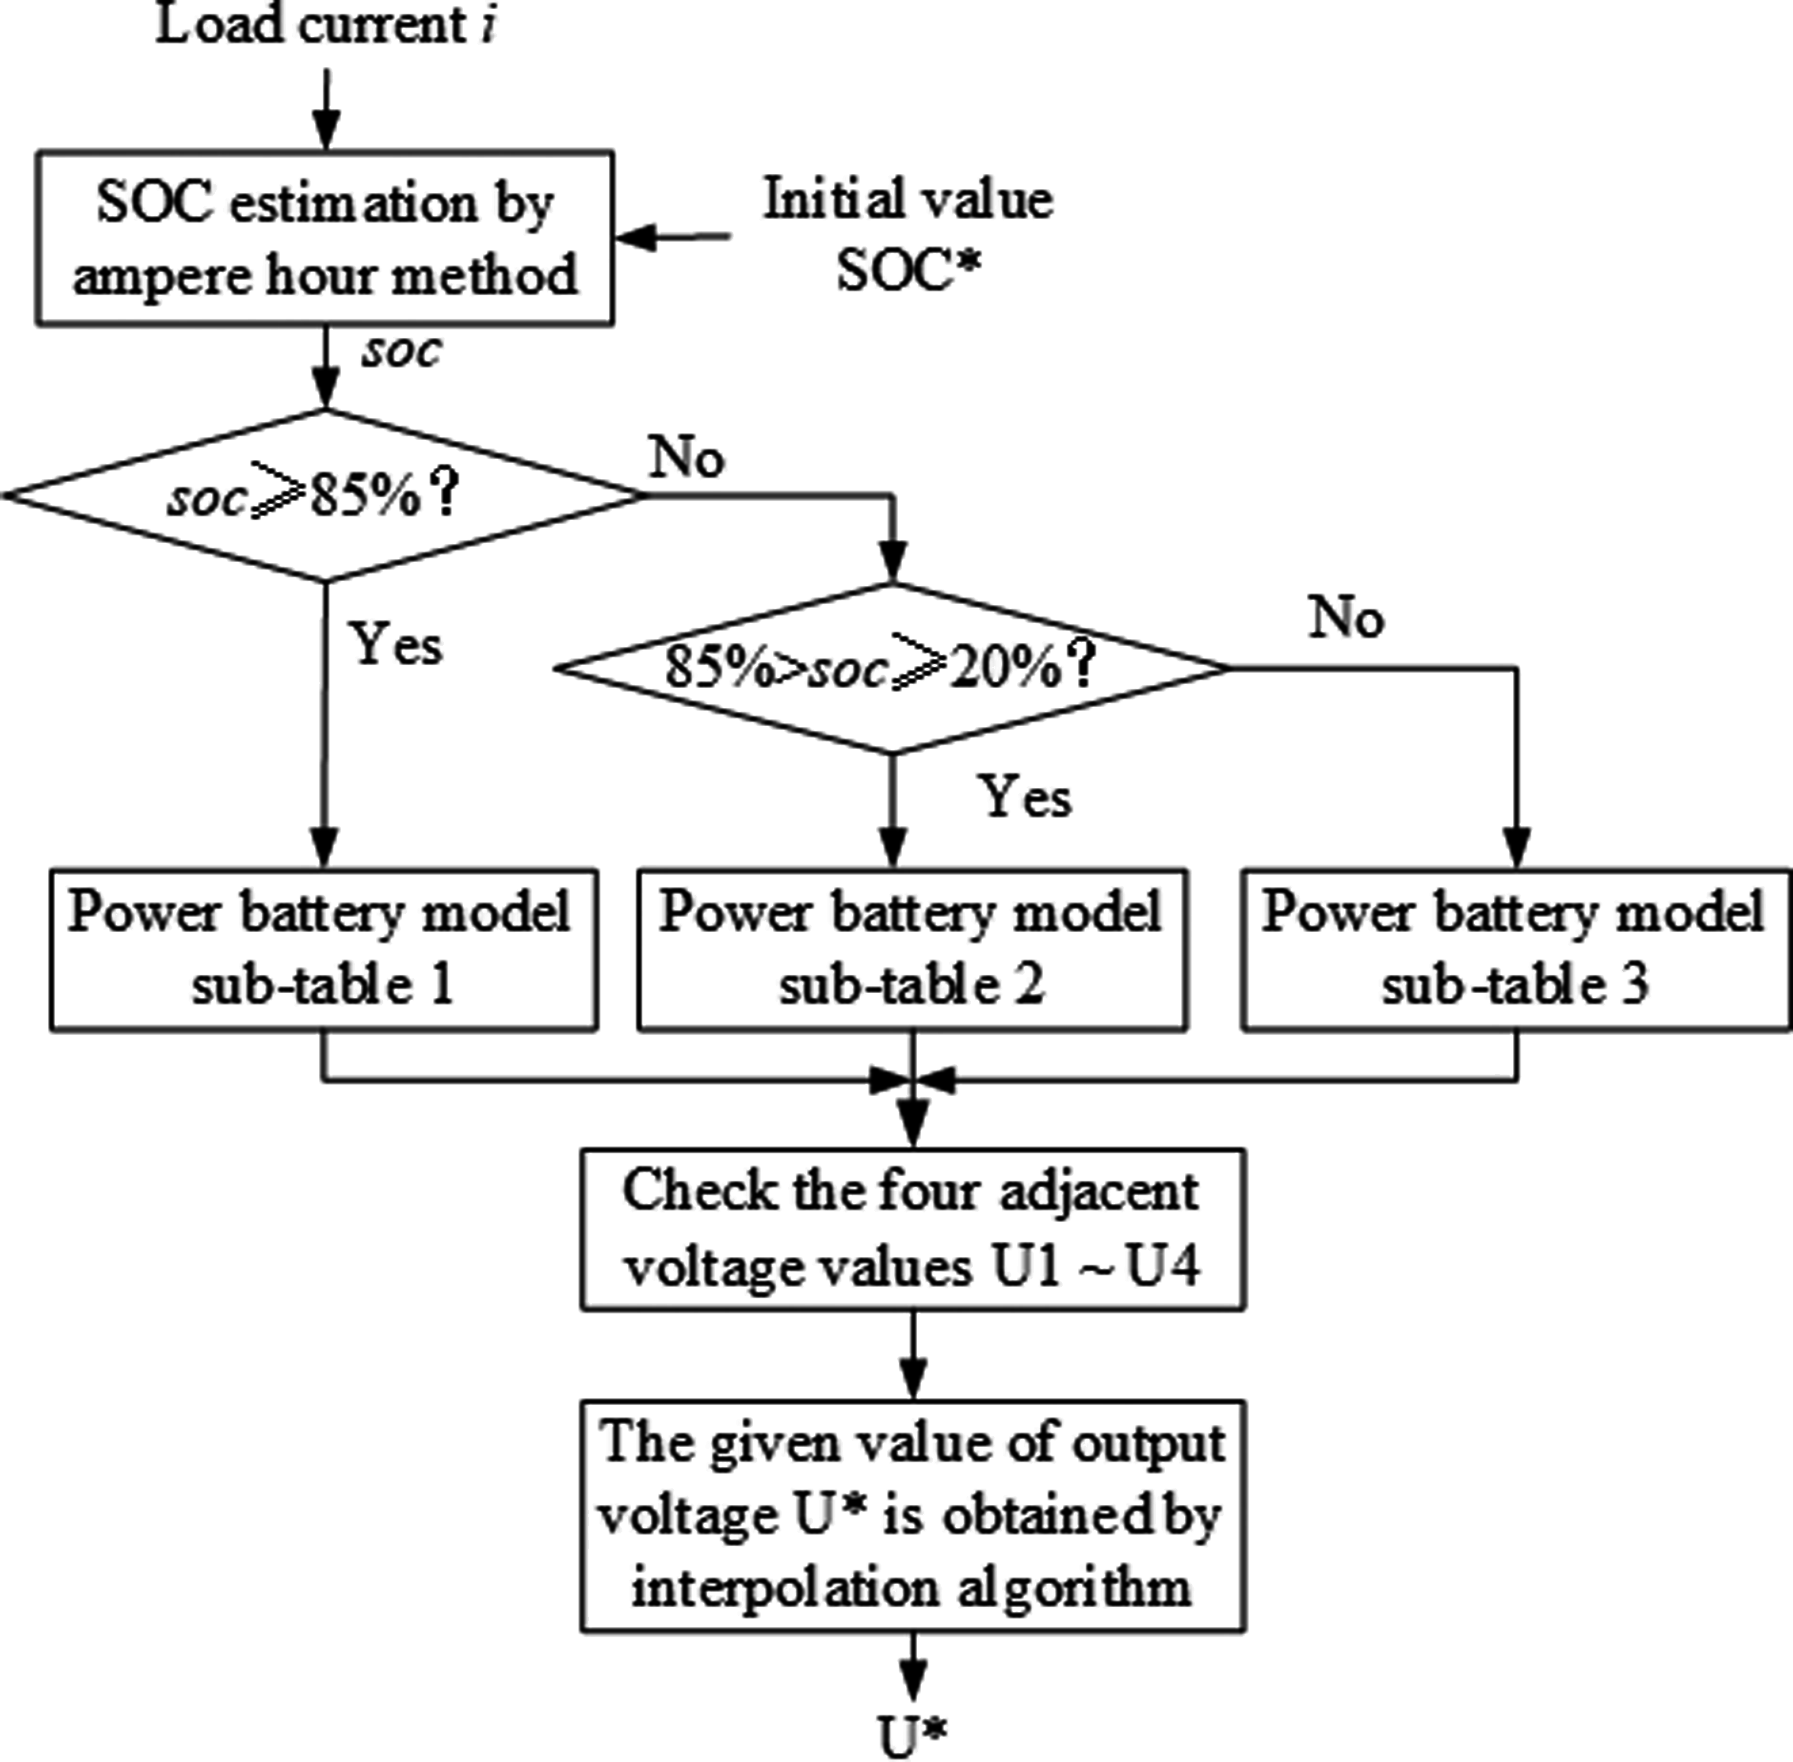
Considering that the output voltage changes rapidly when the power battery SOC in the stage of beginning and end, the model table is divided into three sub-tables. They are as follows: when soc≥85%, it is called model sub-table 1; and when 85%>soc≥20%, it is called model sub-table 2; and when soc<20%, it is called model sub-table 3. Since the V-I characteristic curves of the power battery fluctuate greatly in the SOC range of 5%–20% and 85%–100%, this makes the bigger difference of the voltage value between two indexes after discrete. While there are very small fluctuations in the V-I characteristic curve when SOC range between 20% and 85%. Therefore, the sub-table 1 and the sub-table 3 use low SOC resolution ΔSOC, while it is higher in the sub-table 2. Because the change of current has little effect on voltage, the three sub-tables have the same current resolution Δi.
Figure 3 shows that the four adjacent voltage values in the model sub-table can be determined by using the estimated SOC and the sampled current i after selecting the corresponding sub-table. The four voltage values are iteratively calculated by the SNNI algorithm, and the given voltage value U* is finally output.
Principle of SNNI algorithm
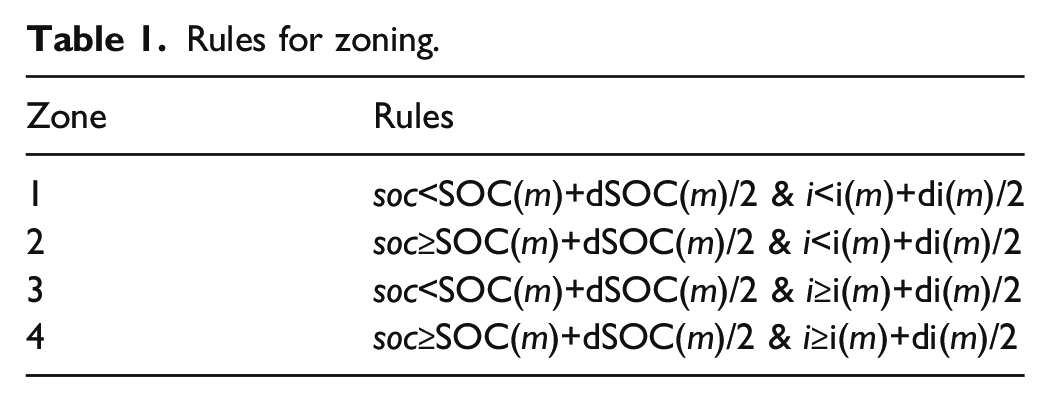
As mentioned above, the SNNI algorithm looks up the power battery model sub-table according to the estimated SOC and the sampled load current i, and then obtains four adjacent voltage values U1–U4. The four points are regarded as an initial rectangle, and they are iteratively calculated as follows until a given voltage value is obtained. (1) Based on the rules of Table 1, the rectangle is divided into four small ones, defined as the zones1–zone 4; let m = 1, m is the number of iterations. (2) The nearest one of the Un(m) (n =1,2,3,4) in the same zone with U is the invariant point. (3) The four vertex U1(m+1), U2(m+1), U3(m+1), U4(m+1) of the update zone determined by points U are updated with the formula in Table 2, which are defined in (6)–(10). (4) Let m=m+1, if m<M (M is the maximum number of iterations), return to the step (1) for locating further refined zone, otherwise the algorithm is terminated. Rules for zoning. Ux(m) update method.
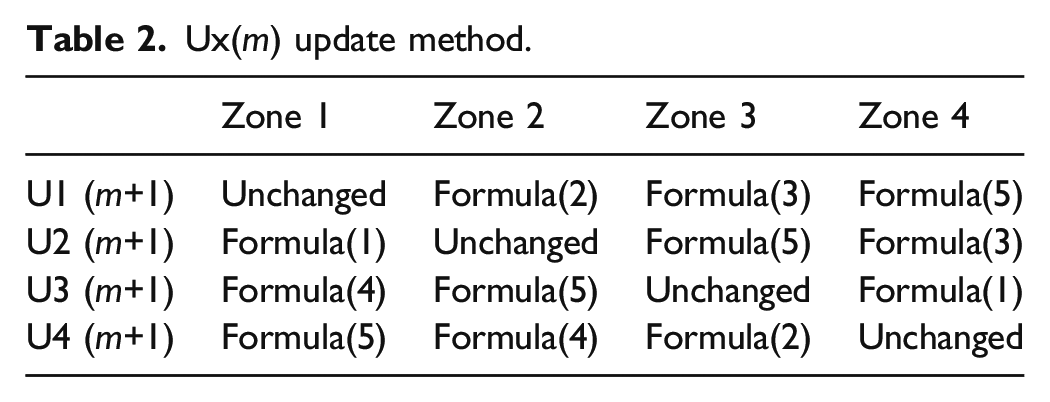
The formulas used to update Un in Table 2 are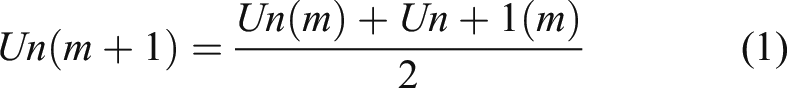
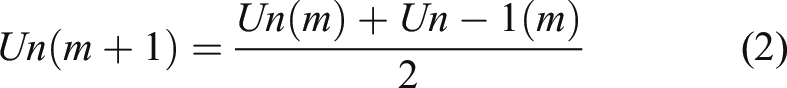
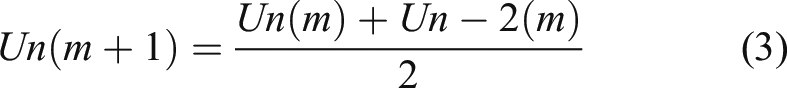
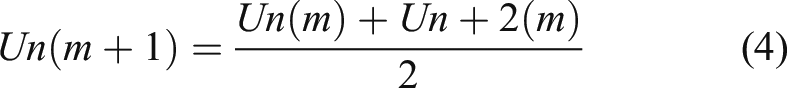
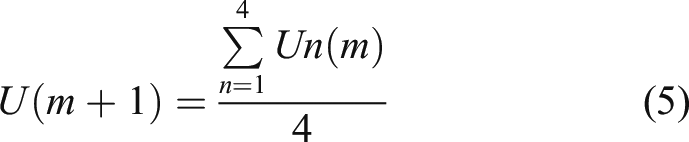
Formula (1)–(5) describe the voltage value updating methods of the left point, the right point, the upper point, the lower point, and the diagonal point relative to the invariant point.
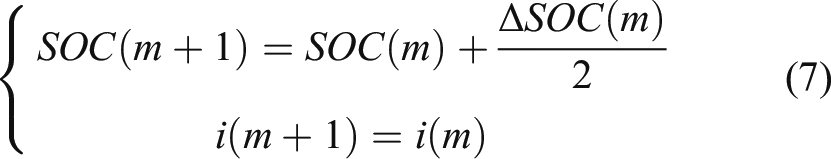
The coordinates SOC and i also need to be updated after each iteration and the updating formulas of zone 1–zone 4 are list in (6)–(9).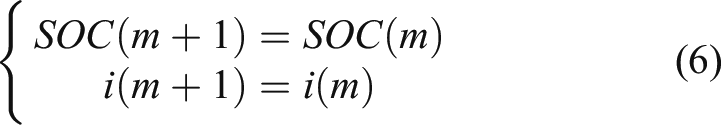
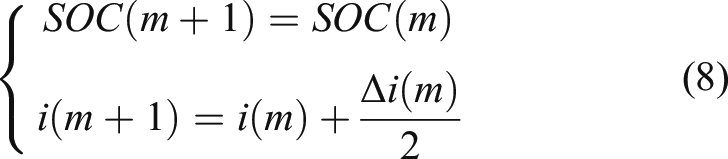

The resolution updating formula of SOC and i can be expressed as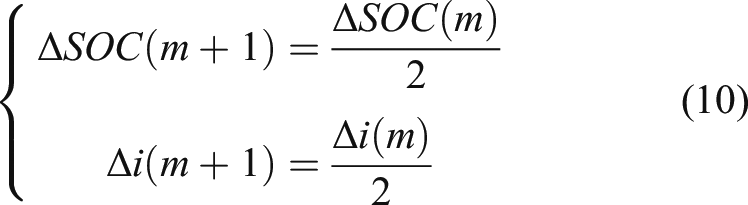
When m = M, formula (5) is used to calculate the given voltage U*.
Simulations
Determining the number of iteration
As described in the Common interpolation method section, the proposed algorithm needs to be completed through multiple iterations. So the first step is to determine the number of iterations. Figure 4 shows the error between the given voltage U* and the reference value after each iteration under different SOC and different currents i. From Figure 4, we can see that the absolute error is less than 0.005 V when the number of iterations is greater than 5. When the number of iterations is 10, the absolute error is within 0.0005 V. In this paper, the number of iterations is set to 10. Determination of the Number of iterations.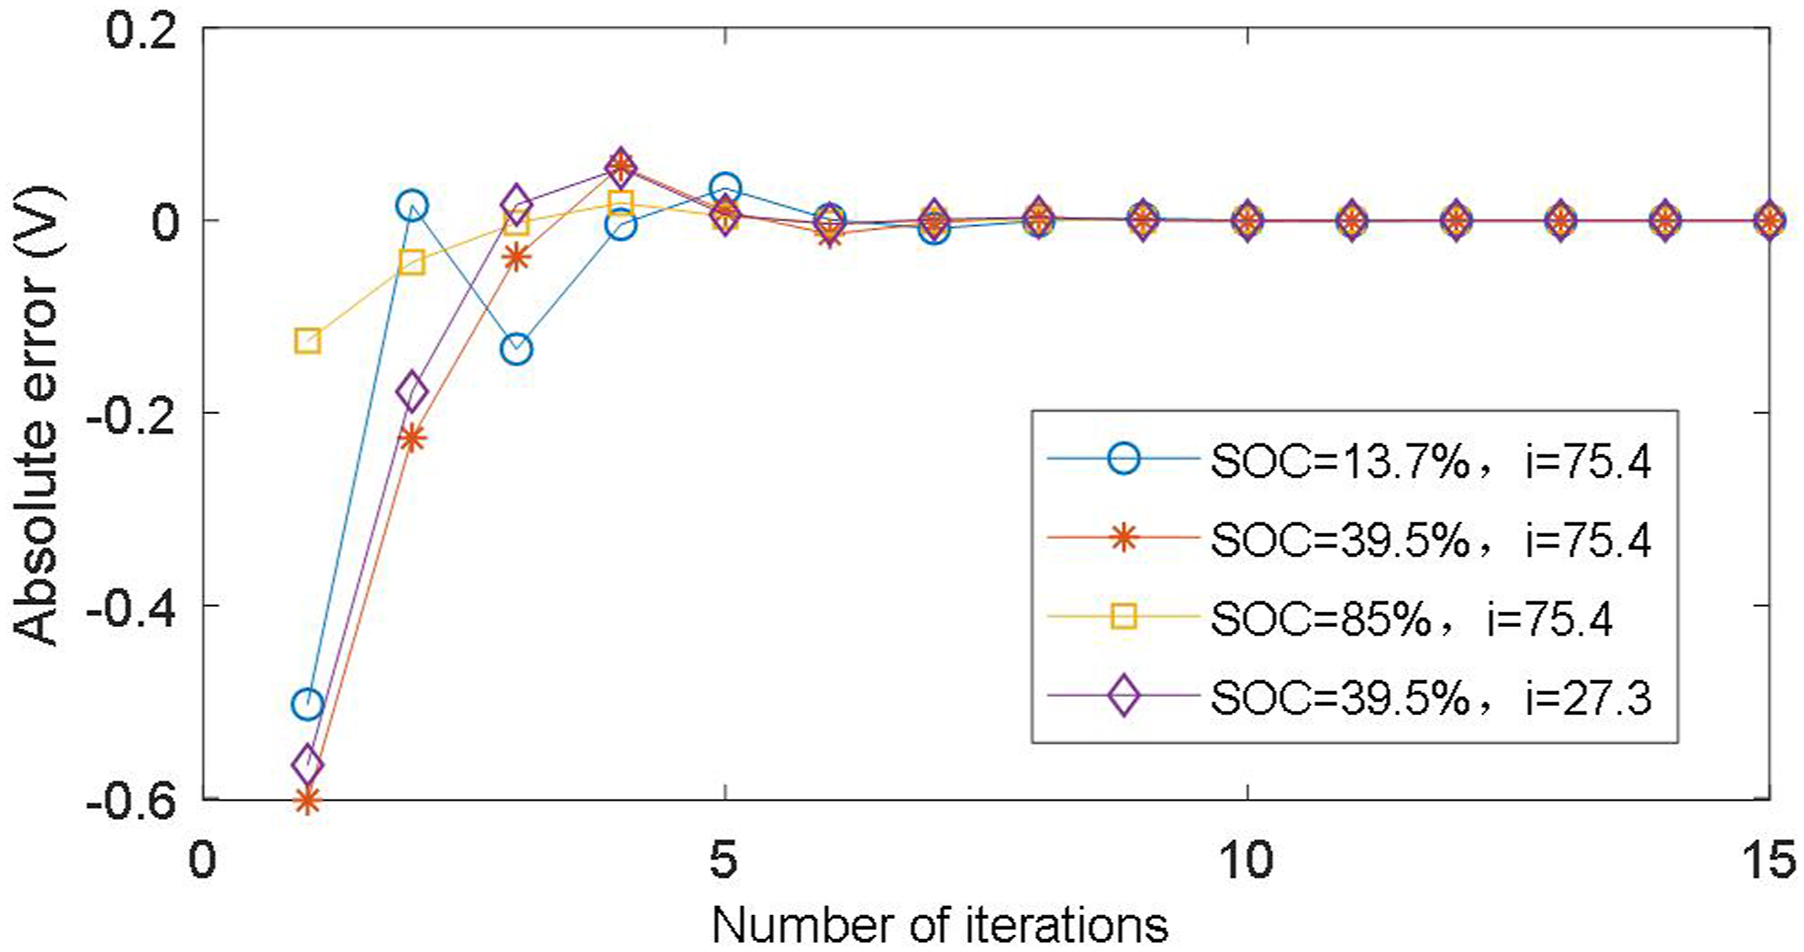
Determining model table data capacity
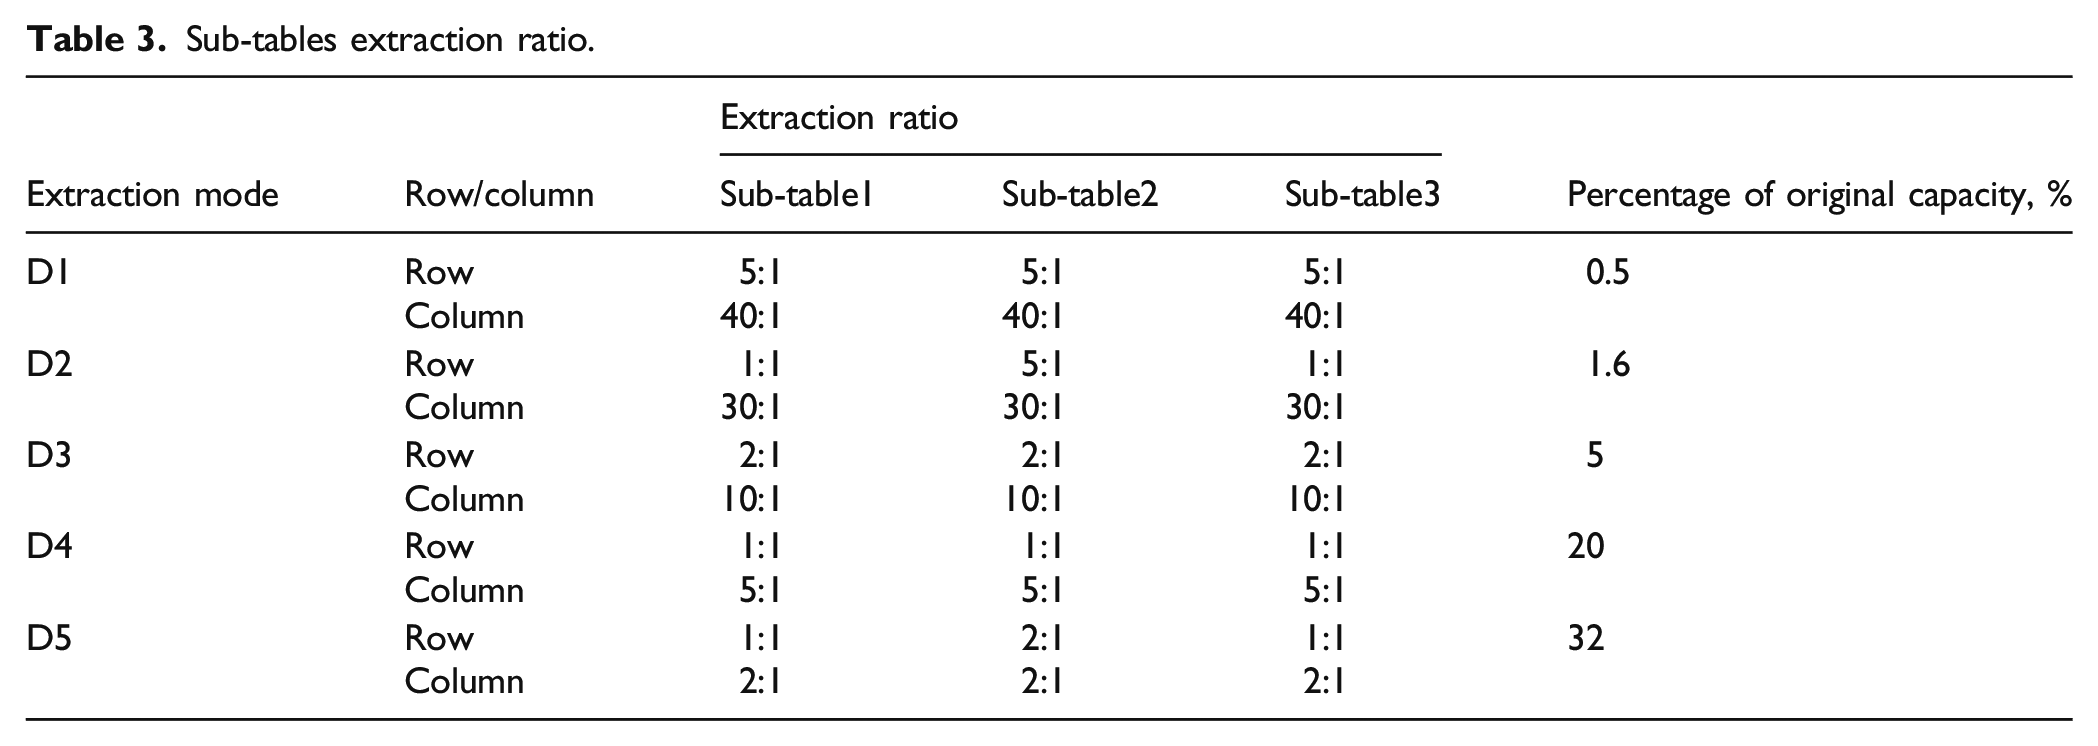
Sub-tables extraction ratio.
Accuracy comparison of different extraction modes.
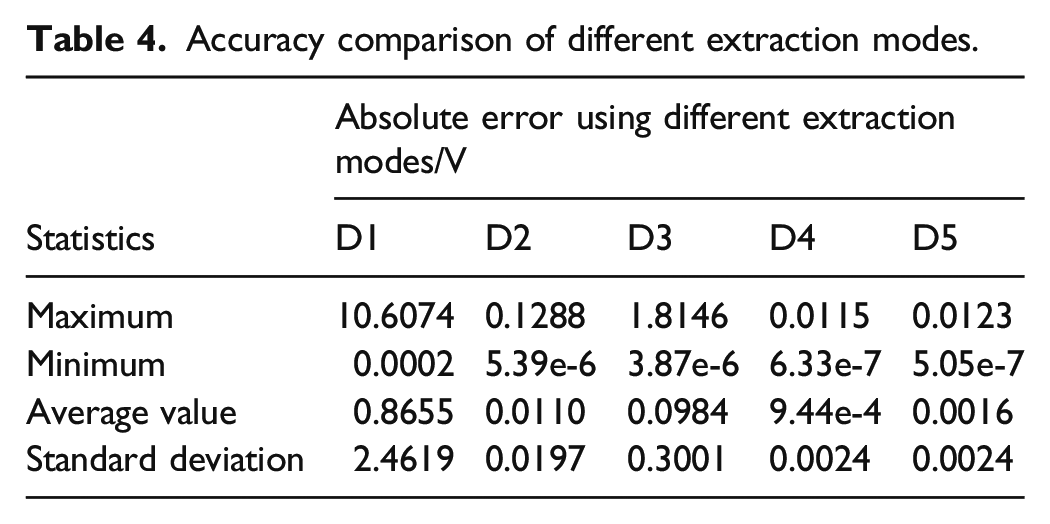
As can be seen from Table 4, the absolute errors of D1and D3 extraction mode are over 1V, and the standard deviations are greater than 0.3 V. In this case, the results are too divergent to meet the accuracy requirements, and the reason is the proportion of extraction is too large on the row direction in sub-table 1 and sub-table 3. The absolute errors of D2, D4, and D5 extraction mode are under 0.2 V, and the standard deviations are less than 0.02 V. These statistics show that the algorism has good performance in all four zones by using D2, D4, and D5 extraction mode. Because the D2 extraction mode has the smallest capacity and can meet the accuracy requirement, it is selected as the data capacity for the subsequent experiments.
Comparison with nearest-neighbor interpolation
A standard power battery model in MATLAB/SIMULINK is /used to generate benchmark table, and the bilinear interpolation algorithm is used to find the reference table to obtain the standard voltage value. Based on the D2 extraction mode, the nearest-interpolation algorithm (M1) and the SNNI method (M2), which is proposed in this paper, are used to calculate the given voltage of the battery simulator. The absolute errors of the given voltages obtained by the two methods are analyzed. The simulations were carried out with fixed SOC (5%≤SOC≤100%, random value) and different current (−100A≤i≤100A, 100 samples are randomly generated). Parts of the results are shown in Figure 5. Absolute errors of M1 and M2.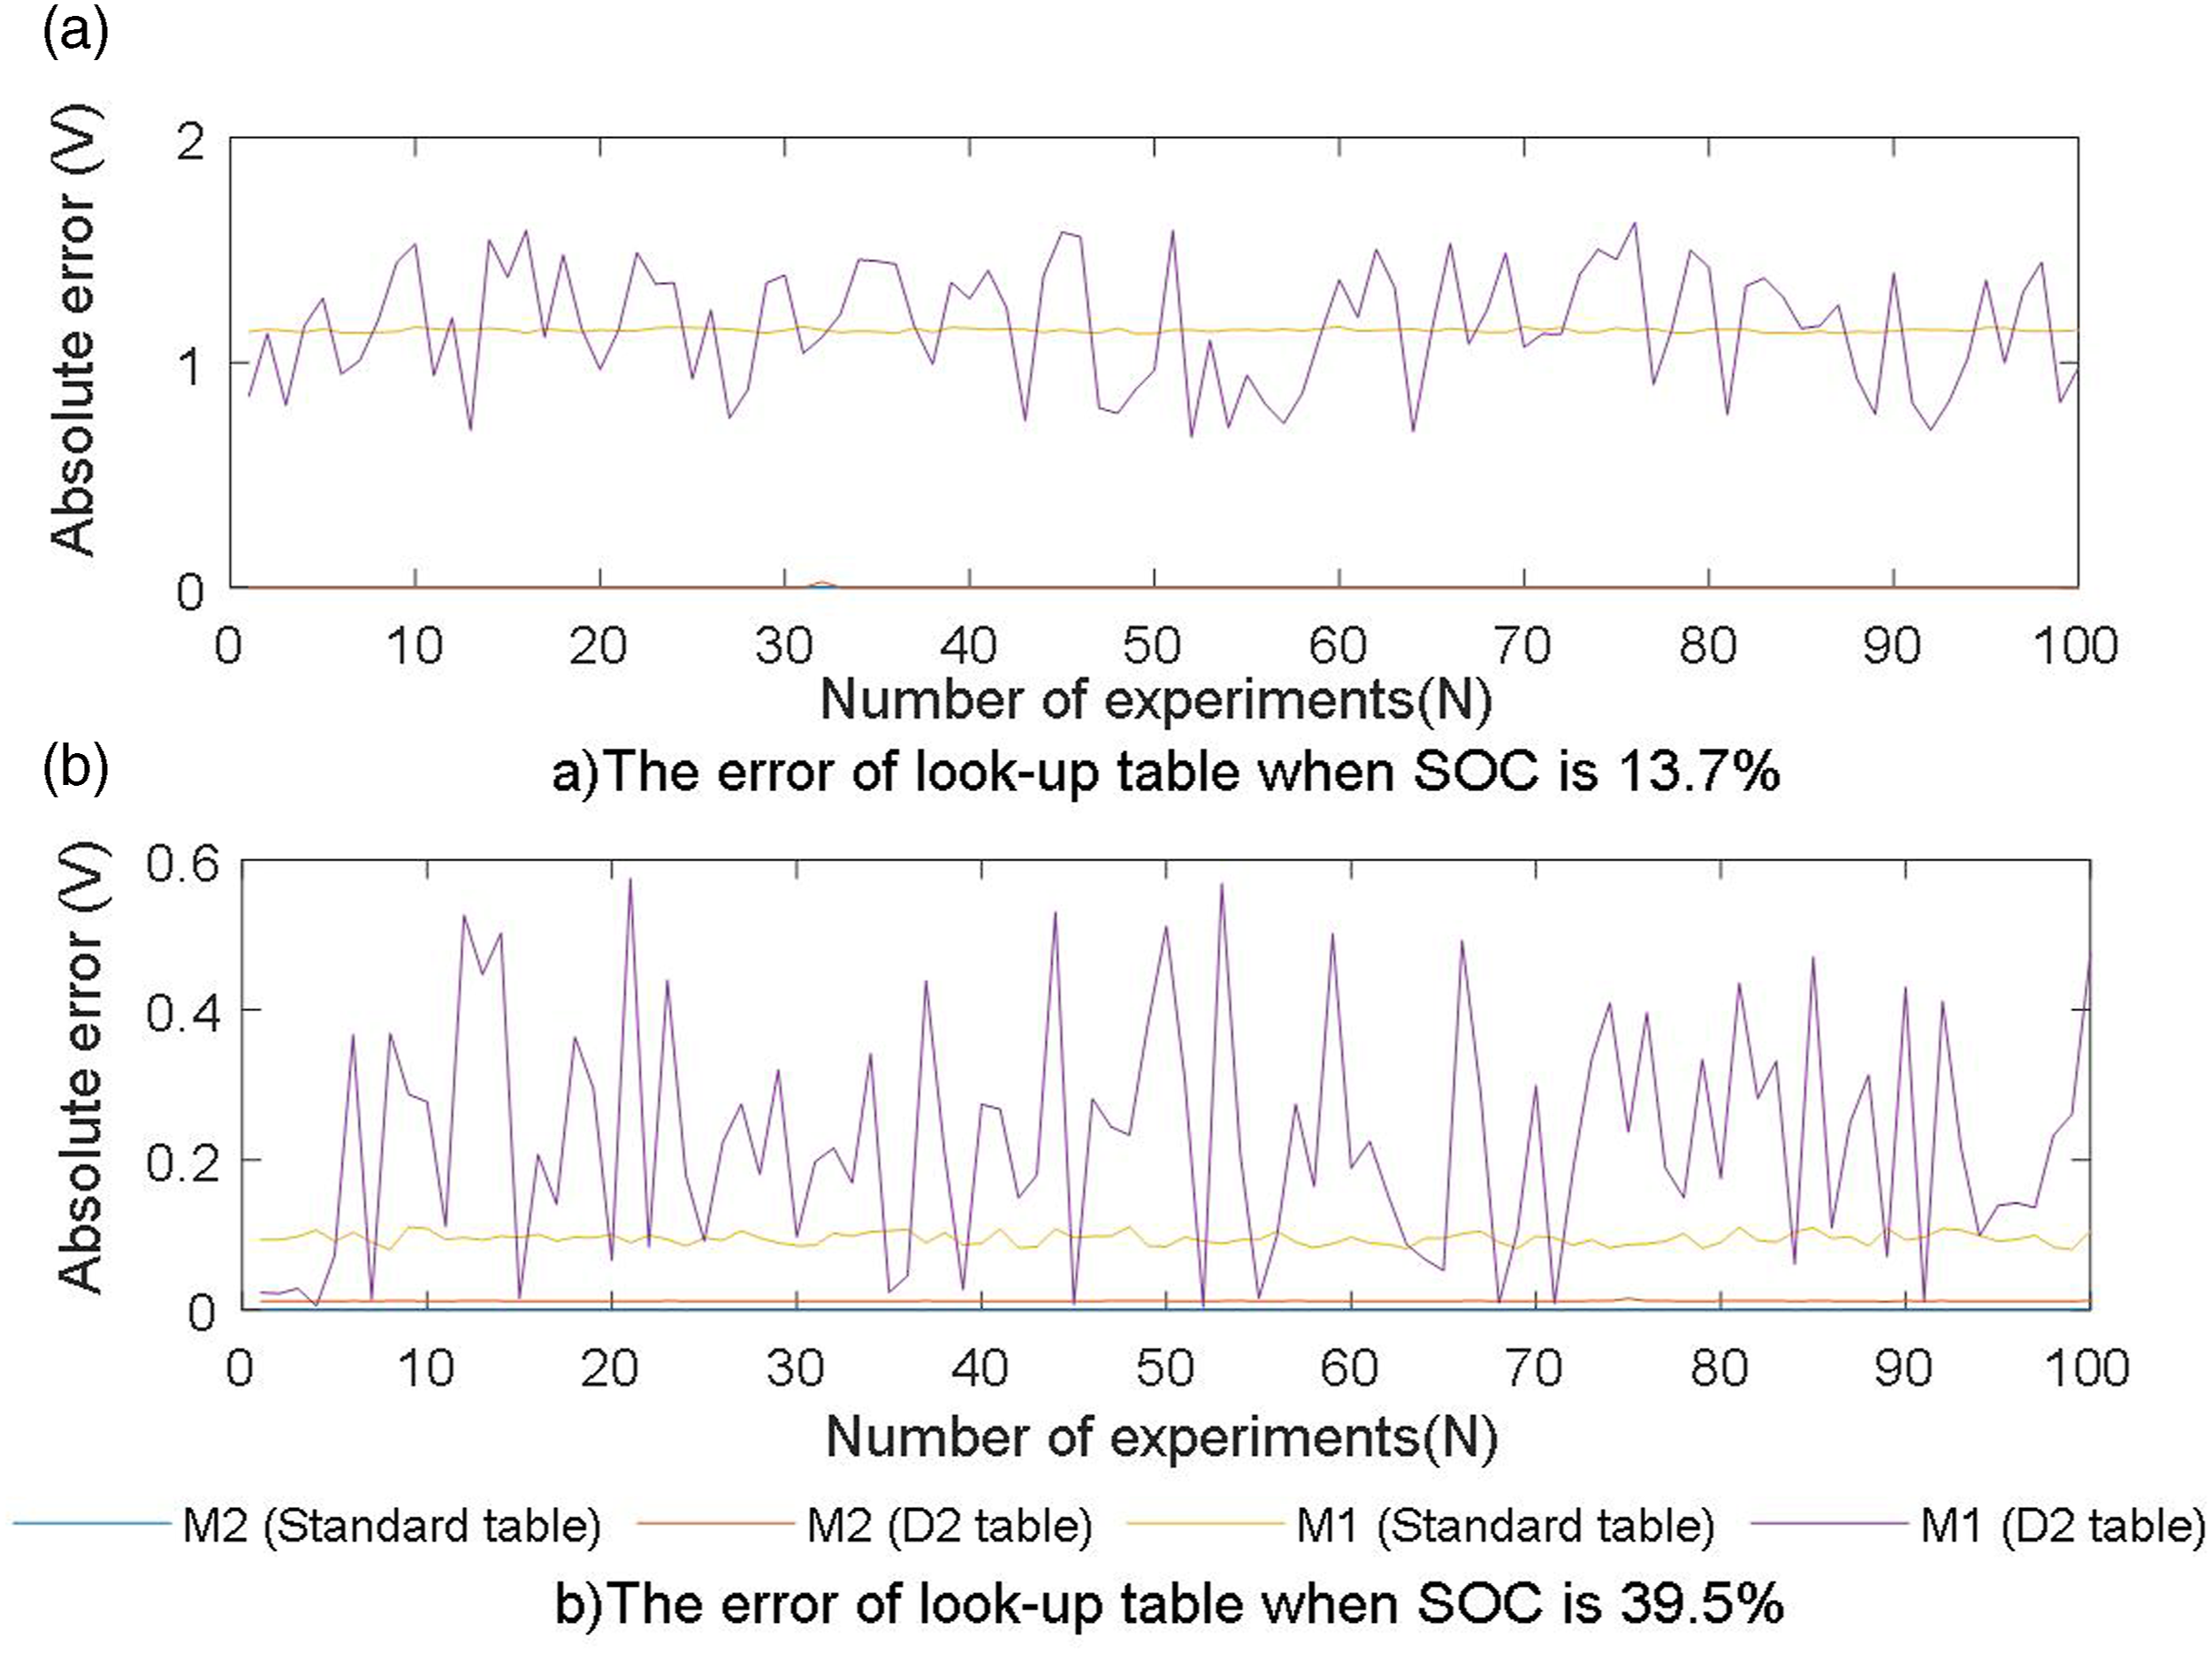
It can be clearly seen from Figure 5(a) that under the condition of SOC 13.7% and using benchmark table, the absolute errors are less than 0.0004 V using M2, while the results of M1 are about 1.2 V. When the D2 extraction mode table is applied and other conditions are unchanged, the absolute errors of M2 are less than 0.03 V while the results of M1 are about 1.7 V. Therefore, the M2 has higher accuracy under the same condition. At the same time, the results show that the SOC value of 13.7% is in the range of great change which makes the difference of two adjacent coordinate’s voltage become larger. Therefore, the absolute errors of M1 become greater. However, the errors caused by the decrease of resolution are greatly reduced by successive approximation of M2.
It can be seen from Figure 5(b) that under the condition of SOC 39.5% and using benchmark table, the absolute errors of M2 are less than 0.0004 V while the results of M1 are about 0.2 V. When the D2 extraction mode table is applied and other conditions are unchanged, the absolute errors of M2 are less than 0.02 V while the results of M1 are about 0.6 V. The reason that the absolute errors are less than that of SOC with 13.7% is because the SOC with 39.5% is in the smooth range of power battery characteristic curve.
A large number of experiments have been carried out to verify the effectiveness of M2 under the condition of 5%–100% SOC, and the results show that the absolute errors are all less than 0.03 even using D2 extraction mode table. Compared with M1, M2 has obvious advantages in the accuracy of the given voltage.
Experiments
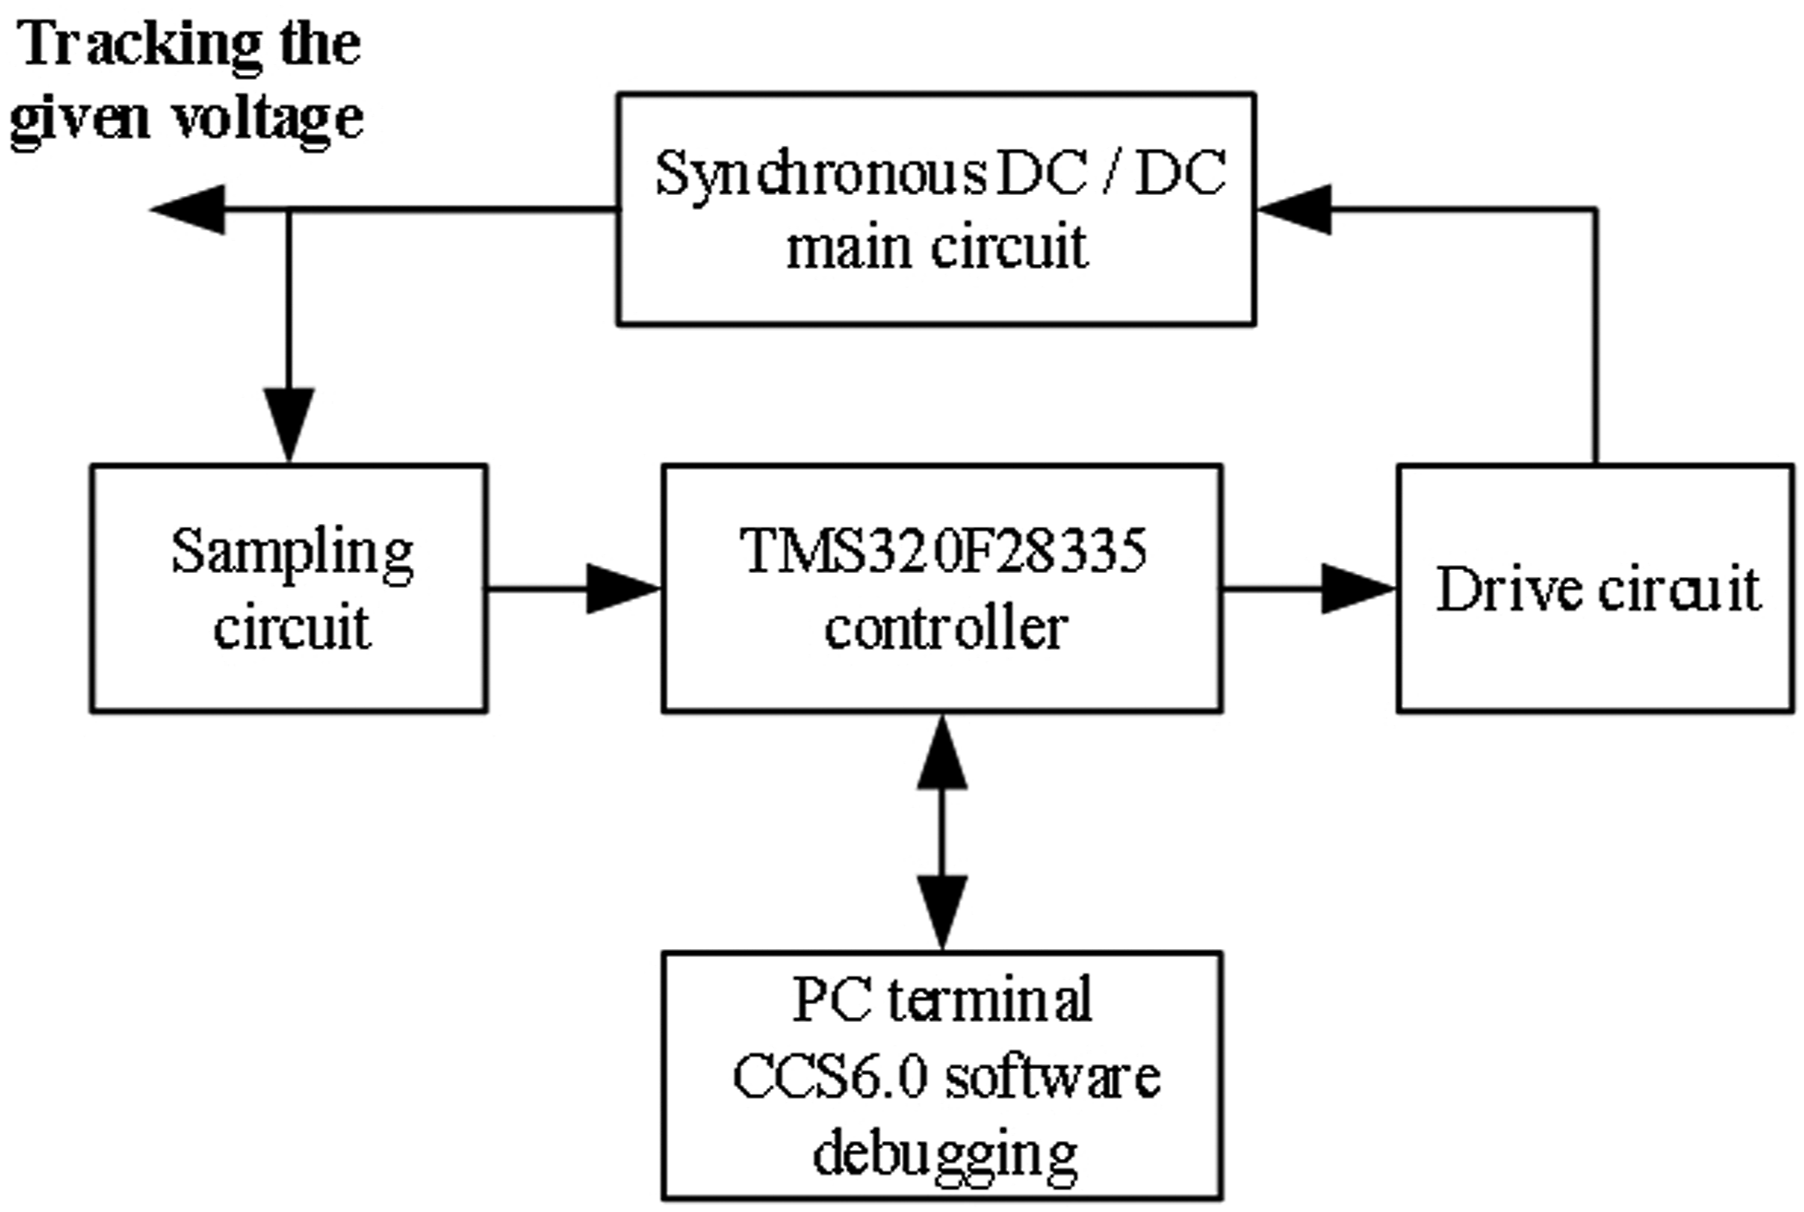
To verify the availability of the proposed method in the actual system, an experimental setup is built to realize the power battery simulator, as shown in Figure 6. The main circuit of the setup is a bidirectional DC/DC converter with fast dynamic response and high precision. The controller adopts the TMS320F28335 DSP processor, which is mainly used to sample the voltage and current of the main circuit and output a pair of complementary adjustable PWM wave with dead zone. The drive circuit operates according to the DSP PWM command signal to drive the DC/DC circuit. The output of the DC/DC converter can accurately track the given voltage of the battery model. The modules relationships of the setup are shown in Figure 7. Prototype of power battery simulator. Schematic diagram of the experimental setup.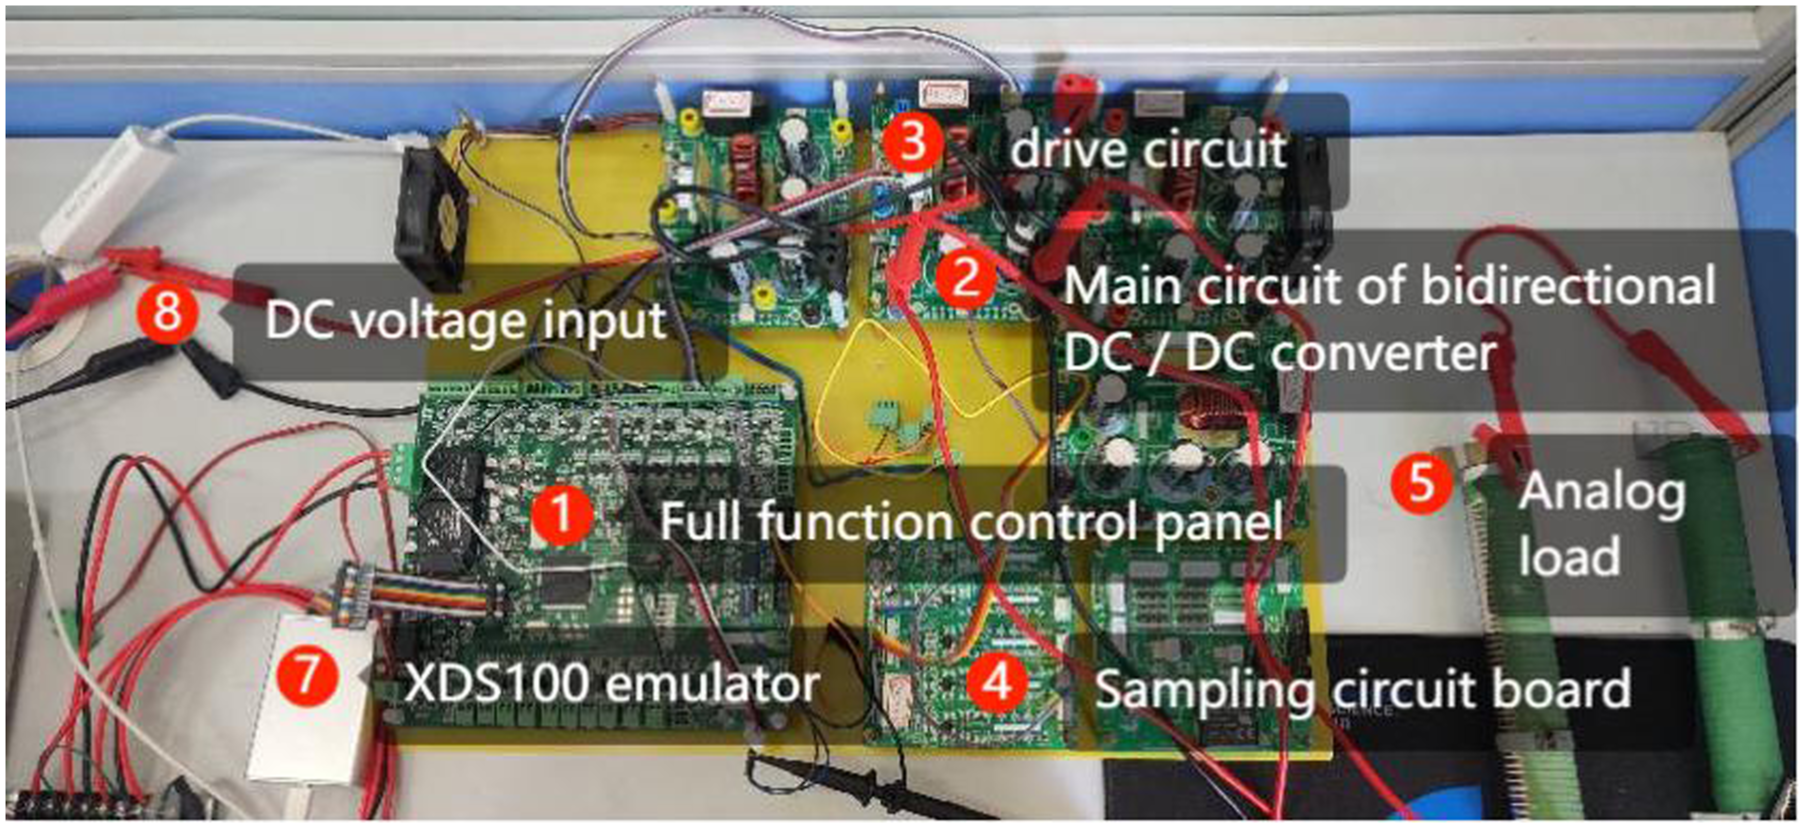
The CCS6.0 software run in PC is used for debugging when the experiments are carried out. The DC power supply is used as the input of the DC/DC and the auxiliary power supply is employed for the DSP board, the drive board, and the sampling board. The output of DC/DC, which is tracking the given voltage by the proposed method, is observed by oscilloscope. The experimental scenario is shown in Figure 8. Experimental scenario.
The proposed algorithm is programmed by CCS and downloaded to DSP chip to run. Due to the small memory occupation of the D2 extraction mode sub-tables and the small amount of computation, the proposed algorithm can run in real time.
A large number of experiments have been done with the setup to verify the feasibility of the proposed method. This can be illustrated by the results of an experiment, as shown in Figure 9. In this case, the SOC=56.95% and i=30.82 A, it can be seen that the absolute error is about 0.11 V. The error is larger than that of simulation, because in addition to the error caused by the algorithm, the result is also affected by the noise interference. Output voltage of the setup.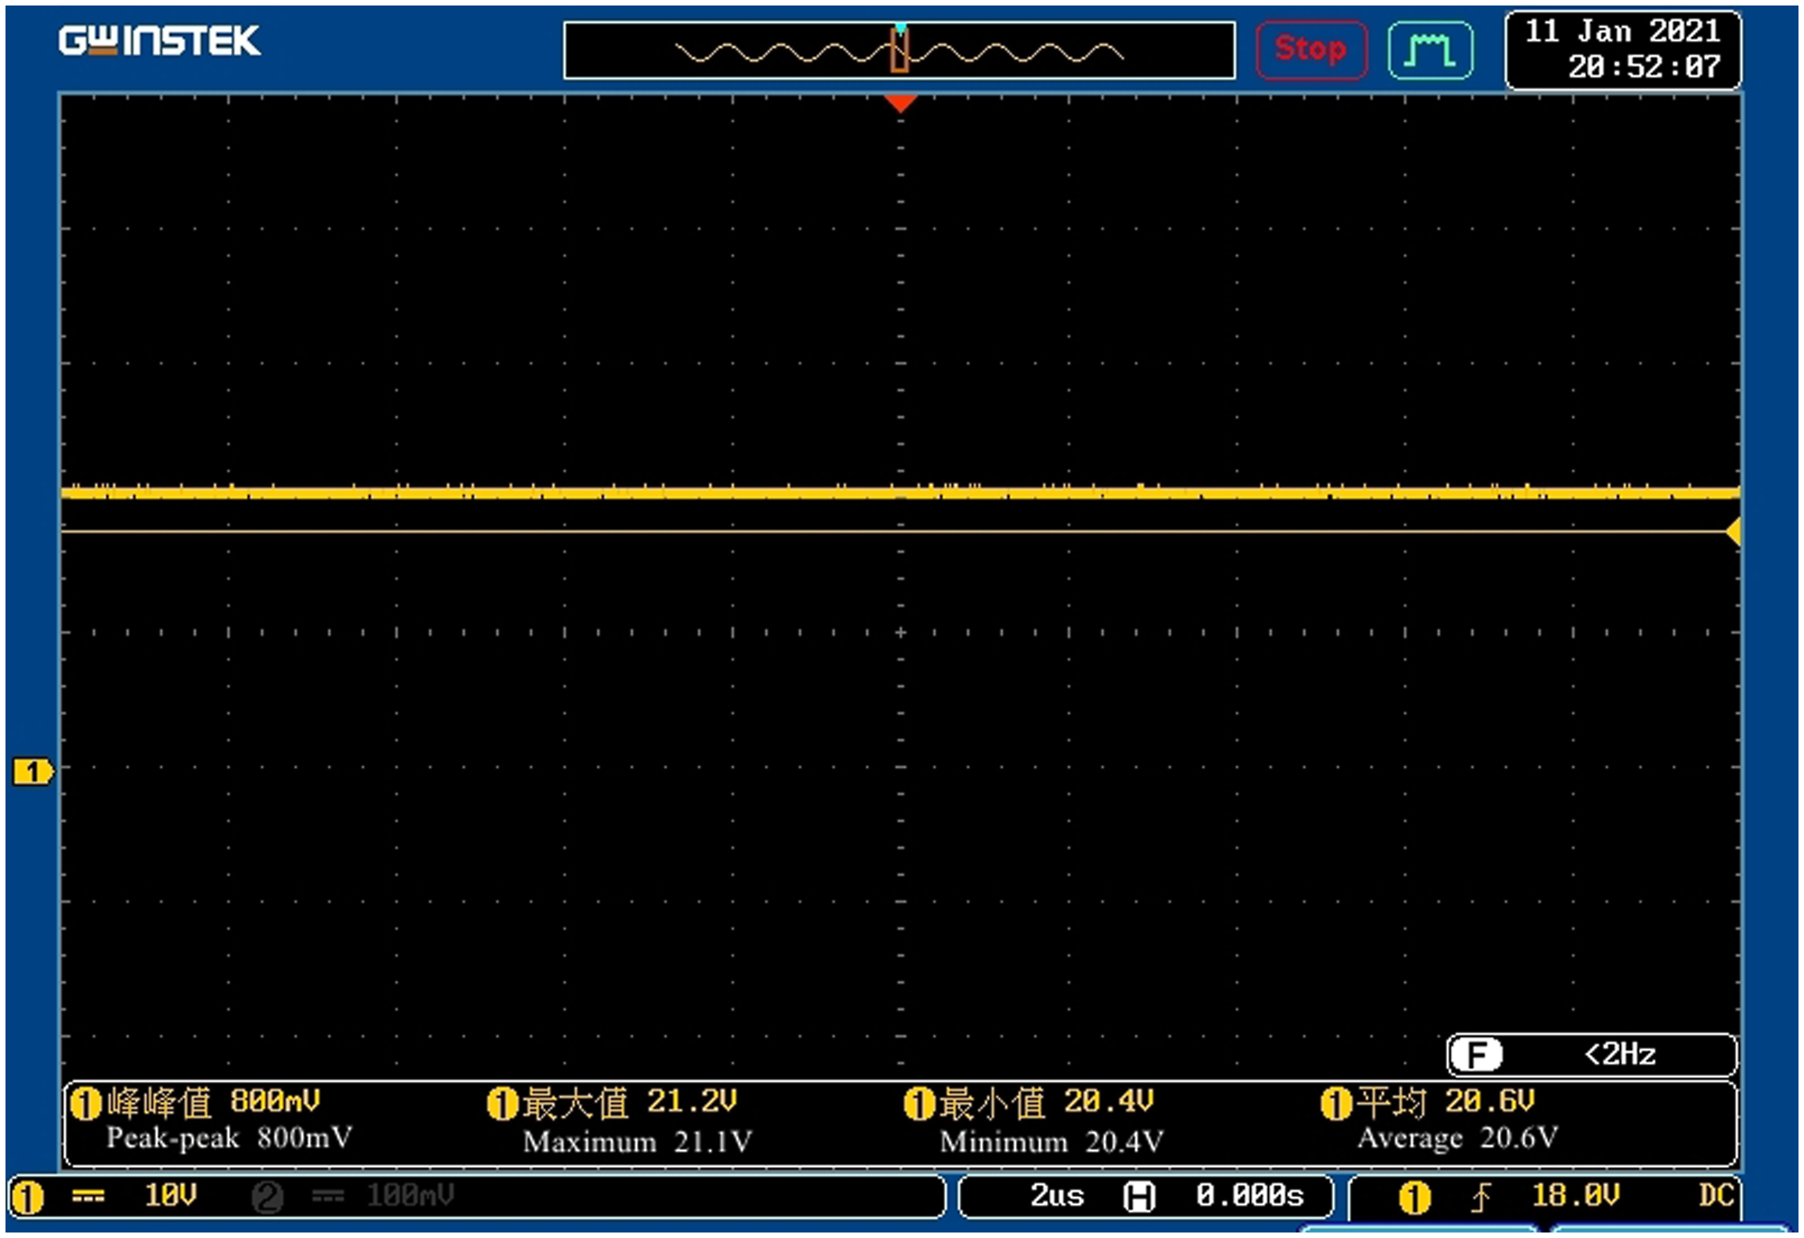
The absolute errors of tracking voltage on the setup in 100 consecutive experiments are shown in Figure 10. It can be seen that the absolute errors are less than 0.62. Therefore, the proposed method can accurately output a given voltage in a real system and can realize real-time dynamic response. Because of the advantages of small computation, smooth output voltage, and high precision, the proposed algorithm is convenient for practical application. Absolute errors of tracking voltage on the setup.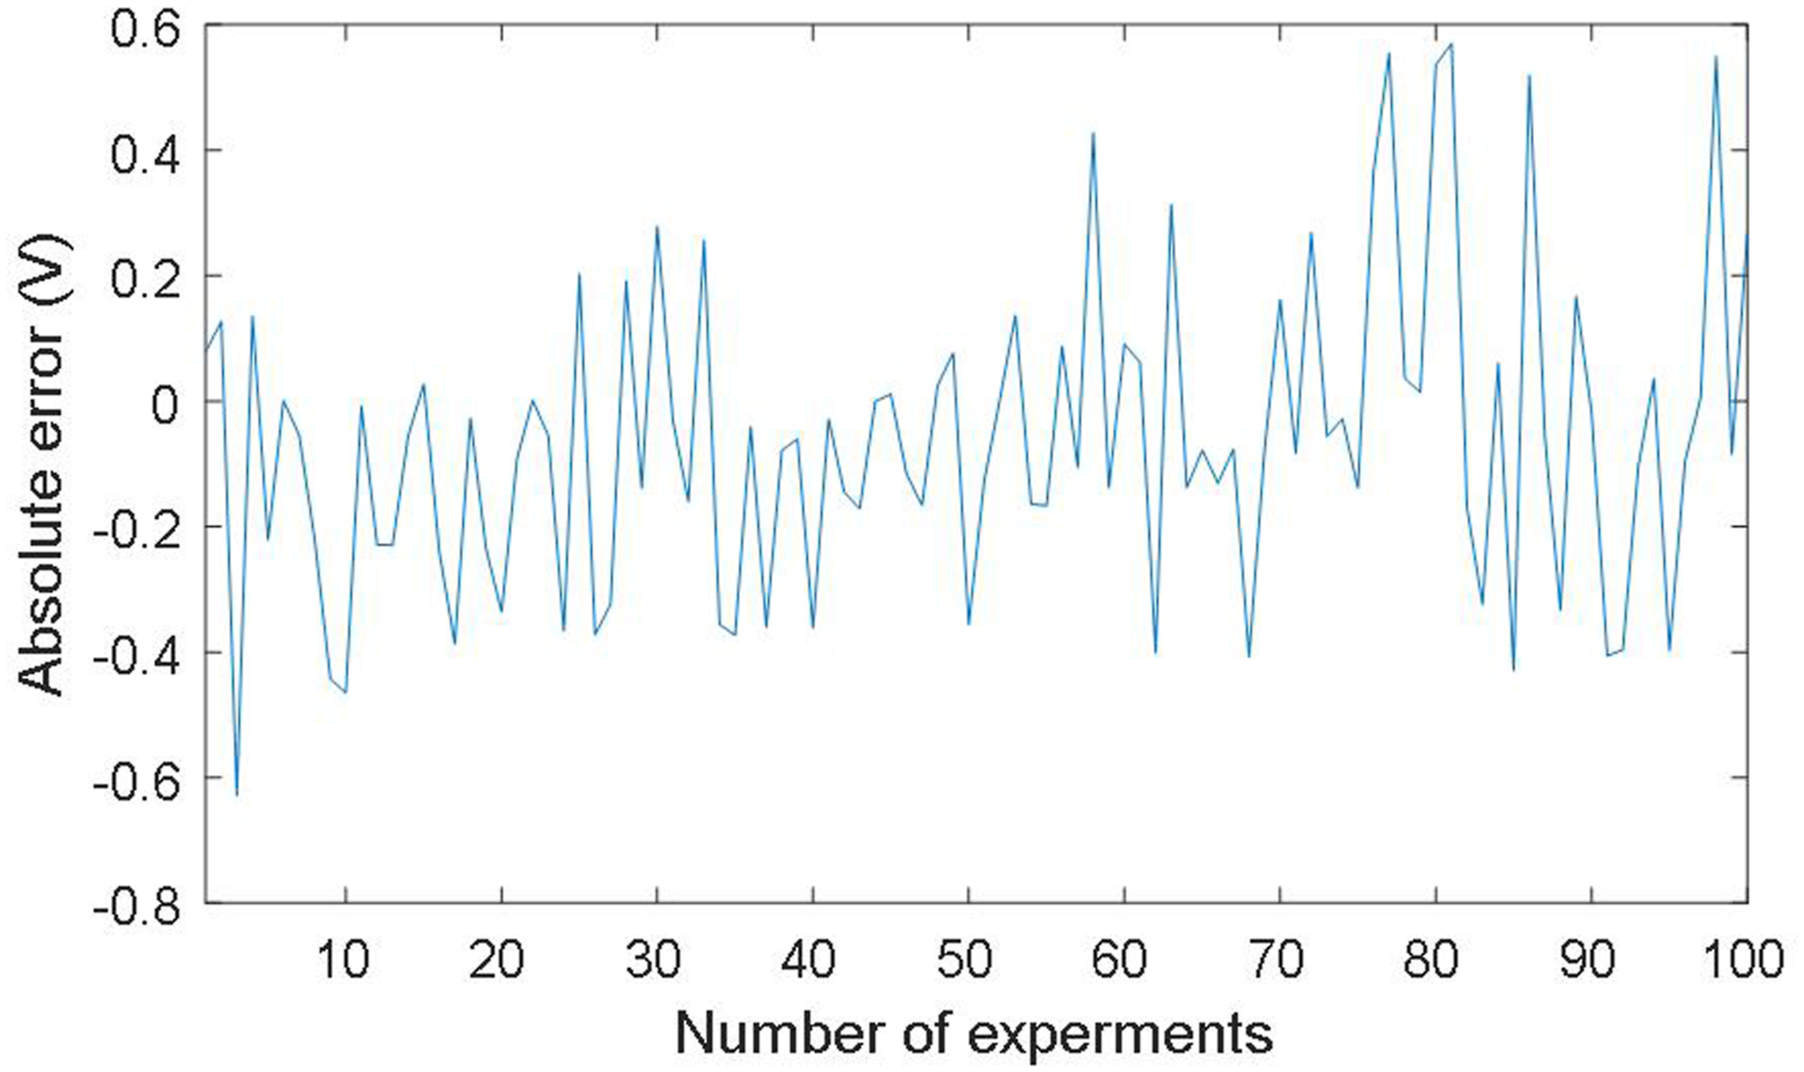
Conclusions
In this paper, a new method using SNNI is proposed for output voltage of power battery simulator. Under the condition that the data capacity of the model table is reduced by 98.4%, the given voltage accuracy of the proposed algorithm is controlled within 0.03 V, which is greatly improved compared with the traditional method. Therefore, the storage capacity requirement of the system can be greatly reduced on the premise of ensuring the accuracy, and system cost is reduced. In general, the proposed algorithm only needs 4–5 iterations to achieve the accuracy requirements, and the algorithm time is reduced because SNNI uses simple operation rules. By embedding the proposed algorithm into TMS320F28335 DSP chip, it can be easily integrated into the power battery simulation system, so the proposed method can be easily applied to low-cost systems. For further research, on the one hand, through the optimization of boundary points, the table look-up method based on SNNI will be more perfect, so as to enhance the stability in practical application. On the other hand, for different applications, the development of flexible power battery simulator is worthy of further study.
Footnotes
Acknowledgments
This work was partially supported by the natural science foundation of Hunan Province of China (2019JJ60055) and the scientific research projects of the Department of education of Hunan Province of China (18A272).
Declaration of Conflicting Interests
The author(s) declared no potential conflicts of interest with respect to the research, authorship, and/or publication of this article.
Funding
The author(s) received no financial support for the research, authorship, and/or publication of this article.