
Abstract
Rolling bearings are widely used in industrial equipment. It is of great significance to study the degradation trend of rolling bearings. In this paper, an Adaptive Multi-population Genetic Algorithm (AMGA) is proposed. Firstly, Kernel Principal Component Analysis (KPCA) method is used to fuse the vibration signal in both time domain and frequency domain, which uses kernel to map the sample space to higher dimensional space and uses the higher dimensional space for linear dimensionality reduction. It can effectively reduce the dimension of nonlinear correlation variables and obtain the trend signal representing the Remaining Useful Life (RUL) characteristics of rolling bearing. Moreover, AMGA is proposed to optimize the number of neurons, initial weight, and initial threshold of the Back Propagation (BP) neural network prediction model. AMGA applies chaos algorithm to Genetic Algorithm (GA) to improve the diversity of the initial population. Meanwhile, the communication frequency between different populations is controlled by judging the similarity of the optimal solution among different populations, so as to effectively jump out of the local optimum and obtain the global optimal solution. Finally, the whole life data of the spin-up process of the rolling bearing from University of Cincinnati is taken as an example to analyze the performance of the algorithm. Compared with the traditional BP, the R2-score performance and the MAPE performance of KPCA-AMGA-BP are improved by 0.297 and 2.46% respectively. Furthermore, compared with the optimized BP, this method obtains the improved R2-score performance and the MAPE performance by 0.218 and 0.46%.
Keywords
Introduction
With the development of technology and large-scale socialized production, reliable long-term and alternate multiple operational States are essential for modern manufacturing. Rolling bearings are widely used in these types of machinery that are normally operated in high-speed and heavy-duty environments. Once damage occurs, the consequences are often catastrophic. 1 Therefore, it is of great significance to predict the degradation of rolling bearing for preventing equipment failure and realizing equipment maintenance based on condition.
The research on the residual life of rolling bearings was put forward at the end of the 19th century. 2 In order to improve the reliability of predictive maintenance, the literatures 3,4 use different methods to improve the prediction accuracy. At present, there are some achievements in the prediction of residual life of rolling bearings at domestic and overseas. Peng, Y., et al. 5 used the Least Squares Support Vector Machine (LS-SVM) to predict the remaining useful life of the rolling bearing. LS-SVM involves penalty parameters, so the determination of penalty parameters has a great impact on the prediction effect. Fengtao, W., et al. 6 used the Gray Model GM (1,1) to predict the residual life of the rolling bearing. Lu, Y., et al. 7 used the Auto-Regressive Moving Average Model (ARMA). Kuncan, M., et al. 8 proposed a new approach that consisted of the one-dimensional local binary pattern (1D-LBP) method and the gray relational analysis (GRA) model to classify the vibration signals. The existing studies show that the machine learning method can effectively improve the accuracy of predicting the remaining life of rolling bearings. However, with the increment of the complexity of vibration signals, the deep learning method starts to show advantages in processing complex vibration signals. Presently, there are many works on rolling bearing fault diagnosis using different deep learning techniques, such as convolution neural network (CNN), 9,10 recurrent neural network (RNN), 11 transfer learning-convolutional neural network 12 (TLCNN), adaptive deep transfer learning neural network 13 and so on. Through the above methods, satisfactory diagnosis accuracy can be provided. When we process one-dimensional vibration signals of rolling bearing, the training speed of BP neural network is faster than those methods due to the simpler network.
In recent years, research works on the degradation prediction of rolling bearing using BP neural network have been introduced. Zhang, R., et al. 14 used a dictionary learning algorithm to denoise vibration signals and used BP neural network to detect the fault state of rolling bearing. However, the results of BP neural network are often affected by the super parameters in the training process, and there is no clear criterion for the selection of the super parameters. Therefore, Liu, X., et al. 15 and Wan, L., et al. 16 improved the BP prediction model by using Particle Swarm Optimization (PSO), which was applied to the wind turbine blade strain prediction and rolling bearing fault prediction. This method effectively improved the nonlinear fitting ability and efficiency of the single BP prediction model. Cheng, P., et al. 17 and others used Genetic Algorithm (GA) to optimize the weights and thresholds of BP, which improved the efficiency and accuracy of human body shape prediction.
In actual industrial production, the working conditions of the rolling bearing are complicated and various; therefore, how to effectively predict rolling bearing fault under various working conditions is an important problem to be solved. So, in order to improve the efficiency and accuracy of rolling bearing degradation prediction, this paper uses the time domain and frequency-domain feature extraction of the data. Then, we apply the Kernel Principal Component Analysis (KPCA) method to reduce the dimension of the characteristic signal, eliminate the multiple collinearities between variables, and obtain the health index of rolling bearing. Finally, the health index is input into the Adaptive Multi-population Genetic Algorithm (AMGA-BP) prediction algorithm. The overview of the method is outlined in Figure 1. The overview of the method.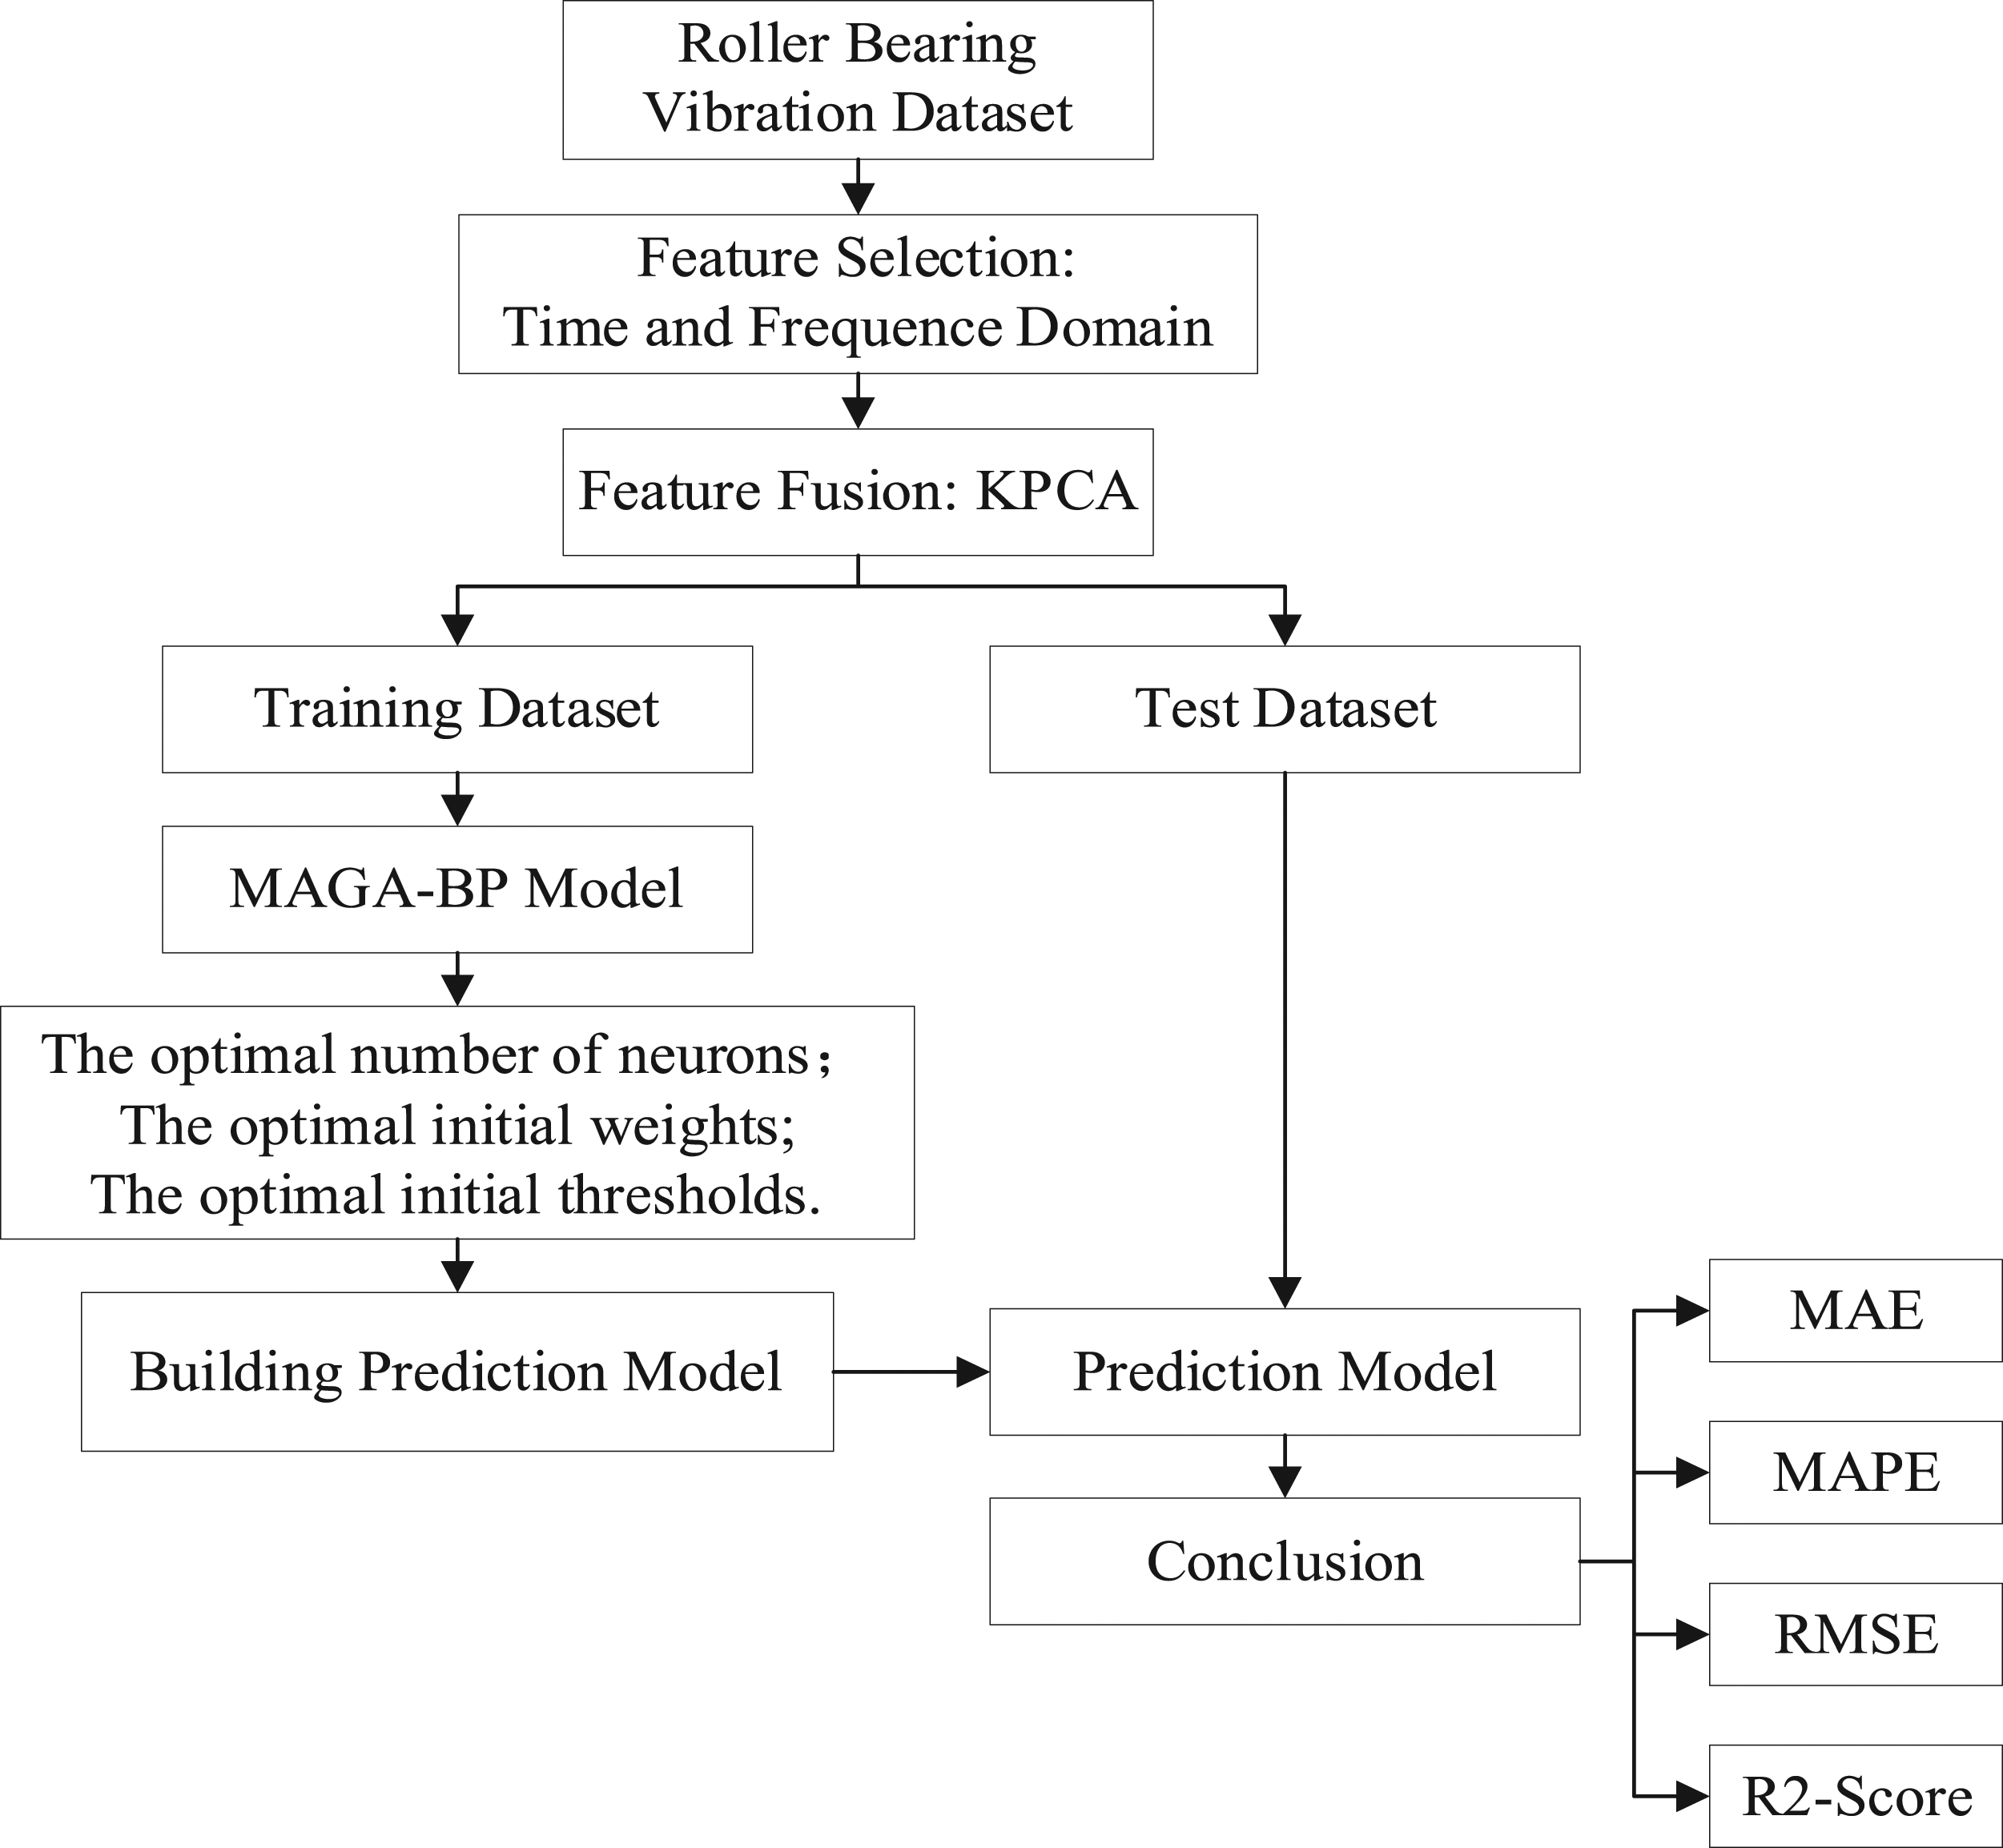
To summarize, the contributions of this paper are as follows: (1) KPCA method is used to fuse the time and frequency domain signals extracted from rolling bearing in order to obtain effective bearing degradation signals in this paper since that it can fuse multi-dimensional feature signals, improve the signal-to-noise ratio of the data, remove the relevant indicators, and avoid input redundancy. (2) The chaos algorithm is combined with GA to improve the diversity of the initial population of GA in this paper. Meanwhile, the similarity of the optimal solutions among different groups is judged by the multi-population parallel method to control the communication frequency between populations creatively, so as to jump out of the local optimum and obtain the global optimal solution. (3) The number of neurons, initial weight, and initial threshold of BP neural network is optimized by using AMGA, to increase the nonlinear fuzzy approximation ability of BP.
This paper is mainly arranged as follows: Bearing feature signal extraction section describes the theory of feature extraction; The prediction model of AMGA-BP section describes the theory and improvement of degradation prediction model AMGA-BP; Experimental analysis section describes the experiment and comparison between AMGA-BP, GA-BP, BP, and LSTM; Conclusion section describes the conclusion.
Bearing feature signal extraction
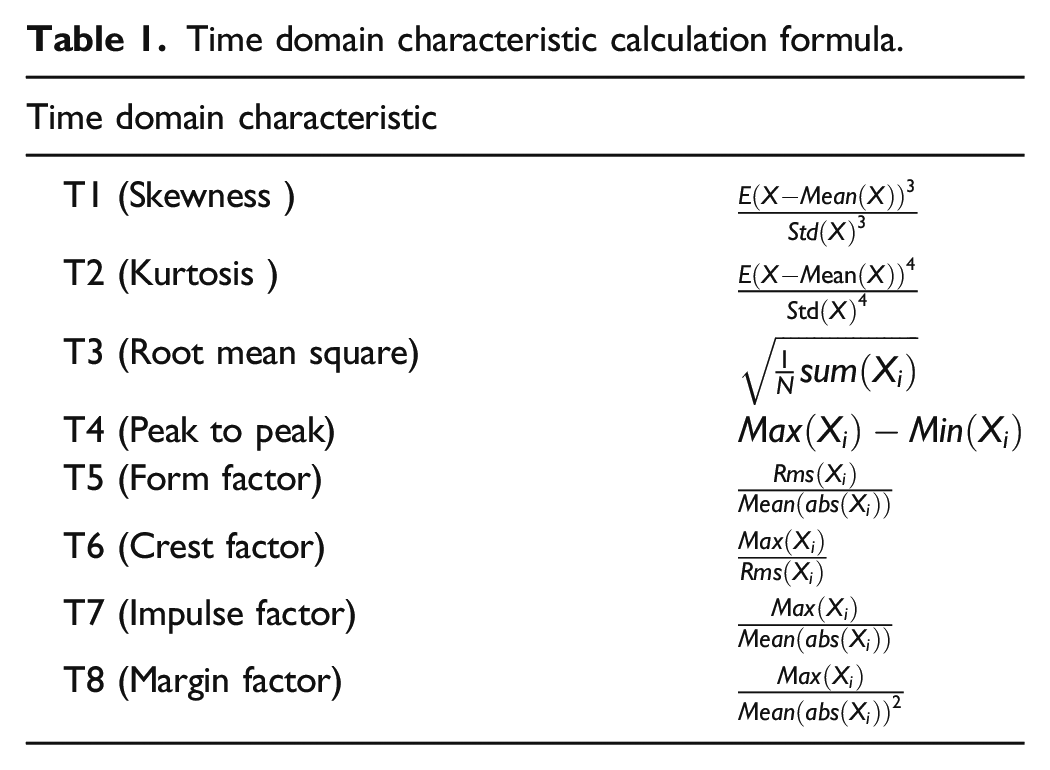
Time and frequency domain feature parameters extraction
Time domain characteristic calculation formula.
Frequency domain characteristic calculation formula.
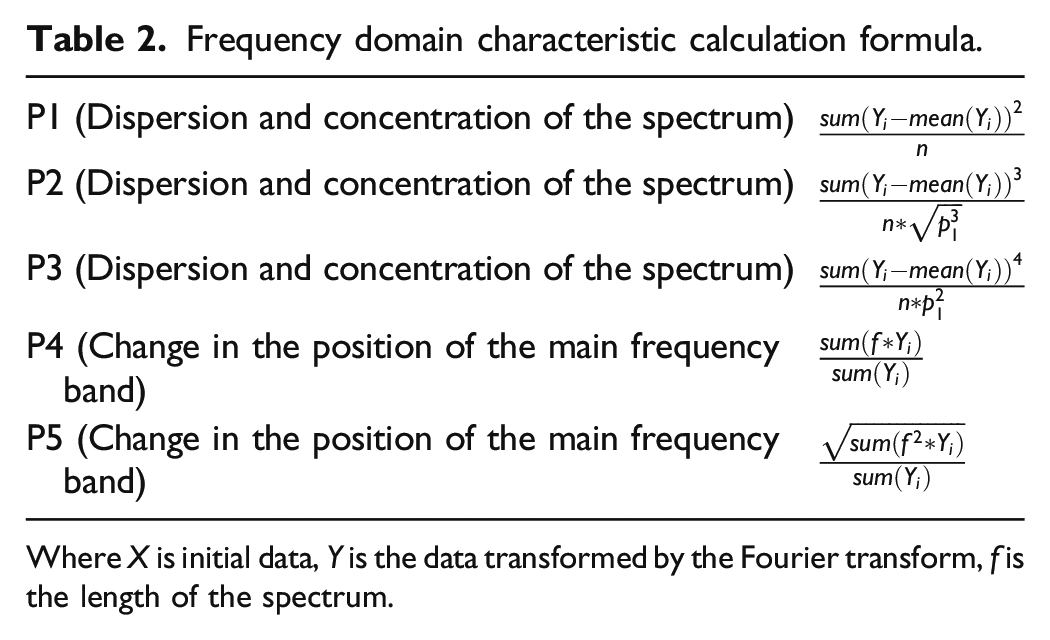
Where X is initial data, Y is the data transformed by the Fourier transform, f is the length of the spectrum.
Feature fusion
The literature 19 shows that KPCA is an unsupervised feature fusion learning method. KPCA can effectively remove the redundant information from the original data and extract the effective information from the original data. Feature extraction based on KPCA is a nonlinear analysis method based on PCA, which mainly uses the nonlinear kernel function to map the input data to high-dimensional feature space, and transforms the nonlinear problem in low dimensional space into the linear problem in high-dimensional space, so as to carry out principal component analysis. 20 Because of the limited degradation that can be reflected by a single index, it is necessary to construct a new index that can comprehensively reflect the deterioration of bearing performance by using the method of kernel principal component analysis.
For N samples in the original space, X
k
((k = 1,2,…, N), X
k
∈R
M
, M is the number of variables) is the covariance matrix C
H
of the mapping matrix on the high-dimensional feature space H by means of nonlinear mapping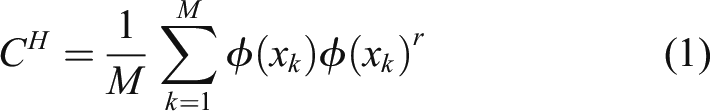

Define the matrix K
ij
= K(x
i
,x
j
) = φ(x
i
) φ(x
j
) and normalize eigenvectors V
m
, which satisfies (V
m
,V
n
) = 1, then, the original sample data X is mapped to the image φ(x) on the high-dimensional eigenspace H on the m-th (m = 1,2,...) eigenvector matrix t
m
can be expressed as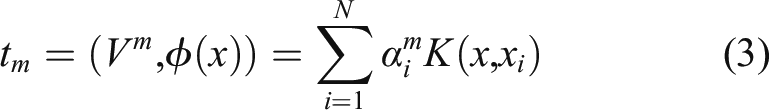
Because the data X
k
mapping in the feature space φ(x) is not necessarily zero-normalization, we can obtain 
Let λ
i
be the eigenvalues of the matrix KPCA framework.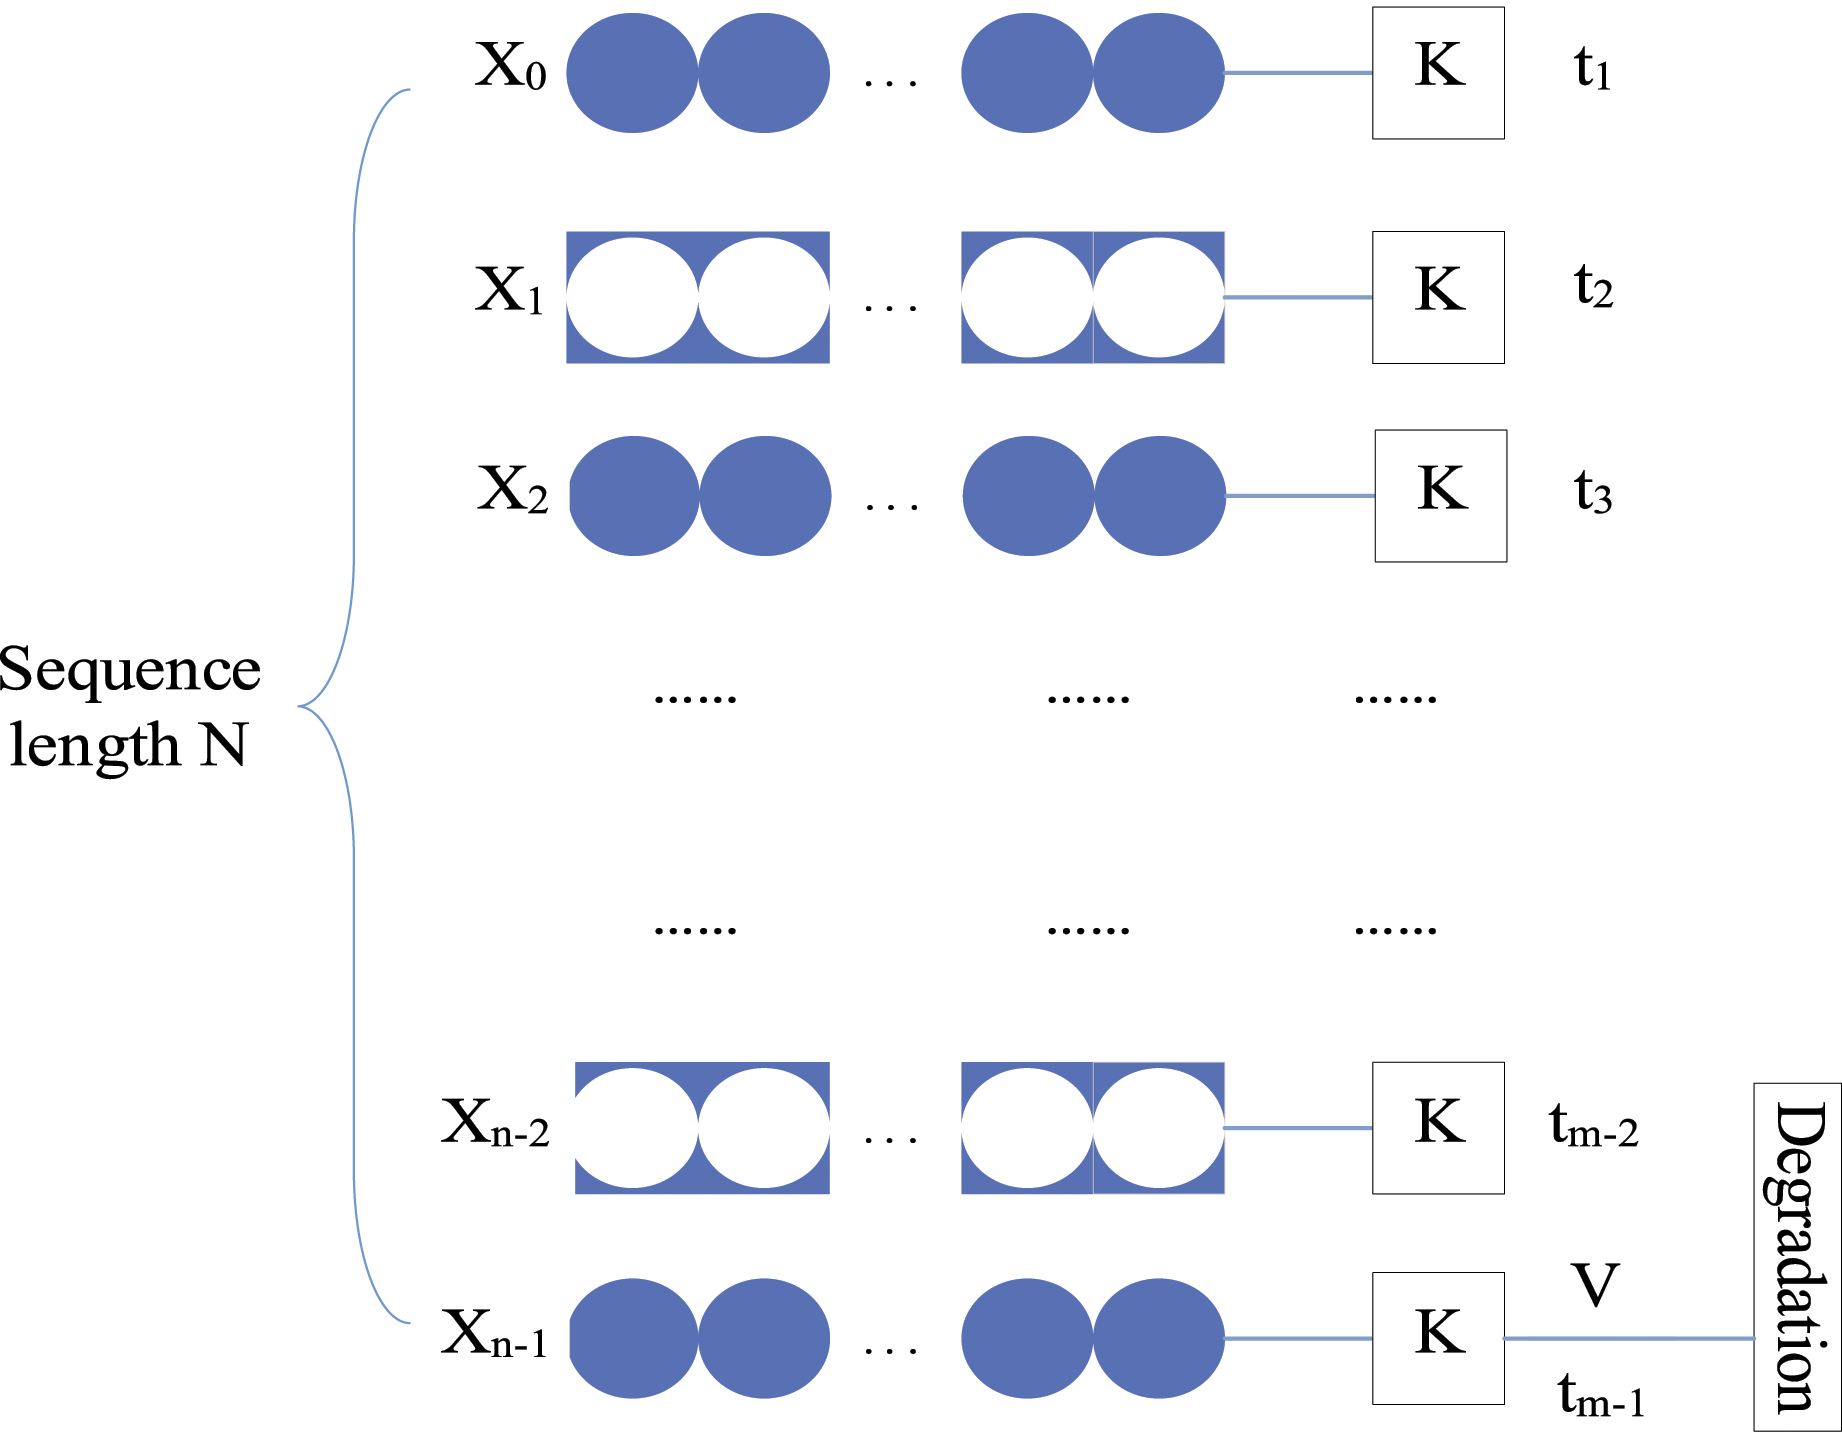
The prediction model of AMGA-BP
Parameter optimization based on GA
Genetic Algorithm (GA) is an adaptive probabilistic optimization algorithm used in complex systems. The method has been proved to be valid for complex systems. The literature 21 introduced the single and multiple objective Pareto optimal solutions using GA to improve the optimization. Moreover, the multi-objective GA and multi-objective Particle Swarm Optimization (PSO) 22 were used to generate Pareto optimal solutions for several complexity varying experiments. The basic principle of GA is derived from Darwin’s biological evolution principle. Through the simulation of biological evolution processes such as replication, exchange, and mutation, and the corresponding simulation of natural selection pressure according to the demand, the optimal solution can be obtained. 23
GA generates an initial population X. The X population has N individuals. The initial individuals [X
1
, X
2
,…, X
N
] have three main operations in the genetic iteration process: selection, crossover, and mutation. (1) Selection of genetic factors refers to individuals according to certain laws, the selection of good individuals from the t-th generation population under the premise of comprehensive consideration of individual adaptability entail to the (t+1)-th generation population. (2) Cross-genetic factors refer to the pairing of individuals in the t-th generation population according to the principle of randomness. Meanwhile, the certain chromosomes of individuals exchange according to a certain probability. (3) Variant genetic factor refers to the change of some of the factors on the chromosome of an individual in the t-th generation population according to a lower probability of variation, by which the original gene value is converted to other allele values.
Although GA can achieve convergence globally in theory, it usually achieves local convergence in the practical process. Moreover, it is inefficient, time-consuming, and unstable, so it needs to be optimized.
Parameter optimization based on adaptive multi-population GA
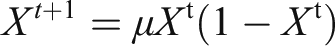
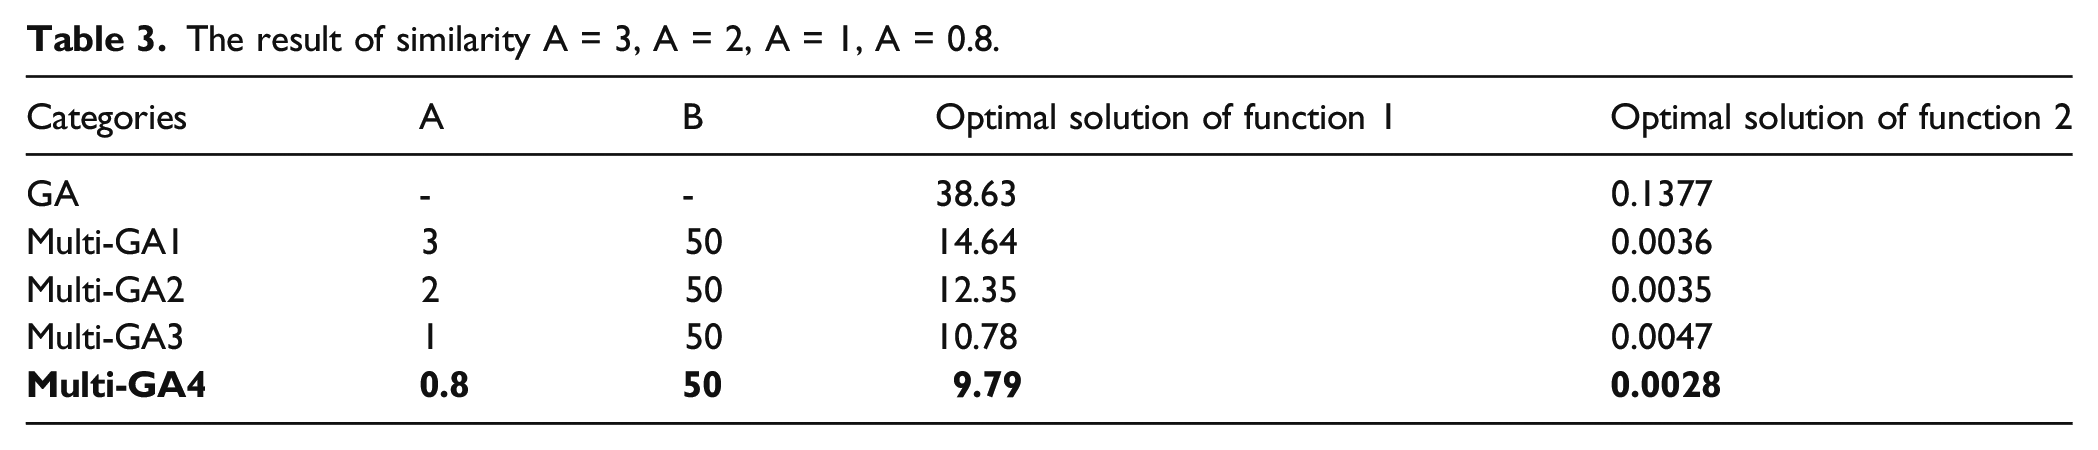
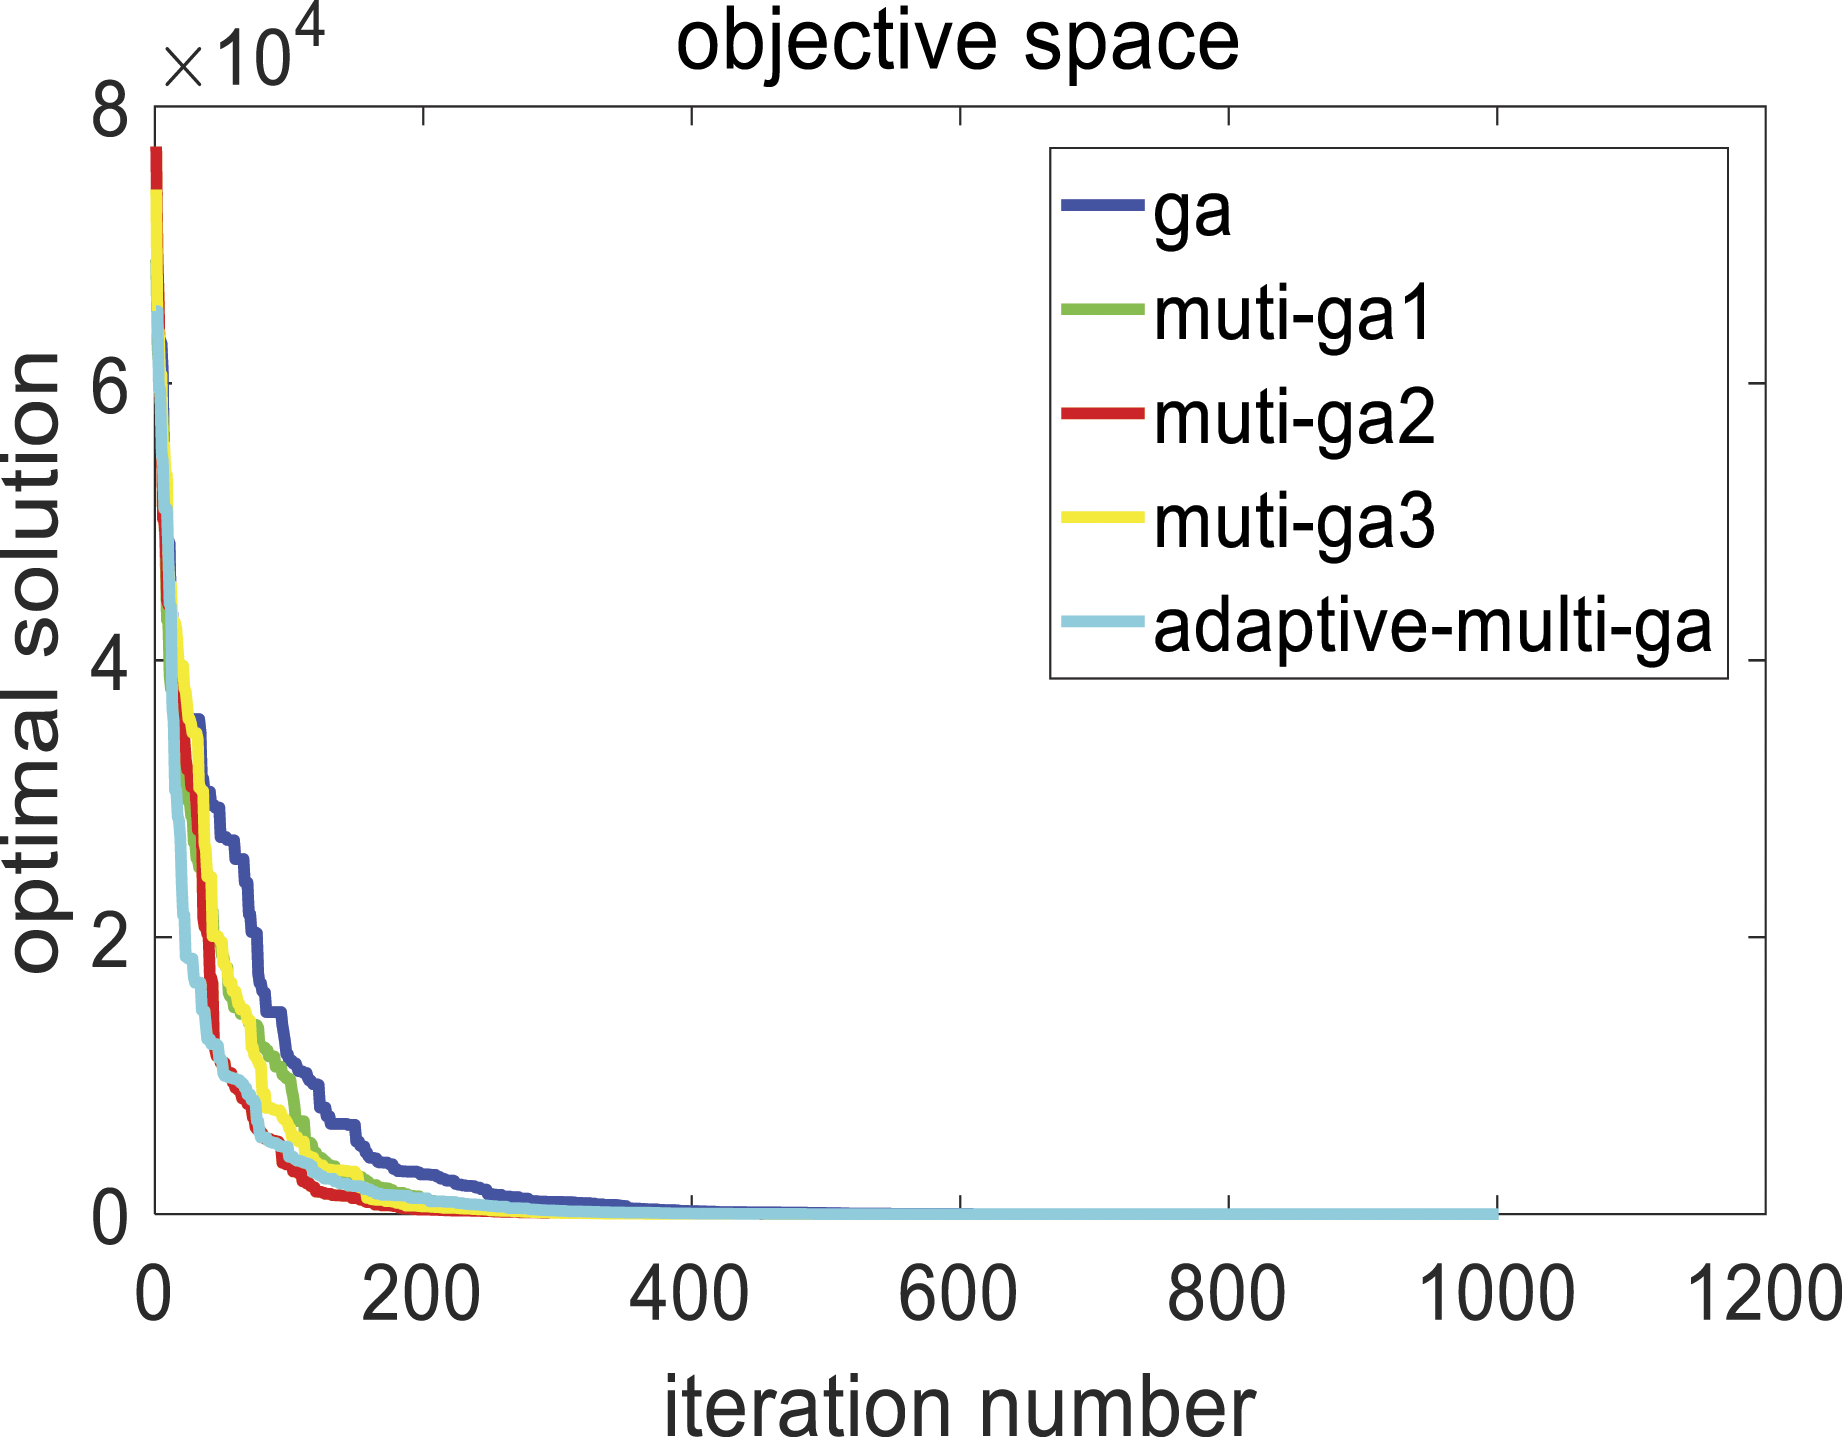
AMGA is proposed in this paper to balance the global optimization ability and local optimization capability of GA, and improve the accuracy of the algorithm. The specific improvement methods are as follows: (1) In order to improve the diversity of the initial population, a chaos algorithm is applied to the generation of the initial population. The chaos algorithm is expressed as: (2) In order to solve the problem that a single population needs to search for the global optimal solution quickly and avoid falling into the local optimal value in the iterative process, the multi-populations hybrid genetic algorithm is adopted. Its basic idea is to make the multi-populations search for the optimal solution with different crossover probability and mutation probability. In the iterative process of the populations, the optimal solution among the multi-populations is transferred to avoid premature convergence of the populations and fall into the local optimum. However, individual migration between populations in each iteration process is easy to be lead to multiple populations entering the same local optimum, so the similarity between populations in each iteration process is calculated. When the similarity between populations is too low, individual migration between populations is carried out to make the populations communicate with each other. The threshold of similarity between populations is set as A (vector distance) and B (difference of optimal solution). If the similarity is too low, it means that the spatial distance of the optimal solution is far between multi-population and the fitness value of the optimal solution is similar. In this case, multi-population communication can make the population jump out of the local optimum. The initial values of A and B are set randomly and experimentally to find the optimal values. Tables 3 and 4 show the optimal solutions of functions 1 and function 2 with different similarity thresholds. The actual optimal solutions of both functions are 0. Figures 3 and 4 show the optimization effect of function 1 and function 2 on the optimization effect of using MGA and traditional GA with different values of A and B. The X-axis is the number of iterations, and the Y-axis is the optimal value. The curve represents the optimal value of the model as the number of iterations increases. The number of iterations required by MGA to find the best is significantly less than that of traditional GA. As shown in the figure, when A is close to 1, the number of iterations to reach the optimal solution is less, indicating that the speed of finding the optimal solution is the fastest. When B is set to 60, the speed of finding the optimal solution is the fastest, too. Function 1 and function 2 are defined as follows: The result of similarity A = 3, A = 2, A = 1, A = 0.8. The result of similarity B = 50, B = 60. B = 70, B = 40. Optimization of function 1 with different thresholds. (a) Optimal solution under A = 3,A = 2,A = 1,A = 0.8; (b) Optimal solution under B = 50,B = 60,B = 70,B = 40. Optimization of function 2 with different thresholds. (a) Optimal solution under A = 3,A = 2,A = 1,A = 0.8; (b) Optimal solution under B = 50,B = 60,B = 70,B = 40.
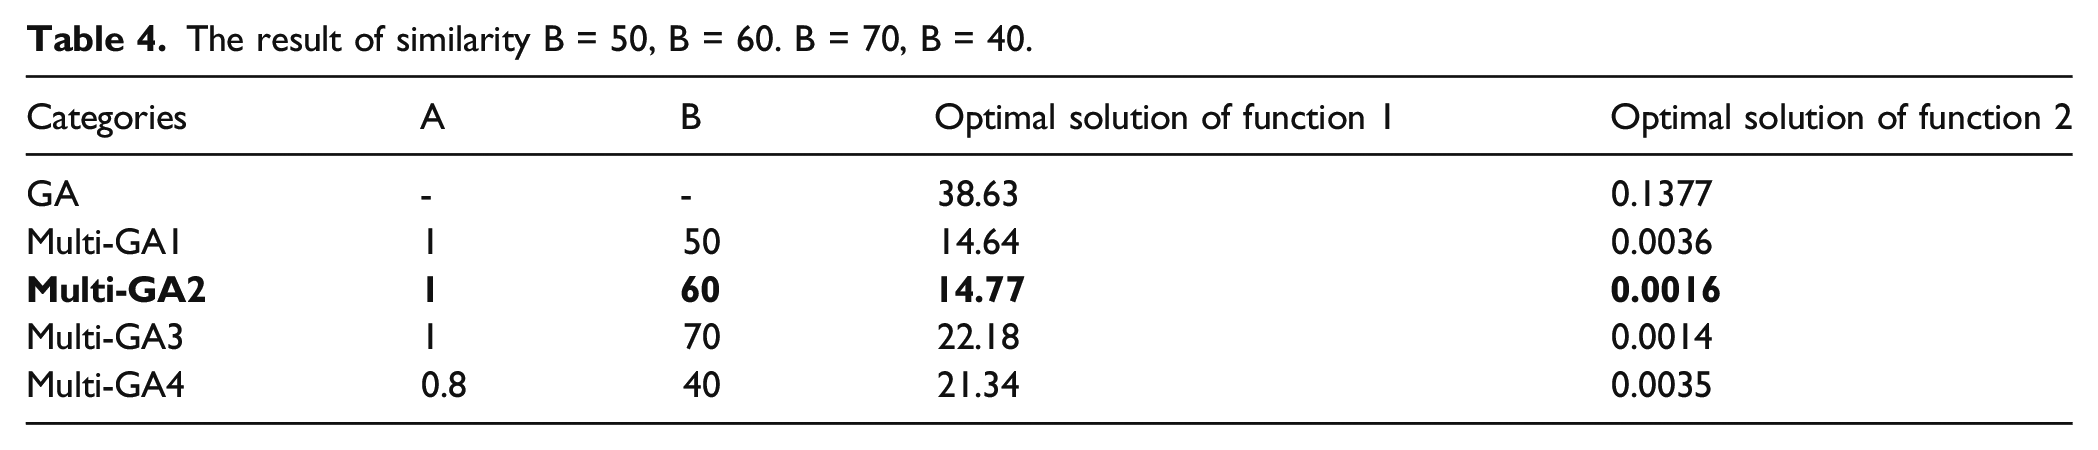
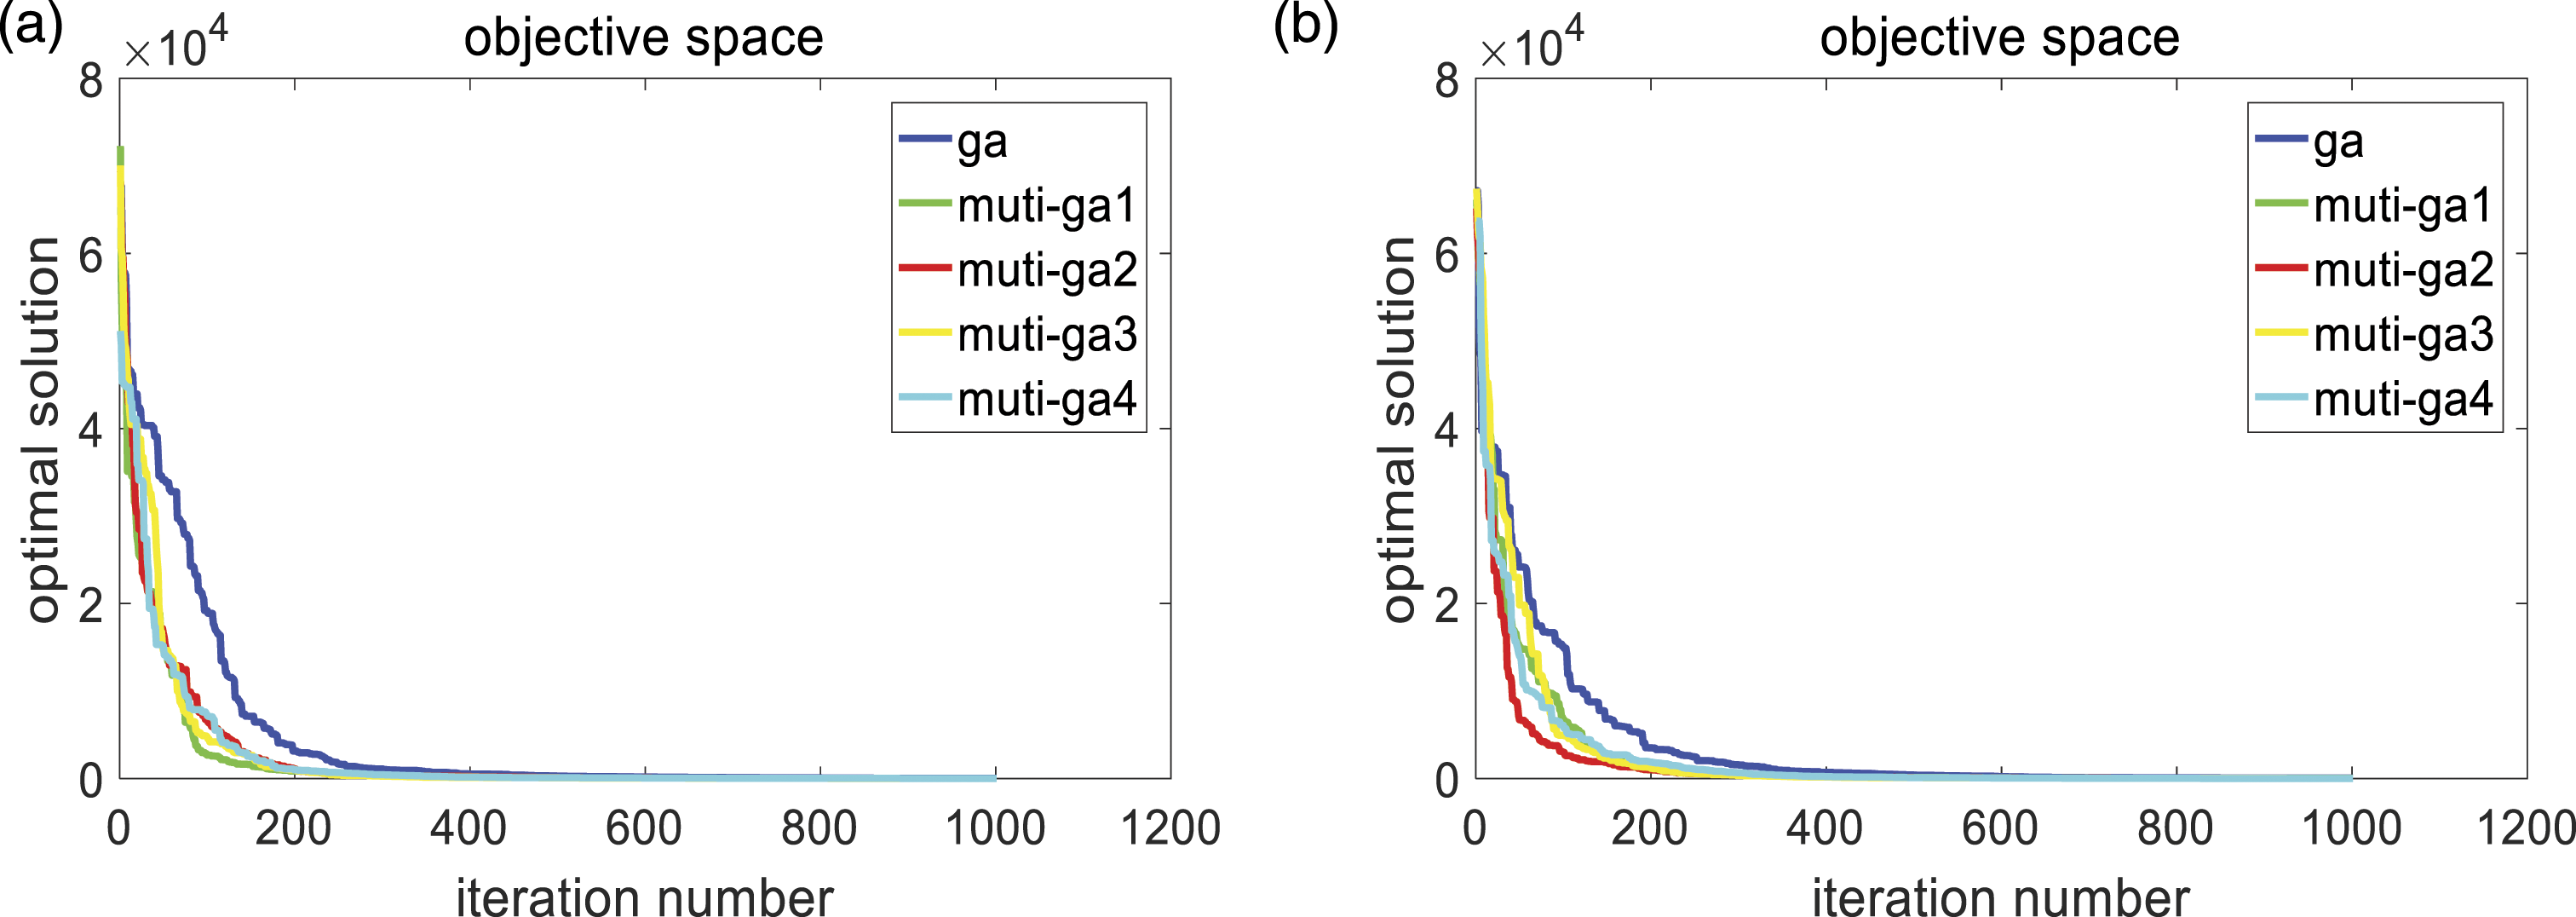
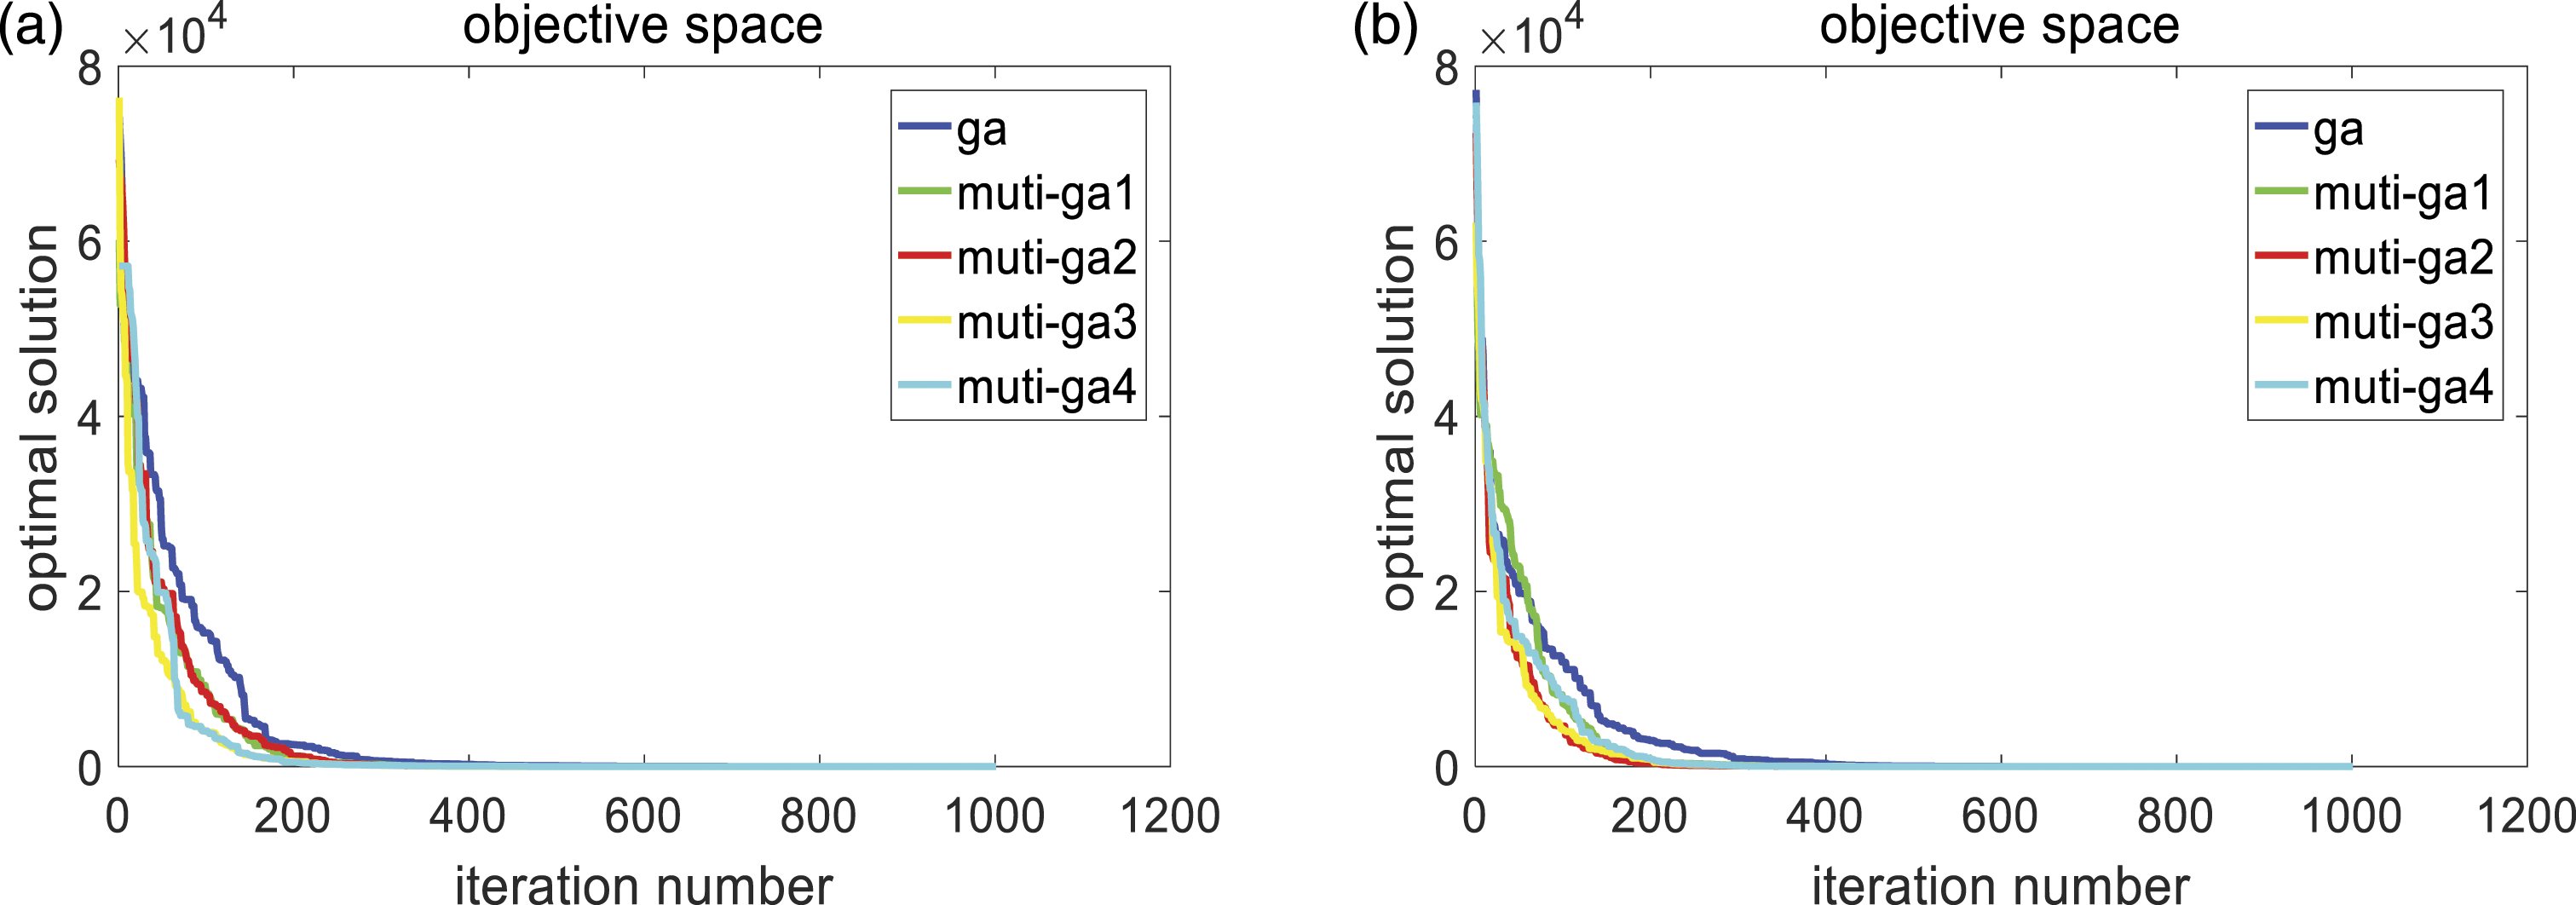
Function 1: Rastrigin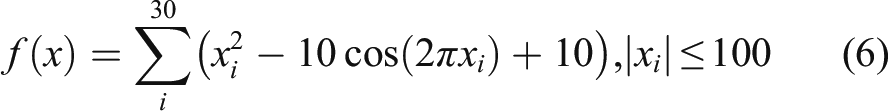
Function 2: Sphere (3) The communication conditions of MGA are required to be obtained through many experiments, which is the limitation. In order to solve this problem, the similarity threshold is proposed to be adaptive. It is assumed that the similarity between multi-population is low when the initial population is generated. The similarity at the initial time can be used as the threshold to solve this problem. As shown in Figure 5, the initial value of AMGA solution is close to the best similarity threshold effect that is obtained by plenty times of experiments with other algorithms. Optimal solution under AMGA.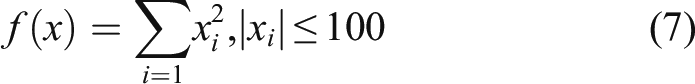
The flow chart of AMGA is shown in Figure 6. Flow chart of AMGA.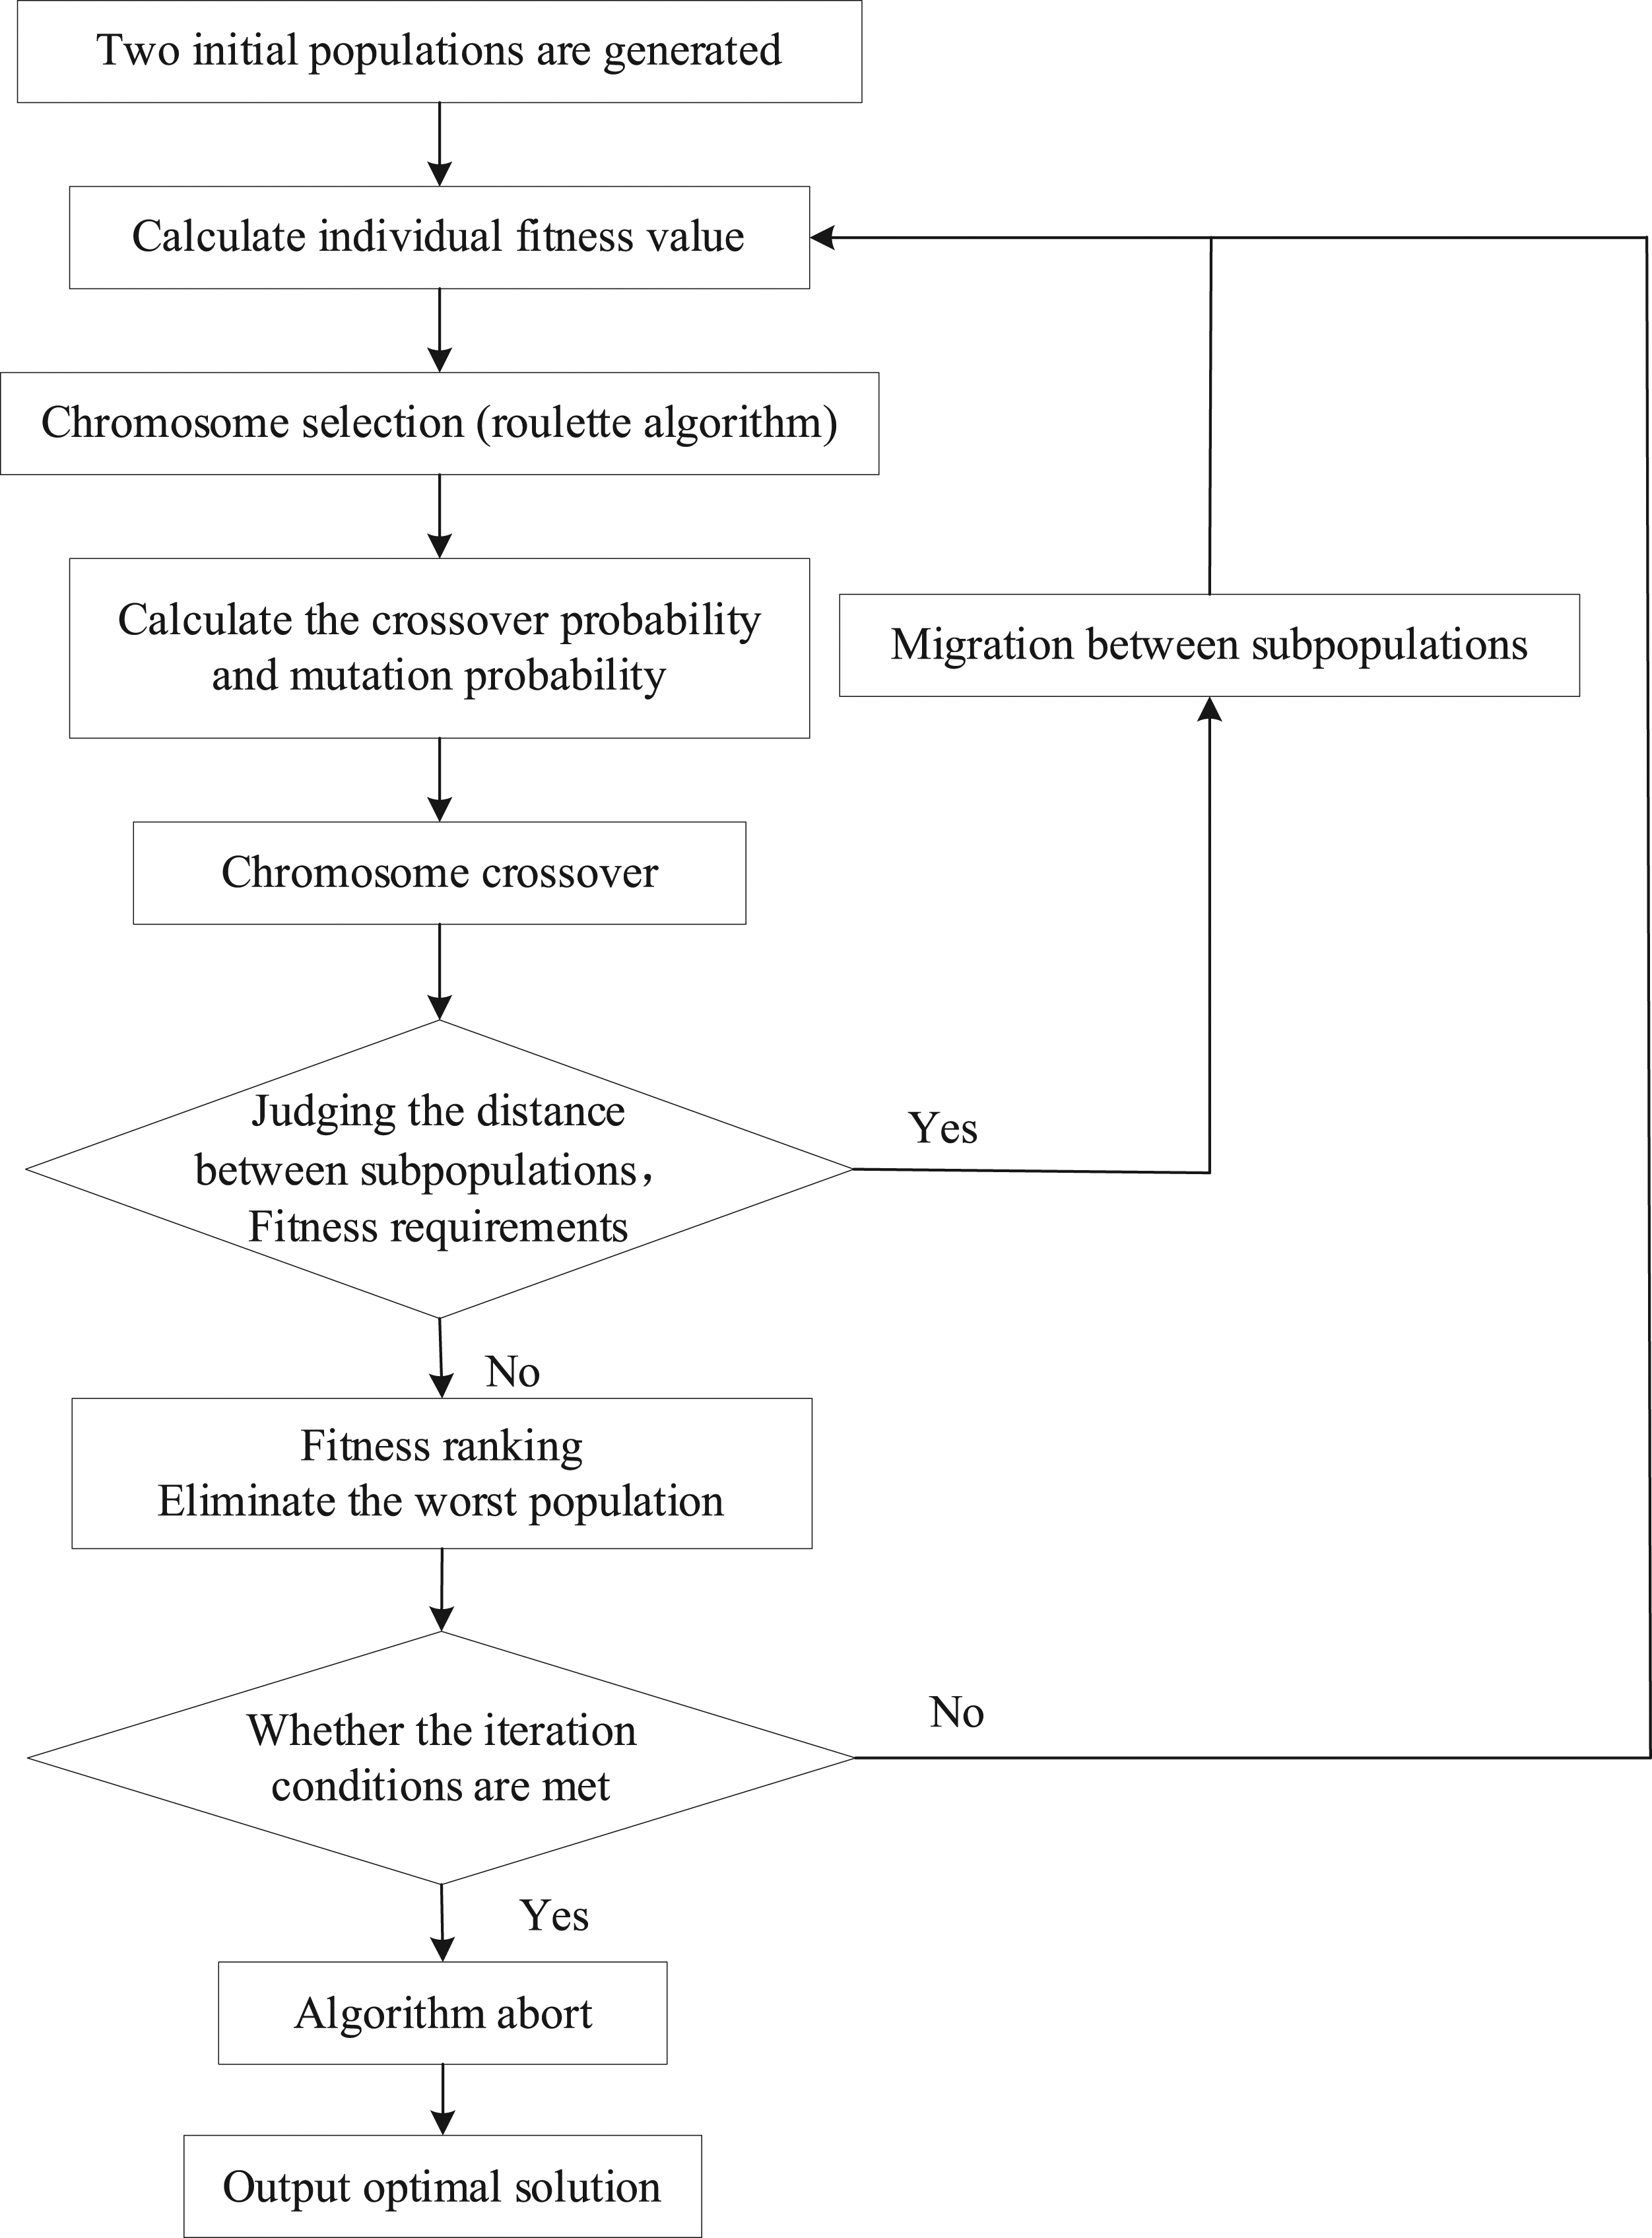
Prediction model based on BP
BP is a typical multi-layer Back Propagation neural network. Its learning process is mainly composed of two parts: signal forward propagation and error back-propagation. When the signal propagates forward, the signal enters the network through the input layer and passes through the hidden layer to the output layer. The state of neurons in each layer can only affect the state of neurons in the next layer. When the output layer does not get the expected signal, it enters the back-propagation mode, and the network will adjust the weight and threshold through the deviation, so that the output of BP is close to the expected output. After a certain number of iterations, the error is finally controlled in a very small range. 24
Three-layer BP is proposed to predict the residual life of the rolling bearing. As shown in Figure 7, the first layer is the data input layer, which inputs the historical degradation performance data {X
1
, X
2
,…, X
n
}. The second layer is the hidden layer containing neurons. The third layer is the output layer which describes the output variables which is the degraded data {Y
1
, Y
2
,…, Y
n
} in the future. The data is processed through the second layer W
ij
and third layer W
jk
with activation function. BP structure diagram.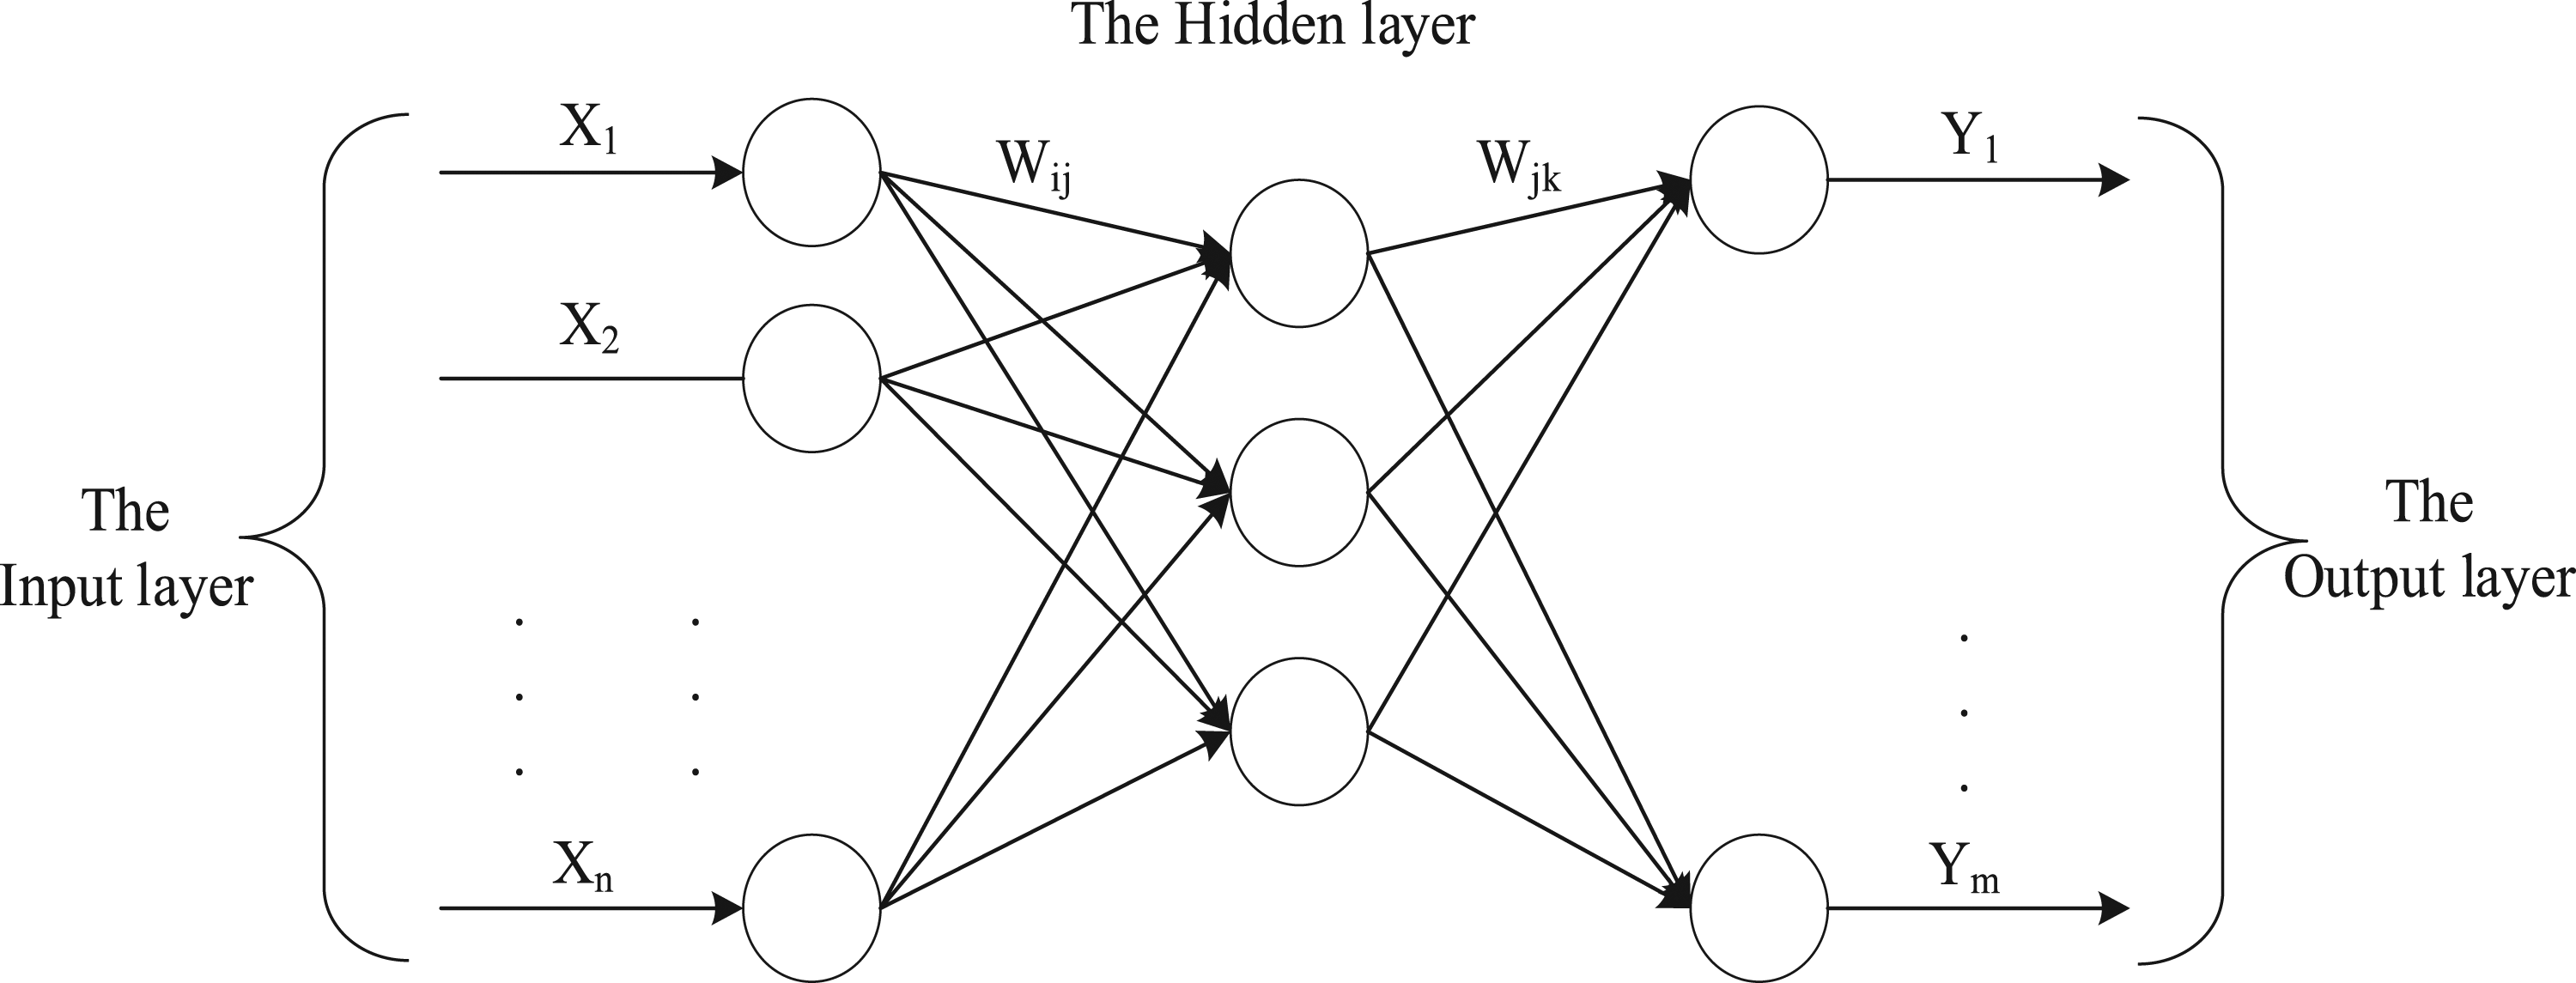
BP prediction model optimized by AMGA
Although BP has a strong ability to deal with nonlinear data, its convergence speed is slow and it is easy to fall into the local optimum. The convergence of BP mainly depends on the initial weights and thresholds. According to the characteristics of BP, it is a popular and effective method to overcome the defects of the natural heuristic algorithm.
In this paper, AMGA is used to optimize the initial weights and thresholds of BP. Each individual in the population records the ownership value and threshold value of the network. During every training, the weights, and thresholds will be updated. The individual selects, crosses, and mutates the individual population through the network feedback error value as the fitness value. After the evolution, the individual is constantly changing weights and thresholds of the network which are updated to make the BP prediction more accurate. The improved prediction model is shown in Figure 8. Flow chart of BP optimized by AMGA.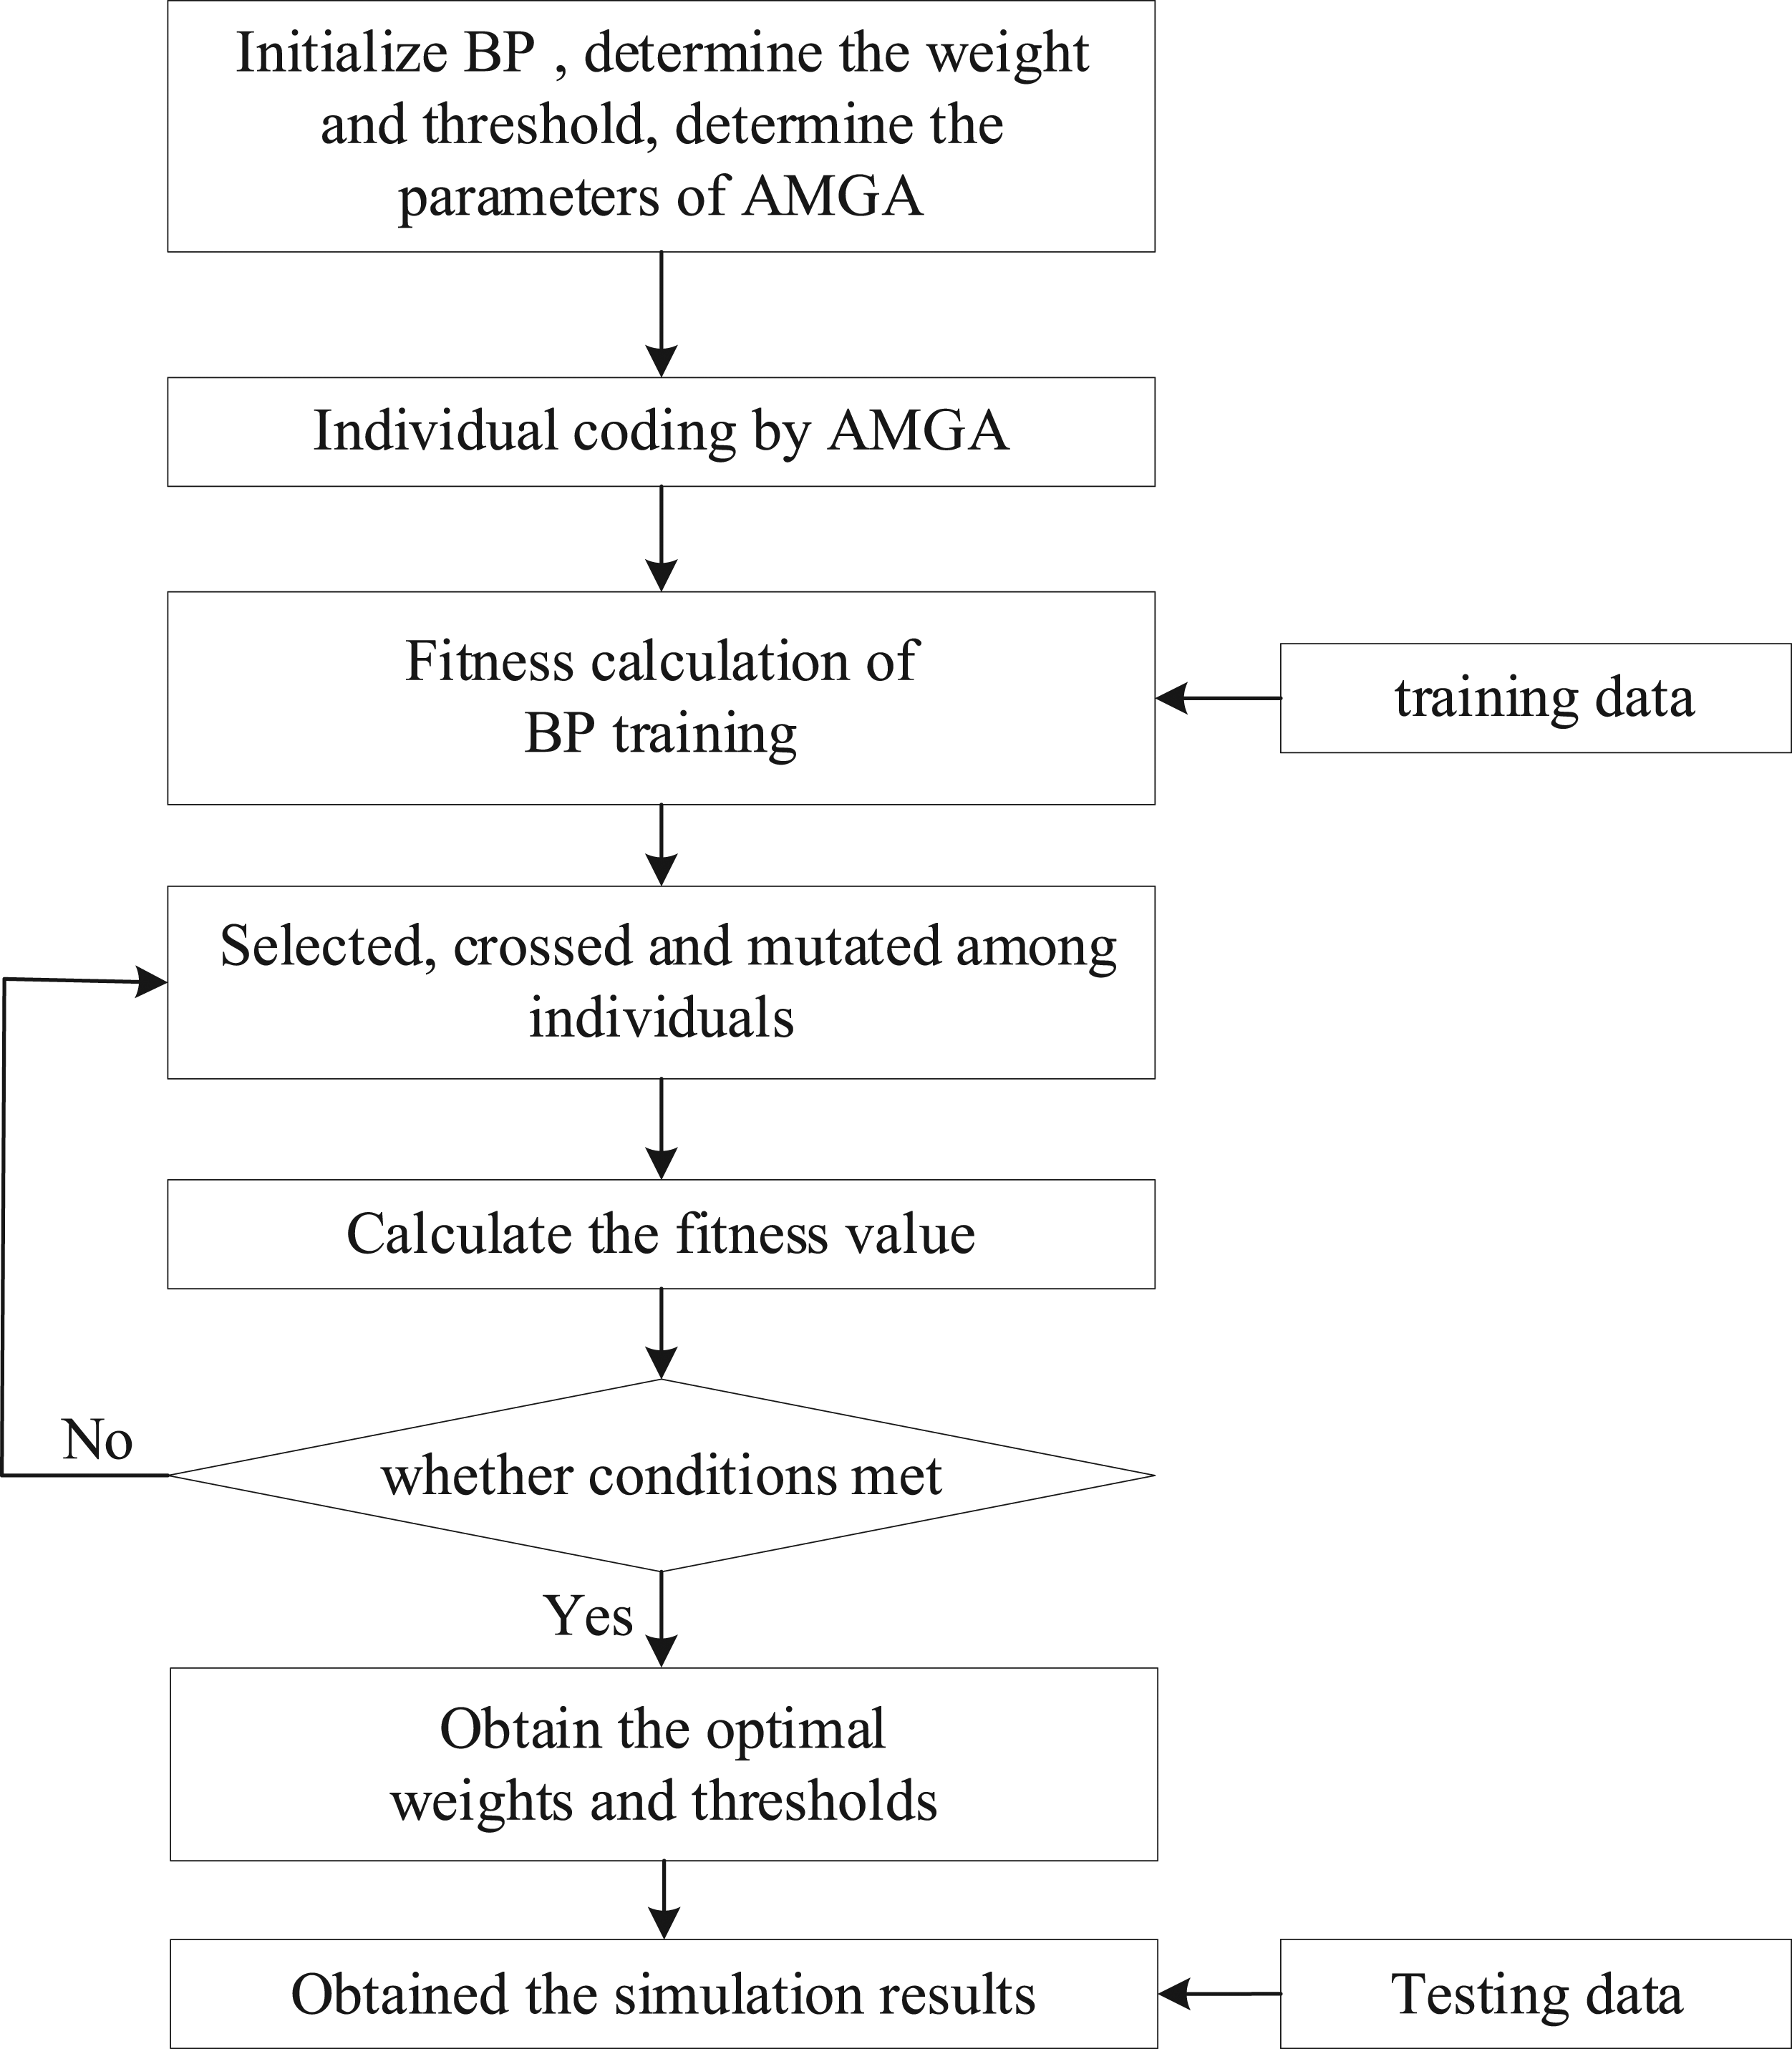
Experimental analysis
Experimental data
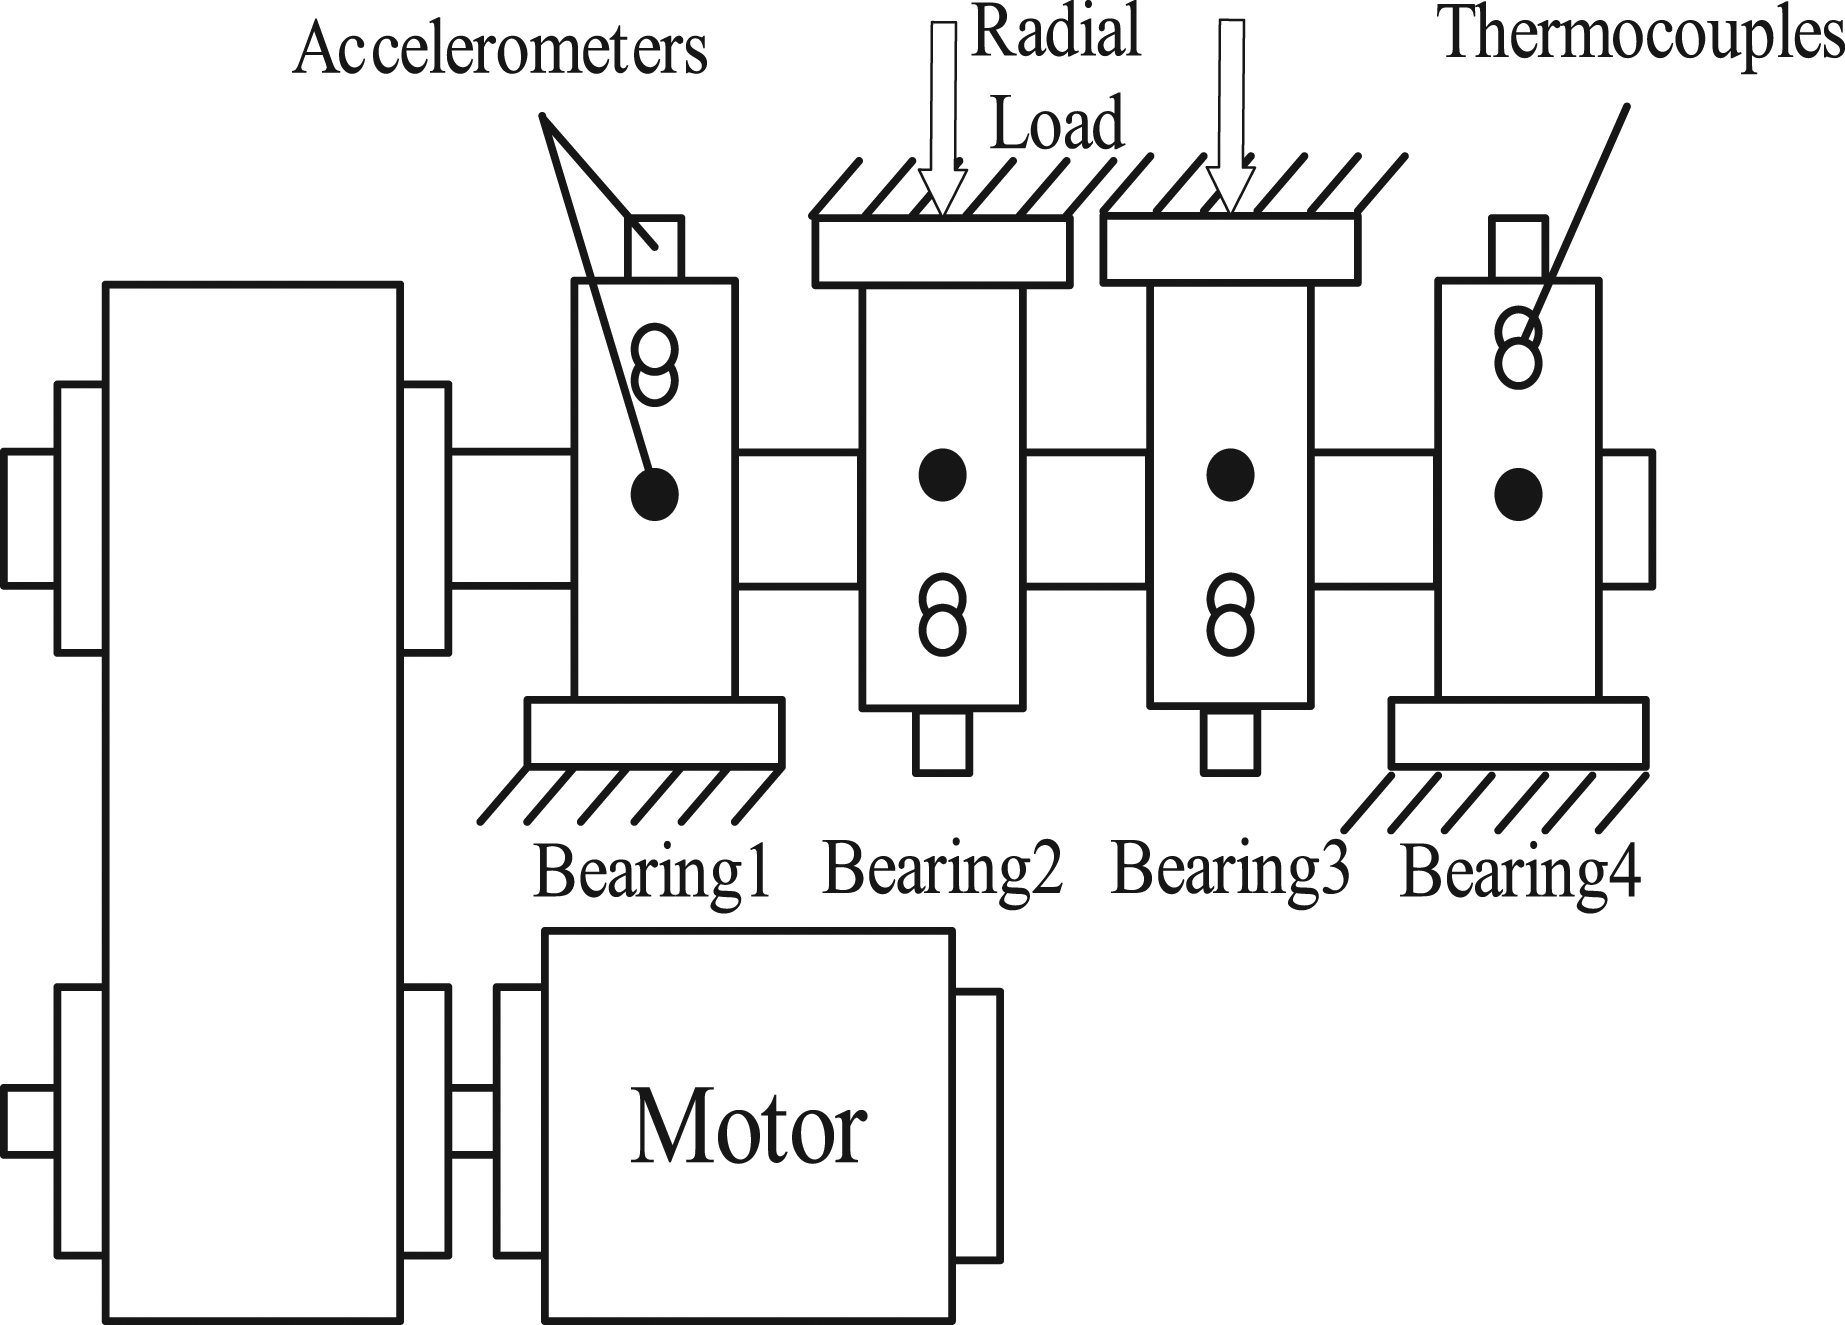
The experimental data are provided by the University of Cincinnati, USA. The Dataset is retrieving from https://ti.arc.nasa.gov/tech/dash/groups/pcoe/prognostic-data-repository. Four Rexnord ZA-2115 double row bearings
25
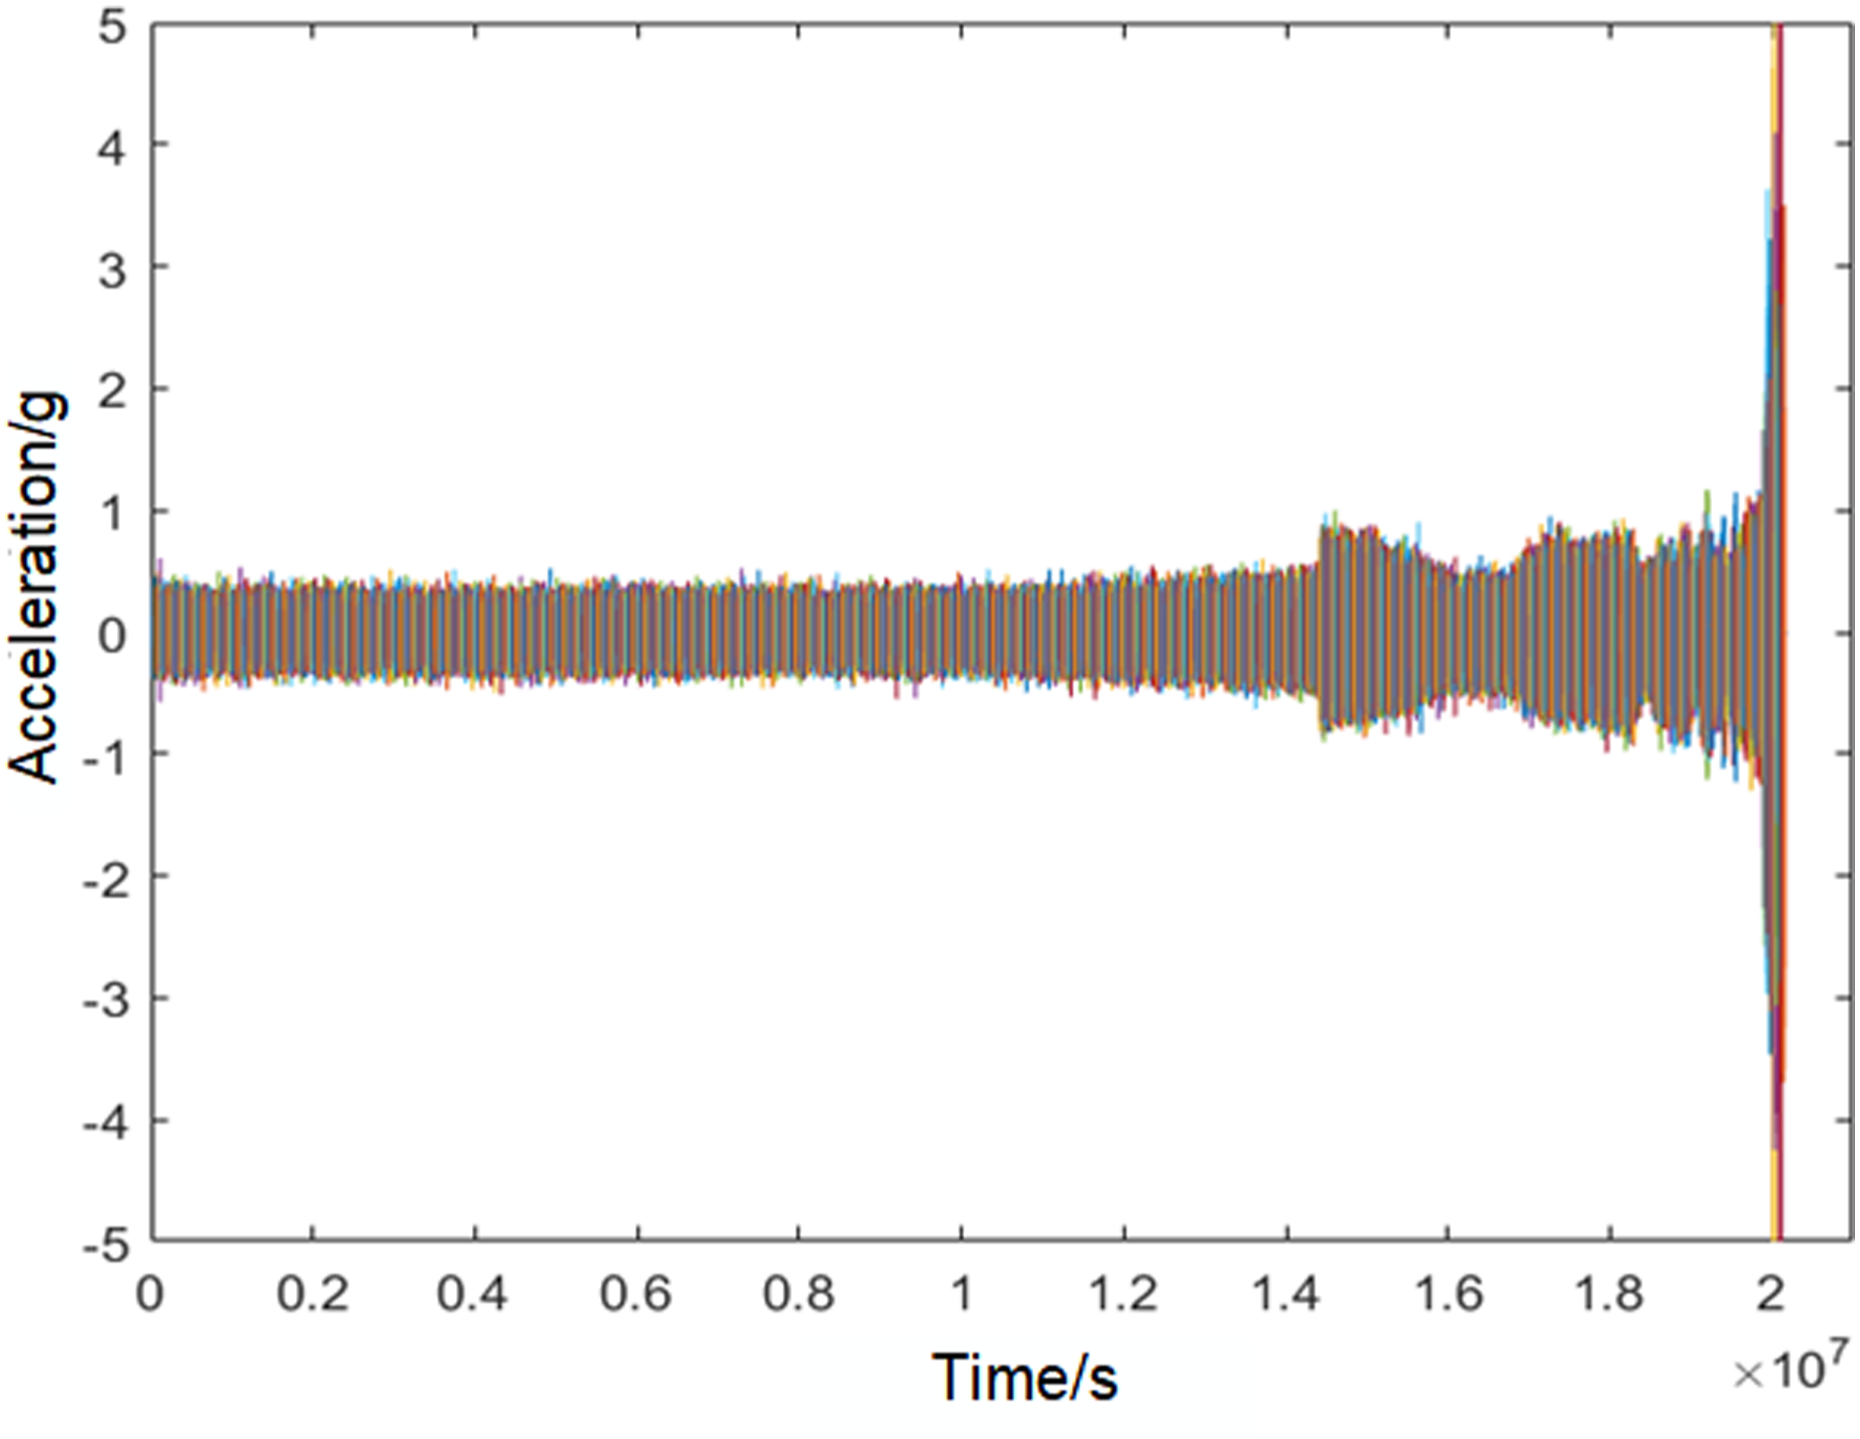
are installed on the shaft as shown in Figures 9 and 10. Each bearing is equipped with acceleration sensors in the direction perpendicular to each other, so it can meet the basic conditions of full vector fusion. The motor speed is 2000 r/min, the sampling rate is set to 20 kHz, the data acquisition interval is 20480 points, and the acquisition time is 984*10 min. Bearing 1 is selected to collect the outer ring failure vibration signal, as shown in Figure 11, which is the time domain waveform of the whole life process of the bearing from normal operation to outer ring failure. Partial of experimental platform. The structure of the experimental platform. Waveform of the whole life process in time domain.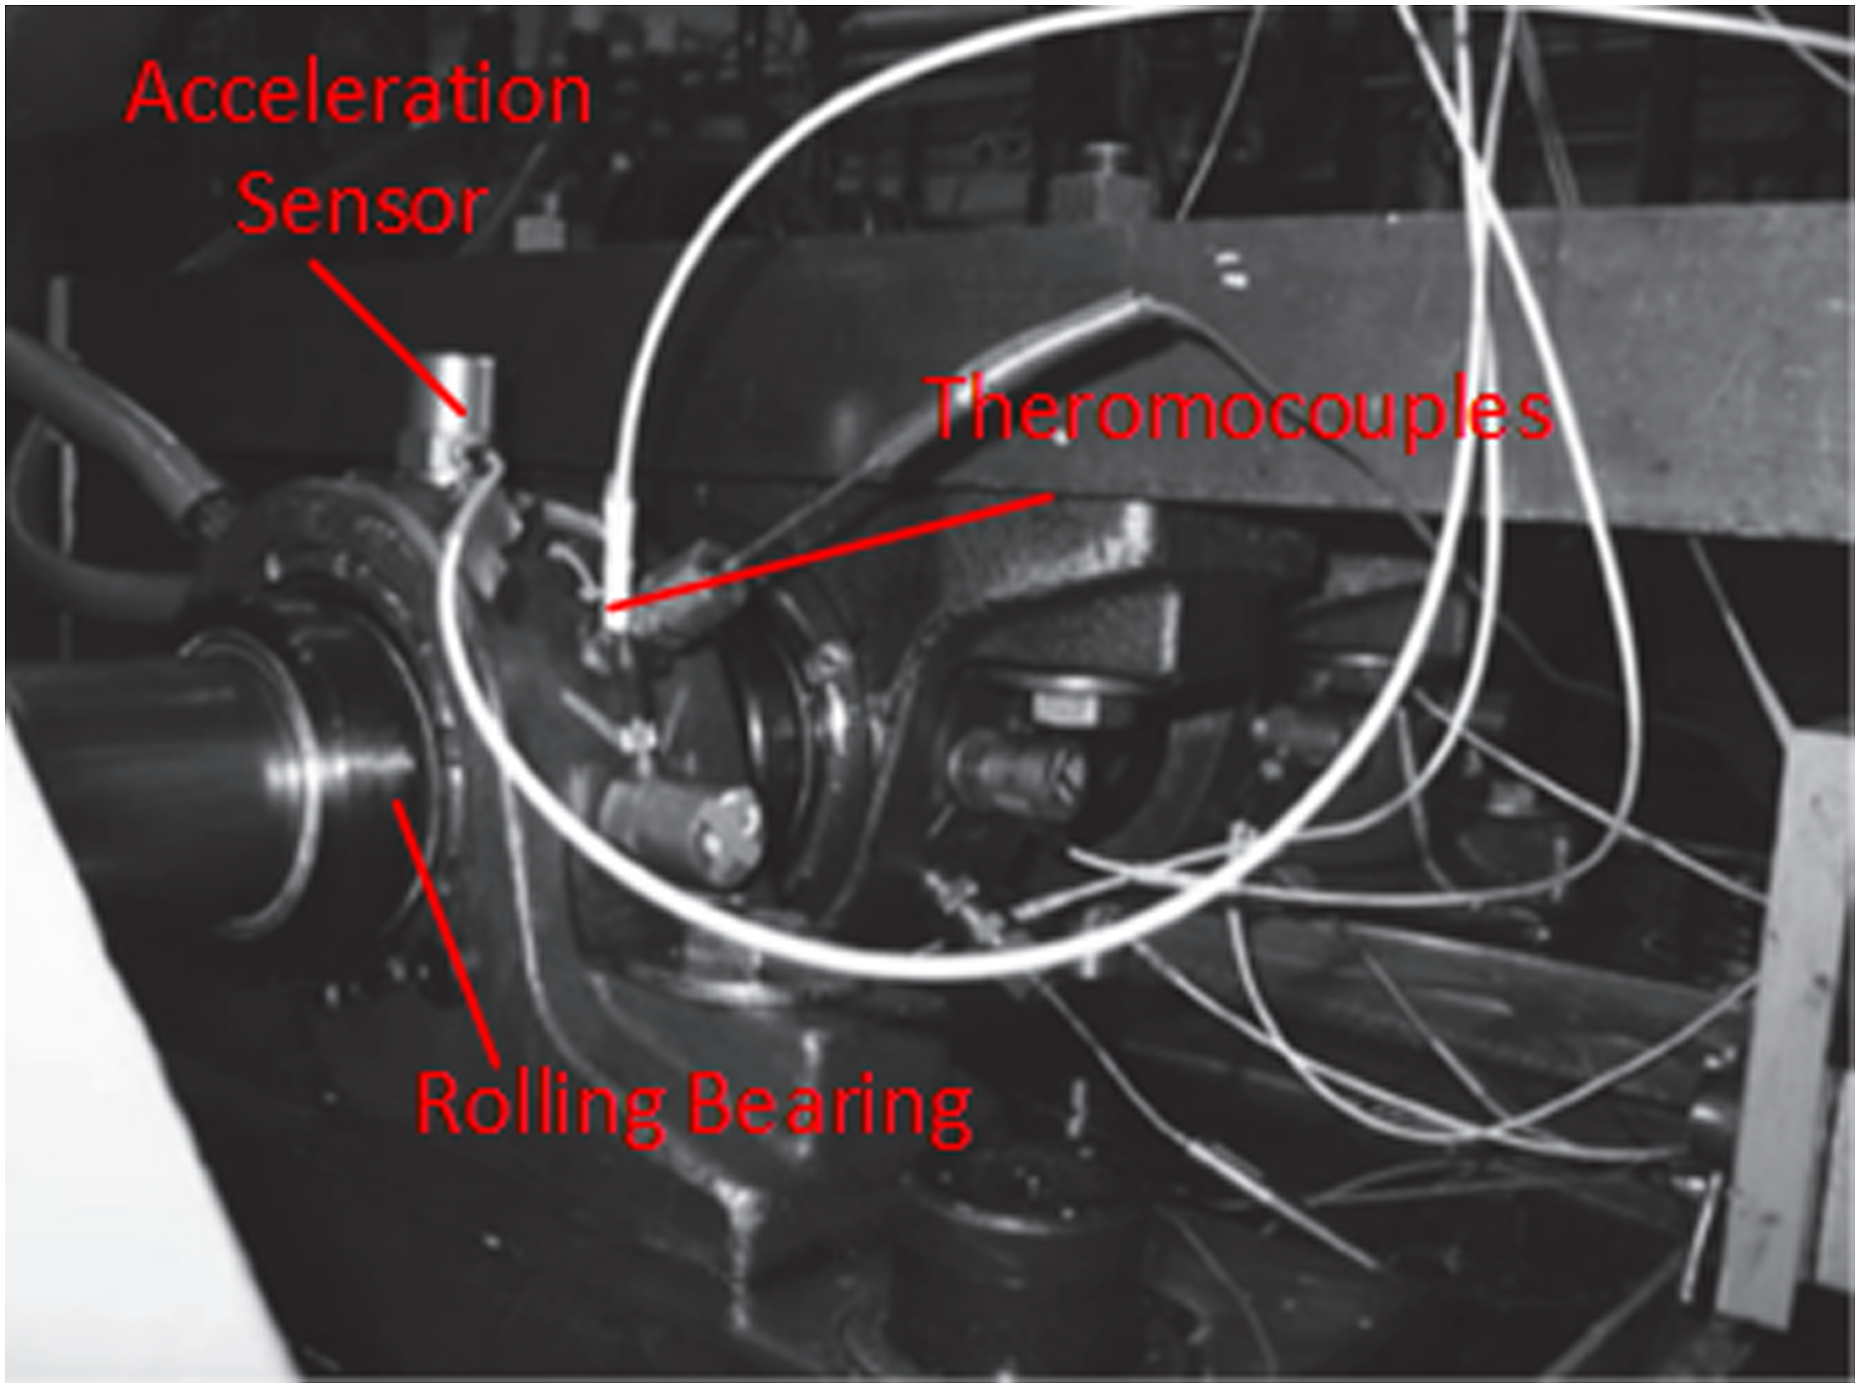
Verification results and discussion
Time and frequency feature extraction
Because of the large amount of original data, the time-frequency domain feature extraction can effectively extract features with a large amount of recognition information, which is reliable and can improve the accuracy of the training and testing of the prediction model.
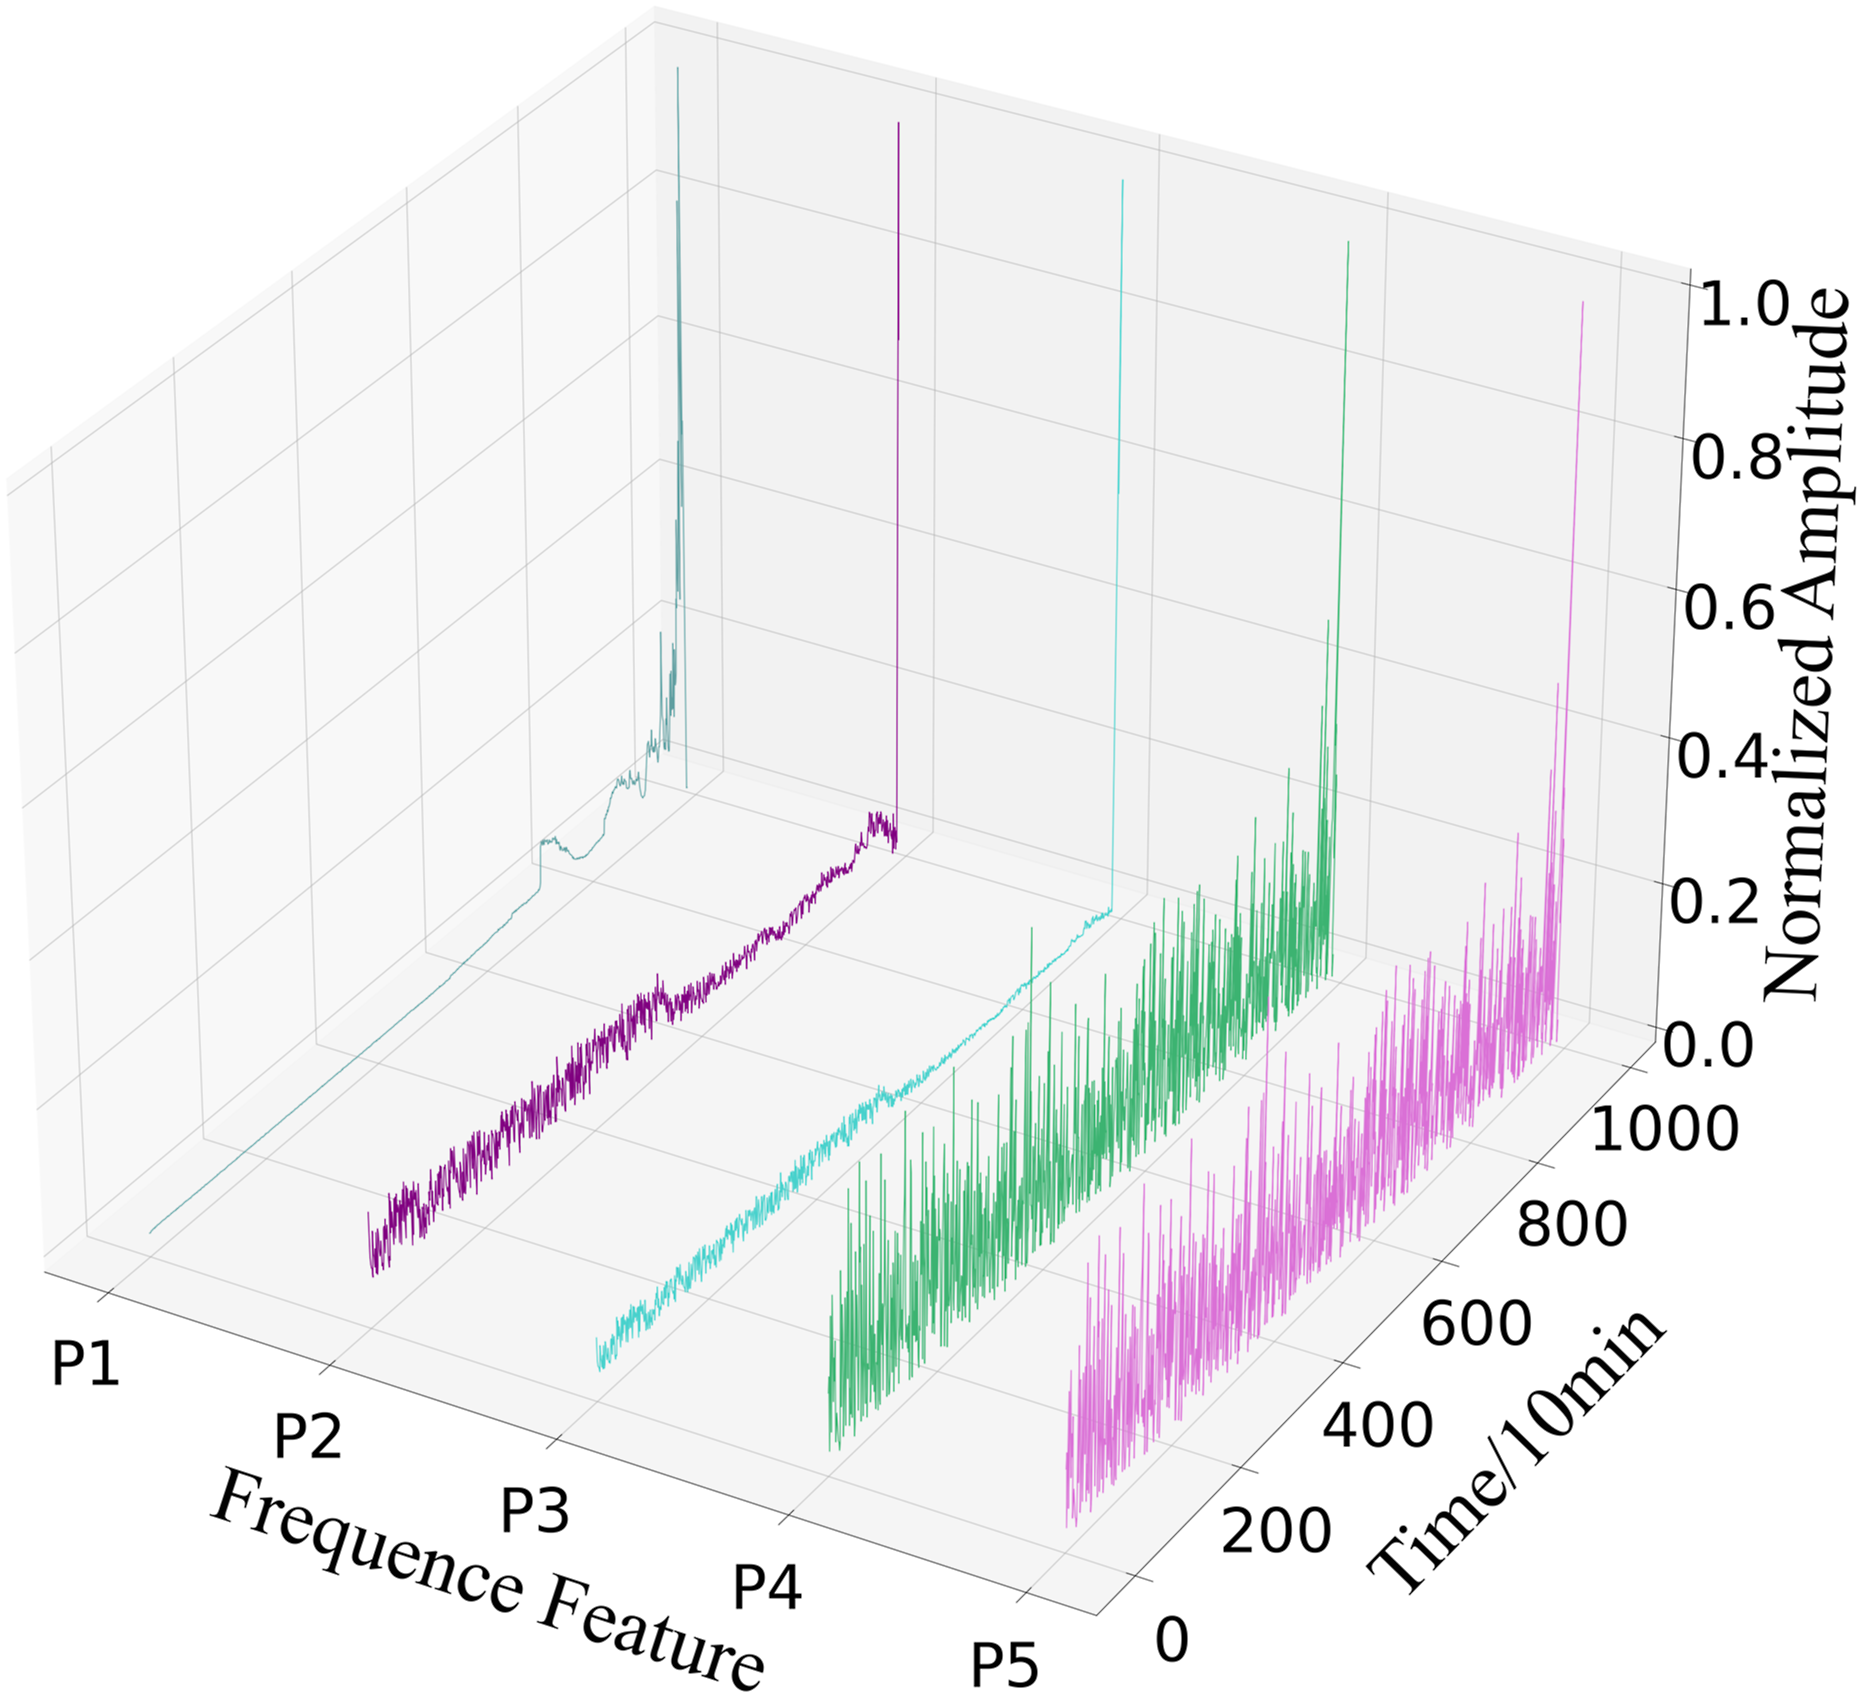
9 time domain signals and 5 frequency domain signals shown in Figures 12 and 13 are extracted from the rolling bearing. It can be seen that each index reflects the bearing degradation trend in different ways. Among them, Kurtosis, Root Mean Square and P1 have obvious degradation trends and Form Factor, Crest Factor, Margin Factor, and P2 are too noisy to be sensitive to early faults, so they require for further feature extraction. 9 time domain signals. 5 frequency domain signals.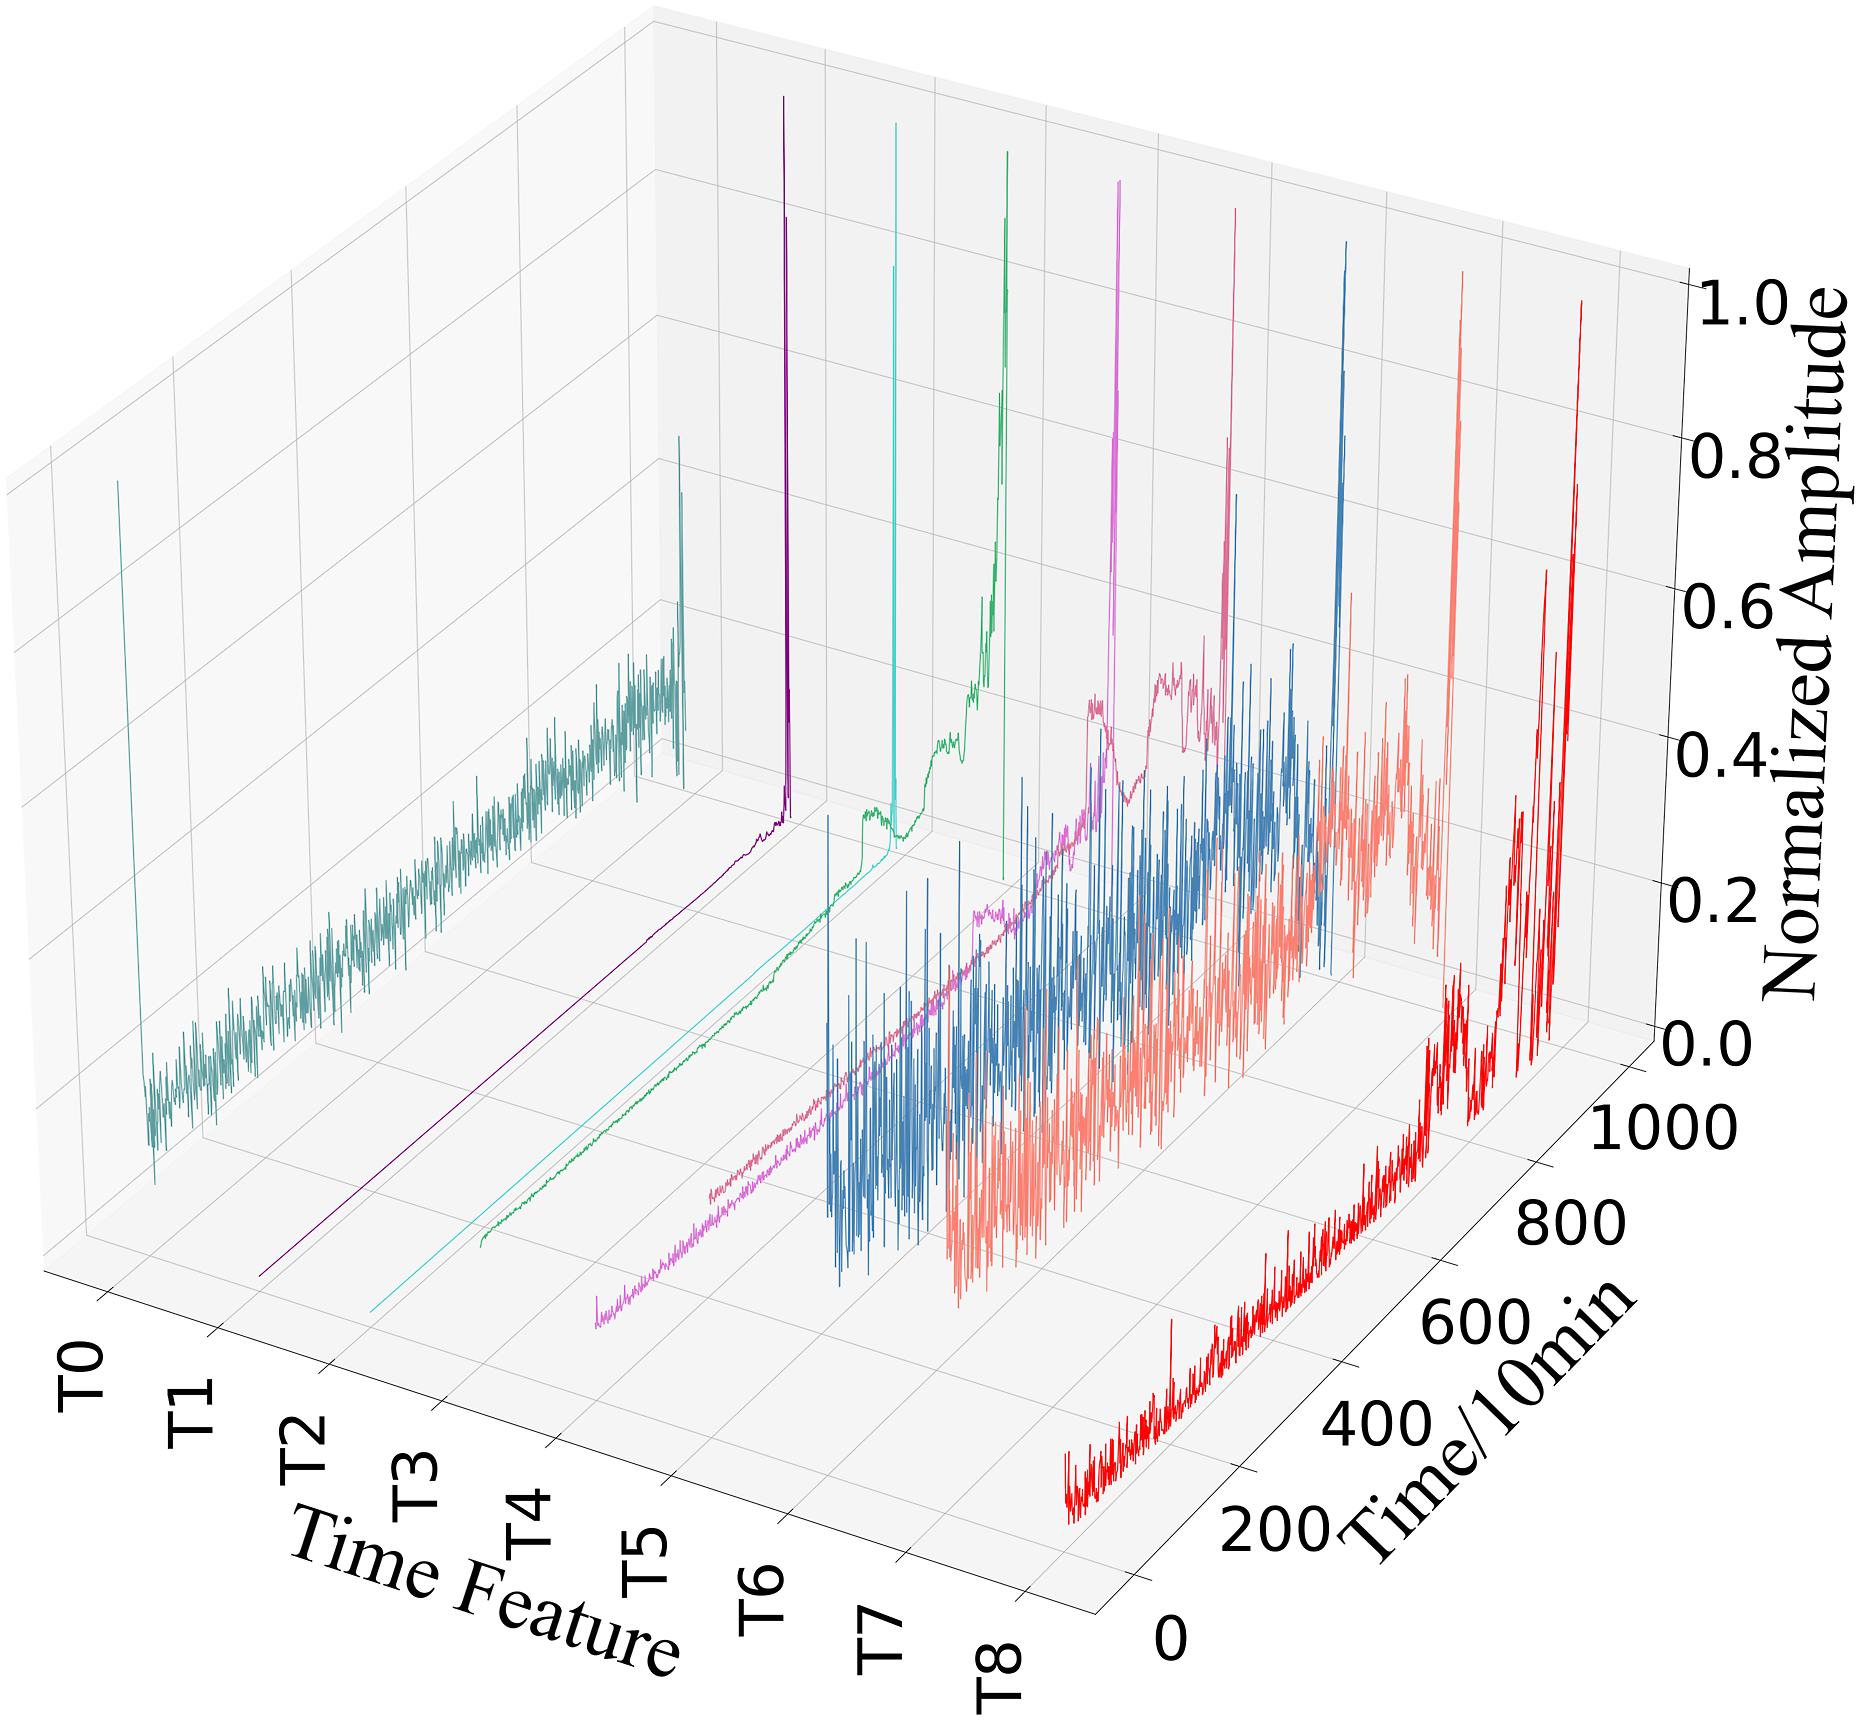
Feature fusion
The process of bearing degradation is complex and mutable, so it is necessary to use multiple characteristic parameters to characterize the whole degradation process, so as to eliminate the parameters which are insensitive to bearing degradation. Compared with the traditional feature extraction methods, the feature extraction method combining time domain and frequency domain features improve the accuracy, adaptability, and robustness of bearing degradation trend prediction.
Through time frequency feature extraction, 9 time domain features and 5 frequency domain features can be obtained, but the contribution of each feature to the life characteristics of rolling bearing is different. KPCA is used to obtain the principal component after time and frequency domain feature fusion. The first principal component with the highest correlation of rolling bearing life is used as the trend signal of the rolling bearing life feature. The first principal component is shown in Figure 14. The first principal component.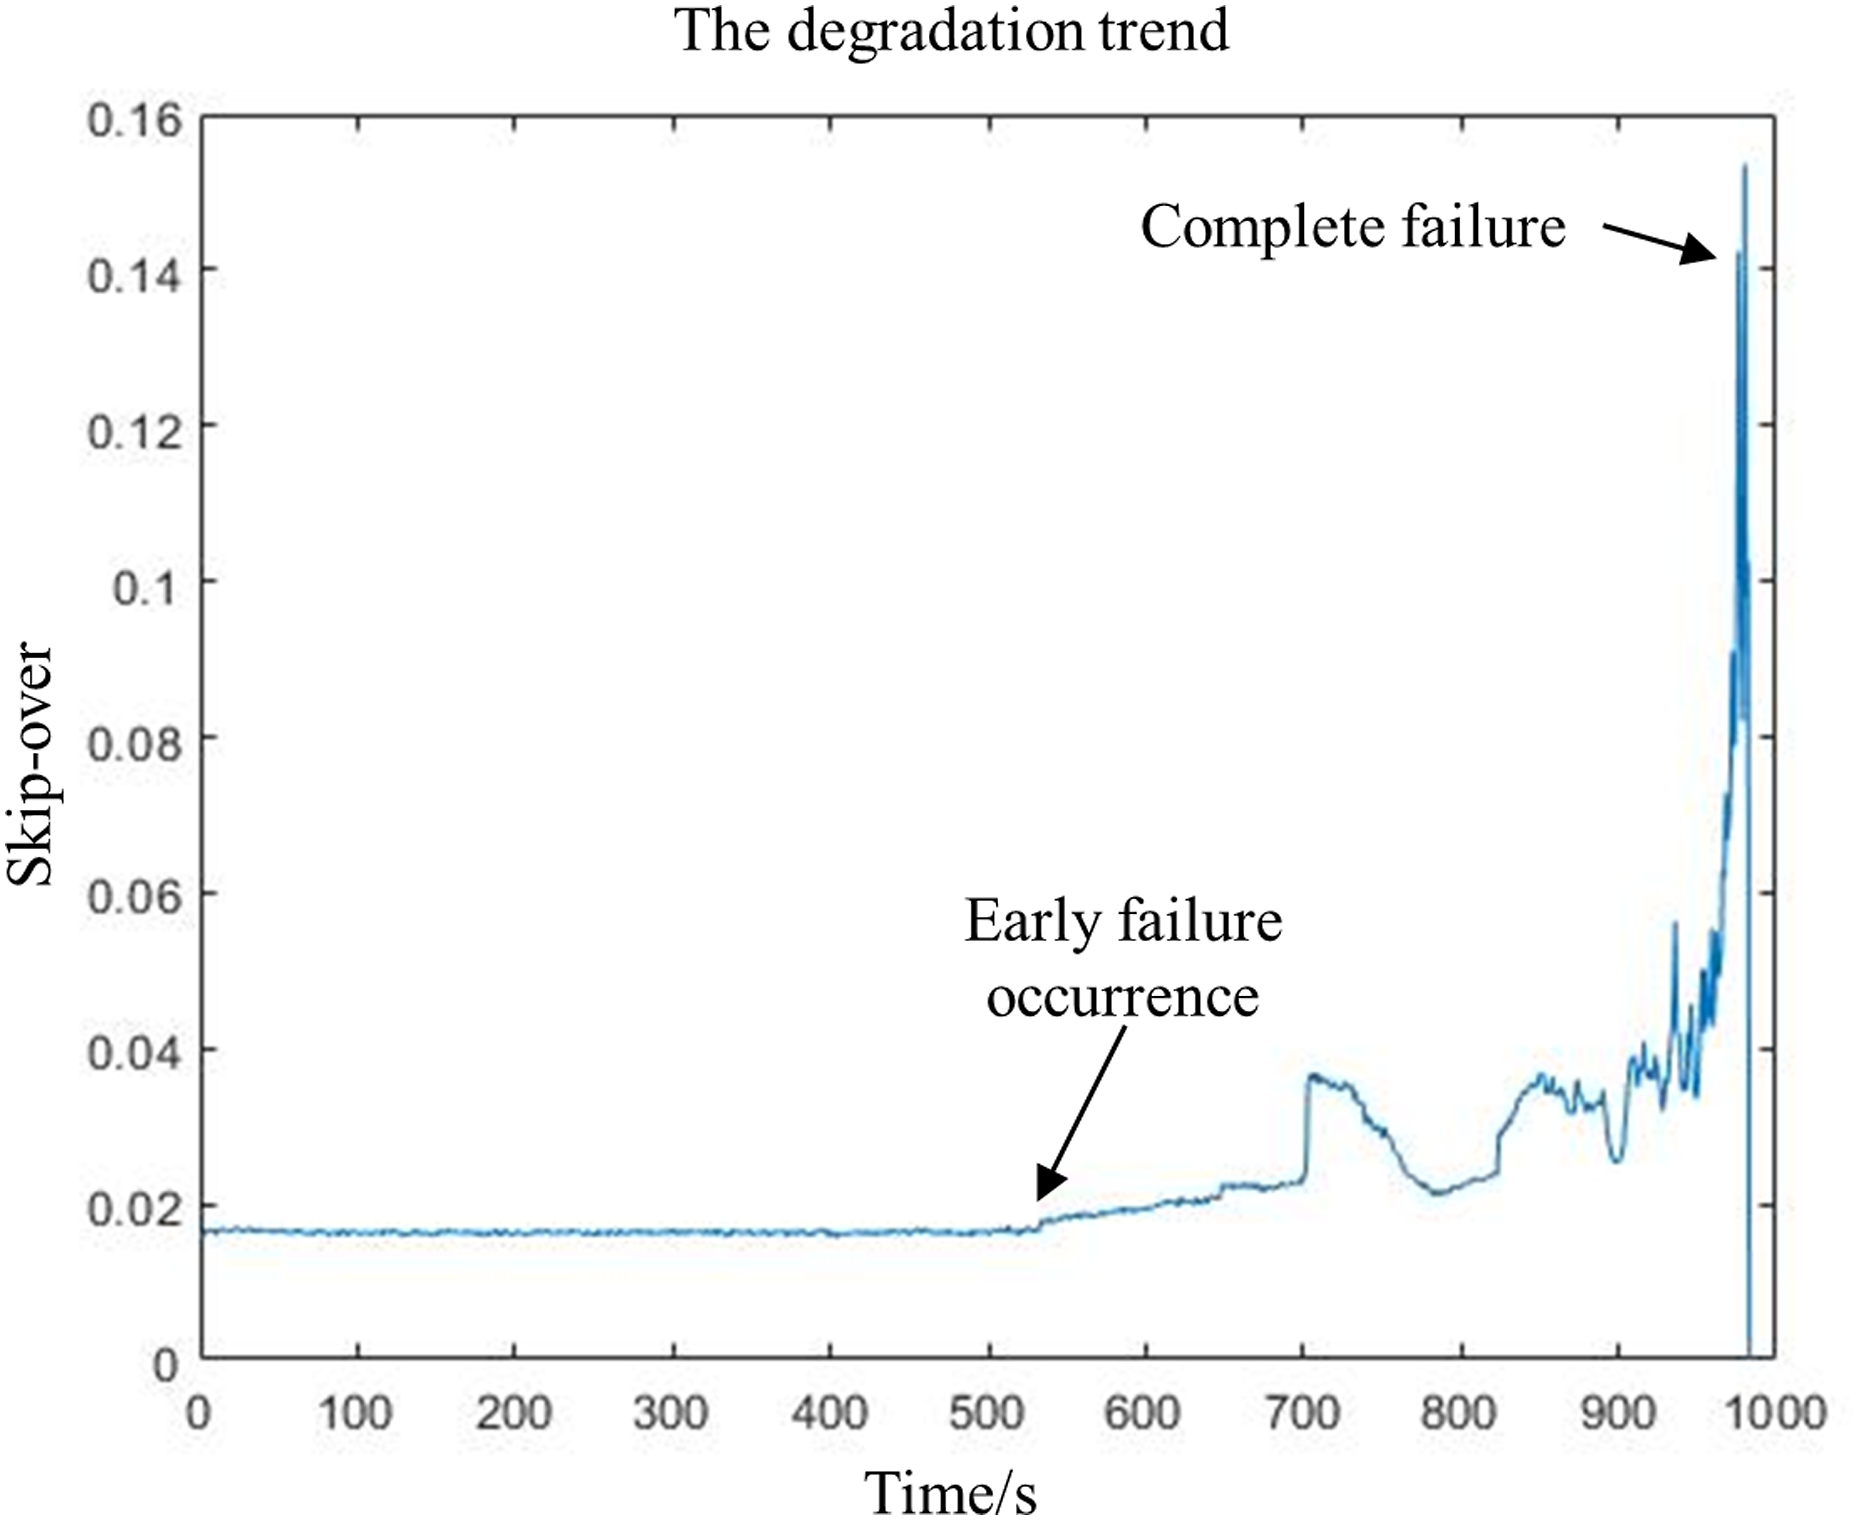
Degradation prediction
The obtained trend signal of rolling bearing life characteristics is input into the BP prediction model improved by AMGA, which is proposed in a new communication strategy to improve the accuracy and efficiency of optimization.
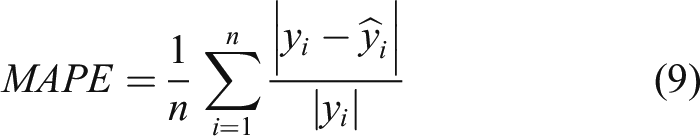
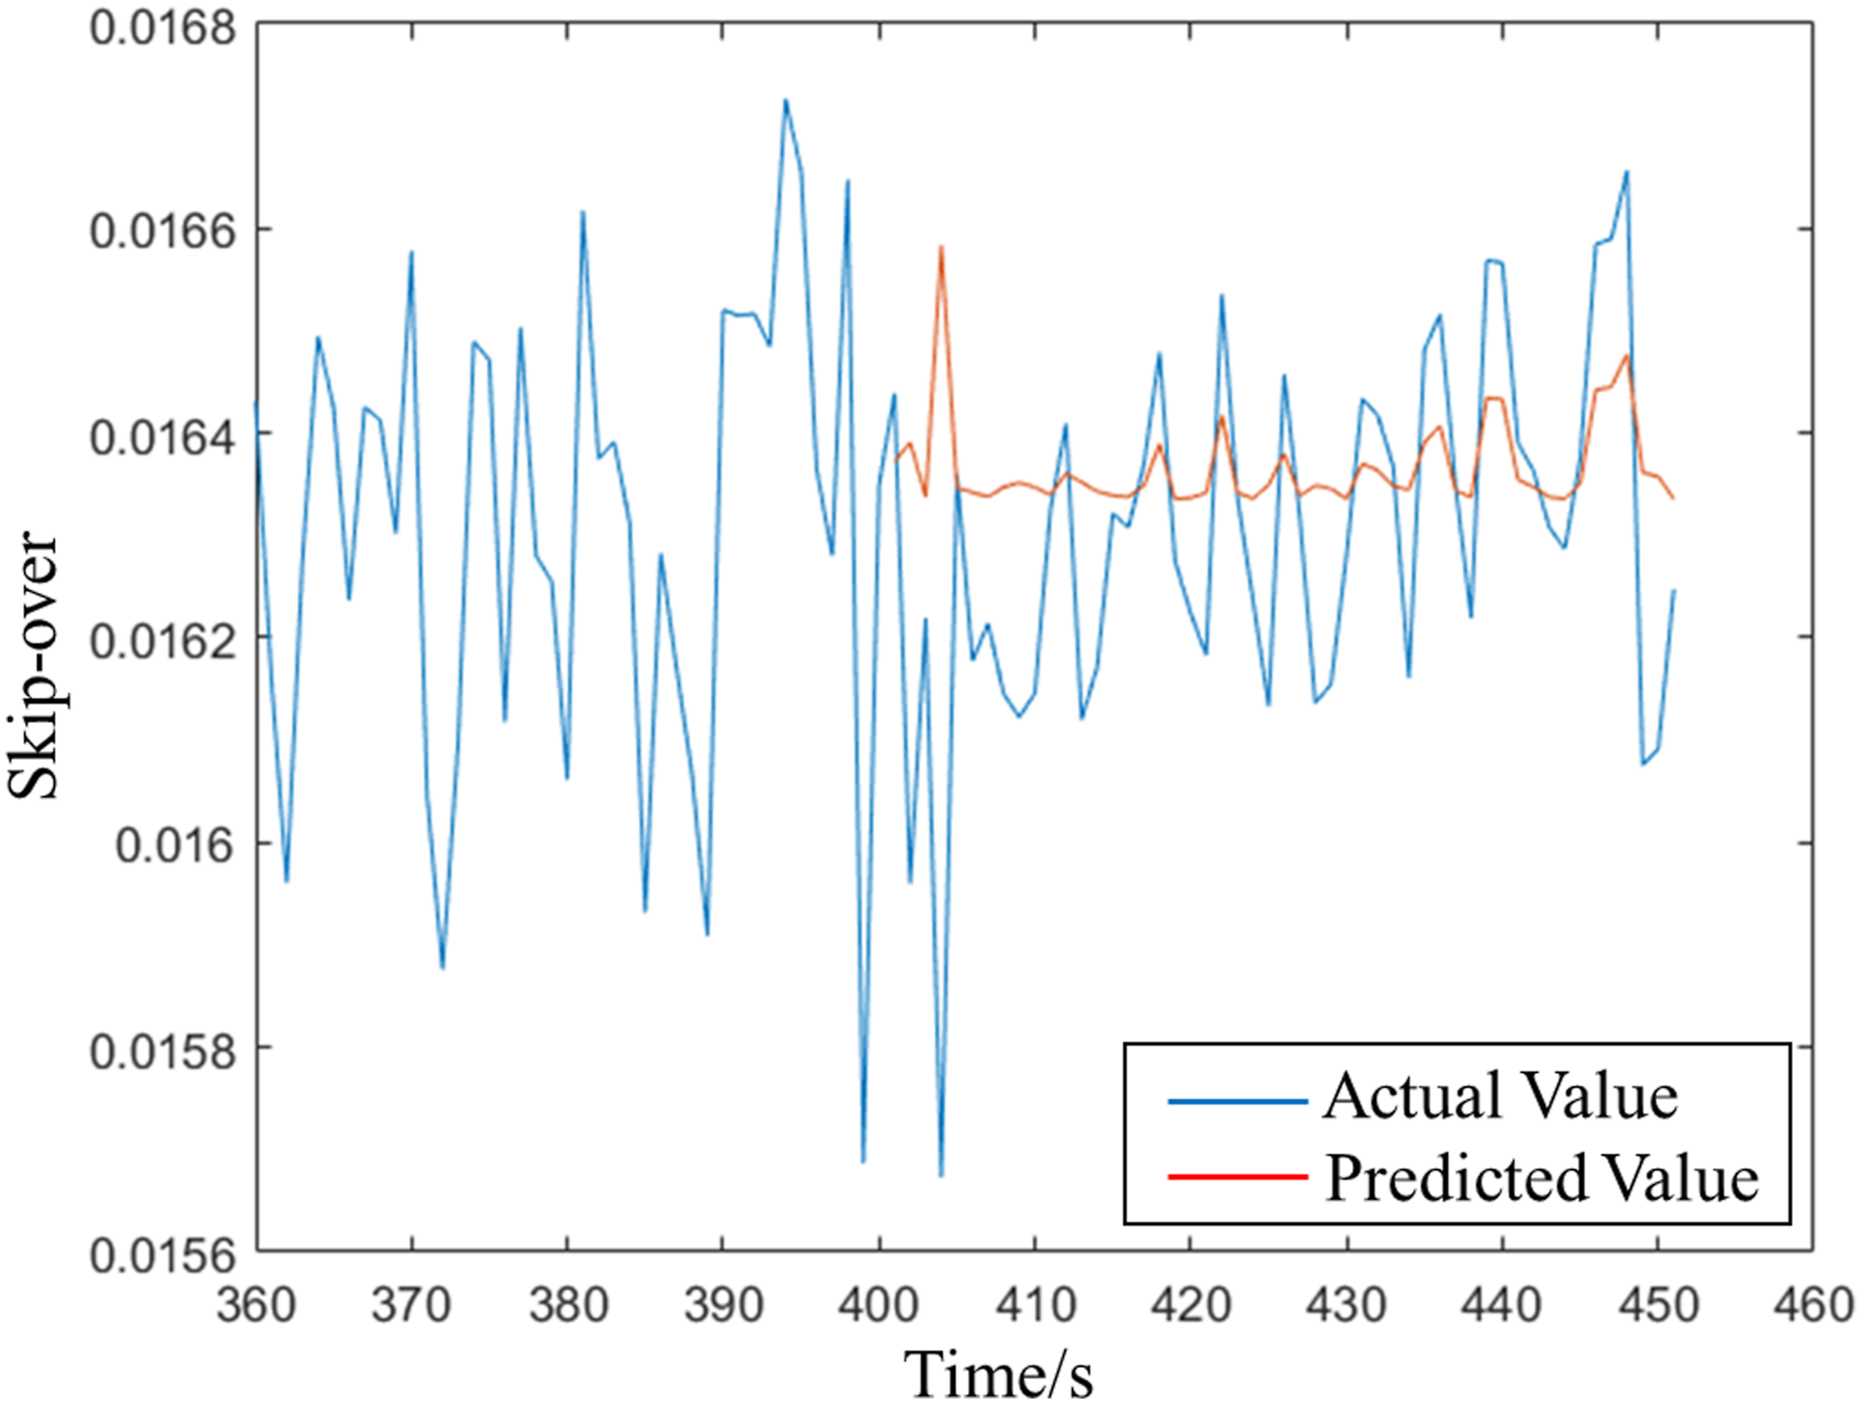
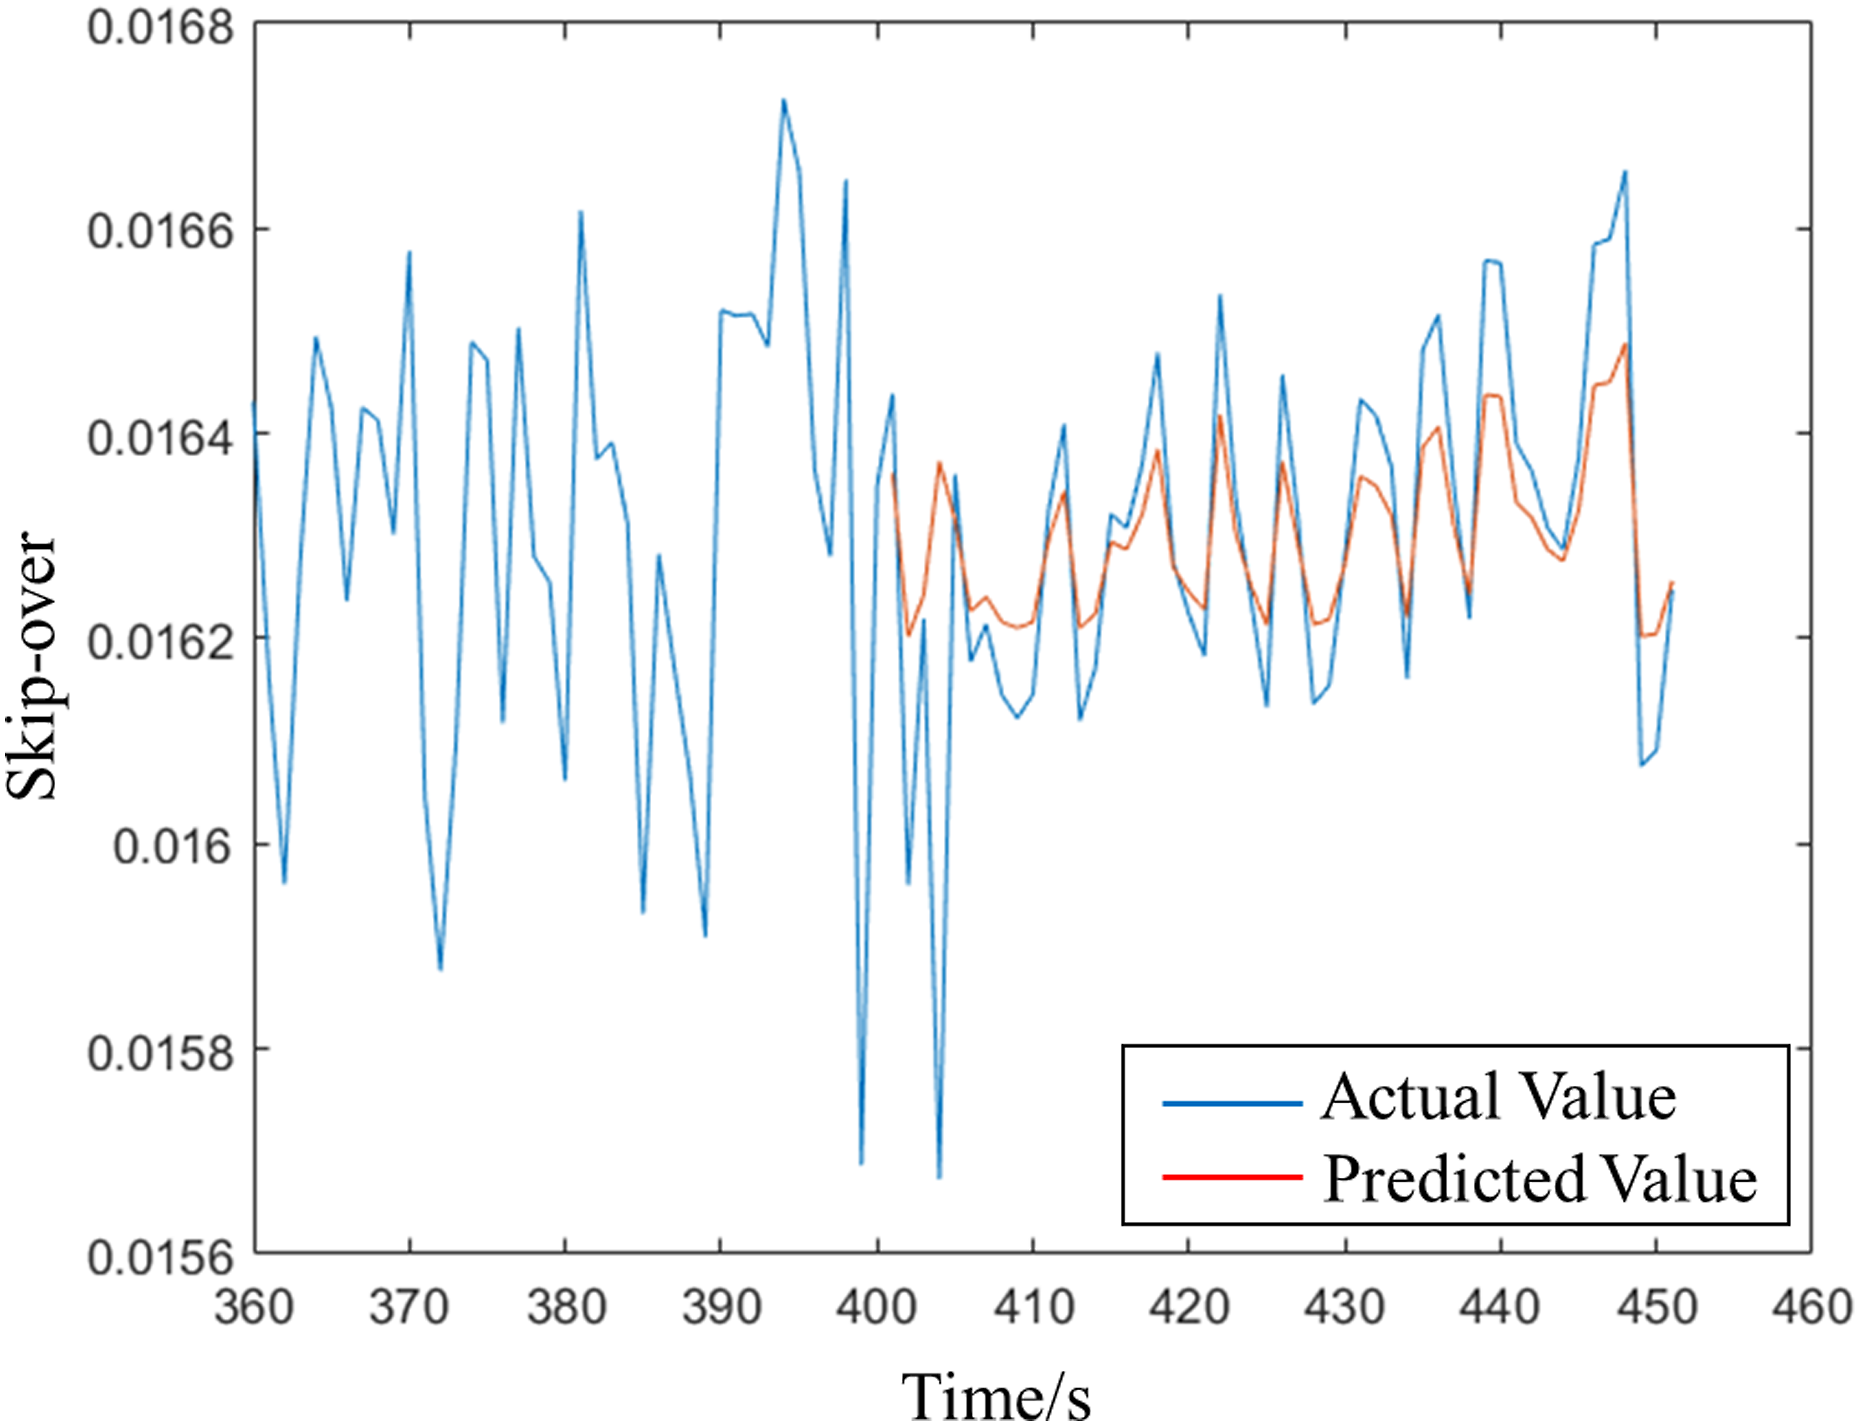
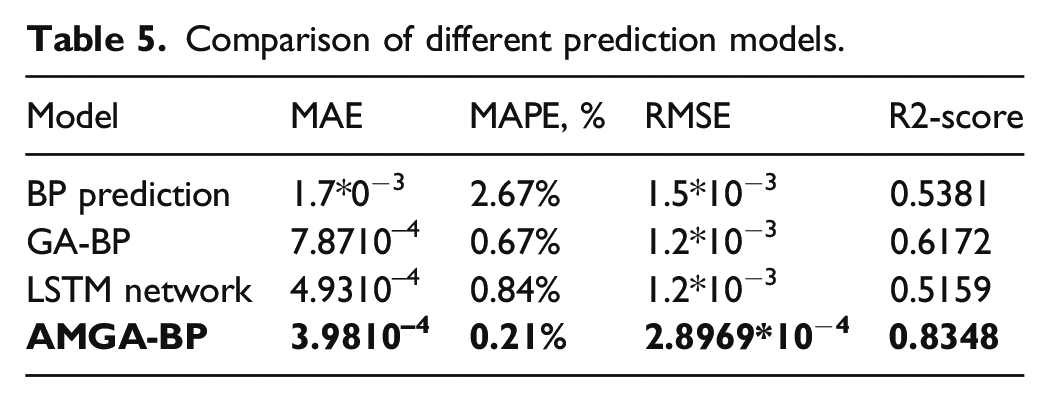
Figures 15–17 respectively show that 30 points are used to predict the next 60 points under BP, GA-BP, and AMGA-BP. The blue line is the actual value and the red line is the predicted value. Obviously, the predicted value is much closer to the actual value of using the AMGA-BP prediction. Table 5 shows the comparison of MAE, MAPE, RMSE, and R2-Score under different models, where MAE is mean square error, MAPE is mean absolute percentage, and RMSE is root mean square error. The values are much closer to 0 when the model is more accurate. Moreover, the prediction model achieves accurate performance when R2-Score is close to 1. MAE, MAPE, RMSE, and R2-Score are obtained from equations (8-11). In the equation y
i
is the predicted value, BP prediction. GA-BP prediction. AMGA-BP prediction. Comparison of different prediction models.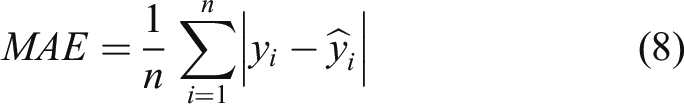
Conclusion
In this paper, the KPCA method is used to fuse the time domain and frequency domain signals of rolling bearing vibration signals obtained in complex environments, and obtain the whole life trend of rolling bearing effectively. Moreover, KPCA-AMGA-BP prediction model is proposed, which is higher than BP, GA-BP, and LSTM method in prediction accuracy. AMGA uses the distance and fitness comparison of the optimal solution in the iterative process of two populations to determine whether the two populations are allowed to carry out gene exchange, which limits the exchange conditions and increases the effectiveness of the exchange between populations in the optimization process. The proposed prediction model uses AMGA method to optimize the number of neurons, the initial weights, and thresholds of BP, which increases the prediction accuracy of BP.
The experimental results show that the proposed method can accurately predict the future degradation trend of bearings within the allowable error range. Compared with other similar methods, this method has certain advantages under MAE, MAPE, RMSE, and R2-Score, and can provide new ideas for the related research in this field.
Footnotes
Acknowledgements
We thank Shanghai University of Engineering Science for assisting with the measurement setups.
Author Contributions
Conceptualization, L.H and Y.L; metholdology, L.H and Y.L; software, L.H, Q.S and M.T; validation, L.Y, L.C, M.T, J.H and W.Y; writing-original draft preparation, L.H and Y.L; writing-review and editing, L.H, Y.L and W.Y; supervision, Y.L and W.Y. All authors have read and agreed to the published version of the manuscript.
Declaration of conflicting interests
The author(s) declared no potential conflicts of interest with respect to the research, authorship, and/or publication of this article.
Funding
The author(s) disclosed receipt of the following financial support for the research, authorship, and/or publication of this article: This article was supported by the National Key R&D Program of China (grant number: 2020AAA0109300).