
Abstract
Most of the 3D reconstruction requirements of microscopic scenes exist in industrial detection, and this scene requires real-time object reconstruction and can get object surface information quickly. However, this demand is challenging to obtain for micro scenarios. The reason is that the microscope’s depth of field is shallow, and it is easy to blur the image because the object’s surface is not in the focus plane. Under the video microscope, the images taken frame by frame are mostly defocused images. In the process of 3D reconstruction, a single sheet or a few 2D images are used for geometric-optical calculation, and the affine transformation is used to obtain the 3D information of the object and complete the 3D reconstruction. The feature of defocus image is that its complete information needs to be restored by a whole set of single view defocus image sequences. The defocused image cannot complete the task of affine transformation due to the lack of information. Therefore, using defocus image sequence to restore 3D information has higher processing difficulty than ordinary scenes, and the real-time performance is more difficult to guarantee. In this paper, the surface reconstruction process based on point-cloud data is studied. A Delaunay triangulation method based on plane projection and synthesis algorithm is used to complete surface fitting. Finally, the 3D reconstruction experiment of the collected image sequence is completed. The experimental results show that the reconstructed surface conforms to the surface contour information of the selected object.
Keywords
Introduction
Human beings view the three-dimensional structure of the surrounding world according to the intuitive visual system. Its visual information is the most important means for us to perceive others, objects, society, and the world.1–3 The information we see through our eyes accounts for 80% of the external information we know. After the birth of the computer, through an image recognition algorithm, researchers can identify people and objects in pictures and even use machine learning algorithms to interpret facial expressions.4,5
Researchers in computer vision have been developing algorithms for recovering 3D information from images.3,4,6,7 With this technology, we can accurately calculate part of the 3D model of the environment from thousands of photos. However, it is still difficult to recognize and classify images.2,5 The reason is that machine vision research is a reverse problem, such as reconstructing its shape, texture, and color distribution through images. However, we use the models of physics, statistics, and other disciplines to establish relevant mathematical models and recover the unknown from the lack of information to solve the target problem.4,6,8–21
Three-dimensional reconstruction is essential for computer vision.2,4–6,9,14,22 It uses image information collected by visual equipment and then calculates the 3D information. At present, this method can be used in many fields such as navigation, remote sensing, industrial detection, and so on. In the 1970s, Marr first proposed a theoretical framework of machine vision, which was widely accepted and followed by researchers in related fields, and was known as the father of computer vision in this field. 1 In the next 20 years, vision theory has been developed rapidly, and many algorithms have become the foundation of today’s visual theory and have been developed and applied in various directions. In the 1980s, Ikeuchi and Horn 23 brought forward the concept of shape from the shading method. According to the shading equation, the reflected lighting model was built, and then the 3D structure was derived from the surface method. As the method is an under-constrained problem, other constraints need to be added to solve the problem. Vogel et al. 24 proposed a three-dimensional reconstruction of the light field of real pictures based on the non-Lambert model. Barranco et al. 25 used optical flow tracking technology to match image feature points and then performed affine transformation to obtain camera parameters and 3D coordinates of the target object. This is the first complete three-dimensional reconstruction model using images, but the accuracy is not high, and the application is also relatively few. In 2003, Schmitt proposed a high-quality 3D reconstruction method, 3 which used laser scanning to obtain texture information and contour information modeling, and the error of the recovered 3D structure was 0.25%. In 2012, Microsoft Research launched that the depth information of the scene could be obtained through multiple depth sensors, and the 3D model of the scene could be reconstructed in real time by the computer under multi-angle scanning. This method has become the most popular method for 3D reconstruction at present.
The 3D reconstruction of the microscopic scene in this paper has more application requirements in industrial detection and medicine.4,10,26–29 However, due to the characteristics of the short depth of field of a microscopic scene, only a small part of each image is clear. A small amount of image information is far from enough for 3D reconstruction, and a large number of continuous frame images have enough information. However, they can not solve the problem of low computational efficiency. Therefore, at present, this field only studies the method of relative estimation of depth information of two defocused images.
In this paper, the estimation results of defocus image of the video microscope are processed. The 3D point cloud data of the object surface is obtained by transformation. A series of methods are used to downsample the 3D point cloud data and filter and denoise to obtain the sparse and smooth point-cloud data conducive to surface fitting. The pre-processed 3D point cloud is fitted by the Delaunay triangulation method. The simulation results show that the reconstructed sample surface conforms to the surface profile information of the selected object.
Data
The image data used in this study are taken using a monocular microscope (with a magnification of 0.5 × (0.7–4.5), a lens radius of 35 mm, and an F-number of 4) with Basler industrial camera (acA640-120uc). All the experiments in this article were completed under the Windows 10 operating system. Using Bysler’s PylonViewer for image acquisition under the microscope and simulation through Matlab2016a, a small number of pre-processing steps were performed completed using Microsoft Visual Studio 2013 and OpenCV.
Point cloud data pre-processing and down-sampling
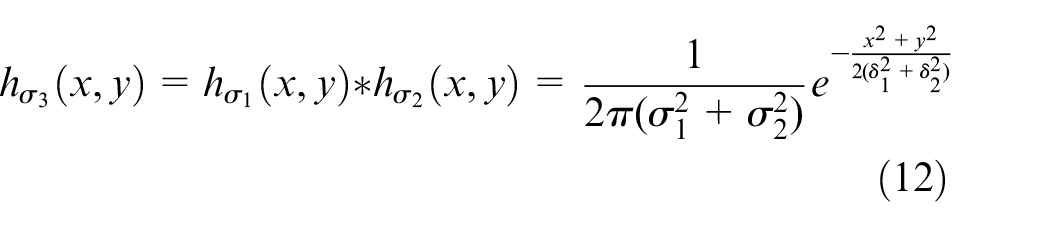
The point cloud data is generated using the depth estimation result. The corresponding plane positions of the image pixels are the X and Y value of the point, and the depth value is the Z value. Generate point cloud data through space coordinates to complete the three-dimensional reconstruction of the target object. Generally, point cloud data 30 is noisy, caused by camera calibration error, 31 matching error, and deviation in generating point cloud computing. All these noise points will cause deviation to the result. If not processed, the noise points will make the 3D reconstruction result challenging to estimate. For example, some non-existent peak values will be generated, significantly reducing the 3D reconstruction effect. Therefore, it is necessary to deal with the point cloud. Secondly, the number of points in the cloud will also affect the surface reconstruction. The ordinary depth map of 640 × 480 can cause insufficient computer memory and freeze during surface fitting. 7 In general, when using data, a lower sampling should be done to simplify the data so that the operation can be carried out normally and improve the operation efficiency.
There are many types of noise in point cloud data, and the noise structure is also different so that the filtering method will be different. General point cloud denoising methods include Gaussian filter, 31 median filter, 32 and mean filter. 33 By smoothing the noise, these abnormal points are no longer prominent, which affects the effect of 3D reconstruction. However, in the process of denoising, its smoothing processing cannot be 100% matched to the position of the noise point for processing. It is denoising for the whole image to have an impact on the non-noise point. In some cases, some of its features will be lost due to the denoising process. In the microscopic scene in this paper, the target object is distributed most of the time. The double-pass filtering method 34 is selected to filter the region’s abnormal point.
A two-dimensional grayscale image is used. Suppose the depth map is a
Where,
The downsampling of point-cloud data is generally simplified according to the appropriate sampling frequency, ensuring that most of its characteristics are not lost and ensures the smoothness of its operation process. Considering the smoothness of most observed objects in the micro scene, the lower sampling of point cloud was conducted on a grid-based selection method.
Method
Improved image fusion method based on sparse decomposition
Like other machine learning algorithms, the dictionary learning process in the sparse representation method is faced with computational complexity. When the image resolution is high or the number of images is large, the training time may be multiple or even dozens of times the sum of the other steps of image fusion, which affects the calculation speed of the algorithm. In order to improve this problem, we think of parallel computing, such as CUDA based on hardware and multi-scale fusion based on software. Among them, the multi-scale fusion algorithm based on transform is Discrete Wavelet Transform (DWT). The key is the selection of fusion rules. Different fusion rules should be selected for different decomposition levels. The most straightforward average rule is often used for low-frequency signals to ensure visual clarity. Inspired by this, we use the DWT algorithm to decompose the source image into a low and a high-frequency signal. The high-frequency component reflects the structural information. The sparse representation (SR) fusion rule is used to get the high-frequency fusion coefficient. The low-frequency component is divided into fixed-size blocks, and their sharpness indices are calculated. The block with the largest sharpness index is fused into the low-frequency coefficient. Finally, the fused image is obtained by inverse discrete wavelet transform (IDWT). This method uses the multithreading mechanism similar to a computer decomposing the high-frequency signal with a large amount of information in multi-scale. It fuses the sparse representation with less information according to each scale, which reduces the training dictionary time and image fusion time.
Here we use the DWT algorithm. In dictionary learning, each pair of images in the target image sequence is decomposed by the DWT algorithm, and then the components of each level are sparsely coded. Before sparse decomposition, the multi-scale decomposition of the image reduces the dimension of each scale coefficient and the amount of information, and the amount of iterative operation is significantly reduced. The component coefficient approximation between scales can be operated in parallel. The time spent in training dictionaries is effectively reduced under this kind of operation decomposition. Similarly, the time required for image fusion is also significantly reduced.
Modeling depth estimation method based on geometric constraints
We classified the problem as the Depth from Defocus problem. According to the difference between different focus planes and imaging positions, the fuzzy parameter difference model and spatial constraint are deduced. Then the relationship between depth information and fuzzy information is established by using the model, and the complete spatial information of the target object is estimated by iteration.
Geometric derivation of the depth estimation model
The geometric principle of actual aperture imaging is shown in Figure 1. There are three position relations between the focal plane and the imaging plane:
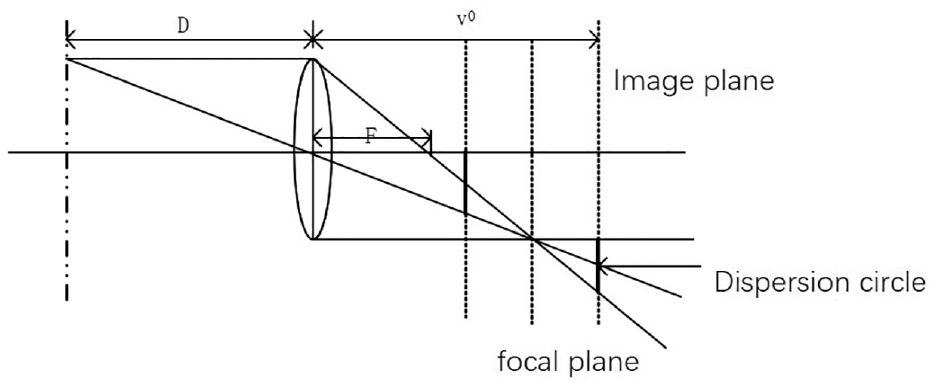
The geometric structure of aperture imaging.
When
When
When
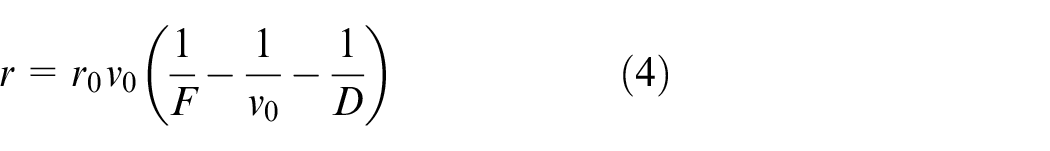
From (3) and (4), the radius of the dispersion circle, namely the fuzzy degree evaluation parameter, can be expressed as
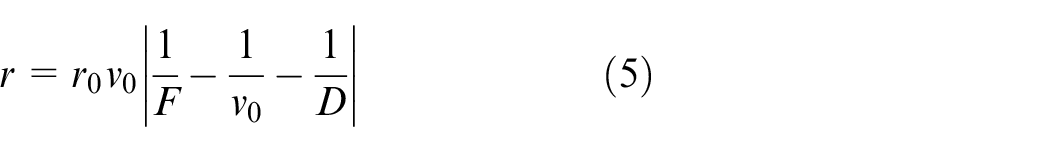
Since the radius of the dispersion circle has a specific relationship with the camera, in consideration of this point, let
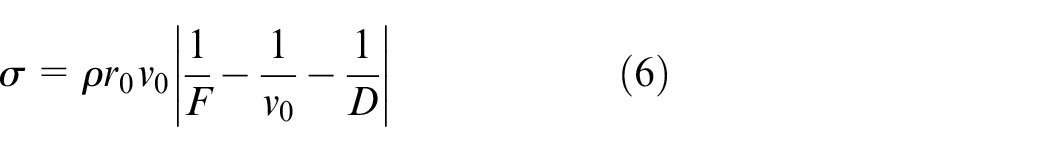
Where the relevant parameters of the camera are set as u, and the function is denoted by
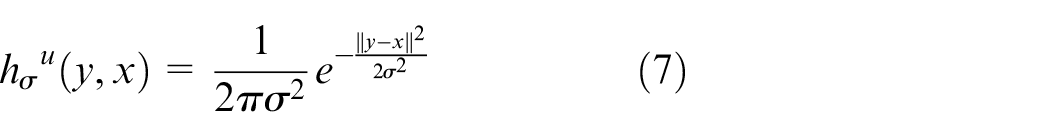
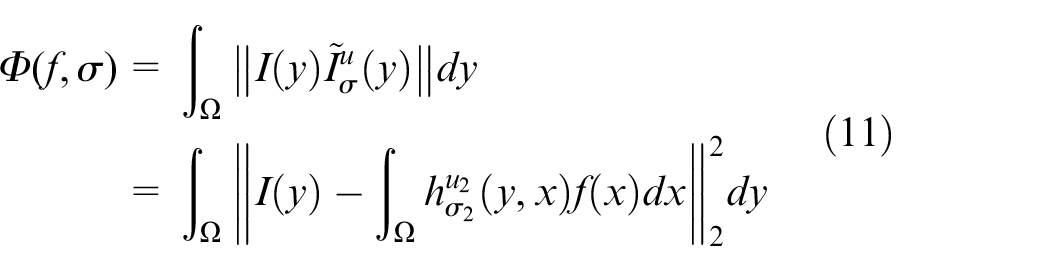
Firstly, the two defocused images were studied, and the generated defocused images
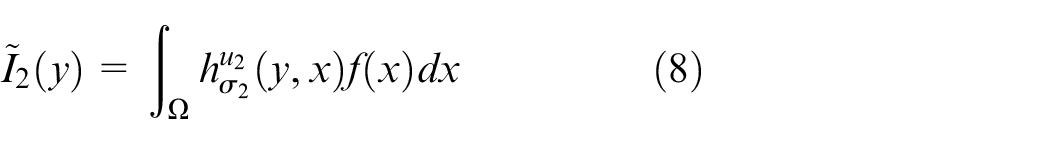
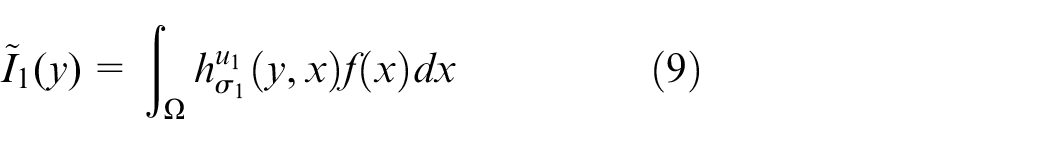
Where u1 and u2 represent the parameters of the camera during shooting the image
Given the different blur degrees of the two images at different positions, the following difference function is used to simulate:

The approximation method adopts the least square method:
Set two PSF functions as
The parameters
The height of the observed object is different in different positions, which results in different degrees of blur in each region of the two images. It can be expressed as
In
Where,
In
Where,
Construct the functional extremum function as:
Similarly, the least square method is also used to simulate:
Establish the relationship between
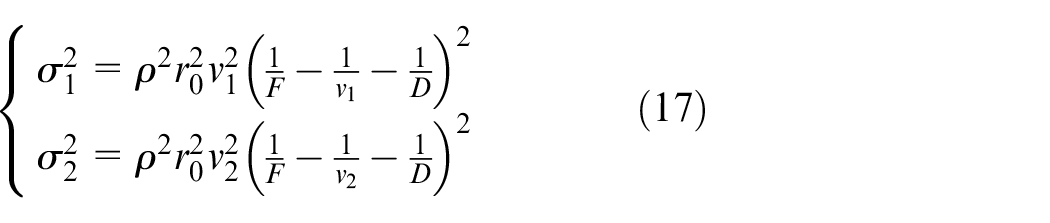
After the operation, we can get:
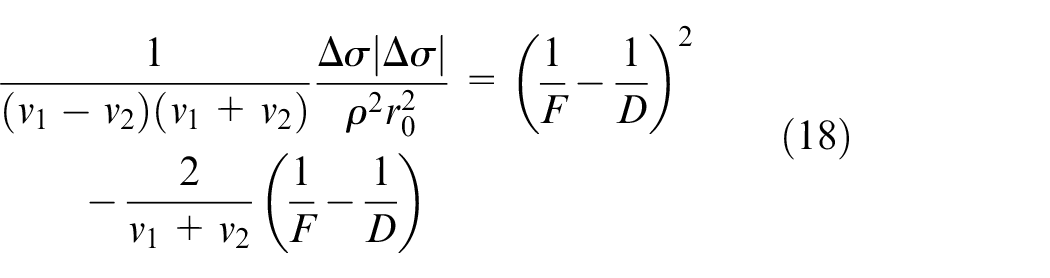
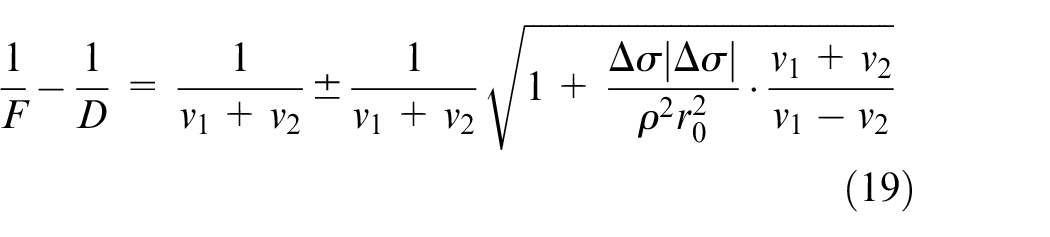
Finally, the mapping between
As for the position relationship between the focal plane and the imaging plane of the image taken by the camera, according to the actual aperture imaging principle, the four positions are as follows:
When
We obtain that
Similarly, when
Similarly, when
When
As can be seen from the above,
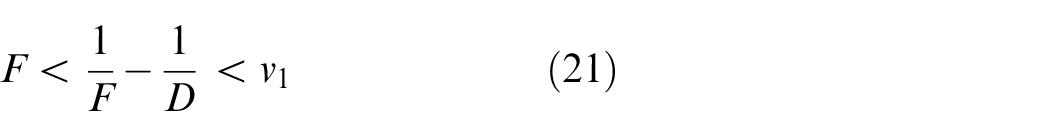
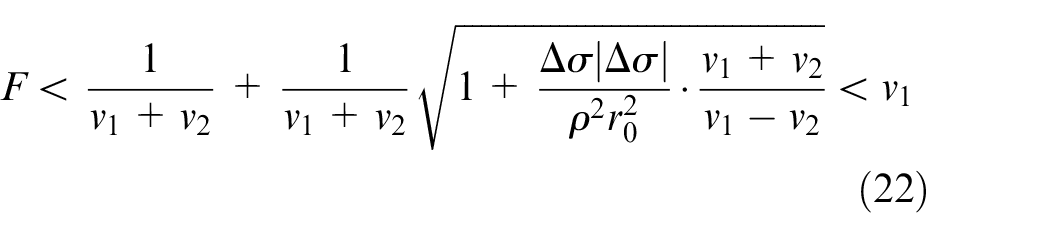
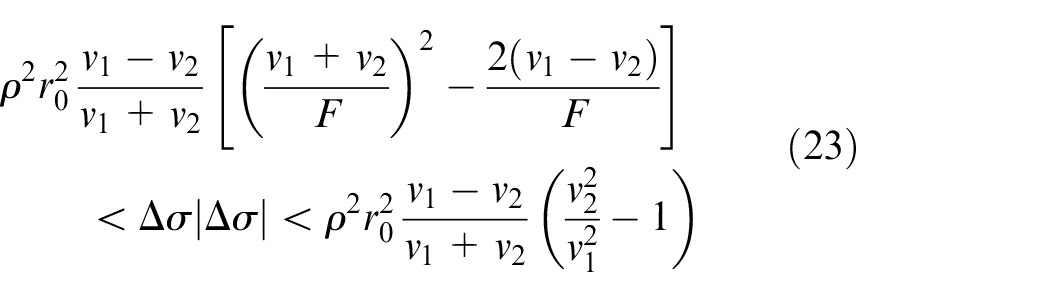
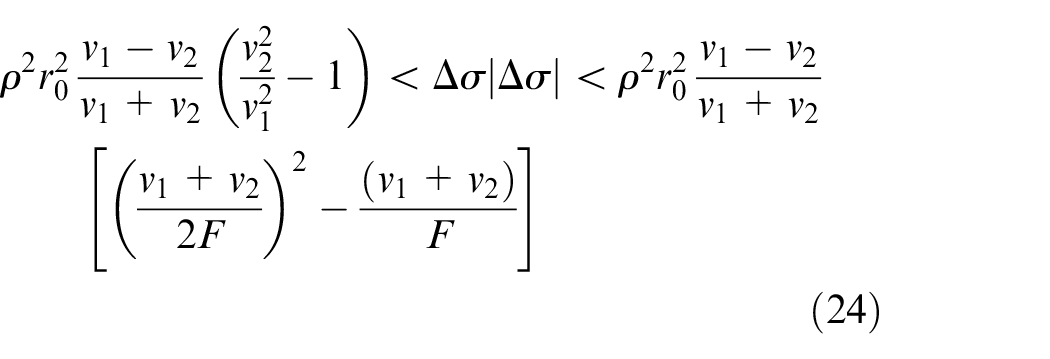
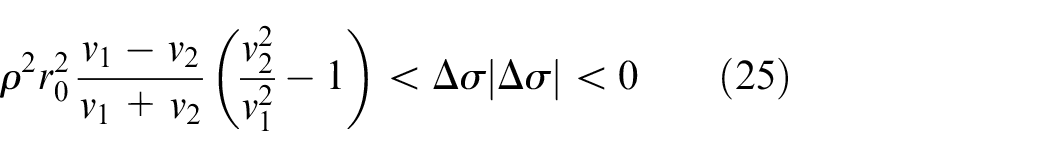
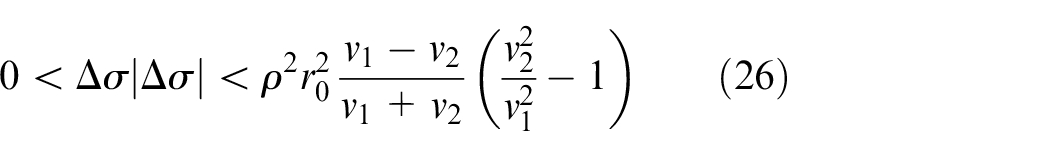
As can be seen from Figure 1, all observed defocused images are satisfied
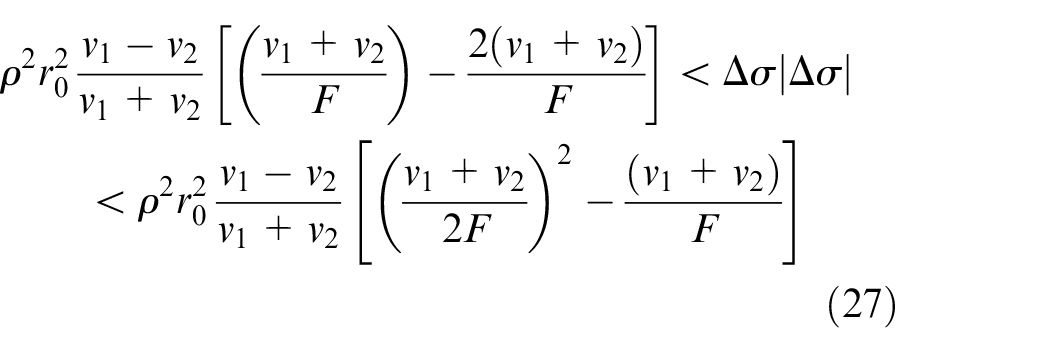
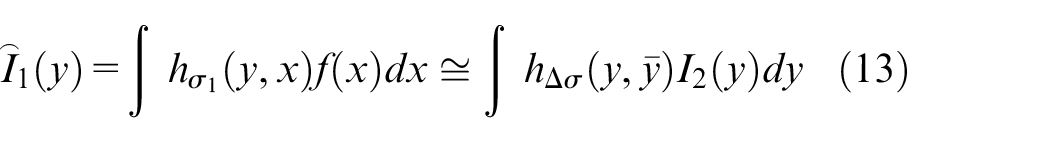
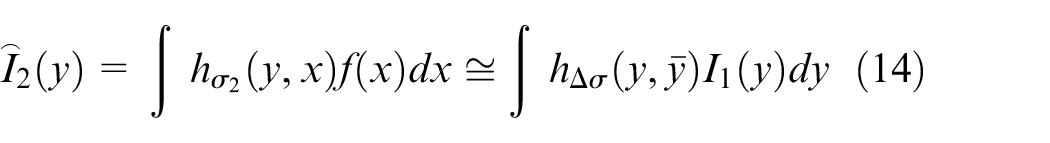
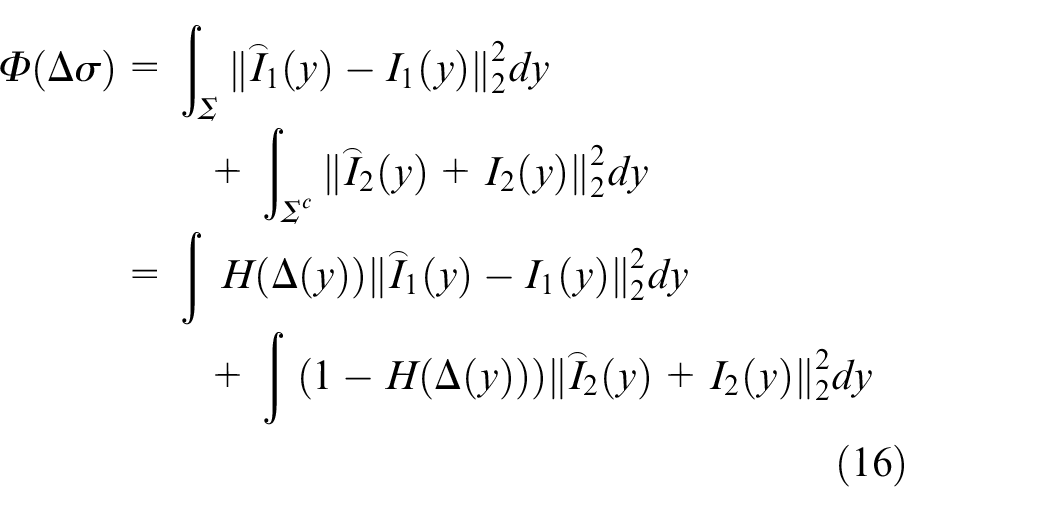
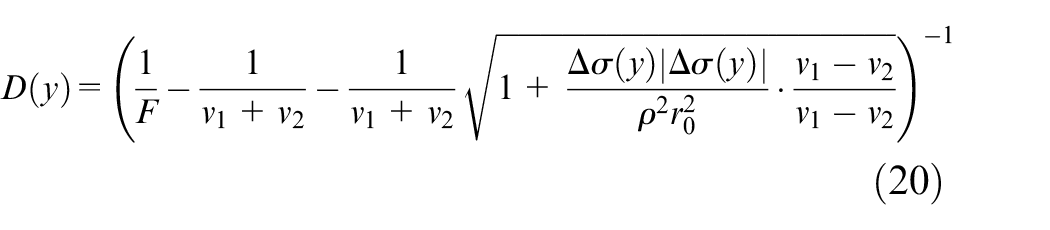
From equations (3) and (19), we obtain the optimization problem’s objective function and constraints, respectively.
The depth estimation model is as follows:
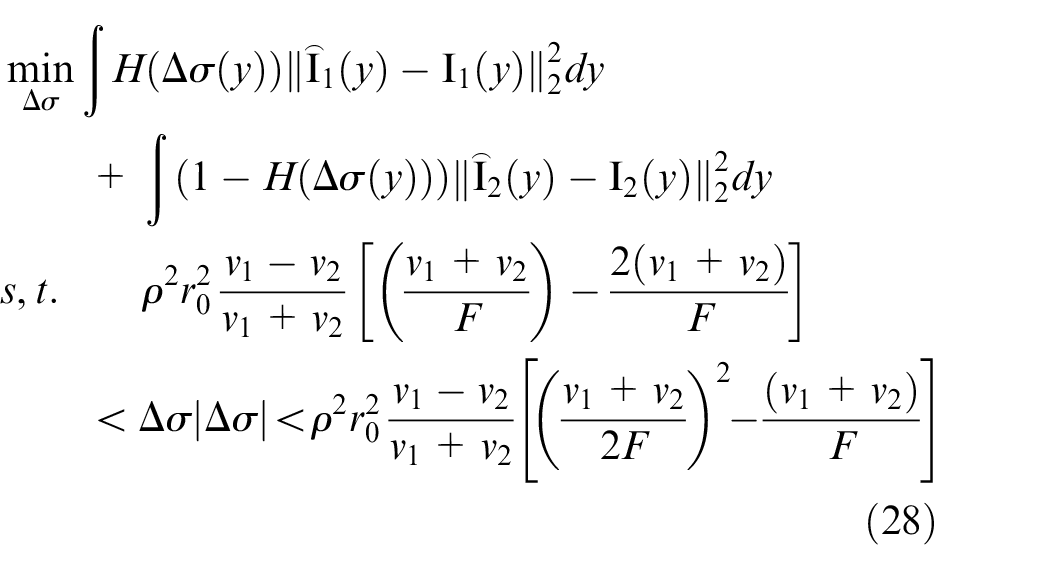
An improved depth estimation algorithm for defocused images
The basic steps of the method are as follows:
By four classes mentioned in the previous section imaging geometry relationship, for the acquisition of two defocused images of camera parameters to determine
The interval
For the
For the left and right points of
The depth information is estimated according to equation (28).
The purpose is to determine the relatively accurate 3D model of the target object by using the depth estimation of multiple defocused images shot by an electronic video microscope. Therefore, in this section, an estimation model is designed to estimate depth information using the multi-frame defocus image model. The steps are as follows:
(1) The sequence of collected images is numbered as
(2) For the estimated results
Surface reconstruction
The surface reconstruction process subdivides the pre-processed point cloud data into surface segments and uses smaller elements to fit. Similar to cyclotomy, a smooth circle is fitted with polygons, and its edge length is small, and the number is large. When the number is large to a certain extent, it can fit the smoother circle observed by human eyes. The surface of point cloud data is also fitted with similar elements. When the segmentation is fine enough, and there are enough elements, the object’s surface can be fitted to the real object surface observed by human eyes. Because of triangles’ particularity, three points can determine a surface, and the point cloud can be transformed into a surface by using the triangle joint of three-dimensional coordinates.
There are two kinds of triangulation for 3D point cloud data: the indirect and direct methods. The projection method uses triangulation and its plane projection. In mapping to 3D coordinates, the rationality of this method lies in the method of surface reconstruction. From plane to the surface, the triangle connection relationship remains unchanged, that is, the one-to-one correspondence relationship. However, the triangulation of the 2D point cloud is much less complex than the 3D triangulation algorithm. The direct method is to triangulate the data of the 3D point cloud directly. Due to various constraints, the algorithm is complex, but the effect is better than the projection method. Because of the application scene of this paper, most of the target objects do not have too many jumping changes. The plane projection method is selected for fitting, and the direct method is used for a few scenes with more jumping points.
The Delaunay triangulation method used in this paper is introduced below. The principles of Delaunay triangulation are as follows: any four points cannot be con-circular, maximized minimum angle, disjoint of sides, and triangular plane principle. The four-point non-coplanar principle guarantees the uniqueness of the partition. There are and only three points in one plane among the four points. The minimum angle maximization principle ensures that the shape of the triangle is not too long and thin, which will result in the poor surface fitting. All formed faces must be triangular. As shown in Figure 2, there are no other points outside the peripheral circle as for triangle in the Delaunay triangle network. As shown in Figure 3, in the convex quadrilateral formed by adjacent triangles, the small angles of the six inner angles no longer increase after the diagonal lines are interchanged.
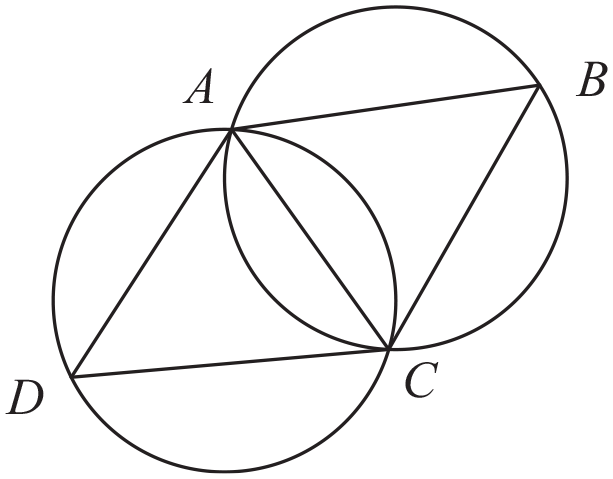
Schematic diagram of Delaunay triangulation criteria.
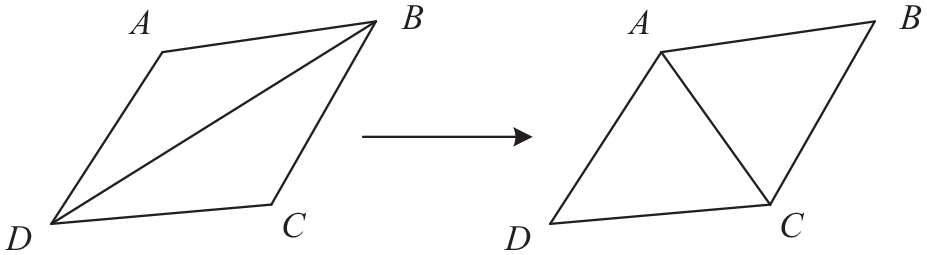
Maximum and minimum angle characteristics of Delaunay triangulation.
The Delaunay method often uses the incremental and the Divide and conquer algorithms. The former, also known as the point-by-point insertion method, initialize a relatively small triangulation region and increases points successively according to the dividing principle until all points are added. The algorithm has low complexity, low memory consumption, and poor timeliness. The latter will divide the point set into two subsets each time to achieve recursive triangulation, which consumes more memory but has better timeliness. By referring to the previous methods and combining the advantages of the two methods, the point set is firstly divided into piles until the elements in the set are less than the set value. Then the triangular mesh is segmented by the point-by-point insertion method. The steps are as follows:
Two-dimension point set is divided into two piles. If the number of elements is less than the set value, the process of loop (2)–(3) is carried out until the set number are satisfied so that step (5) can execute;
Adding new points in subsets (Figure 4), respectively;
Merge the subsets according to the convex hull bottom line and the top line of two subsets;
According to the results got from (3), perform steps (6);
Perform triangulation with the incremental algorithm to obtain the segmentation results;
The final triangulation results were obtained.
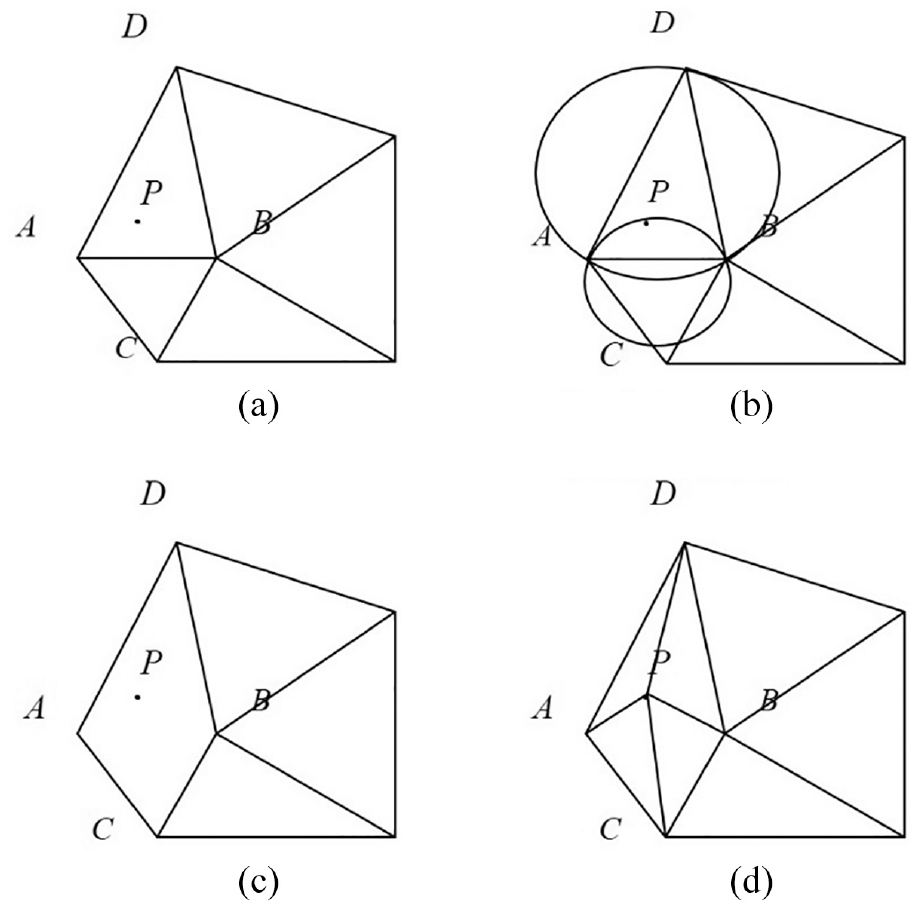
Schematic diagram of node addition method in Step (2): (a) new note P, (b) decide how to connect P and other nodes, (c) remove side AB, and (d) form a triangle.
Experiments and results
Gradient testing experiment and result
The testing experiment for the proposed Geometric derivation depth estimation model using the Gradient dataset (
Defocusing image sequence with an even drop of depth.
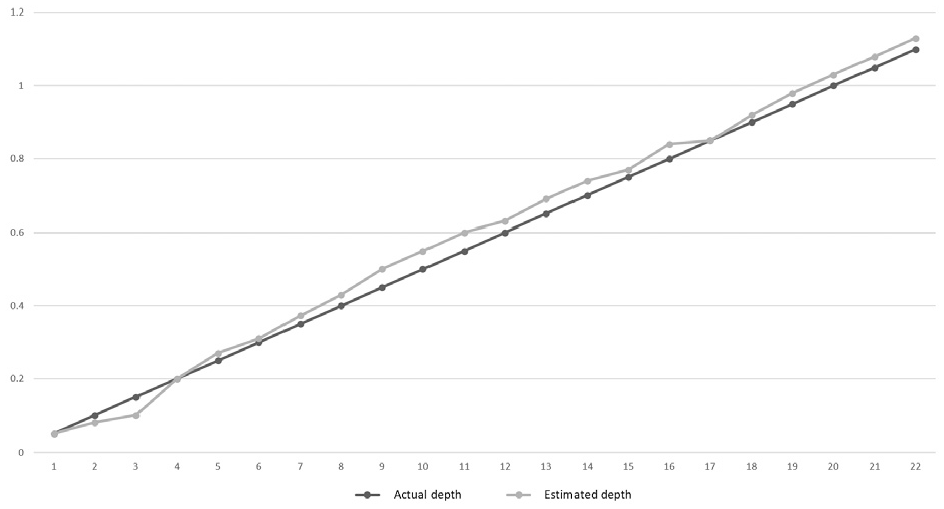
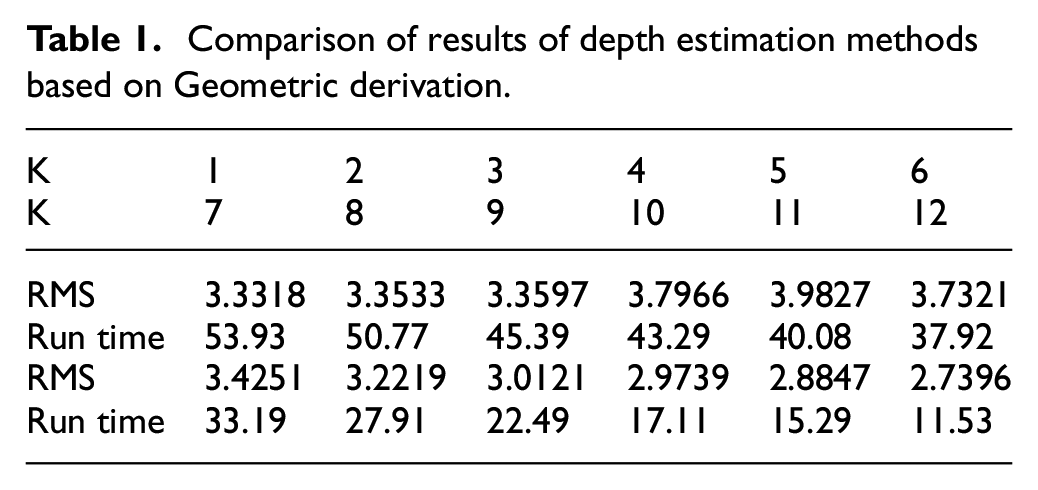
The depth estimation graph of the paper image is shown in Figure 6. The comparison between the actual depth and the estimated depth is shown in Figure 7. The run time and RMS results of the testing experiment with different K values (number of image sequence) are shown in Table 1.
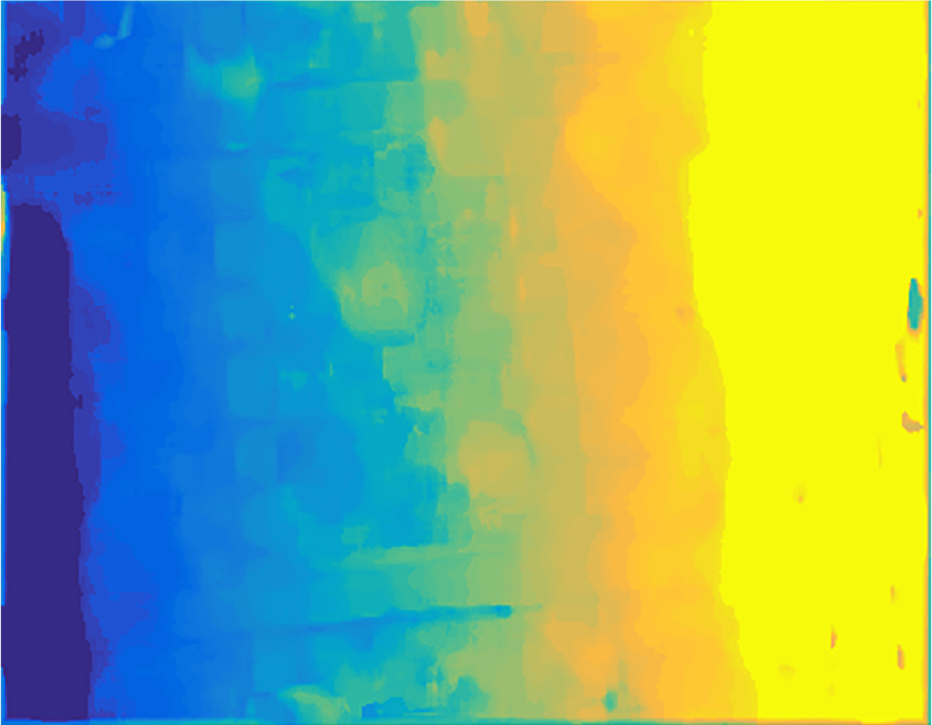
Depth estimation result of the paper dataset.
Geometric derivation method depth estimation quantitative comparison.
Comparison of results of depth estimation methods based on Geometric derivation.
Surface reconstruction
Appropriate sequence defocused images and appropriate regions were selected for image registration, denoising, and other pre-processing. Here, image sequence
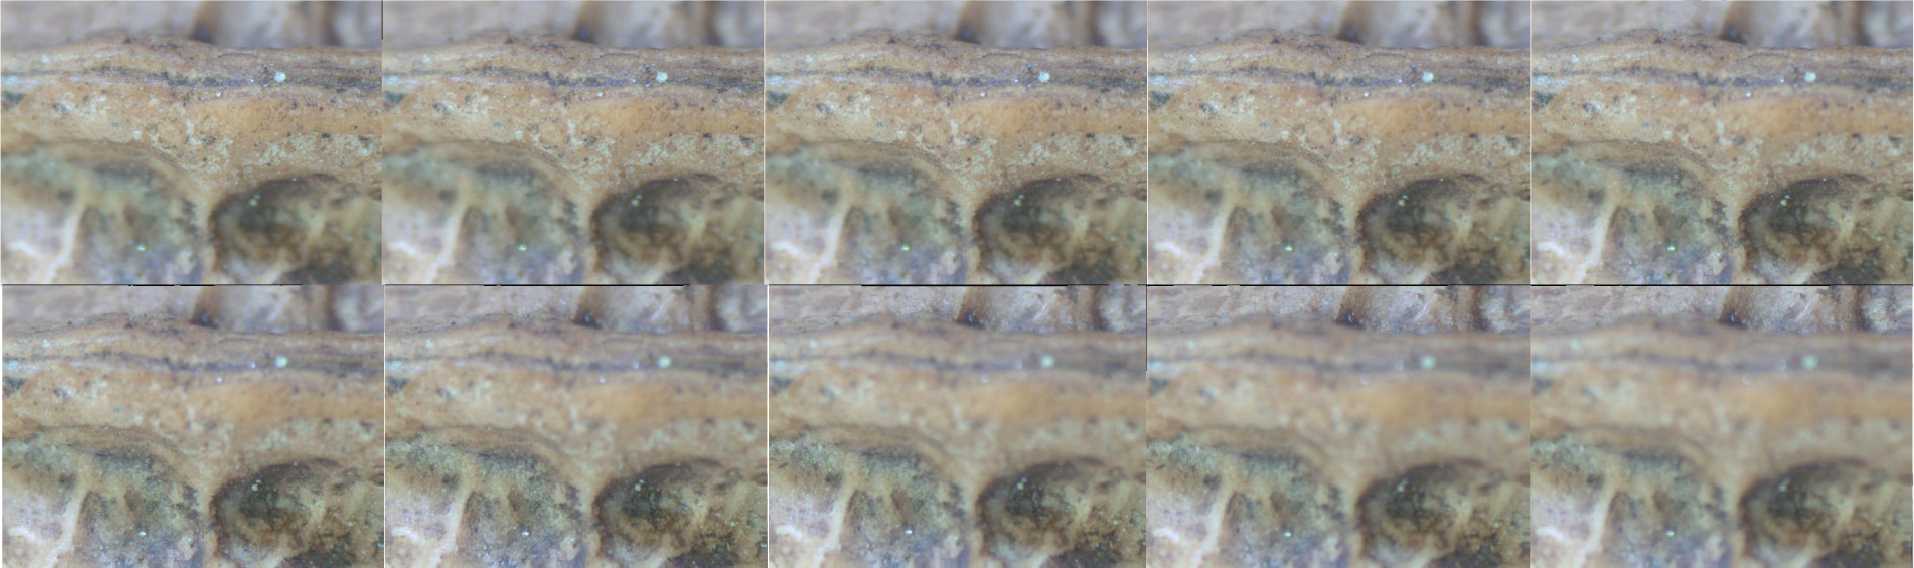
Defocusing image sequence after pre-processing with registration.
The depth estimation of the defocused image has good operation efficiency. The depth map of the corresponding full focus image is estimated, as shown in Figure 9.
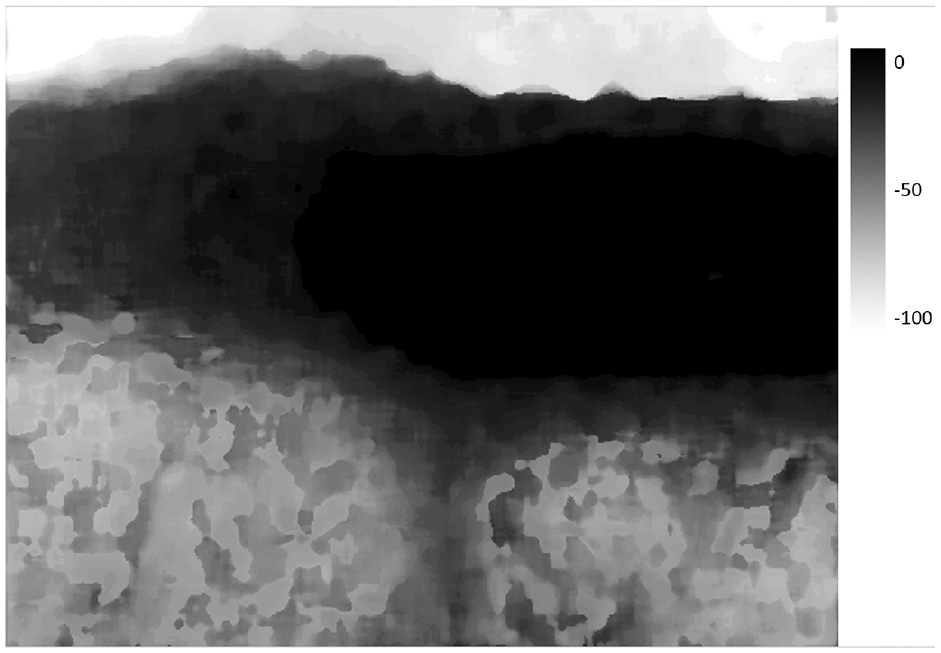
Defocusing image depth estimation results.
According to the pre-processing method of point cloud data described, the three-dimensional point cloud is obtained after depth information processing. The distribution of the point cloud is shown in Figure 10.
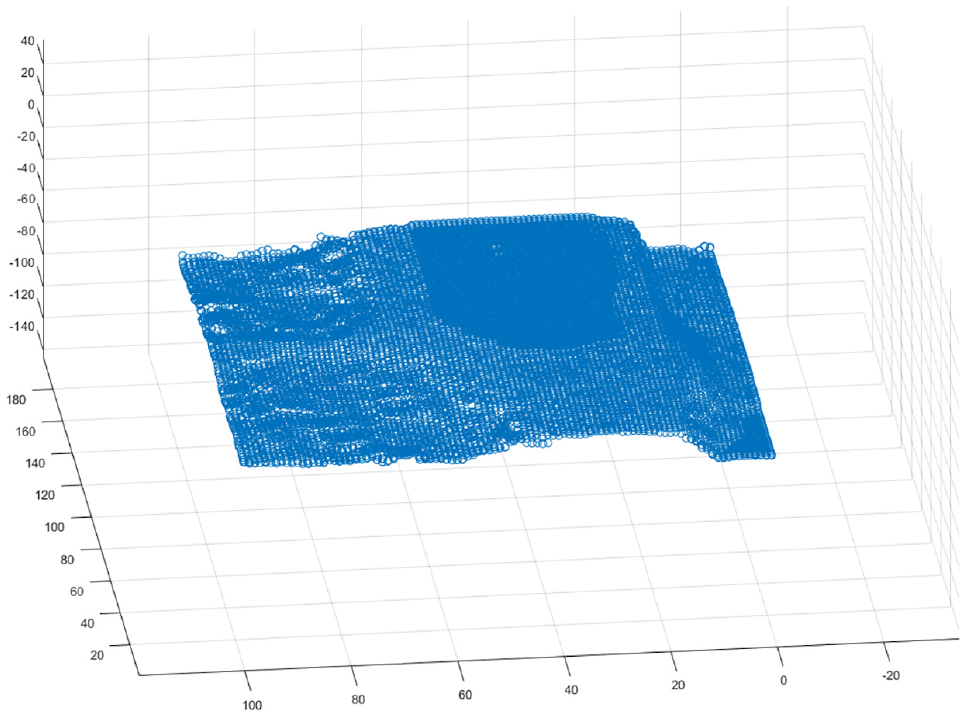
Three-dimensional point cloud generated by depth information.
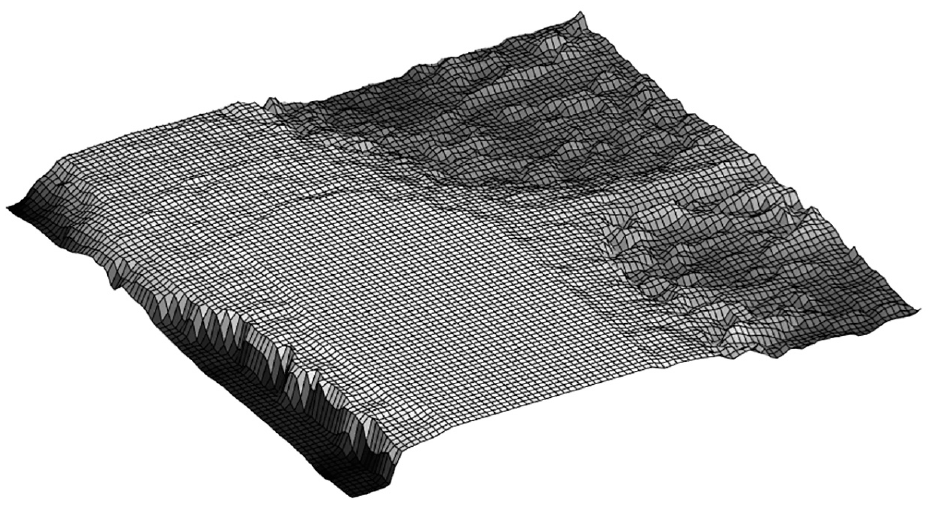
3D reconstruction results of all perspectives are shown in Figures 11 to 13.
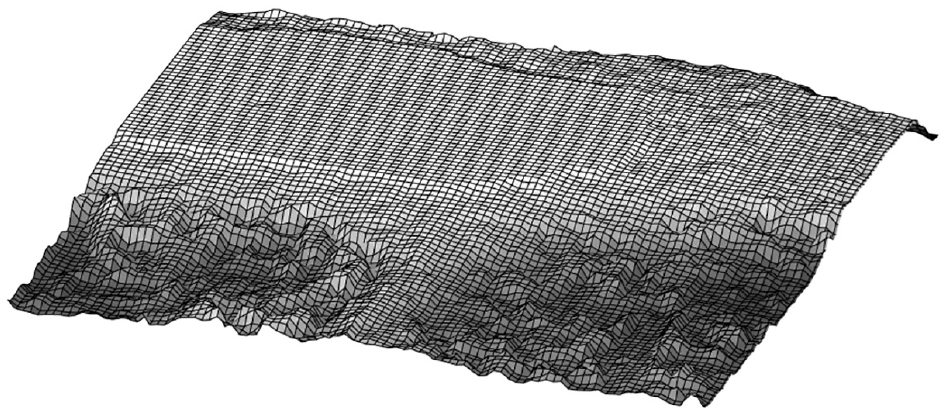
3D reconstruction results from perspective 1.
3D reconstruction results from perspective 2.
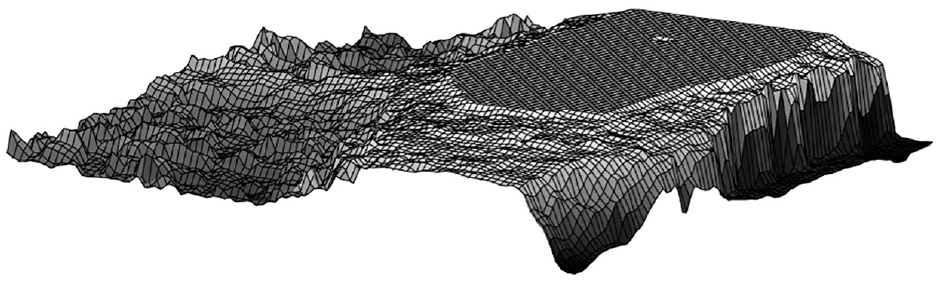
3D reconstruction results from perspective 3.
Discussion
The results of 3D reconstruction are consistent with the original object surface. However, the top is partially flat. Through several experiments, the integrity of the defocused image sequence is not enough. It must be in the focus plane at least once during the shooting from the highest point to the lowest point of an object’s surface. Moreover, shown in Figure 13 above, it happens when taking the objects by manual. The dispersion circle has a radius for the human eye to identify the minimum range.
Furthermore, part for the human eye to see may not be a clear regional limit. The focusing plane did not start from the highest point on the surface of the object. So, in the process of collecting images, we improve the acquisition method. We began to collect from the peak area of fuzzy, focus to gradually evident, and then gradually blurred, to the lowest point is clear, and then blur to the lowest. Except at the top of the other area, the curved surface fits in line with the original walnut surface. The recovery of the texture on the surface is more accurate. If the computer operation ability allows, do not downsample for 3D point clouds, the finer surface subdivision will be obtained. Theoretically, we can fit better surface and apply it to the medical and industrial fields.
Conclusion
The improved image fusion method based on sparse decomposition solves the long training time of dictionary training and sparse approximation. In the specific application, we can obtain accurate texture information considerably. This paper mainly introduces the process of 3D reconstruction through 3D point clouds in microscopic scenes. Firstly, the depth map is used to calculate the corresponding three-dimensional point cloud. Secondly, the point cloud data is pre-processed, such as removing noise and distortion points through corresponding filtering, and the point cloud is smoothed. Thirdly, the processed 3D point clouds are sampled to reduce the computational burden of surface reconstruction. For the pre-processed 3D point cloud data, a Delaunay triangulation method based on the plane projection and synthesis algorithm was used to triangulate the 3D point cloud data. Finally, the 3D reconstruction of the micro scene was realized. The experimental results show that the reconstructed surface conforms to the surface contour information of the selected object.
However, in the process of 3D reconstruction, it is found that some groups of data are not suitable for micro 3D reconstruction, such as reflection and occlusion, in the later stage, we can thoroughly study which conditions are unsuitable for micro 3D reconstruction and make some implementation strategies and experimental verification for this situation.
Footnotes
Acknowledgements
The authors express their sincere appreciation and profound gratitude to research assistant Botao Ma, Peng Wu, and Xuan Zhang, for their helping and supporting on collection and sorting of the data.
Declaration of conflicting interests
The author(s) declared no potential conflicts of interest with respect to the research, authorship, and/or publication of this article.
Funding
The author(s) disclosed receipt of the following financial support for the research, authorship, and/or publication of this article: This work was supported by the Sichuan Science and Technology Program (2021YFQ0003, 2019YJ0189).