
Abstract
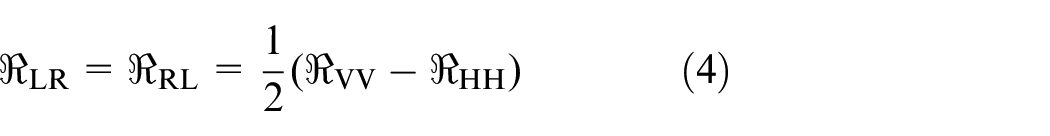
The feasibility of Antarctic sea ice detection based on shipborne global positioning system reflectometry (GPS-R) technology is shown in this paper. Because the permittivity of sea water is much higher than that of sea ice, the reflected left-handed circular polarized (LHCP) GPS signal (RL) reflection coefficient of sea water is markedly higher than that of sea ice. The polarization ratio of RL to the direct right-handed circular polarized (RHCP) GPS signal (DR) is used to distinguish between sea water and sea ice in this paper. The experiment was performed on the ship “XueLong” for approximately 9 days from December 2014 to January 2015 during the 31st Chinese National Antarctic Research Expedition (CHINARE 31). The sea ice concentration data with a 25 km × 25 km spatial resolution derived from the National Snow and Ice Data Center (NSIDC) are used for validation and some pictures of sea ice taken from “XueLong” are shown for comparison. The polarization ratios (RL/DR) are calculated, and the correlation coefficient between the polarization ratios (RL/DR) and the sea ice concentrations is −0.66.
Introduction
Antarctic ice sheets and sea ice, as cold sources within the global climate system, have important roles in driving the climate system and are considered to be important indicators of the global climate.1,2 Furthermore, polar research is often conducted aboard icebreaker ships, and real-time sea ice monitoring is an important part of cyber-physical systems 3 for navigation safety in polar regions.
Traditional sea ice detection methods are mainly based on optical remote sensing or microwave remote sensing. Optical remote sensing usually uses low-resolution optical sensors 4 and is easily affected by clouds, fog, and rain. Microwave remote sensing can work in all weather conditions; however, satellites with high spatial resolution for ice detection are very expensive. 5 Economic and effective new sensors 6 are needed for remote sensing. In recent years, the signals of global navigation satellite systems (GNSS) reflected from the Earth’s surface have shown the potential to provide information about the surface properties through signal inversion; this technology is named GNSS reflectometry (GNSS-R) and was first proposed by Martin-Neira. 7 It is a low-cost passive remote sensing technology and can work in all weather conditions. All GNSS satellites can serve as signal sources, giving GNSS-R technology global coverage. Although it is difficult to obtain signals from the same satellite for a long time, signals from different satellites can be used to obtain satisfactory temporal resolution. Thus, new global positioning system reflectometry (GPS-R) technology has become a powerful tool to detect sea ice because of its global coverage, all-weather availability, and low cost.
Komjathy et al. 8 first showed the new potential application of GPS-R for GPS remote sensing in 2000; referring to sea ice remote sensing applications, this study indicated that GPS-R technology could provide useful information regarding sea ice conditions. For airborne and spaceborne platforms, Wiehl et al. 9 performed simulations of the measurements that Gleason et al. 10 made with observations by the United Kingdom Disaster Monitoring Constellation (UKDMC) satellites, indicating the potential use of GPS-R. Rivas et al. 11 derived an analysis of reflected GPS waveforms to obtain the permittivity and roughness of different types of sea ice. For coastal receiving platforms, Fabra and Cardellach et al.12–15 used GPS-R to detect the changes in sea ice in two polarizations, Yun et al. 16 proved that the new reflected power ratio model can distinguish between sea ice and sea water, Gao et al. 17 retrieved sea ice thickness based on the ratio of the power of the reflected signal to the power of the direct signal and an empirical model of the sea ice thickness, and Zhang et al. 18 attained sea ice thickness based on the interferometric phase of the signal-to-noise ratio collected from GPS. Rius et al. 19 and Li et al. 20 processed the first spaceborne phase altimetry results of sea ice over Hudson Bay using TechDemoSat-1 GNSS-R, and many methods have been proposed for sea ice detection,21–24 and classification 25 based on TechDemoSat-1 data. 26 Seemling et al. 27 inverted the sea ice concentration from power ratios using a non-linear least-squares algorithm in Fram Strait, a 20% resolution in concentration and 3-h resolution in time were obtained and the Pearson correlations were 0.75 and 0.67 for cross- and cross-to-co-polar data, respectively.
Most of the above studies have successfully demonstrated the ability to detect sea ice using both coastal and spaceborne GPS-R. Though wind speed,28,29 precipitable water vapor, 30 height retrieve, 31 and oil spill detection 32 have been studied using shipborne GNSS-R setup, few studies on sea ice detection have been performed regarding shipborne GPS-R. 27 Compared with coastal setups, shipborne GPS-R setups can detect sea ice over a wider range; compared with spaceborne setups, shipborne GPS-R setups can acquire higher spatial resolution. Because of the relatively fixed routes of ships, periodic changes in sea ice status (sea ice concentration, sea ice thickness, etc.) in different regions can be determined, which is important for polar science. Furthermore, shipborne GPS-R setups can also detect sea ice conditions around the ships in real time, which is important for navigation safety.
This paper focuses on the feasibility of sea ice detection around Antarctica using shipborne GPS-R technology, which is important both for sea ice science and sailing safety. This was the first Antarctic shipborne GPS-R experiment to set up the GPS-R receiver on the Chinese polar research ship “XueLong,” and the GPS-R signal around Antarctica was received for approximately 9 days from December 2014 to January 2015. The polarization ratio method 16 is used to distinguish between sea ice and sea water because of its simplicity and efficiency. The results are compared with the measured sea ice concentrations, and the correlation coefficient between the polarization ratios and sea ice concentrations is approximately −0.66. This method can also be applied to sea ice concentration measurements in different Antarctic regions. The roughness of the sea surface is also discussed.
Materials and methods
Antarctic shipborne experiment
The experiment was performed during the 31st Chinese National Antarctic Research Expedition (CHINARE 31) onboard “XueLong,” which is 13.5 m high. The receiving antennas are mounted on the port side of the ship. One antenna receives the direct right-handed circular polarization (RHCP) of the GPS signals (DR), which are the signals directly broadcast from the GPS satellites; two reflector antennas, which are a left-handed circular polarization (LHCP) of the reflected GPS signal (RL) antenna and an RHCP of the reflected GPS signal (RR) antenna, are set to face outward (tilted at approximately 45°) to receive the signal reflected from the specular reflection point. The distance between the receiving antennas and the deck is 4 m. Figure 1 shows the location of the receiver on “XueLong” as well as a schematic diagram of the signal reception. The experimental data span approximately 9 days and consist of three segments: December 12–15 and 23–25 in 2014 and January 29–30 in 2015.
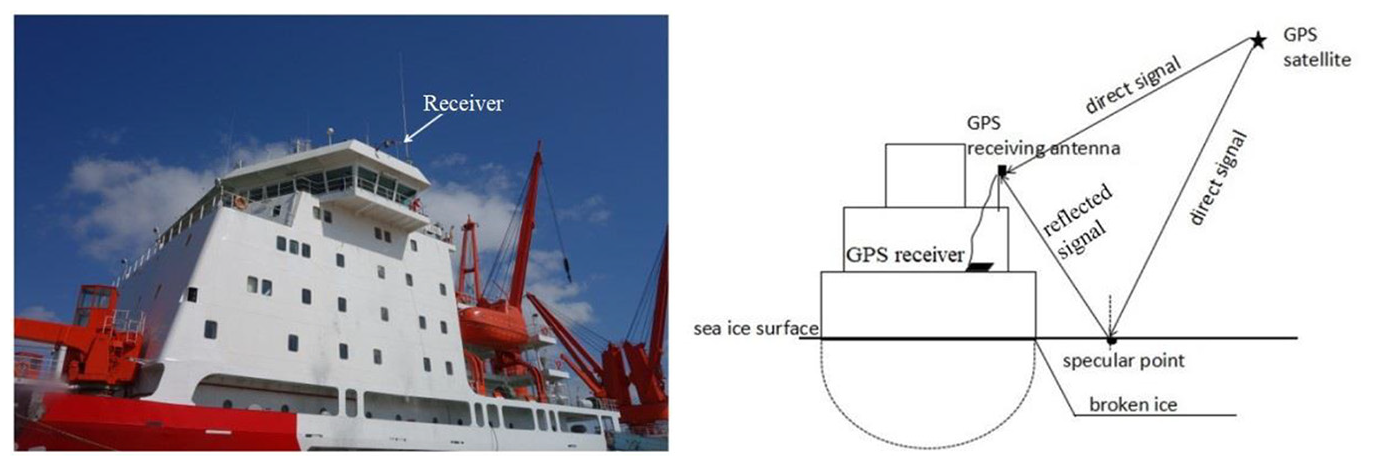
Picture showing the location of the receiver (left) and schematic diagram of the signal reception (right).
To improve the signal intensity, the gain of the direct signal receiving antenna is 3 dB, and the gain of the reflection signal receivers is 12 dB. The sampling frequency is 16.369 MHz. Figure 2 shows the antenna pattern of the LHCP reflection antenna. Figure 3 shows the software receiver used here.
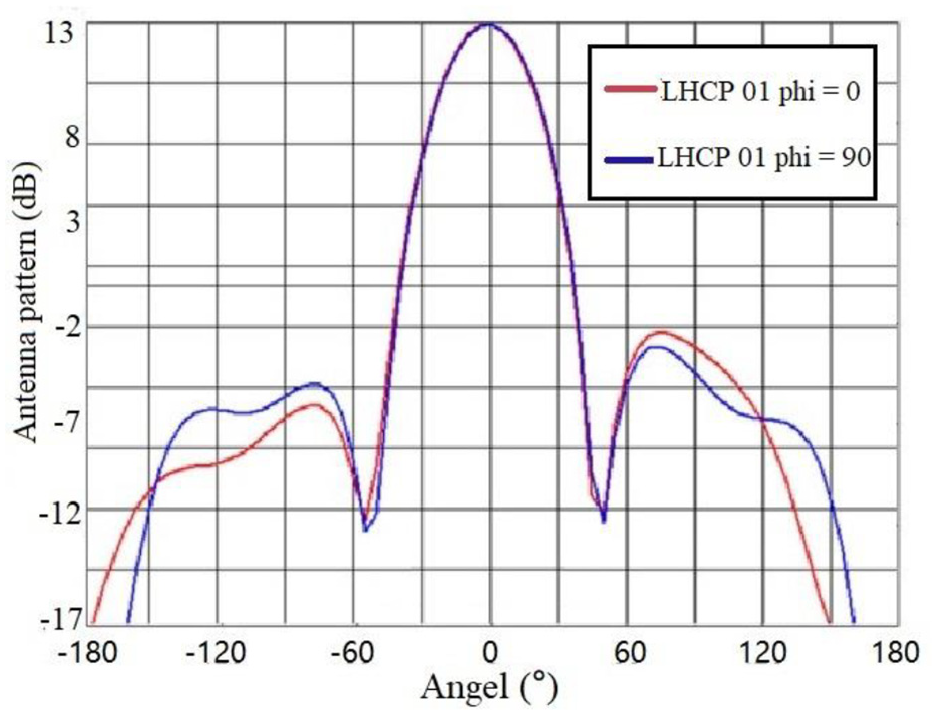
Antenna pattern of the LHCP reflection antenna.
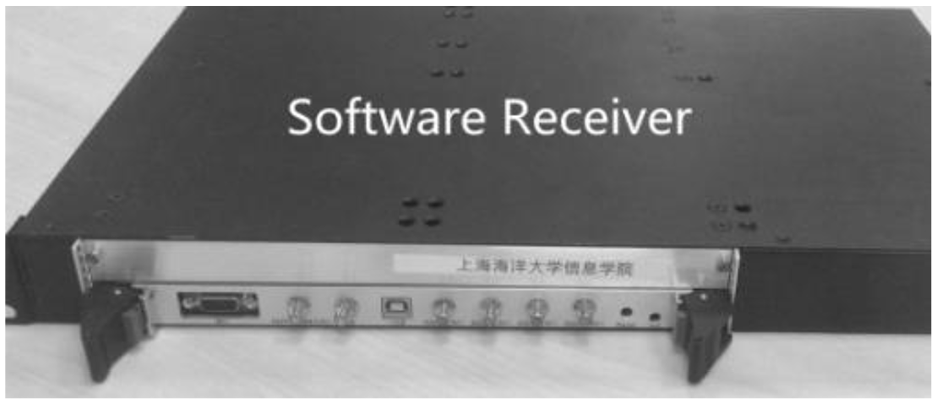
The software receiver used in the experiment.
The basic flow chart of sea ice inversion from the satellite data is shown in Figure 4. The DR antenna and the RL antenna collect the DR and RL signals, respectively. The direct and reflected signals are both input into the two RF front-ends after being received. After sampling, processing and digitization, the original digital intermediate frequency signal of the direct reflection is obtained. Coherent and incoherent integration of the direct and reflected signals is performed to reduce the system’s error. As the receiver is mounted on “XueLong,” the position of the receiver varies with the movement of the ship. Therefore, the time, latitude and longitude of the position are updated first, and then the satellites are judged and selected according to the elevation, azimuth angle, and orientation of the antenna. Finally, the satellite signal is quickly captured and tracked, and the reflected signal is processed.
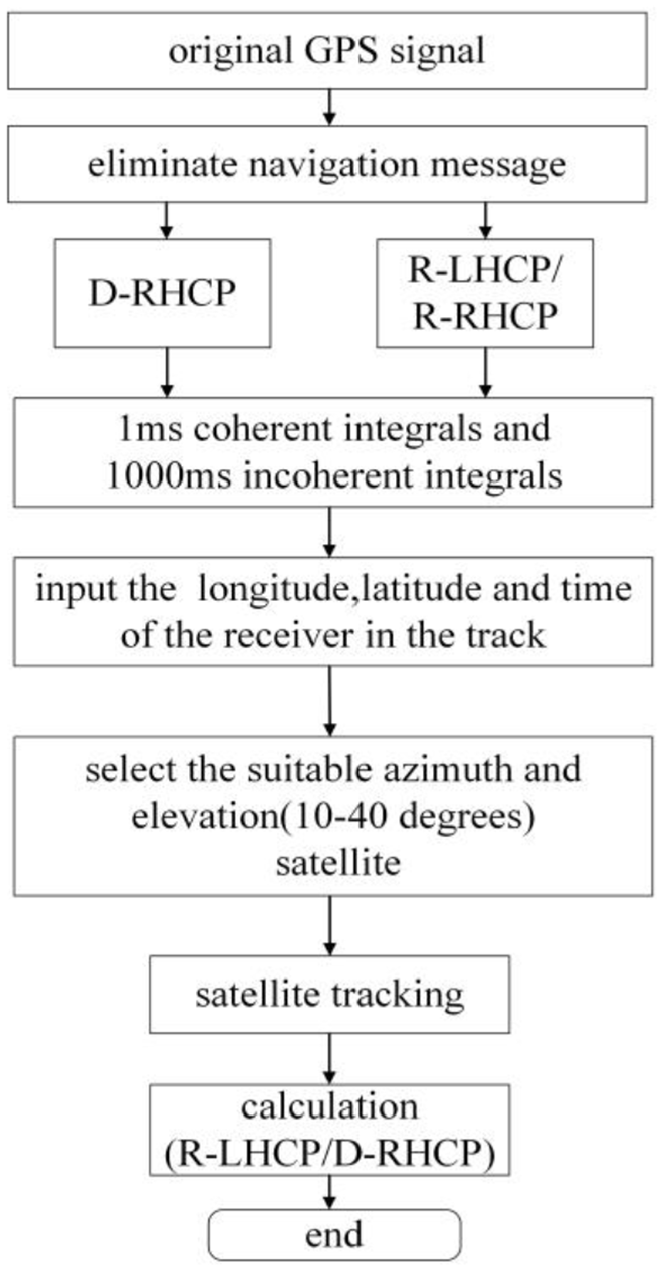
The flow chart of shipborne GPS-R data processing.
To avoid the multipath effect caused by the ship, the specular point should be far from the ship, and thus, small elevation angles (10°–40°) were used here. In this range of elevation angles, the polarization ratio (RL/DR) can be used to distinguish between sea water and sea ice. 16
Data analysis
As the ship moves over time, the position of the GPS-R antennas also changes. In this experiment, we estimate the elevation and azimuth between the satellites and the receiver in real time to select suitable GPS satellites whose elevation angle ranges from 10° to 40°, and the azimuth range is adjusted due to ship movement. The experimental data were collected from December 12, 2014, to January 30, 2015 (UTC+8). During an approximately 9-day period, we collected a set of data every 60 min.
Sea ice concentrations were derived from the National Snow and Ice Data Center (NSIDC). The dataset is generated from brightness temperature spectral data and is intended to provide a consistent time series of sea ice concentrations spanning the coverage range of multiple passive microwave instruments. 33 Data are provided in the form of polar coordinate stereoscopic projections, with grid sizes of 25 km × 25 km and a time interval of 1 day. The binary format files provided by the dataset were converted into 25 km × 25 km grid data according to the data instructions provided on the NSIDC website, and the grids corresponding to the mirror reflection points were found to determine the sea ice concentration. The data have values of 0–250 in each grid and were divided by 250 to obtain sea ice concentrations in the range of 0–1, which are used as a control to validate our estimated results. The ship’s latitude and longitude are taken every hour to calculate the specular reflection point, and the corresponding sea ice concentration data are also collected every hour.
Satellite selection
First, we choose 00:00, December 14, 2014 (UTC +8), as an example to illustrate the satellite selection method. According to the ship navigation data and the satellite ephemeris, the data sets of each satellite were calculated.
Figure 5 shows the skyplot at 0:00 on December 14, 2014 (UTC+8). In accordance with the elevation angle and the azimuth, we chose satellites PRN14, PRN22, and PRN24 (shown as G14, G22, and G24 in Figure 6). Figure 6 shows the relative specular reflection points. The red pins represent the position of the receiver, and the yellow pins represent the specular reflection points.
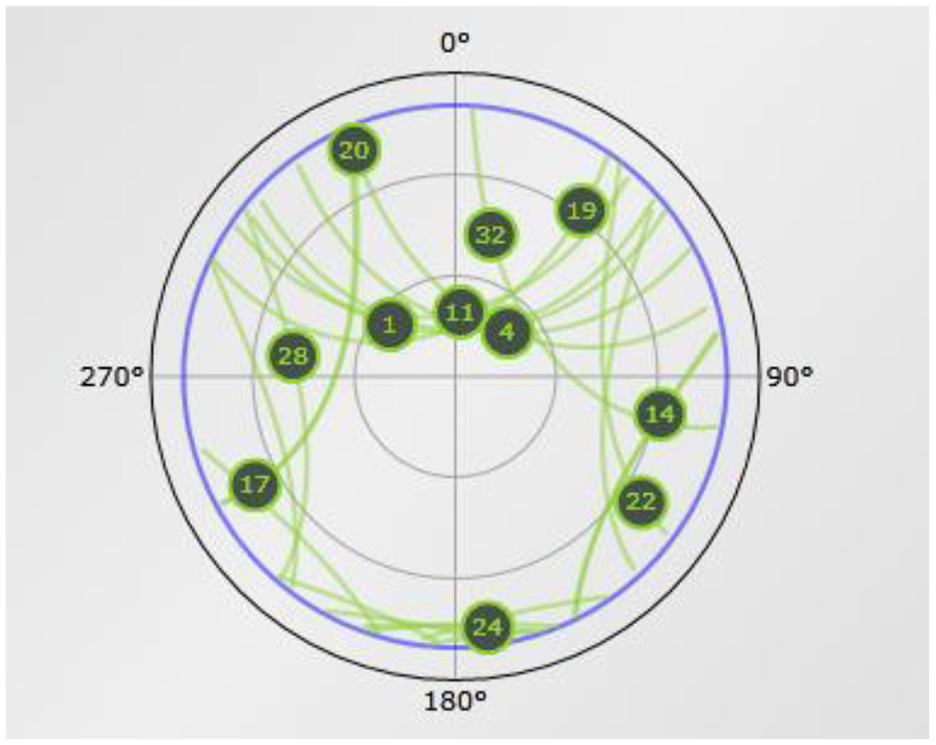
Skyplot of satellites at the time of the experiment (latitude: S 65.134568, longitude: E 76.26306) (00:00, December 14, 2014 (UTC +8)).
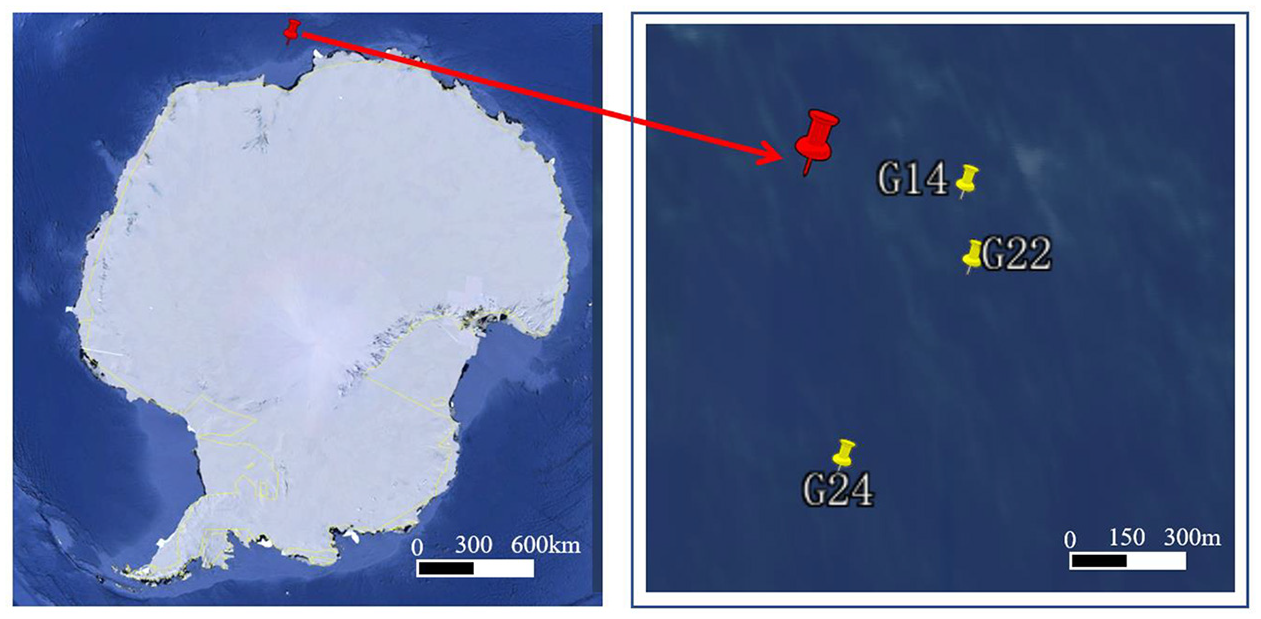
Positions of the receiver and specular points (00:00, December 14, 2014 (UTC +8)) (map from Google Earth).
Polarization ratio method
According to Fresnel’s formula, the Fresnel reflection coefficient expression depends on the polarization as follows:
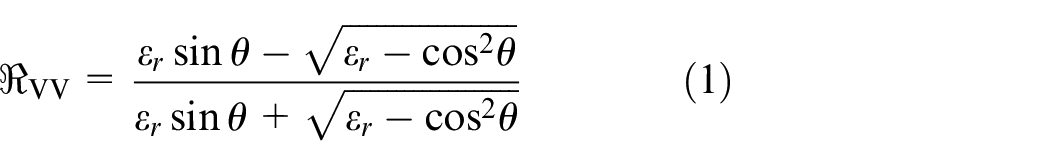
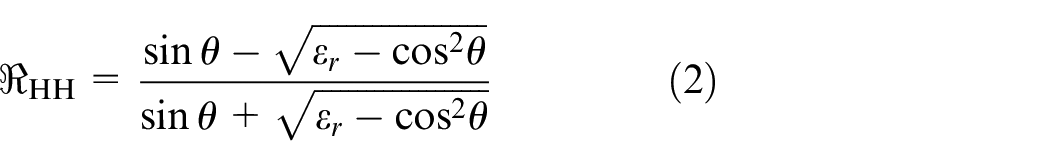
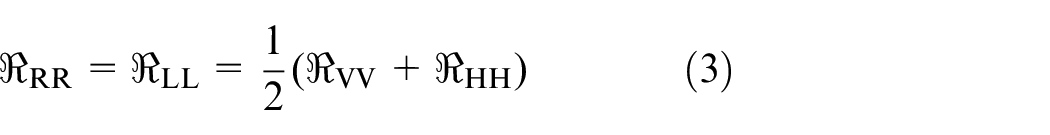
In (1)–(4), “V,”“H,”“R,” and “L” are the vertical polarization, horizontal polarization, RHCP, and LHCP, respectively.
Fresnel reflection coefficients of sea ice and sea water against elevation angles.
Results and discussion
Results
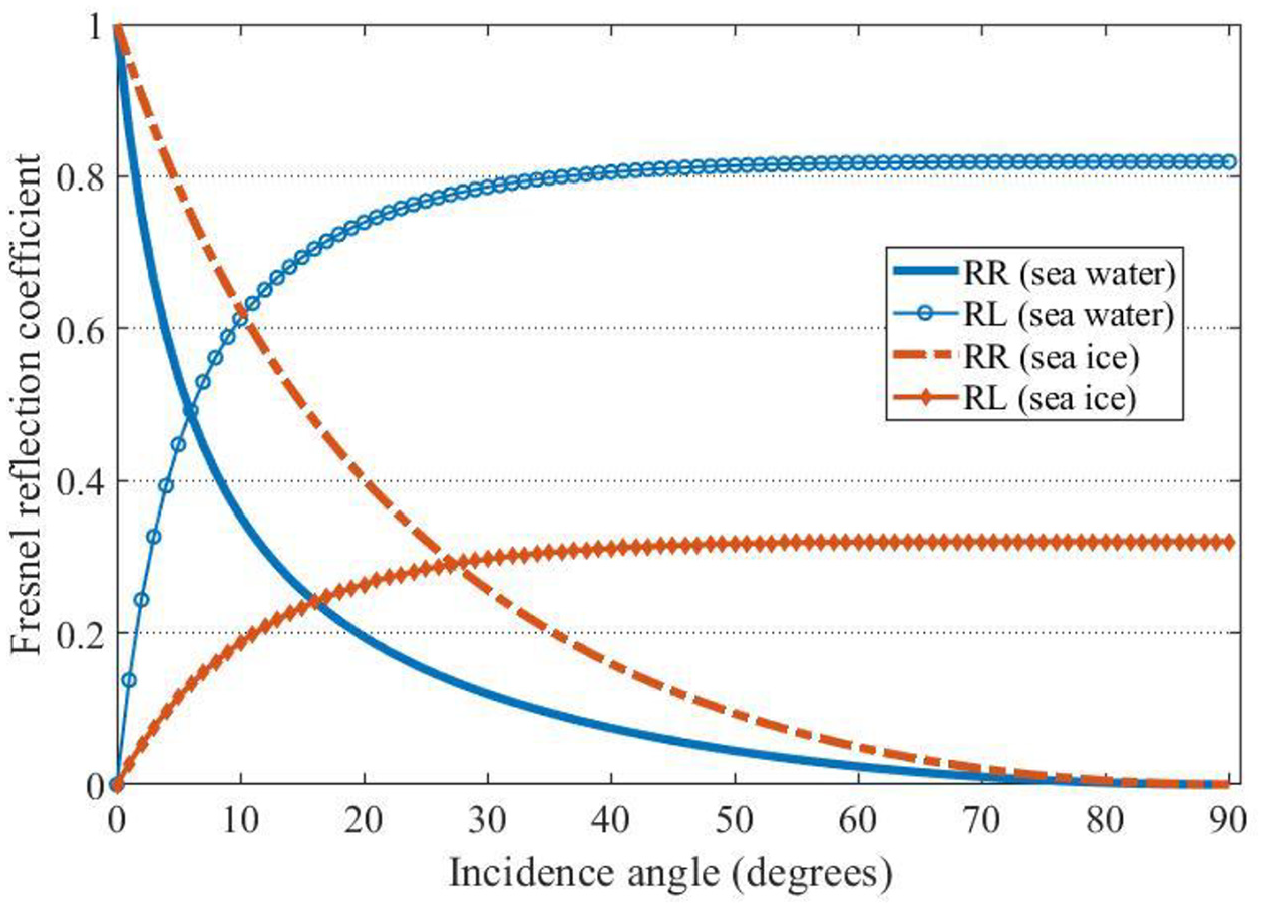
We chose the data from December 14 and 24, 2014, to show the calculation of the polarization ratios and to illustrate the relationship between the polarization ratios and the sea ice concentrations. The left and right portions of Figure 8 show examples of the DR, RR, and RL power curves of PRN14 at 00:00 on December 14 and 00:00 on December 24, 2014 (UTC+8), respectively. The polarization ratio can be calculated from these curves.
The power curves of PRN14 (00:00, December 14, 2014 (UTC+8) (left) and 00:00, December 24, 2014 (UTC+8) (right)).
The left portion of Figure 9 shows the two-day polarization ratio and the sea ice concentration. The open circles represent the sea-ice polarization ratio (RL/DR), where the blue circles indicate the polarization ratio on December 14, and the red circles represent the polarization ratio on December 24. The x-axis indicates the time of the data sets. The left y-axis indicates the polarization ratio (RL/DR). The polarization ratio ranges from 0.06 to 0.22 on December 14, and the average is 0.097. The polarization ratio ranges from 0.10 to 0.83, and the average is 0.67 on December 24.
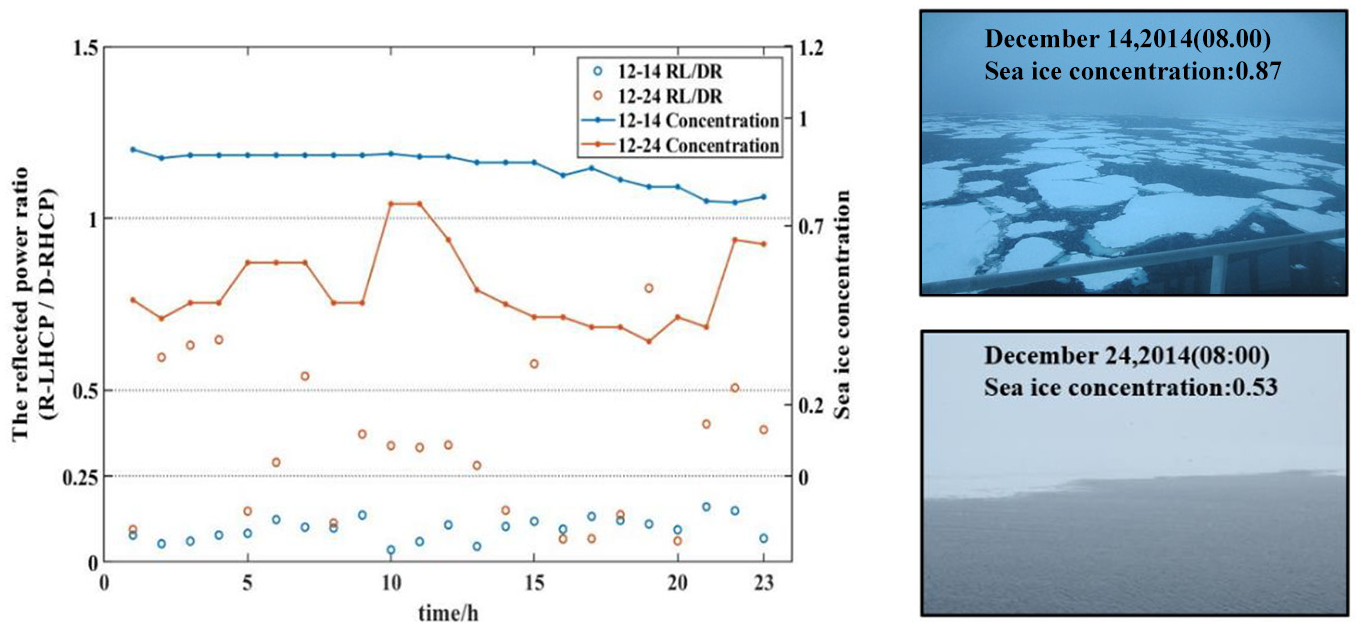
The left portion is the polarization ratio (RL/DR) at 8:00, December 14 and 8:00, December 24, 2014 (UTC +8). The pictures on the right show the sea ice in the study area and the corresponding sea ice concentrations. The original pictures of the upper and lower right pictures are S2 and S4, respectively, in the Supplemental Material.
The solid lines represent the sea ice concentration data provided by NSIDC, where the blue line represents the ice concentration on December 14, and the red line represents the ice concentration on December 24. The x-axis indicates the time of the data sets. The right y-axis indicates the sea ice concentration. The average sea ice concentration is 0.87 on December 14 and 0.53 on December 24.
The right portion of Figure 9 shows pictures of the study area. We can observe in the two pictures that the sea ice concentration on December 14 is larger than that on December 24. The results are in accordance with the data from NSIDC.
By analyzing Figure 9, we arrive at the following conclusions:
The variation in the sea ice concentration on December 14 is 0.2, and the amplitude of the polarization ratio is less than 0.25; the variation in the sea ice concentration on December 24 is 0.5, and the amplitude of the polarization ratio is 0.8.
The average sea ice concentration on December 14 is 0.87. In other words, the probability of the reflection points of the satellites being on the sea ice is 0.87. The mean value of the polarization ratio is 0.097. In contrast, the average sea ice concentration on December 24 is 0.53, and the mean value of the polarization ratio is 0.34. A negative correlation between the sea ice concentration and the polarization ratio is obtained.
Finally, the polarization ratios and the corresponding sea ice concentrations on the other days are obtained with the same process illustrated above. The results for all of these 9 days are shown in Figure 10. The average sea ice concentration is 0.8 from December 12 to 15, 2014. The sea surface is basically covered by sea ice, which agrees with the pictures of the study area on December 13 and 14, 2014, as shown in the top-left corner of Figure 11. The polarization ratio is less than 0.2, which is in accordance with the previous research conclusion that a lower polarization ratio indicates a higher sea ice concentration. The average sea ice concentration is 0.4 from December 23 to 25, 2014, which agrees with the picture of the study area on December 24, 2014, as shown in the lower-right portion of Figure 11. The range of the polarization ratio is 0–0.8, and the sea ice concentration also varies over time. Both results indicate that the sea ice concentration is neither very high nor very low. Thus, the specular reflection point can move between the sea water and sea ice, which results in a large range of variation in the polarization ratio. The average sea ice concentration is 0.84 on January 29 and 30, 2015. The sea surface is basically covered by sea ice, which agrees with the picture of the study area on January 29, 2015, as shown in the top-right portion of Figure 11. The polarization ratio is also less than 0.2, which is also in accordance with the previous research conclusion that a lower polarization ratio indicates a higher sea ice concentration.
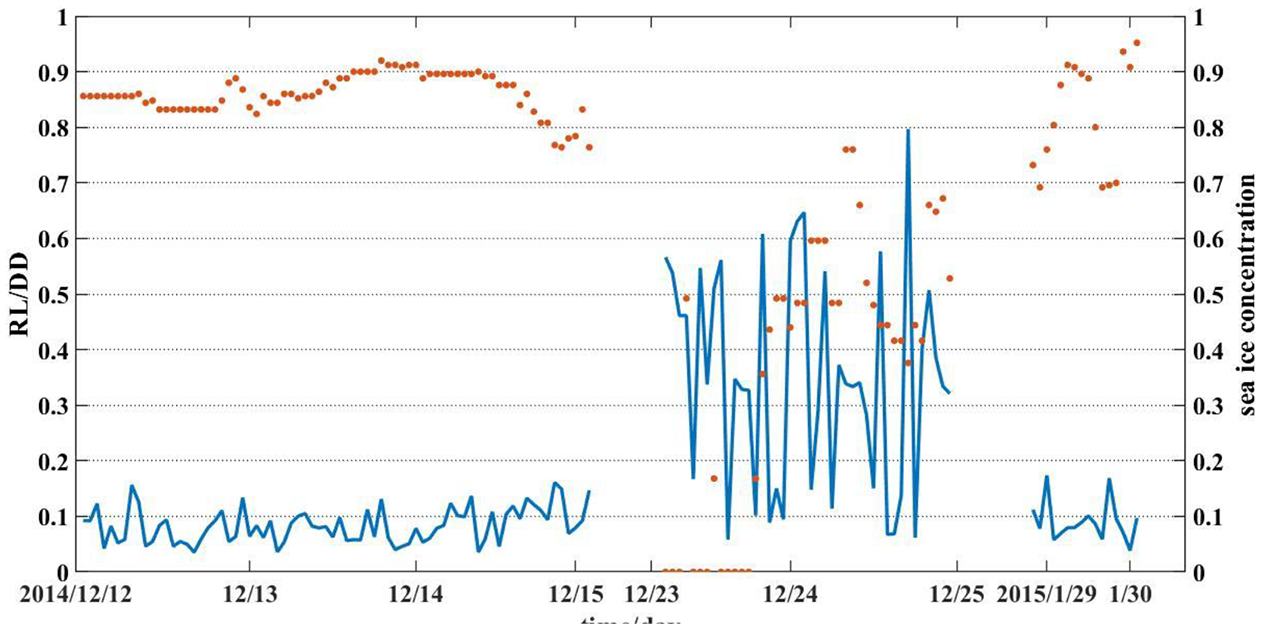
The relationship between the polarization ratio and the sea ice concentration.
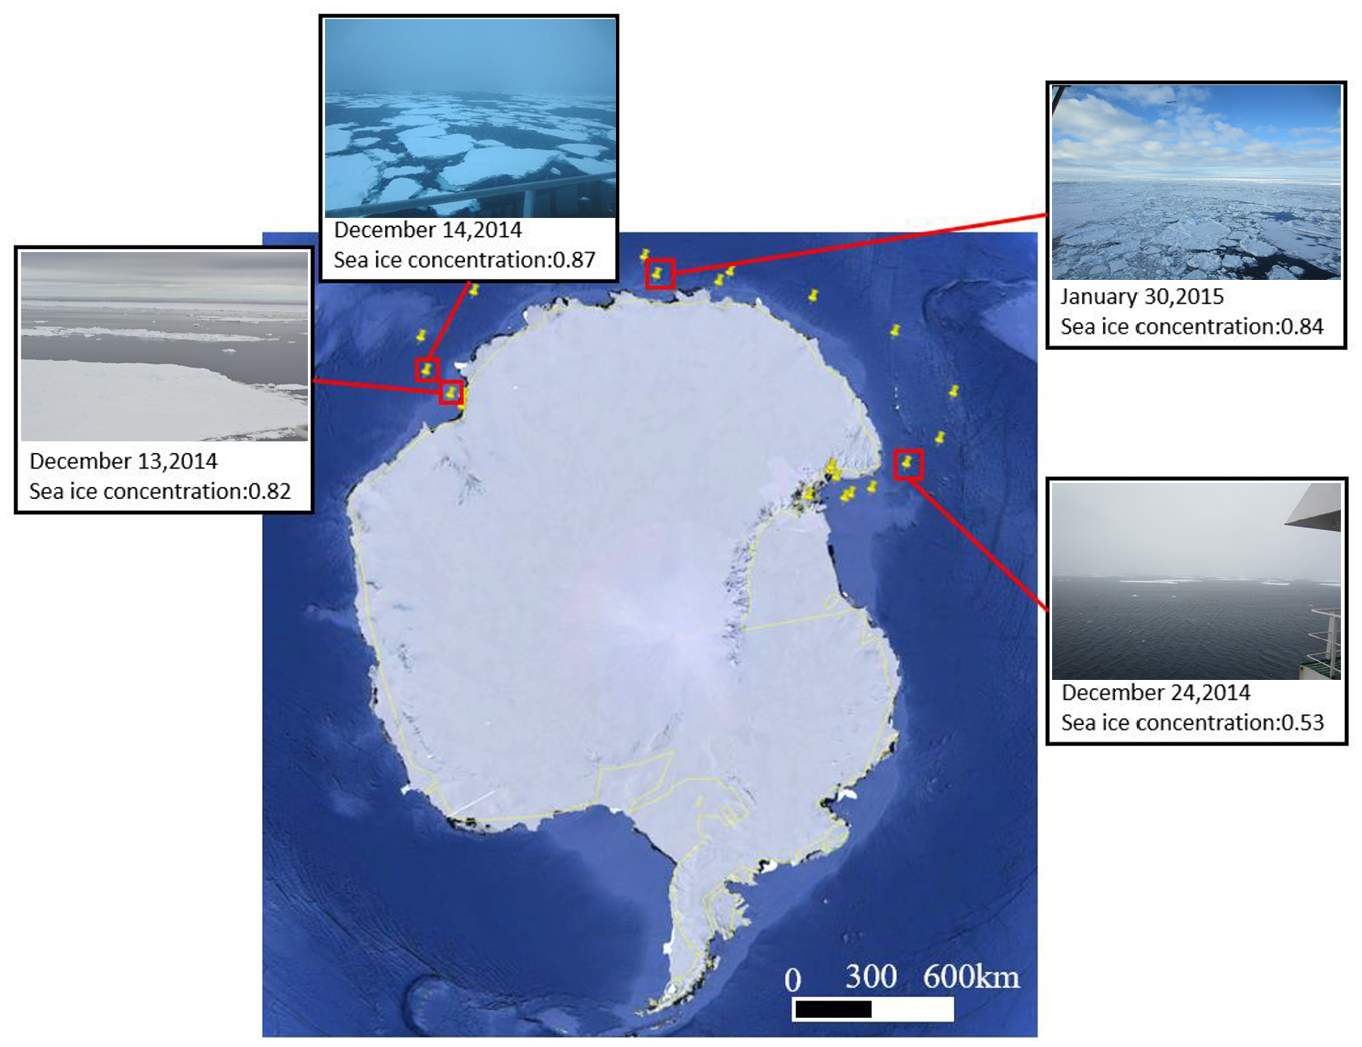
The ship’s track and some pictures of the study area during the experiment. The original pictures of the lower left, upper left, upper right, and lower right are S1, S2, S3, and S4, respectively, in the Supplemental Material.
These results show a negative correlation between the polarization ratio and sea ice concentration, and the correlation coefficient is approximately −0.66, which is similar to the result of Semmling et al. 27 The relationship is not very strong, which may be due to the very low resolution of the NSIDC sea ice concentration data (one pixel represents 25 km × 25 km) and the complex distribution of Antarctic sea ice. However, the polarization ratio is still a good indicator of sea ice concentration. When the polarization ratio is steadily low (Figure 10, December 12–15, 2014, and January 29–30, 2015) or high, the sea ice concentration is very high or low, respectively. When the polarization ratio fluctuates (Figure 10, December 23–25, 2014), the reflection surface is a mixture of sea ice and sea water.
Surface roughness impact
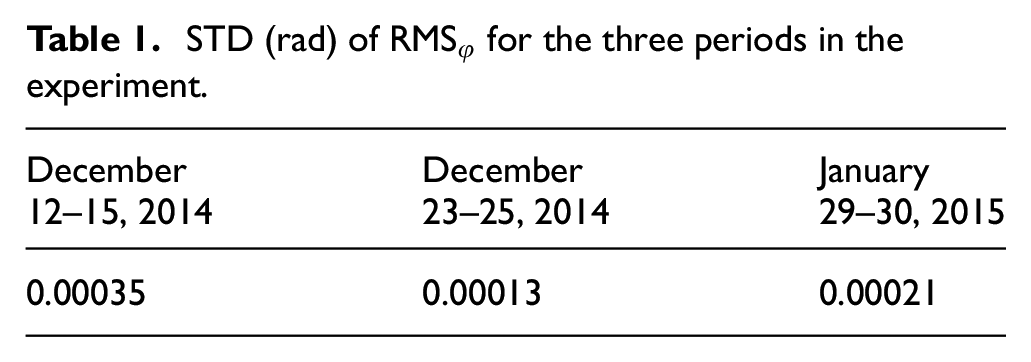
If sea ice is homogeneous or almost homogeneous, electromagnetic waves scatter on the sea ice surface. Following this hypothesis, the scattering characteristics of homogeneous sea ice are only related to the sea ice surface roughness. Because the interferometric phase of signals is more sensitive to the reflection surface, the RMS (root mean square) of the phase delay (
Figure 12 shows the
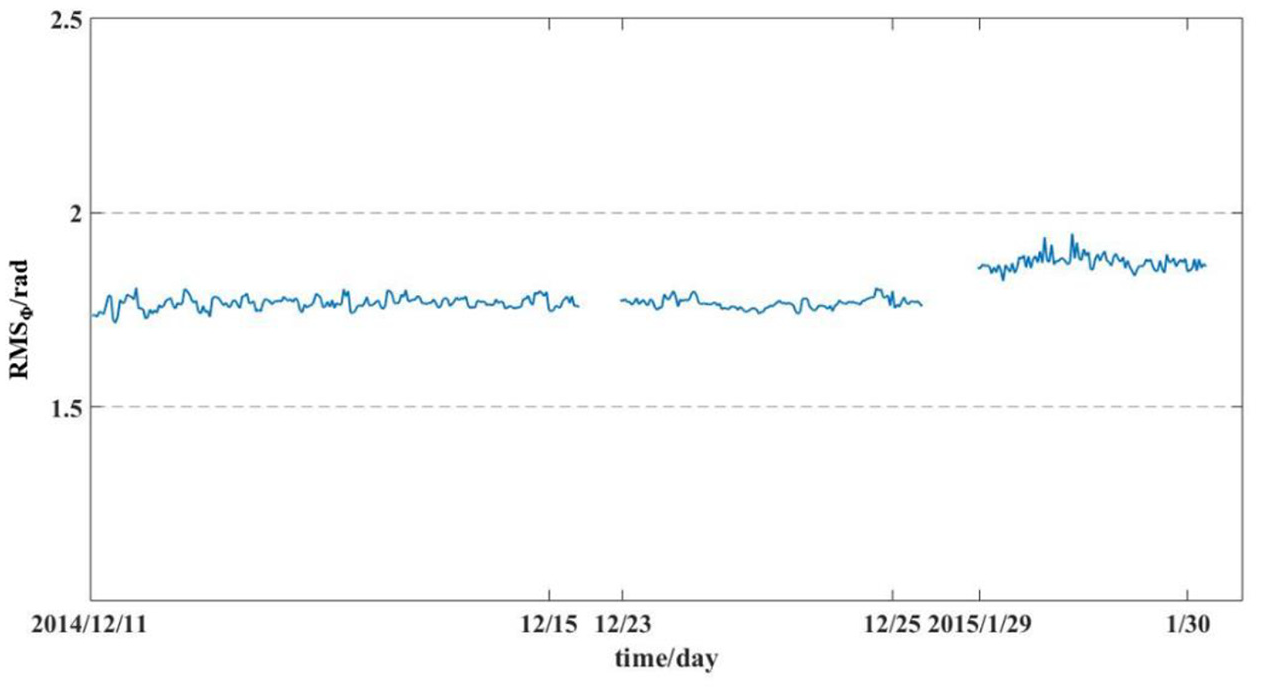
STD (rad) of
Conclusion
Antarctica sea ice concentration is an important parameter in the climate change and is important for navigation in Antarctica, high space and time resolution sea ice detection is very important. This study focuses on the feasibility of Antarctic sea ice detection using a shipborne GPS-R setup, which can expand the observation region relative to a coastal setup and can improve the spatial resolution relative to a spaceborne setup. The experiment was performed on “XueLong” from December 2014 to January 2015 during CHINARE 31. Our developed GPS-R receiver was used in the whole experiment and shipborne GPS-R data processing is developed, which can choose satellites with suitable elevation angles and azimuth angles in real time. The polarization ratio (RL/DR) is calculated every 60 min and is used to estimate sea ice concentration qualitatively for the purpose of navigation safety. The sea ice concentration from NSIDC and pictures of the study area are used as the comparison data. During the whole experiment, the sea ice concentration ranges from 0.53 to 0.87, and the GPS-R polarization ratio model can detect the changes in the sea ice concentration. When sea ice concentration is higher than 0.7, the polarization ratio (RL/DR) is always under 0.2; and when in the sea ice/water mixture situation, the polarization ratio (RL/DR) ranges from the minimum to the maximum depending on whether the location of the first Fresnel zone is on sea ice or water. When the elevation angle of the satellite is 10°–40°, there is a negative correlation between the polarization ratio (RL/DR) and the sea ice concentration, and the corresponding correlation coefficient is approximately −0.66. A similar
The experiment was carried out on a ship, the qualitatively estimated real time sea ice concentration can enhance navigation safety. Furthermore, quantitative relationship between the polarization ratio (RL/DR) and sea ice concentration can be established as suggested in the literature, and the sea ice concentration can enhance the options to validate other sensor data. 27 If we could receive the GPS-R data continuously during every year’s whole voyage, the time-space distribution of the sea ice concentration along the track could be obtained. And if GPS, BeiDou, Galileo, Glonass, etc. were used together, the time-space resolution and measurement accuracy would be improved. Shipborne GNSS-R technology depends on the voyage, though it is difficult to monitor a certain location for a long time, experiments could be carried out anywhere a ship can be sailed, it should play an important role in ocean remote sensing studies such as wind speed, height retrieve, and oil spill detection.
Supplemental Material
sj-docx-1-mac-10.1177_00202940211013063 – Supplemental material for Antarctic sea ice detection using a shipborne GPS reflectometry setup
Supplemental material, sj-docx-1-mac-10.1177_00202940211013063 for Antarctic sea ice detection using a shipborne GPS reflectometry setup by Yun Zhang, Dehao Ma, Wanting Meng, Xiangfang Xie, Shuhu Yang, Sijia Hang, Yanling Han and Zhonghua Hong in Measurement and Control
Footnotes
Acknowledgements
The authors would like to thank Professors Bo Sun and Ruibo Lei for their support in the “XueLong” experimental campaign as well as for the ancillary data provided. The authors would like to thank Professor Martin Neira, Dr. Fran Fabra, and Dr. WeiQiang Li for their discussions about the GPS-R polarization ratio method. The authors would like to thank Professor Dongkai Yang for their constructive comments.
Declaration of conflicting interests
The author(s) declared no potential conflicts of interest with respect to the research, authorship, and/or publication of this article.
Funding
The author(s) disclosed receipt of the following financial support for the research, authorship, and/or publication of this article: The research was supported by the National Nature Science Foundation of China (Grant Nos. 41376178, 41401489, and 41506213).
Supplemental material
Supplemental material for this article is available online.
References
Supplementary Material
Please find the following supplemental material available below.
For Open Access articles published under a Creative Commons License, all supplemental material carries the same license as the article it is associated with.
For non-Open Access articles published, all supplemental material carries a non-exclusive license, and permission requests for re-use of supplemental material or any part of supplemental material shall be sent directly to the copyright owner as specified in the copyright notice associated with the article.