
Abstract
This study used photoplethysmography signals to classify hypertensive into no hypertension, prehypertension, stage I hypertension, and stage II hypertension. There are four deep learning models are compared in the study. The difficulties in the study are how to find the optimal parameters such as kernel, kernel size, and layers in less photoplethysmographyt (PPG) training data condition. PPG signals were used to train deep residual network convolutional neural network (ResNetCNN) and bidirectional long short-term memory (BILSTM) to determine the optimal operating parameters when each dataset consisted of 2100 data points. During the experiment, the proportion of training and testing datasets was 8:2. The model demonstrated an optimal classification accuracy of 76% when the testing dataset was used.
Keywords
Introduction
Signals acquired using photoplethysmography (PPG) are referred to as PPG signals. By using light sensors to absorb light energy, PPG signals record signals generated by blood flow variations in blood vessels. Intravascular blood flow (per unit) changes according to heart pulse, and the inductive voltage detected by light sensors changes according to blood flow variations. Light sensors absorb the most light during systole. Therefore, PPG signal amplitudes are proportional to variations of blood influxes and effluxes in tissue. PPG signals are easy to acquire; after undergoing proper signal preprocessing, they have high use value. A study indicated that PPG and electrocardiography (ECG) are related. 1 Additionally, ECG and PPG signal collection and analysis systems have been developed to assess and analyze the correlation between PPG and ECG. Numerous studies have combined PPG and ECG signals in research and proven the applicability of ECG and PPG analysis in investigating arterial changes caused by age. 2 In Liou and Su, 3 a system was proposed that extracts attributes from ECG and PPG signals to estimate the systolic and diastolic blood pressure (BP) of each heart pulse. Furthermore, the research Şentürk et al. 4 proposed a novel algorithm that removes noise in highly unstable ECG and PPG signals to acquire pulse rate and measure cardiovascular parameters in a timely manner (e.g. pulse rate, total cardiac cycle, and BP). These parameters are applicable for the continuous monitoring of health conditions in patients with cardiac diseases. In Yude et al., 5 according to two variables’ AR model were employed in a developed algorithm to verify that the PPG spectrum consists of the respiration rate; this indicated the possibility of using PPG signals to acquire respiration and heart rates. In research Şentürk et al., 4 ECG and PPG signals were measured and a repetitive neural network was employed to propose a novel hybrid prediction model to continuously predict BP. In Dutt and Shruthi, 6 two different methods were employed to acquire arterial parameters; in one method, ECG and PPG signals were simultaneously acquired and the synchronized signals were used to obtain the pulse wave transmission time, which was subsequently utilized to measure the signal strength. In the other method, PPG signals were used to obtain arterial parameters (e.g. the stiffness index and augmentation index). Subsequently, a spectral power analysis was used to indicate differences in frequencies between two age groups. This research proved the usability of ECG and PPG analysis in investigating arterial characteristic changes caused by age and its potential applicability in the field of health care. In Verma and Agarwal, 7 an ear-worn monitor was developed to measure long-term BP and heart rate (HR). This proof-of-concept system demonstrated promising feasibility in the use of ear-ECG/PPG to measure exercise tolerance through BP/HR monitoring. In addition, researchers have used PPG signals to understand sympathetic nervous system changes and support cardiovascular function diagnosis. When signal sources are stable, PPG signals have outstanding potential to be used to monitor HR and HR variability (HRV).
Photoplethysmographs are the most common wearable device for measuring physiological signals. However, current studies on PPG have focused on BP estimation accuracy, sleep quality analysis, and emotional and personality judgment. For example, Shimazaki et al. 8 used PPG physiological signals to acquire the blood vessel stiffness index and used it to diagnose arterial stiffness severity. In Dutt and Shruthi, 6 an artificial neural network was employed to develop a novel method that used BP to estimate PPG signals. Regression calculations showed that the estimation accuracy of systolic and diastolic BP was 98.666% for both. Studies on PPG are widespread; Şentürk et al. 9 employed PPG to replace the ECG method in HRV analysis. This enabled the researchers to analyze the sympathetic nerve and parasympathetic nerve activities in automatic nerve systems, thereby allowing the objective assessment of mental fatigue. In Manimegalai et al., 10 convolutional neural network technology was proposed to estimate BP using the formation characteristics of pulse waves. However, compared with public databases for disease classification data, databases that provide PPG measurement data are sparse; researchers frequently encounter the challenges of insufficient data length and the need to organize data. Therefore, this study used limited available data to develop a deep learning technology that assesses network architecture and network parameter allocation to enhance overall classification accuracy when data available are limited. The less data condition is not suitable for deep learning algorithm, how to find the optimal parameters of the models and the precision data format might be the important issues in the future. 11 The other research with deep learning method is also presented, 12 for example an application-based online and offline traffic classification. The remainder of this paper is organized as follows. Section 2 describes the related work of PPG signals. Section 3 presents the deep learning models, which involved LSTM, Xception, ResNetCNN + BILSTM and Xception + BILSTM. Section 4 presents and discusses the results of the several deep learning models. Section 5 concludes this paper.
Related work
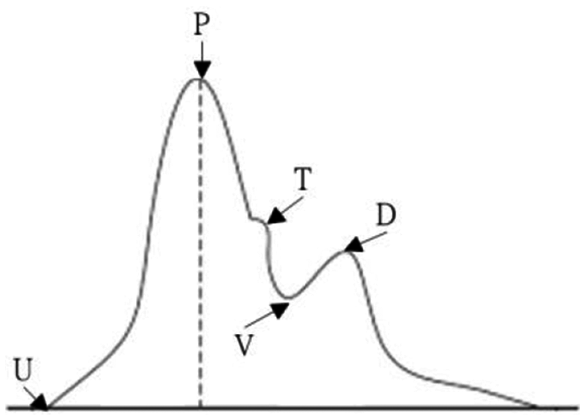
Figure 1 depicts a PPG signal, which comprises the U point, P wave, T wave, V wave, and D wave.
U point (UP stroke): This wave reflects the end-diastolic intravascular pressure and volume, thereby serving as the initial point when the ventricle rapidly ejects blood, which flows into the artery. This point is also called the “flowing point.”
P wave (percussion wave): This wave is the main amplitude of the pulse signal figure caused by the substantial ventricle blood output during systole. The wave rising speed is affected by cardiac output, ventricular ejection velocity, arterial resistance, and the elasticity of the vessel wall.
T wave (tidal wave): This wave reflects when the left ventricle stops ejecting blood, the artery expands and reduces pressure, and an antidromic reflected wave of blood flows in the artery. This wave is influenced by the degree of variety of peripheral vascular resistance, elasticity of the vessel, and descent velocity of the recession limb.
V wave (valley wave): This wave represents the emptying time of the aortal static pressure and serves as the cut-off point of systole and diastole. This wave is affected by peripheral vascular resistance and the descent velocity of the recession limb.
D wave (dicrotic wave): This wave represents when the aortic valves close suddenly in the early diastole phase of the ventricular. Then, blood that flows back affects it before being bounced back, which causes aortal pressure to rise again. This wave is primarily influenced by the elasticity of the vessel and the state of the closed aortic valves.
Key measurement indicators in PPG signals.
The aforementioned five components of PPG signals can be used to distinguish PPG characteristics. Therefore, researchers have focused on inspecting these characteristics and employed classification algorithms to acquire effective benefits in PPG characteristics. Because PPG is a time series, signal processing technology can be used to extract necessary characteristics from the signals. For example, discrete wavelet transform, discrete Fourier transform, or continuous wavelet transform can be used to extract meaningful characteristics. Ferdinando et al. 13 detailed meaningful characteristics that can be acquired through PPG and signal processing technology. Once the extraction process was complete, the extracted characteristics could be used to produce training data and applied in machine training algorithms (e.g. support vector machine and k-nearest neighbor) to construct prediction models.
To utilize signals in machine learning, the signal characteristics must first be extracted. Extracted characteristics that are more related to the goal exhibit greater classification accuracy. However, the main disadvantage of this method is that the characteristics used for machine learning must be extracted manually. Therefore, researchers must first research which characteristics have a high correlation with the goal.
In recent years, deep neural networks have garnered interest in the field of biomedical signal processing application. Convolutional neural networks (CNNs), capable of directly applying raw ECG signals, do not require the signals to undergo filtering technology or characteristic extraction beforehand; they directly extract transient characteristics from ECG signals to complete the classification of cardiovascular diseases. In Murugesan et al., 14 a CNN was employed to integrate single-lead ECG signals with long short-term memory (LSTM) algorithms to classify arrhythmia symptoms (e.g. normal beat, premature ventricular contraction, and premature atrial contraction), achieving a classification accuracy of 97.6%. In Chen et al., 15 a CNN was used to integrate 12-lead ECG signals with bidirectional LSTM (BILSTM) algorithms for the classification of atrial fibrillation, atrial flutter, complete atrioventricular block, junctional rhythm, sinus node diseases, and Wolff–Parkinson–White syndrome, achieving an overall mean accuracy of 81%. Finally, Peng et al. 16 employed a CNN and LSTM to enhance classification accuracy and extract characteristics from denoised and filter-processed ECG signals to classify arrhythmia symptoms. The model had a classification accuracy, sensitivity, and specificity of 99.12, 99.15, and 99.84%, respectively, in the classification of the five types of ECG signals (i.e. nonectopic, supraventricular ectopic, ventricular ectopic, fusion, and unknown).
Proposed deep learning method
This study used PPG time series data as the input data for its experiment. In time series data, correlation between permutation sequences is crucial to model performance. Therefore, the time information in time series data codes and the wave characteristics in the measured signal space must be simultaneously extracted to enhance classification performance. This study evaluated the performance of two types of deep learning models, namely ResNetCNN + BILSTM (Figure 2) and Xception + BILSTM (Figure 3), in classifying cardiovascular diseases according to the input data. According to database information, each input data consisted of 2,100 data points. According to different measurers, each of these 2,100 data points could be used to draw out 2 to 3 PPG waves. We first use ResNetCNN + BILSTM models, which has shown the good performance of PPG signals in recent researches. The difficulties in the study are how to find the optimal parameters such as kernel, kernel size and layers in less PPG training data condition. And the second, we propose our model of Xception + BILSTM and also find the optimal parameters to keep the accuracy in the same PPG database.
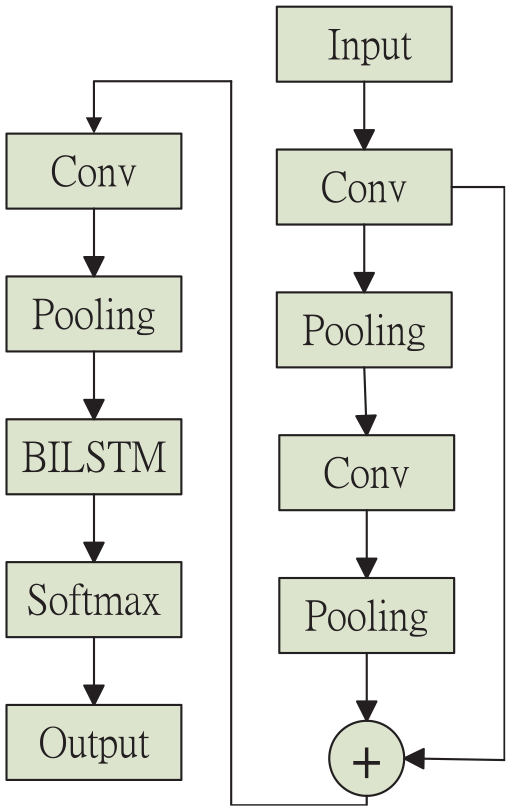
Deep learning architecture for ResNetCNN + BILSTM.
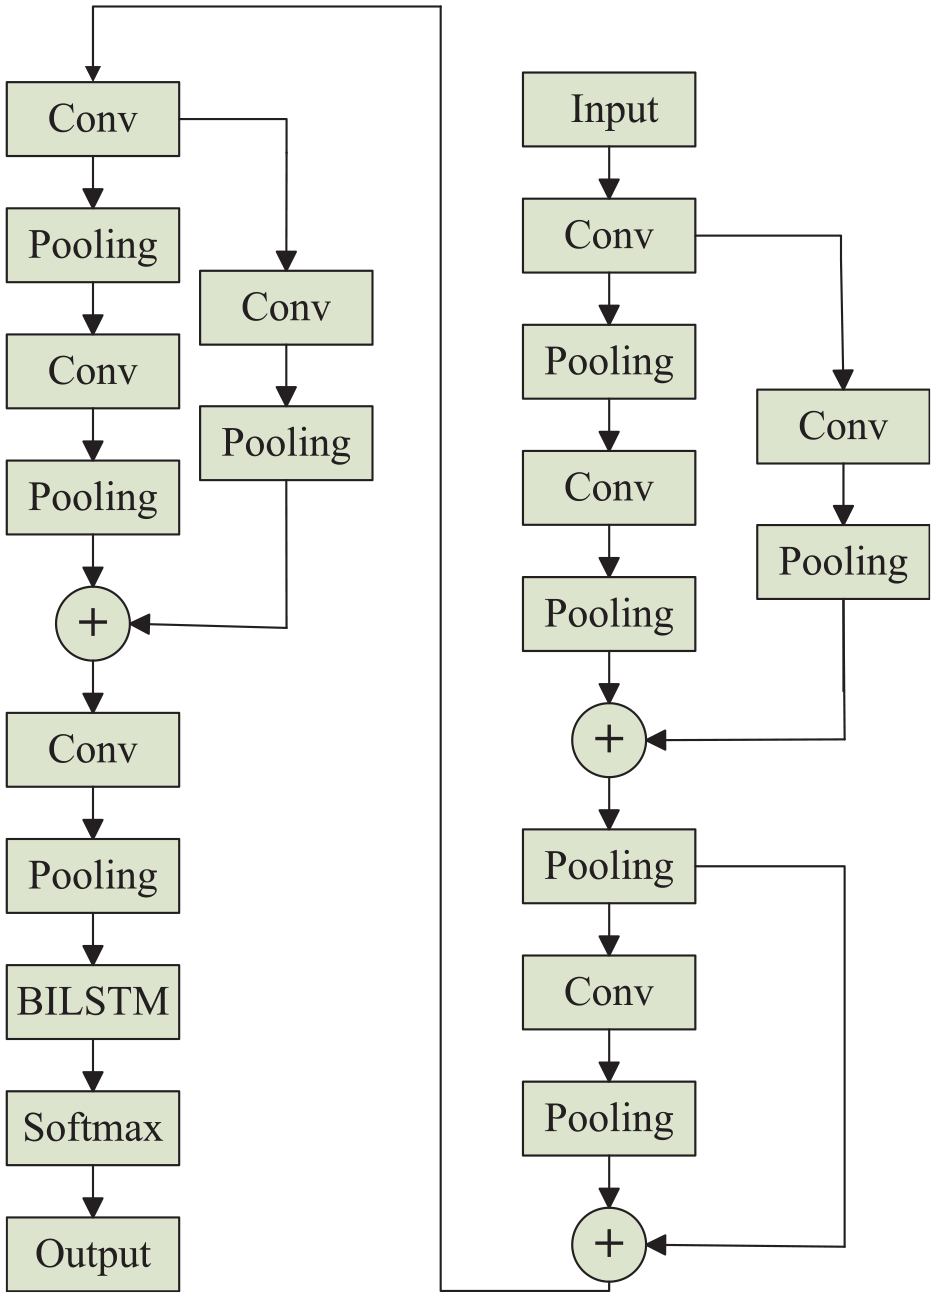
Proposed deep learning architecture for Xception + BILSTM.
In the ResNetCNN + BILSTM model, a 36-layer ResNetCNN was employed to extract characteristic vectors from the input data. After extraction, each data point yielded a characteristic vector of the size 15 ×1 32. Subsequently, the characteristic vectors were input into BILSTM for the machine to learn the time relation between the extracted characteristics. In the Xception + BILSTM model, the 37-layered Xception was used to extract characteristics from the input data. After extraction, each data point yielded a characteristic value of the size 64 × 132. Subsequently, the characteristic values were input into BILSTM for the machine to learn the time relationship between the characteristics. The goal of this study was to classify hypertensive disease test results using PPG data. Therefore, cross entropy loss was selected as the loss function of the networks.
Experiments of the proposed deep learning models
Dataset
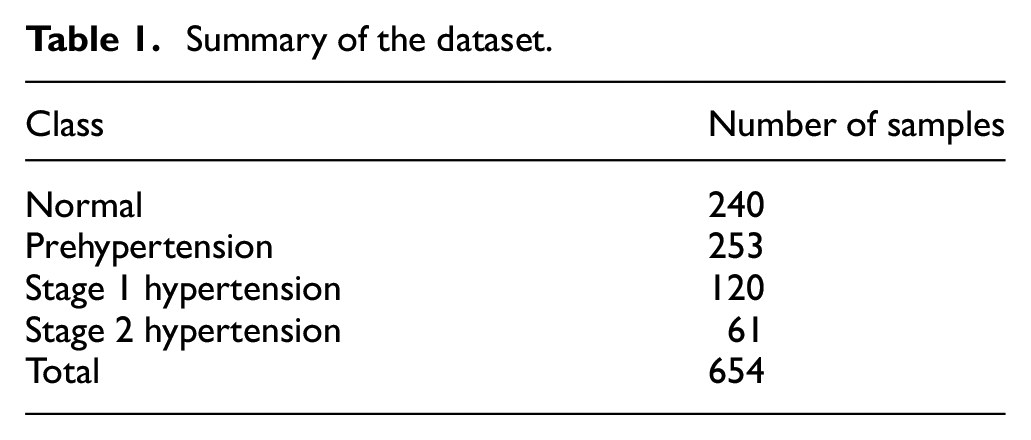
This study employed the database established by Liang et al., 17 which consists of data collected from 219 participants with ages in the range of 20–89 years from Guilin People’s Hospital in mainland China. We concern the less dataset condition of deep learning models. Although there are several schemes, for example, pre-trained model and generative model to overcome less dataset condition, but it still doesn’t have confidence in practical applications. The database provided 657 sets of short-length PPG data segments and included information on the participants’ sex, age, weight, height, BMI, systolic pressure, and diastolic pressure. PPG signals were measured at a 1 kHz sampling frequency and each data segment was 2.1 s in length. The data consisted of four types of hypertension diagnosis: healthy, prehypertension, stage I hypertension, and stage II hypertension. The abstract of the data set is listed in Table 1. The following section describes how different combinations of network parameters were employed to evaluate the optimal performance of the network system.
Summary of the dataset.
Experimental setting
The experiment software included Anaconda, Spyder, and Keras, which were built on top of TensorFlow. The study focus on how to choice the optimal model and parameters in less training data condition. In the deep learning models, we tune three kinds of parameters, for example, layers, kernels, and kernel size in different deep learning models. We believe that with less training continuous PPG signals, the performance will depend on spatial and time features. Hence, we combine ResNetCNN or Xception models with BILSTM model to increase accuracy. In addition, this study employed the ResNetCNN, Xception, and BILSTM network architectures as deep learning models. Different parameters were input into ResNetCNN and Xception, and the networks were used to extract data characteristics. Subsequently, one-layer BILSTM was used to extract time transmission characteristics from the PPG wave.
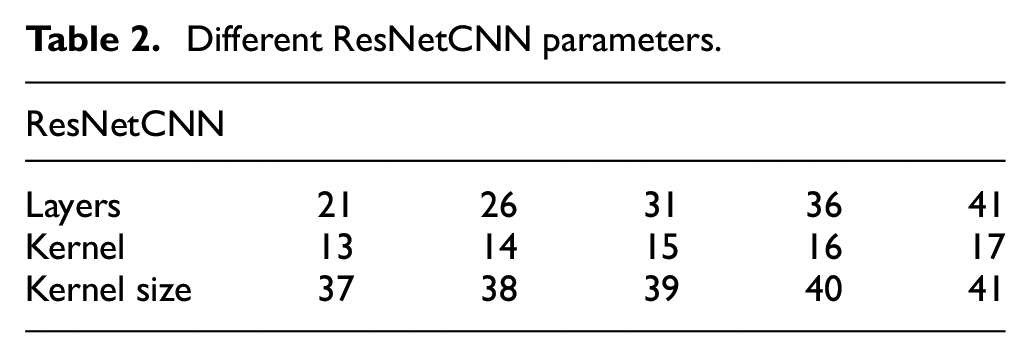
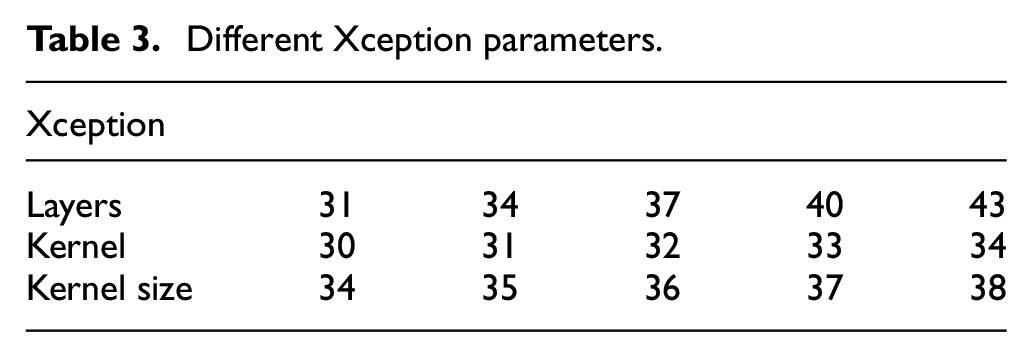
The simulated parameters are presented in Tables 2 and 3. We not only focus on how to find the optimal parameter combinations in different models, but also consider spread and deep models to analyze which is more suitable for one dimensional data of deep learning algorithm. The tables list the different parameters of ResNetCNN and Xception, respectively. The criterions in less data training scenario is first to find the appropriate number of layers and then searching kernel and its kernel size. In addition, to assess the performance of the neural networks when operating with less data, this study compared the classification performance of ResNetCNN when operating under different parameters, namely layers = 21, 26, 31, 36, and 41; when the kernel = 13, 14, 15, 16, 17 at layers = 31; and when kernel size = 37, 38, 39, 40, 41 when kernel = 15 and layers = 31. Through this, this study aimed to acquire the optimal parameter for the network to conduct data characteristic extraction. Similarly, this study evaluated the classification performance of Xception in different parameter designs, the first kind is layers = 31, 34, 37, 40, and 43; when the kernel = 30, 31, 32, 33, 34 at layers = 37; and when kernel size = 34, 35, 36, 37, 38 when kernel = 32 and layers = 37.
Different ResNetCNN parameters.
Different Xception parameters.
Finally, this study evaluated the accuracy, recall, and precision of the models when operating under different parameters.
Experimental results
Training and testing datasets were randomly distributed at a ratio of 8:2. In the experiment, the network performance efficiencies of the deep learning models (i.e. LSTM, ResNetCNN, Xception, ResNetCNN + BILSTM, and Xception + BILSTM) were compared, and the importance of time series and network spatial characteristics in the PPG data was evaluated. After verifying the results, this study employed different parameters to analyze the network performance of ResNetCNN + BILSTM and Xception + BILSTM.
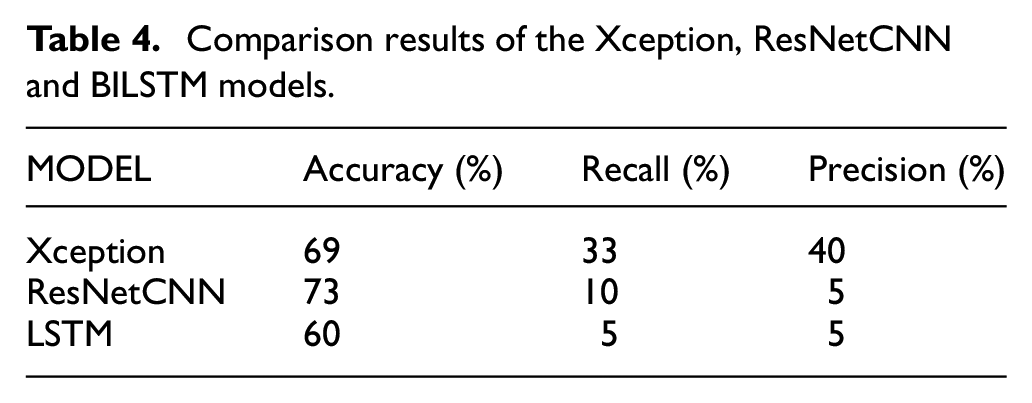
The experiment results revealed that after 200 iterations, the characteristics extracted using ResNetCNN + BILSTM and Xception + BILSTM were more accurate compared with those extracted by ResNetCNN, Xception, or LSTM alone. The Table 4 shows the results in different models. When ResNetCNN or Xception was used alone, the measured datasets were uniformly classified as prehypertension. By contrast, the LSTM network architecture alone demonstrated unfavorable resolution performance. The Table 4 shows among the different single models of Xception, ResNetCNN and BILSTM. Although the accuracy of only ResNetCNN is up to 73%, but the Recall is only 10% and the precision is also too low.
Comparison results of the Xception, ResNetCNN and BILSTM models.
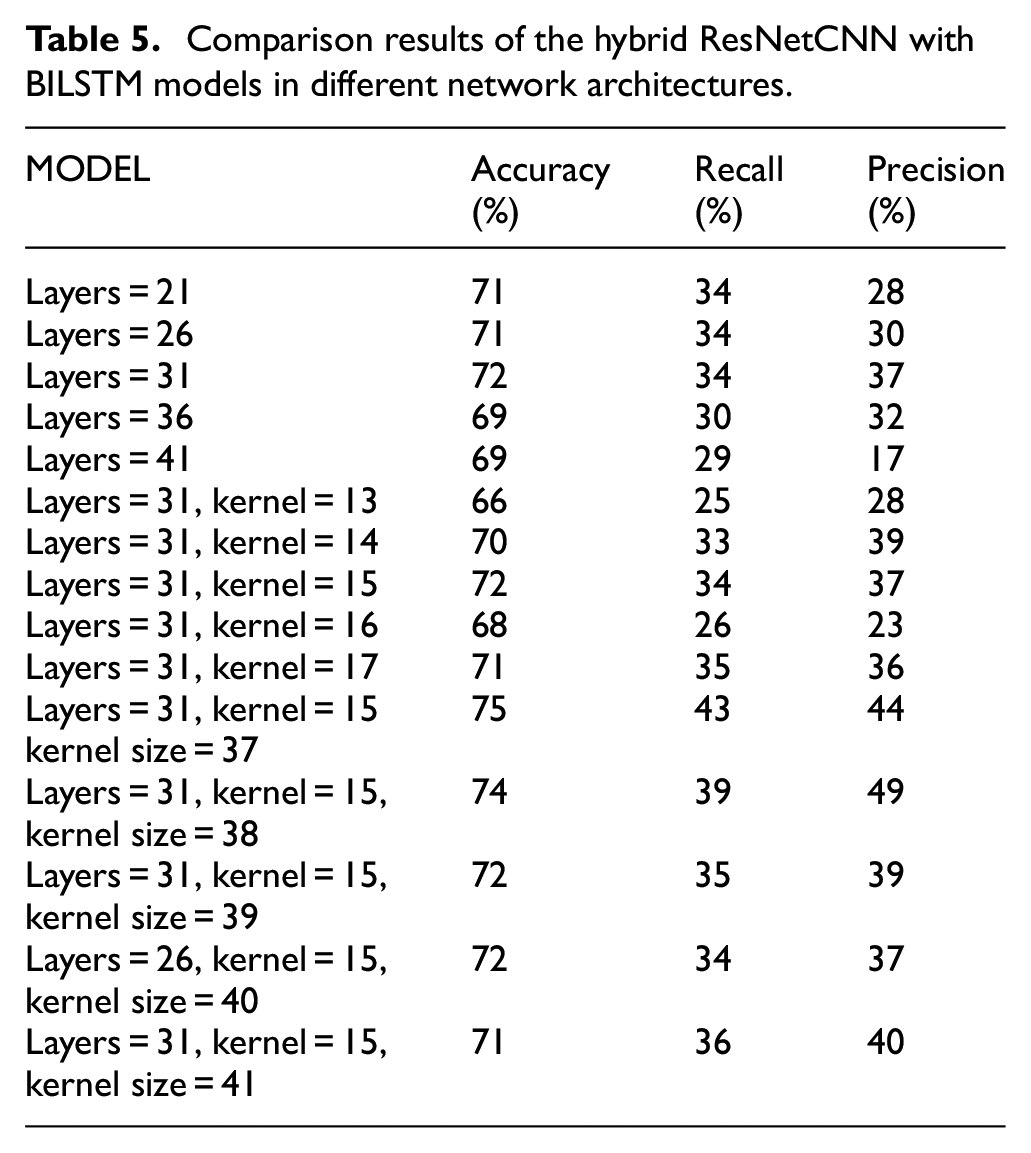
The Table 5 shows among the different parameter combinations input into ResNetCNN + BILSTM, when the layers could be 21, 26, 31, 36, and 41, the model produced the most satisfactory results at layer = 31. The reason is the accuracy of layers = 21, 26, and 31 are different from 1%, but the precision of layer = 31 is higher 7% than layers = 21 and 26. When the layer = 31 and the kernel could be 13, 14, 15, 16, and 17, the model demonstrated optimal results at kernel = 15. This is because of the precision of kernel = 13 is higher than kernel = 15, but the recall and accuracy are both lower than kernel = 15. Finally, when the layer = 31 and kernel = 15, the kernel size could be 37, 38, 39, 40, and 41 the model had optimal results at kernel size = 38. The criterion is that we can keep the optimal parameters between all accuracy, recall and precision.
Comparison results of the hybrid ResNetCNN with BILSTM models in different network architectures.
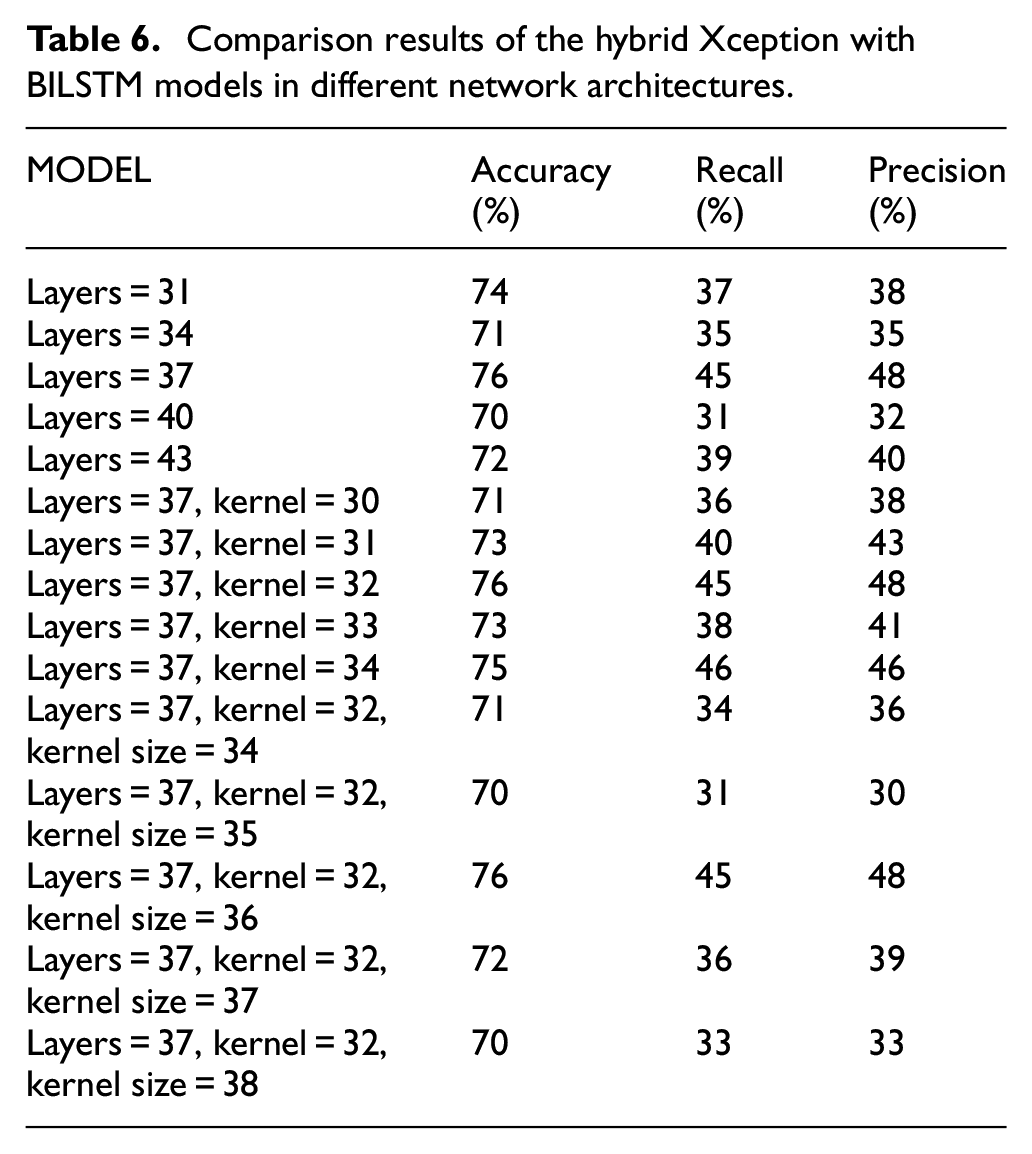
The same logic of Table 6 shows among the different parameter combinations input into Xception + BILSTM, when the layers could be 31, 34, 37, 40, and 43, the model produced the most satisfactory results at layer = 34. When the layer = 37 and the kernel could be 30, 31, 32, 33, and 34, the model demonstrated optimal results at kernel = 32. Finally, when the layer = 37 and kernel = 32, the kernel size could be 34, 35, 36, 37, and 38 the model had optimal results at kernel size = 36.
Comparison results of the hybrid Xception with BILSTM models in different network architectures.
Figures 4 and 5 demonstrate that, after 200-epoch training, the accuracy of the validation set and of the model both become more stable. The simulation parameters are the same as Figure 4. Much noise was observed, because the data of this study had not undergone filtering, leading to inferior results from the open dataset. However, in terms of overall model accuracy, the Xception + BILSTM this study proposed was effectively verified.
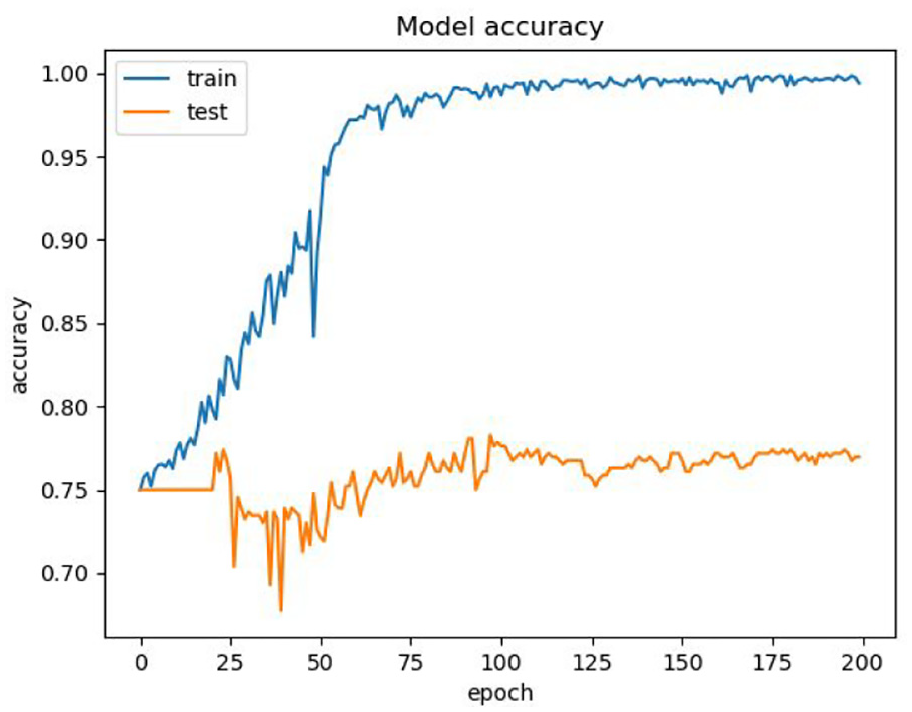
Model accuracy for Xception + BILSTM models under layers = 37, kernel = 32, and kernel size = 36.
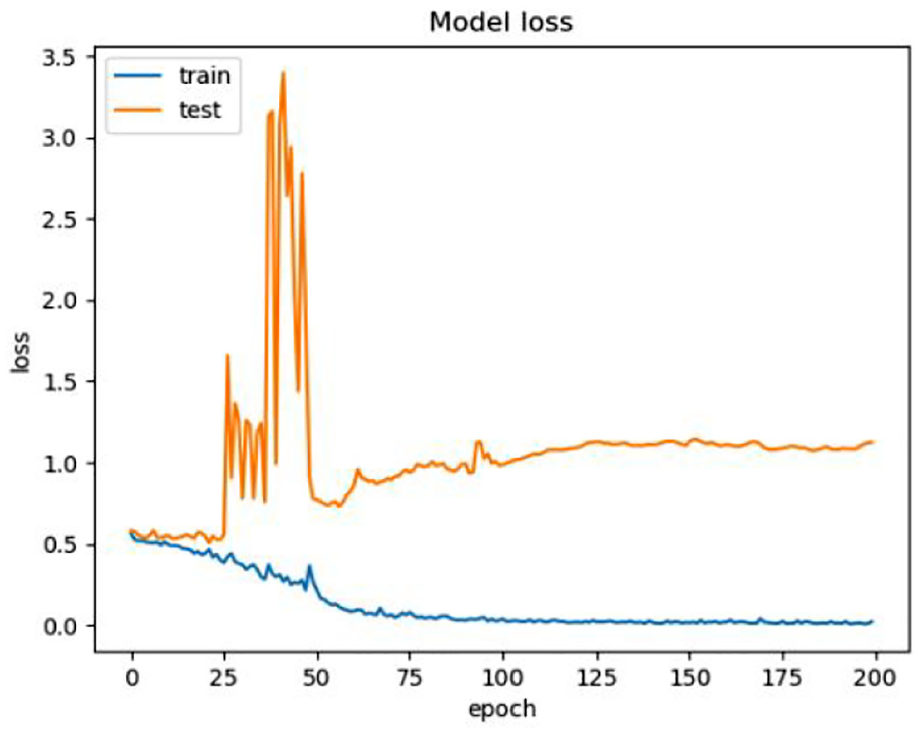
Loss function for Xception + BILSTM models under layers = 37, kernel = 32, and kernel size = 36.
Figure 6 shows that accurate classification is achieved in four types of hypertension diagnosis: healthy, prehypertension, stage I hypertension, and stage II hypertension. The parameters of Xception + BILSTM model are kernel = 32, kernel size = 36, and Xception layers = 37. In general, data classification issue of deep learning model is always limited in data unbalanced conditions. How to find the optimal parameter combinations become an important key point in the study? The confusion matrix shown seven data entries for stage I hypertension were classified as prehypertension and two data entries for stage II hypertension were classified as prehypertension. The confusion matrix indicates that stage I hypertension and stage II hypertension in the static actions were not wrongly classified. The reason for this is that significant changes in the numerical value of the PPG measurement occur during stage I hypertension and stage II hypertension were susceptible to wrong classification in the model because the respective data were more similar, and the training data were less in the open dataset.
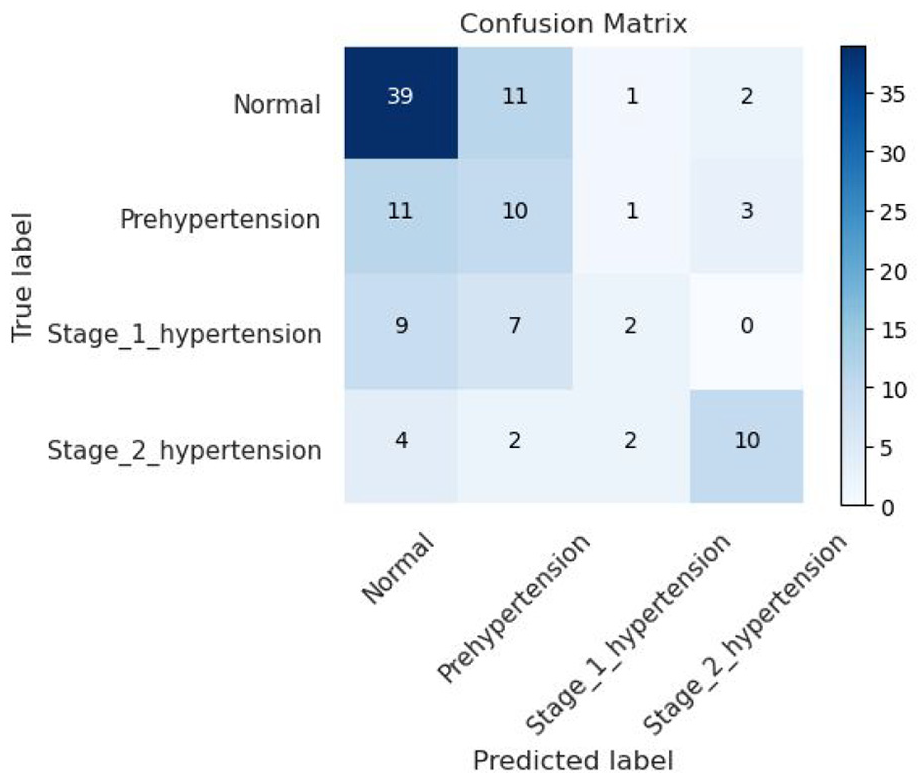
Confusion matrix for Xception + BILSTM models under kernel = 32, kernel size = 36 and Xception layers = 37.
Conclusion
This study employed different deep learning models to analyze how the classification accuracy rate of hypertensive disease test results can be enhanced through the selection of different models and parameters given limited available PPG signal data. Research analysis and comparison revealed that when the data consisted of only 2100 data points, the ResNetCNN + BILSTM model had optimal results when the layers = 31, kernel = 15 and the kernel size = 38. In particular, the model had an accuracy of 74%, 39% recall, and a precision of 49%. By comparison, the Xception + BILSTM model had optimal performance when the layers = 37, kernel = 32, and kernel size = 36, resulting in an accuracy of 76%, 45% recall, and a precision of 48%. This indicated that the results of the Xception + BILSTM model were more satisfactory compared with those of the ResNetCNN + BILSTM model in less data training condition. However, because public PPG databases are sparse, the data quantity was insufficient. Therefore, this study could only compare the of hypertensive disease classification accuracy of two deep learning models. In the future, the researchers hope to enhance the classification accuracy rate of the deep learning models through increasing testing data or employing suitable data expansion techniques.
Footnotes
Declaration of conflicting interests
The author(s) declared no potential conflicts of interest with respect to the research, authorship, and/or publication of this article.
Funding
The author(s) disclosed receipt of the following financial support for the research, authorship, and/or publication of this article: This work was supported in part by the Ministry of Science and Technology MOST 108-2221-E-150 -022 -MY3.