
Abstract
In order to effectively identify and extract the composite fault characteristics of the gear transmission system, a composite fault diagnosis method combining nonlinear mode decomposition (NMD) and Teager energy operator demodulation is proposed. Because the envelope demodulation of Hilbert transform has the disadvantages of large amount of calculation and end effect, it uses Teager energy operator to solve the problem of large amount of calculation, and NMD solves the problem that the fault signal features is not easy to extract under the mode aliasing. First, the NMD method is used to decompose the fault simulation signal, and the nonlinear modal component with practical physical significance is obtained. Secondly, the Teager energy operator demodulation is carried out for the nonlinear modal components, and the demodulation results are analyzed to verify the feasibility of the method. Then, the method is applied to the composite fault diagnosis of gear pitting wear in gear transmission system, and the characteristic frequency obtained from the test data is compared with the calculated characteristic frequency. The comparative analysis shows that the method can separate the fault characteristic frequencies of large and small gears. The comparative analysis with EMD and EEMD methods in simulation signal analysis and experimental research shows that this method is superior.
Keywords
Introduction
Gearbox is an integral part of most mechanical products. In order to prevent accidental failure and possible life loss, the fault diagnosis of gearbox has received great attention.1,2 The vibration signal of gearbox is usually complex, non-stationary and nonlinear. 3 When a composite fault occurs, multiple faults will interfere with each other and be coupled with each other. 4 In recent years, time-frequency analysis methods have been widely used in composite fault diagnosis. Wang et al. 5 proposed a composite fault diagnosis method for Gearbox Based on improved integrated local mean decomposition. Through the analysis of simulation and experimental signals, it can be seen that the method effectively overcomes the mode mixing phenomenon and reduces the reconstruction error. At the same time, the method avoids the appearance of pseudo components and reduces the calculation amount. It is verified that the improved integrated local mean decomposition method is an effective method to extract composite fault features. Isham et al. 6 proposed the VMDEA and ELM combined fan gearbox fault diagnosis method. This study provides a good solution for determining optimized VMD parameters to decompose vibration signals, and also provides a more effective fault diagnosis method for wind turbine gearboxes. Li et al. 7 proposed a gearbox composite fault diagnosis method based on SWD-AVDIF. By analyzing the simulation signals and experimental signals of the gearbox composite fault, the results showed that the method could effectively separate the composite fault signals and strengthen the fault characteristics. Yang et al. 8 put forward a gear fault diagnosis method combining EEMD and Choi Williams. Through the analysis of simulation and experimental signals, the adaptability and effectiveness of this method in gearbox fault diagnosis were verified. The traditional time-domain or frequency-domain analysis method is only suitable for linear stationary signals. The vibration signals of composite faults are mostly non-linear and non-stationary signals. Using only time-domain or frequency-domain analysis methods often fails to effectively extract fault features. 9 Therefore, a time-frequency analysis method should be used in feature extraction of composite faults. Windowed Fourier transform (WFT) and wavelet transform (WT) are more commonly used time-frequency analysis methods in signal processing. Both are suitable for processing nonlinear, non-stationary signals.10,11 The difference between them is that they analyze the form of the components that appear in the signal. WFT has linear frequency resolution, that is, it is distinguished according to the frequency difference of each component. WT has logarithmic frequency resolution and is distinguished according to the component frequency ratio. According to Heisenberg’s uncertainty principle, for any kind of time-frequency transformation, the frequency resolution and time resolution cannot reach the optimum at the same time. The time resolution of the WT will increase as the frequency increases. The time resolution of the WFT is the same at all frequencies. So we merge the two, Using WT to get high temporal resolution, Use WFT for high frequency resolution. Huang first proposed a new time-frequency analysis method-empirical mode decomposition (EMD). It can decompose complex signals into finite intrinsic mode functions (IMF), which are suitable for nonlinear and non-stationary signals. 12 Since this method came out, it is widely used in fault diagnosis of mechanical equipment.13,14 Wu and Huang 15 also proposed an EEMD method, adding white noise to the signal and then performing EMD decomposition. However, the signals decomposed by EMD and EEMD are prone to produce pseudo components. The non-sinusoidal complex components generated by the same excitation source will be decomposed into multiple simple components, which will increase the number of components. In addition, they are sensitive to noise and their robustness is not ideal. In view of their disadvantages, Iatsenko et al. 16 proposed a new time-frequency analysis method—nonlinear mode decomposition (NMD), which can decompose the given signal into oscillation with practical physical significance and decompose it into nonlinear mode component (NM). In the process of decomposition, the advantages of WT and WFT are integrated, the accuracy of extraction and reconstruction of main signals is improved, and the noise robustness is very strong. At present, the envelope demodulation method used in many domestic and foreign literatures of fault diagnosis is Hilbert transform envelope demodulation.17,18 But there are also endpoint effects in Hilbert transform, which will affect the whole signal analysis results. 19 Hilbert has a lot of calculations, the calculation of the Teager energy operator is relatively small. The calculation amount of Teager energy operator demodulation is mainly 4N times real number multiplication, equivalent to N times complex multiplication; The calculation amount of Teager energy operator demodulation is about 1/logN of Hilbert demodulation method. 20 When N = 1024, it is 1/10. Teager energy operator can enhance the transient characteristics of the signal and is suitable for detecting the impact component in the signal. This method has high time resolution, and it has good adaptive ability to the instantaneous change of signal. It has low computational complexity and high efficiency. 21
In this paper, a composite fault feature extraction method combining nonlinear mode decomposition (NMD) and Teager energy operator is proposed. The composite fault signal is decomposed by NMD, and then the obtained nonlinear modal component (NM) is demodulated by Teager energy operator, and the fault type is determined by comparing the obtained fault characteristic frequency with the calculated fault characteristic frequency.
The second part of this paper introduces the basic theory of the proposed method. The third part analyzes the simulation signal. The fourth part compares and analyzes the effectiveness of the three methods for composite fault feature extraction. The fifth part expounds the conclusion of this paper.
The proposed method
Basic theory of NMD
Under a certain excitation, nonlinear system will produce response, which can be regarded as NM component. It is assumed that the signal consists of a series of NM components and noise.
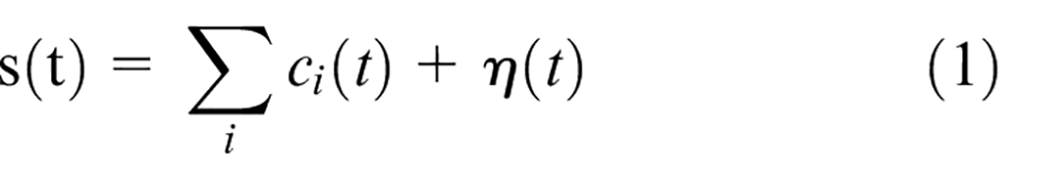
Among them,
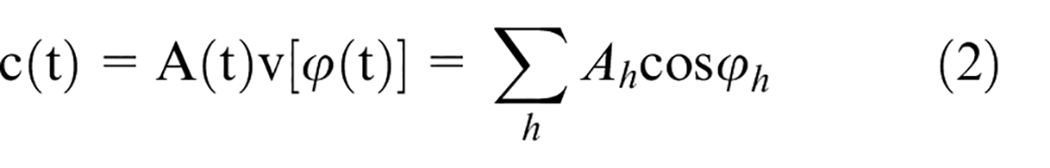
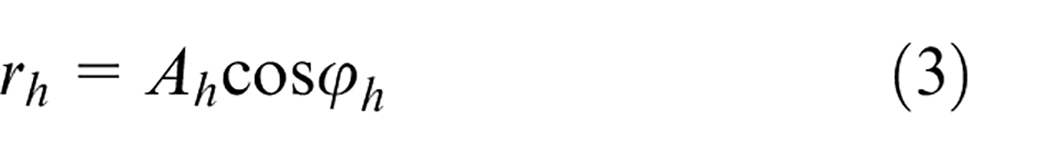
Where
The purpose of NMD decomposition is to decompose the NM signal. The characteristic parameters of each harmonic
To construct WT and WFT:
(1) Wavelet transform the original signal. Given the signal s(t), WT can be expressed as:
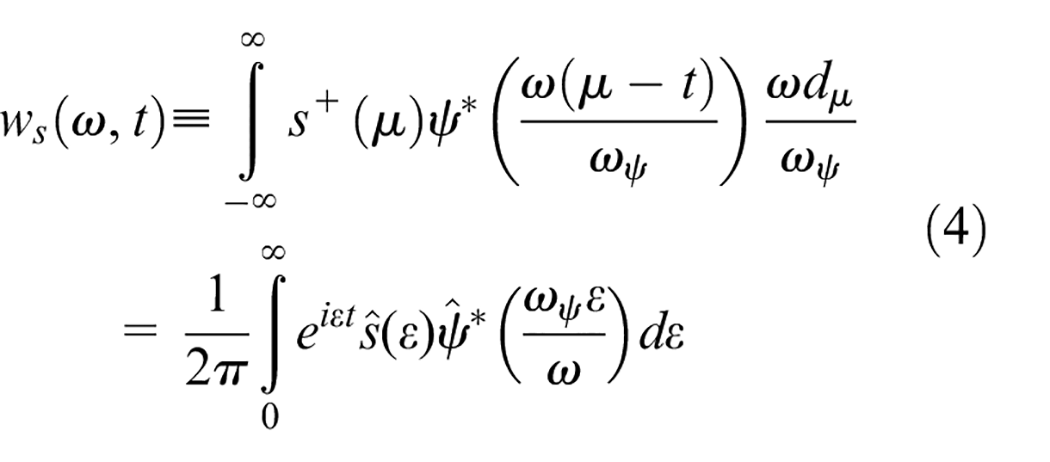
In the formula,
(2) Extraction time-frequency ridge
A curve consisting of a series of ridge points is called a ridge curve. Represents the peak frequency of each moment. In the paper, the ridge extraction method proposed by Iatsenko et al.
22
is adopted. The ridge

Where,
(3) Main harmonic reconstruction
After the ridgeline curve is extracted, the main harmonic
(4) WT or WFT selection criteria
The paper combines the advantages of WT and WFT. It enables NMD to adaptively select the most suitable type of time-frequency transformation. The empirical formula can be expressed as:
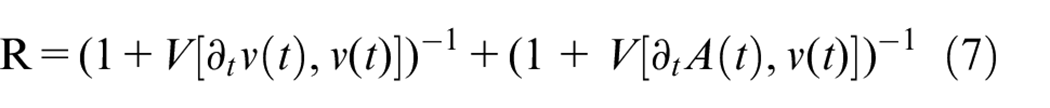
When R < 1, WFT is used, and WT is used otherwise.
(5) Determination of reconstruction method
Since there are two reconstruction methods, in order to make the reconstructed harmonics more accurate and reasonable. According to different time-frequency analysis methods and two reconstruction methods, the final reconstruction method is determined.
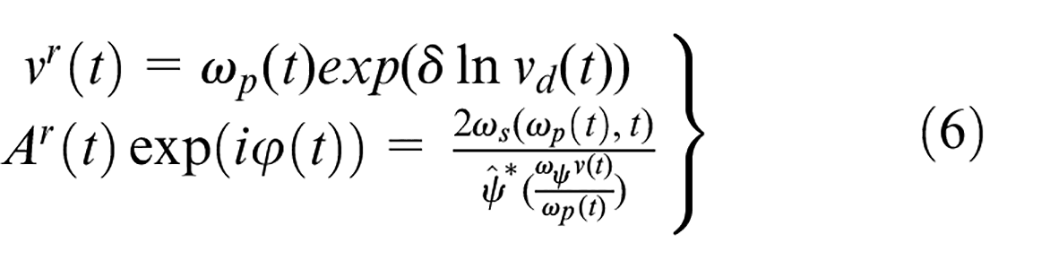
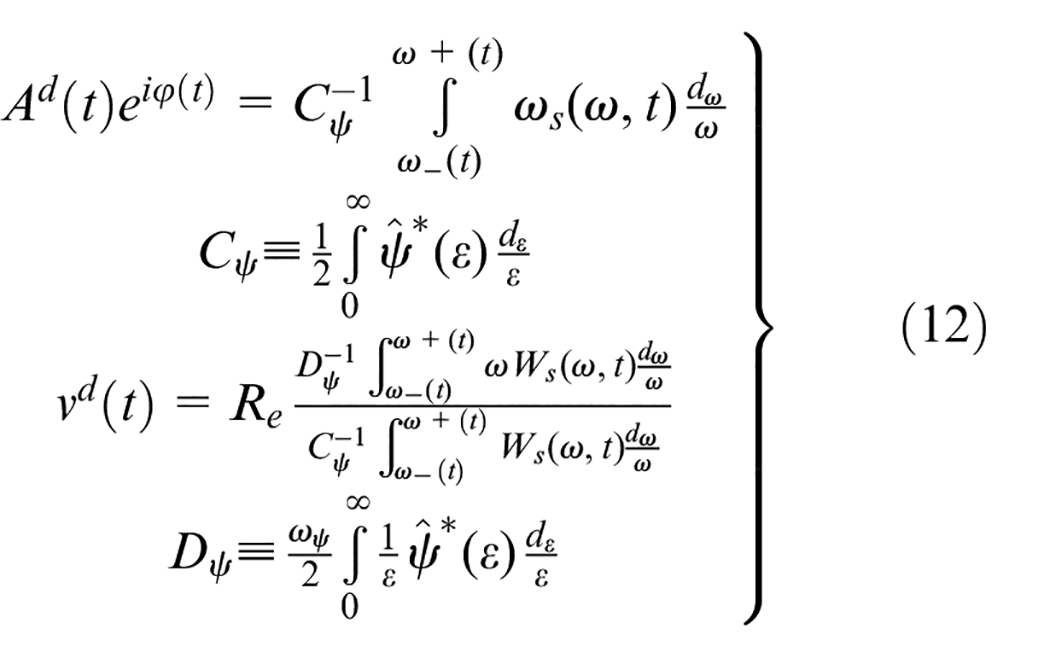
(1) When WFT is the optimal time-frequency transform, the given signal G(s) is transformed by WFT:
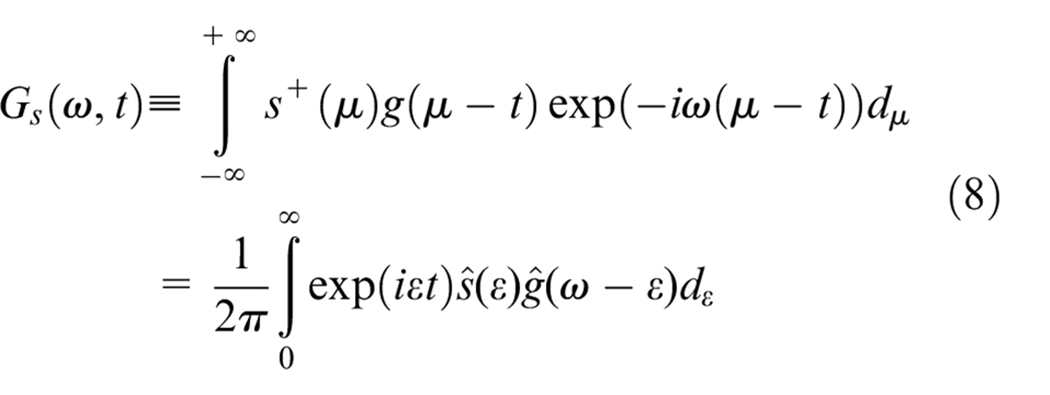
Where,
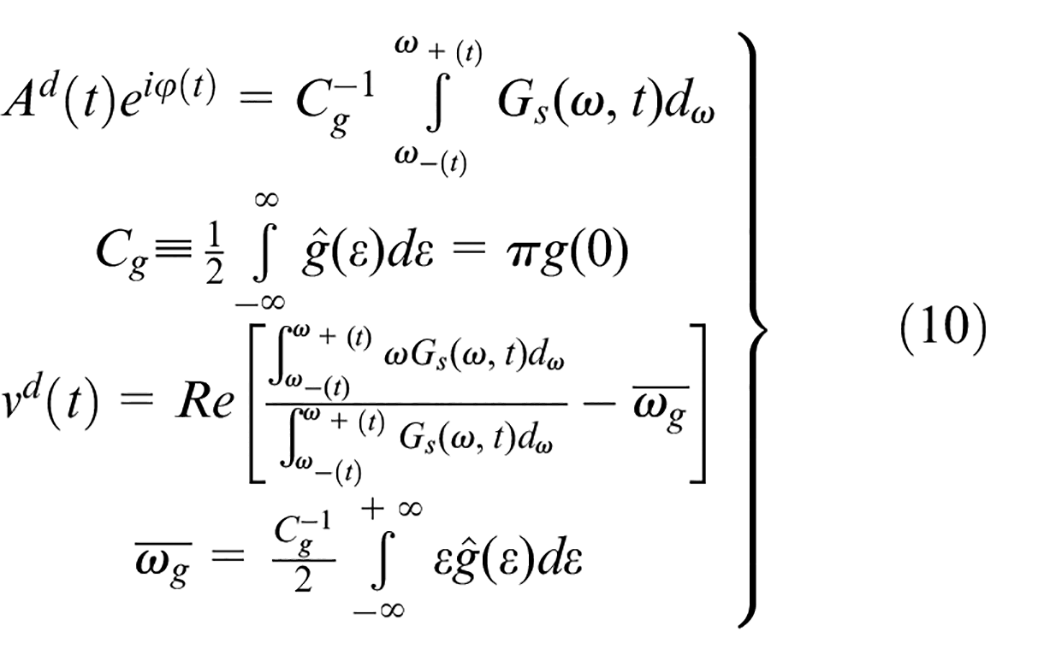
Where, δ is the discrete correction coefficient.
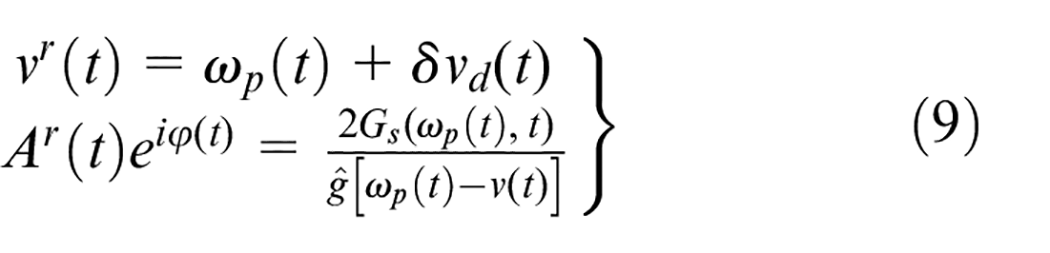
First, calculate the weighted average
Where
(2) According to formula (11), if
(6) Extraction of sub-harmonics
After obtaining the main harmonic
(7) Identification of true harmonics
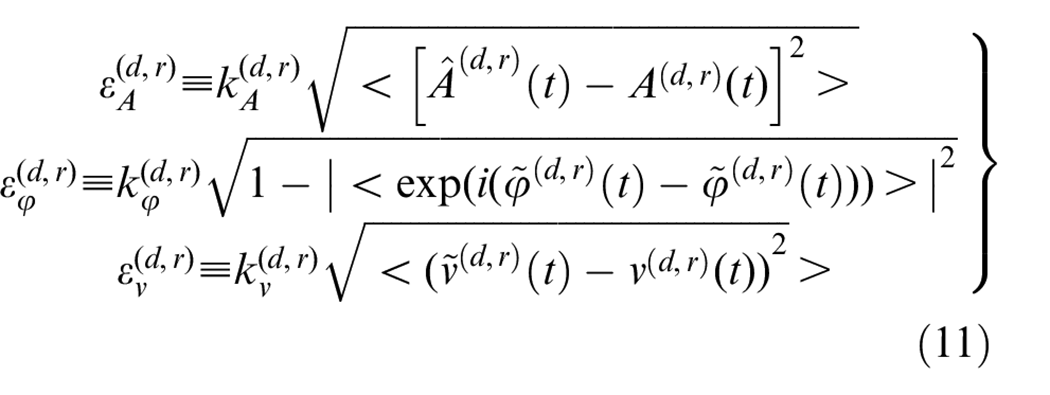
The amplitude, phase, and frequency of true harmonics should be related to the main harmonic. After extracting the primary harmonic
Where,
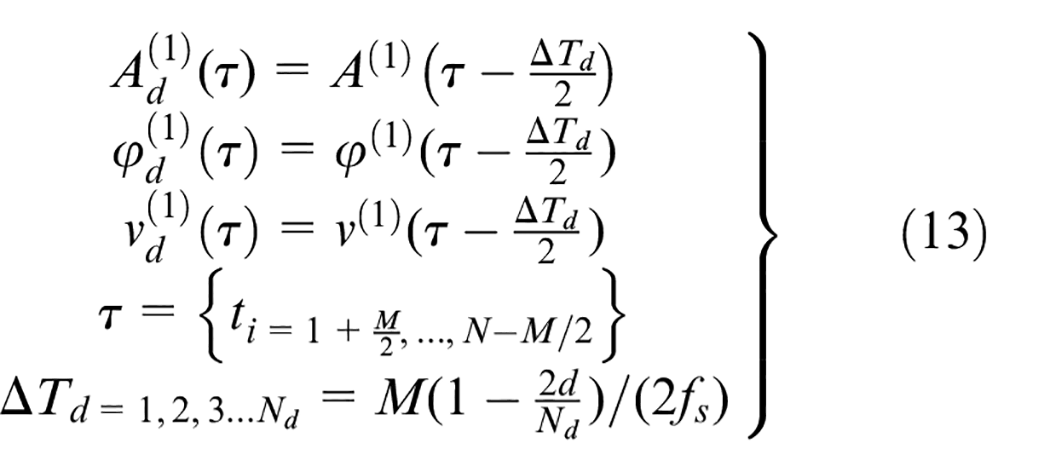
Alternative parameter process of subharmonic
(1) Move its signal forward in the time domain by
(2) Use step (6) to select the optimal substitute harmonic parameters
(3) Introduce the statistical feature q_(A,v)^((h)) to measure the degree of consistency between the primary and secondary harmonics. Its dependence can be expressed as:
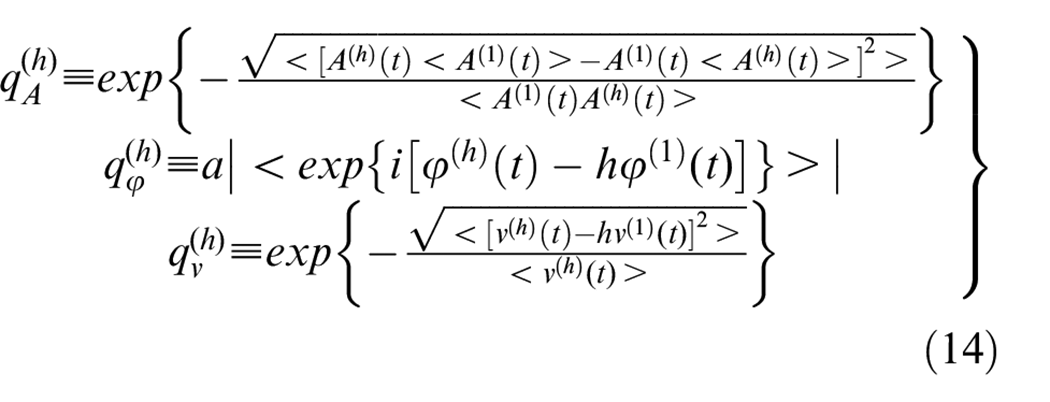
Consistency coefficient can be expressed as:
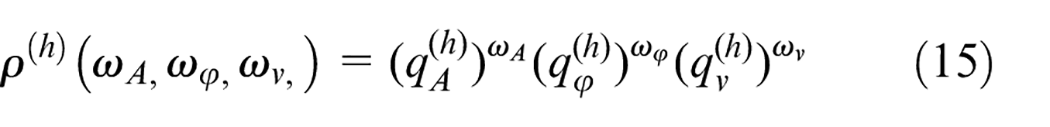
The parameter
(4) In order to reduce the error caused by harmonic interference, the previous true harmonic must be subtracted and then harmonic identification (it is also applicable to the main harmonic. When identifying the sub-harmonic
(8) Noise detection.
The extracted true harmonics are added to obtain the NM component, which is then subtracted from the original signal. Until there is only noise in the remaining signal. The surrogate test method with Fourier transform is used to detect whether the residual signal contains noise. The statistical characteristic quantity D of the alternative data is expressed as:
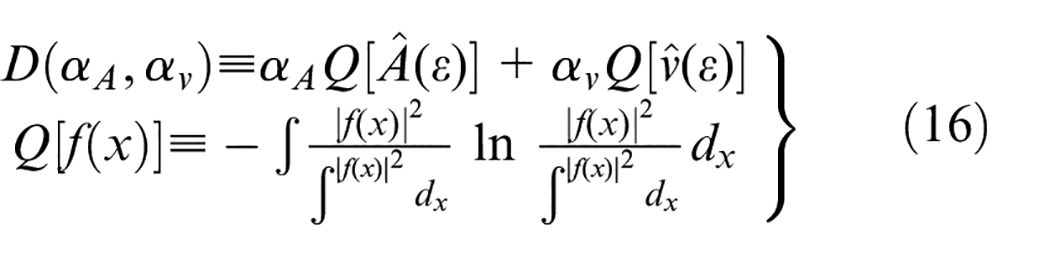
Where,
(1) Calculate the statistical characteristic quantity
(2) Create Ns Fourier transform alternatives, and calculate the corresponding
(3) If the confidence level of
NMD flow chart.
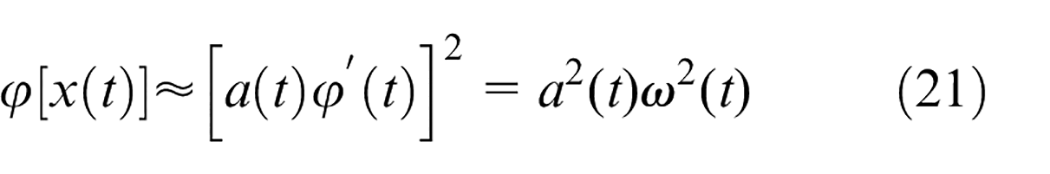
Basic theory of Teager energy operator
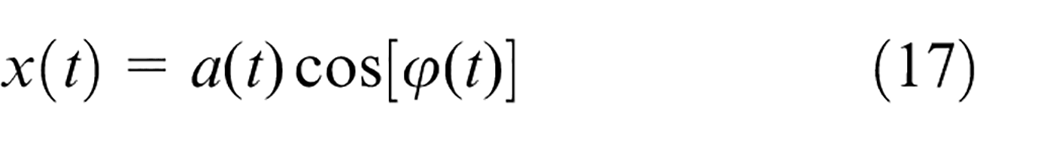
The Teager energy operator is a non-linear operator, and the energy operator method is developed on the signal form of equation (17):
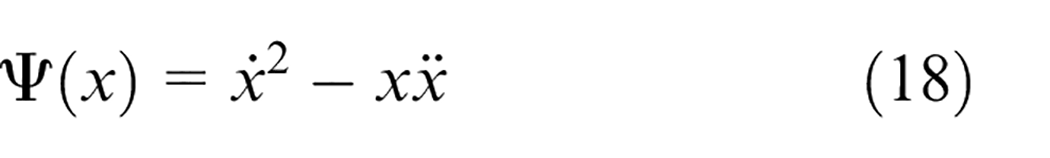
An energy operator is defined as follows:
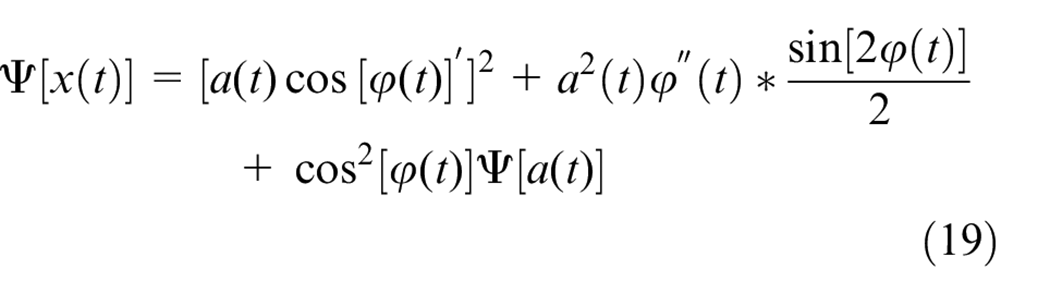
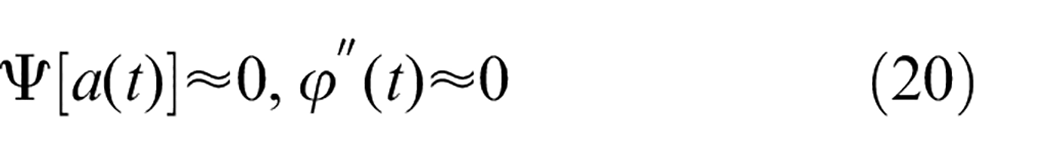
In general, the variation of the modulated signal is much slower than that of the carrier signal, so the amplitude-frequency value can be treated approximately as a constant. Thus there are:
In the same way:
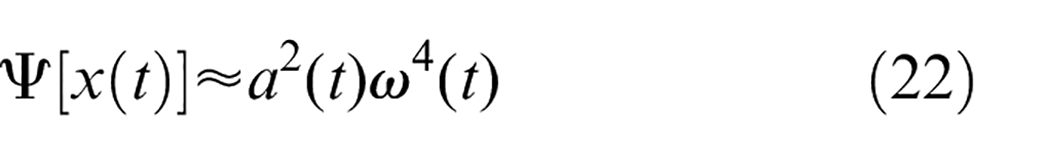
The instantaneous amplitude and phase of the modulated signal are:
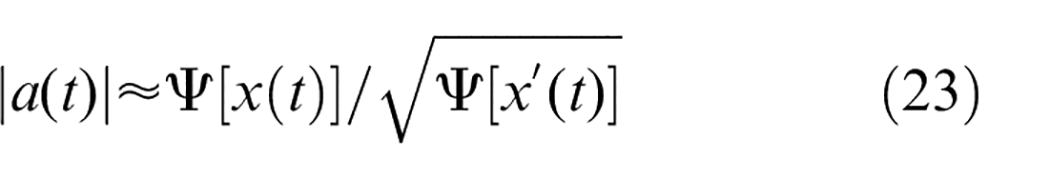
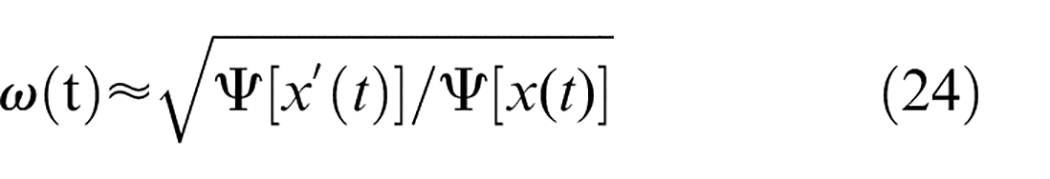
Therefore, this method can be used to demodulate and analyze the signal.
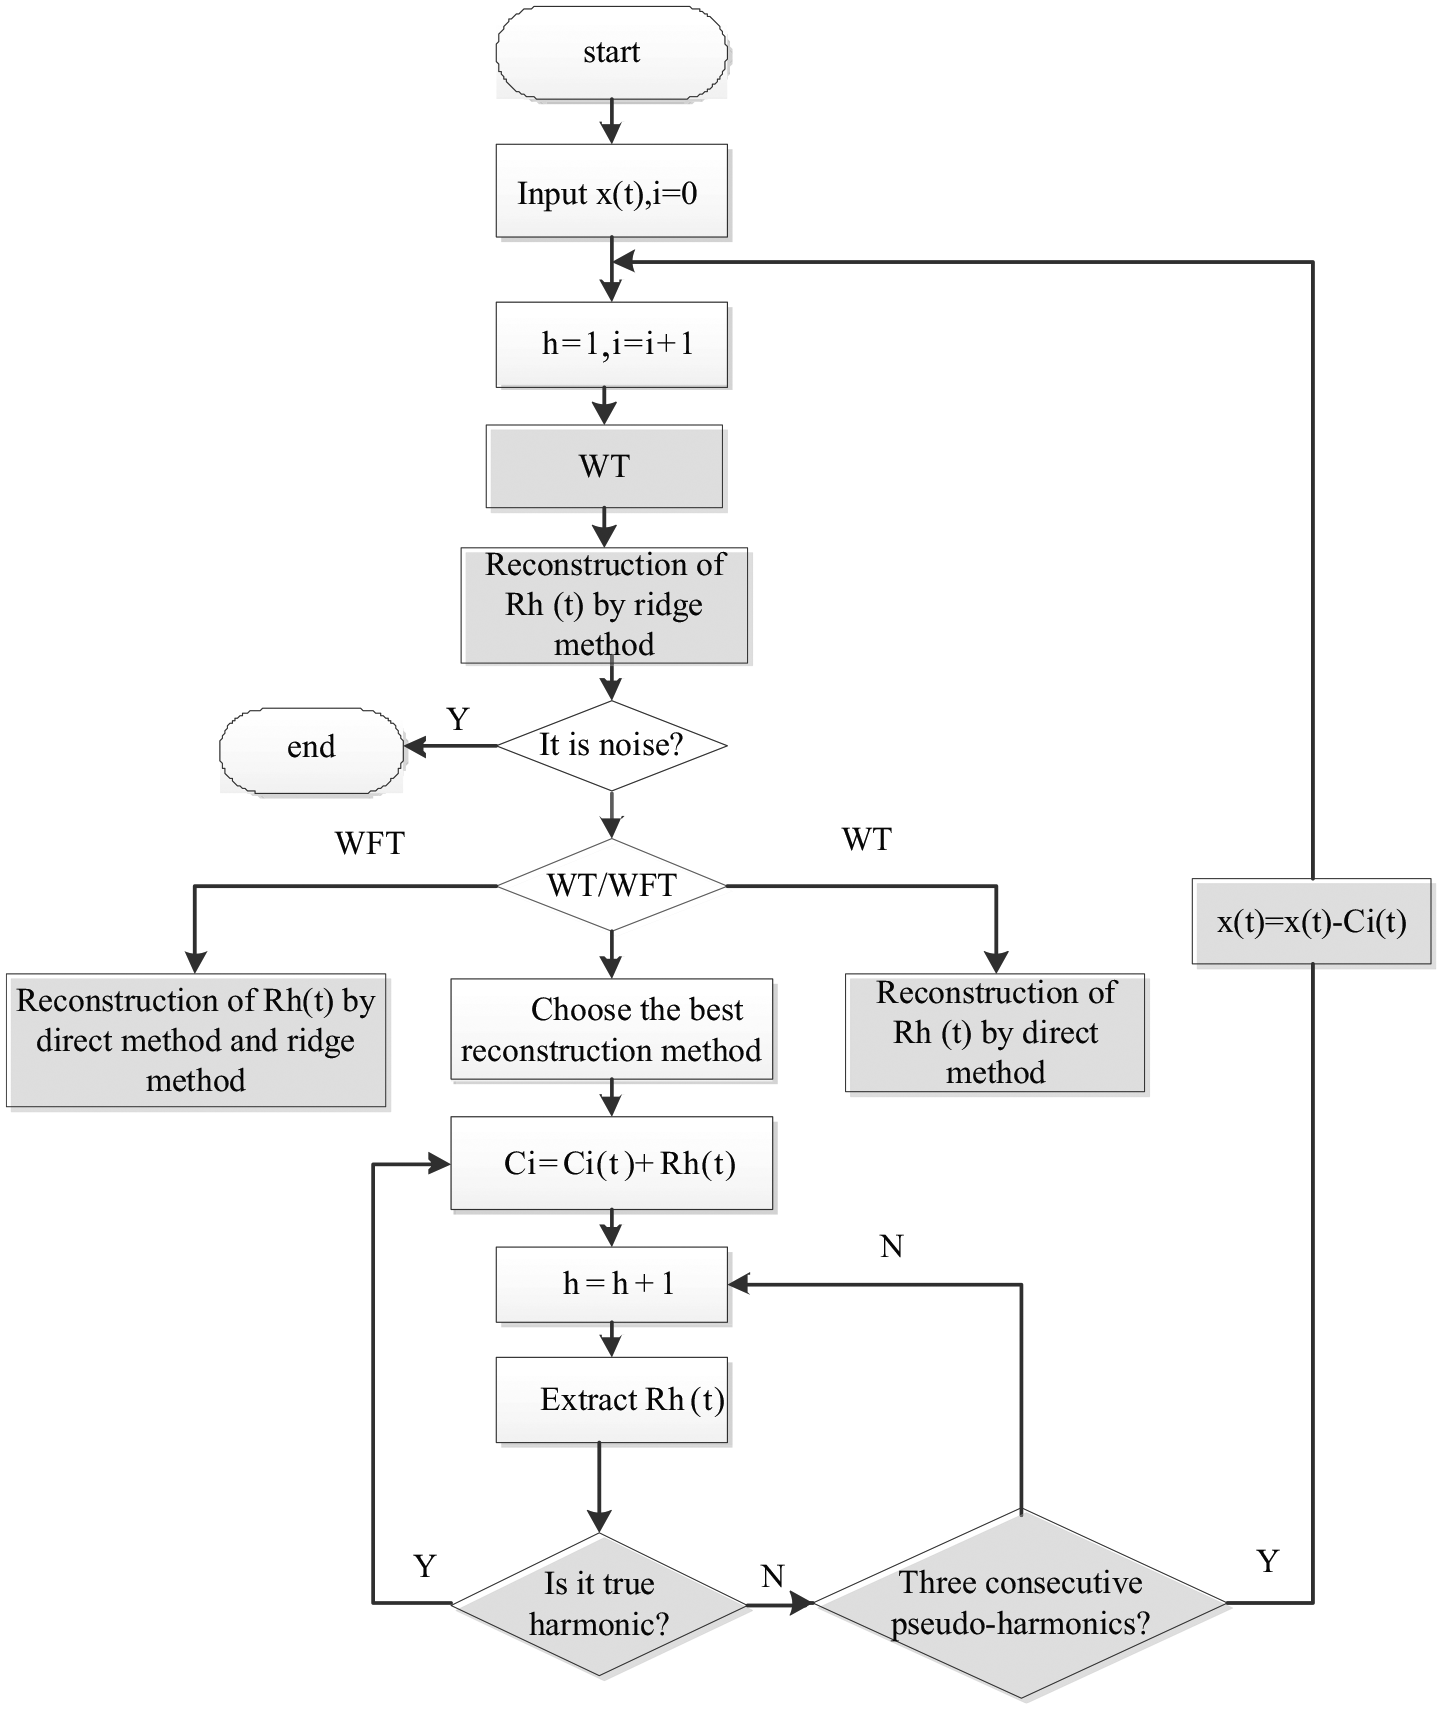
In this paper, NMD method and Teager energy operator demodulation method are combined to perform NMD decomposition for composite fault signals, and then Teager energy operator demodulation for decomposed signals. At the same time, it is compared with EMD and EEMD. The specific fault diagnosis process is shown in Figure 2.
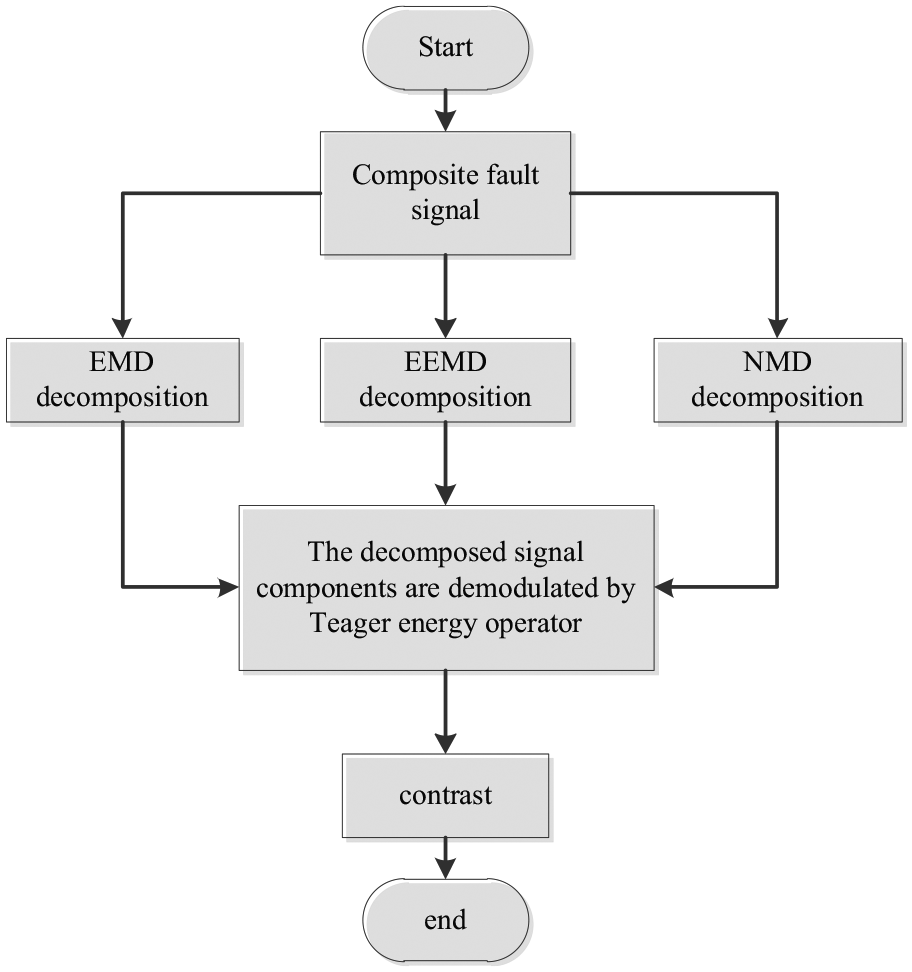
Flow chart of composite fault diagnosis.
Simulation analysis
This paper compares NMD with EMD and EEMD to verify the advantages of NMD. In the paper, the sum of two Am and FM signals and one random signal is selected for simulation analysis. The simulated signals and components are as follows:
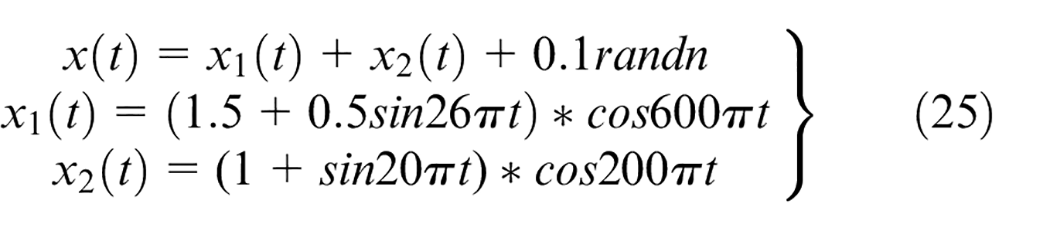
Among them,
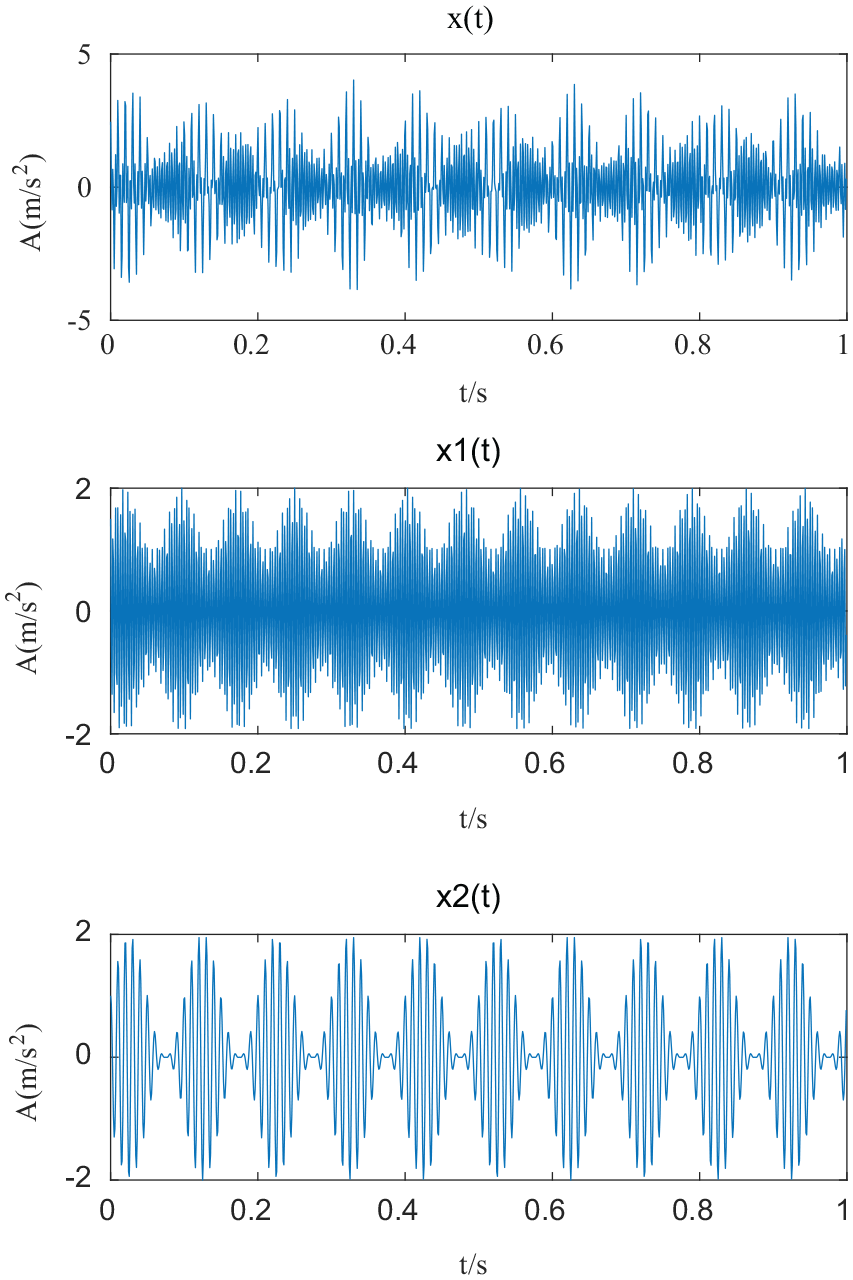
Simulated signal and two component time-domain waveforms.
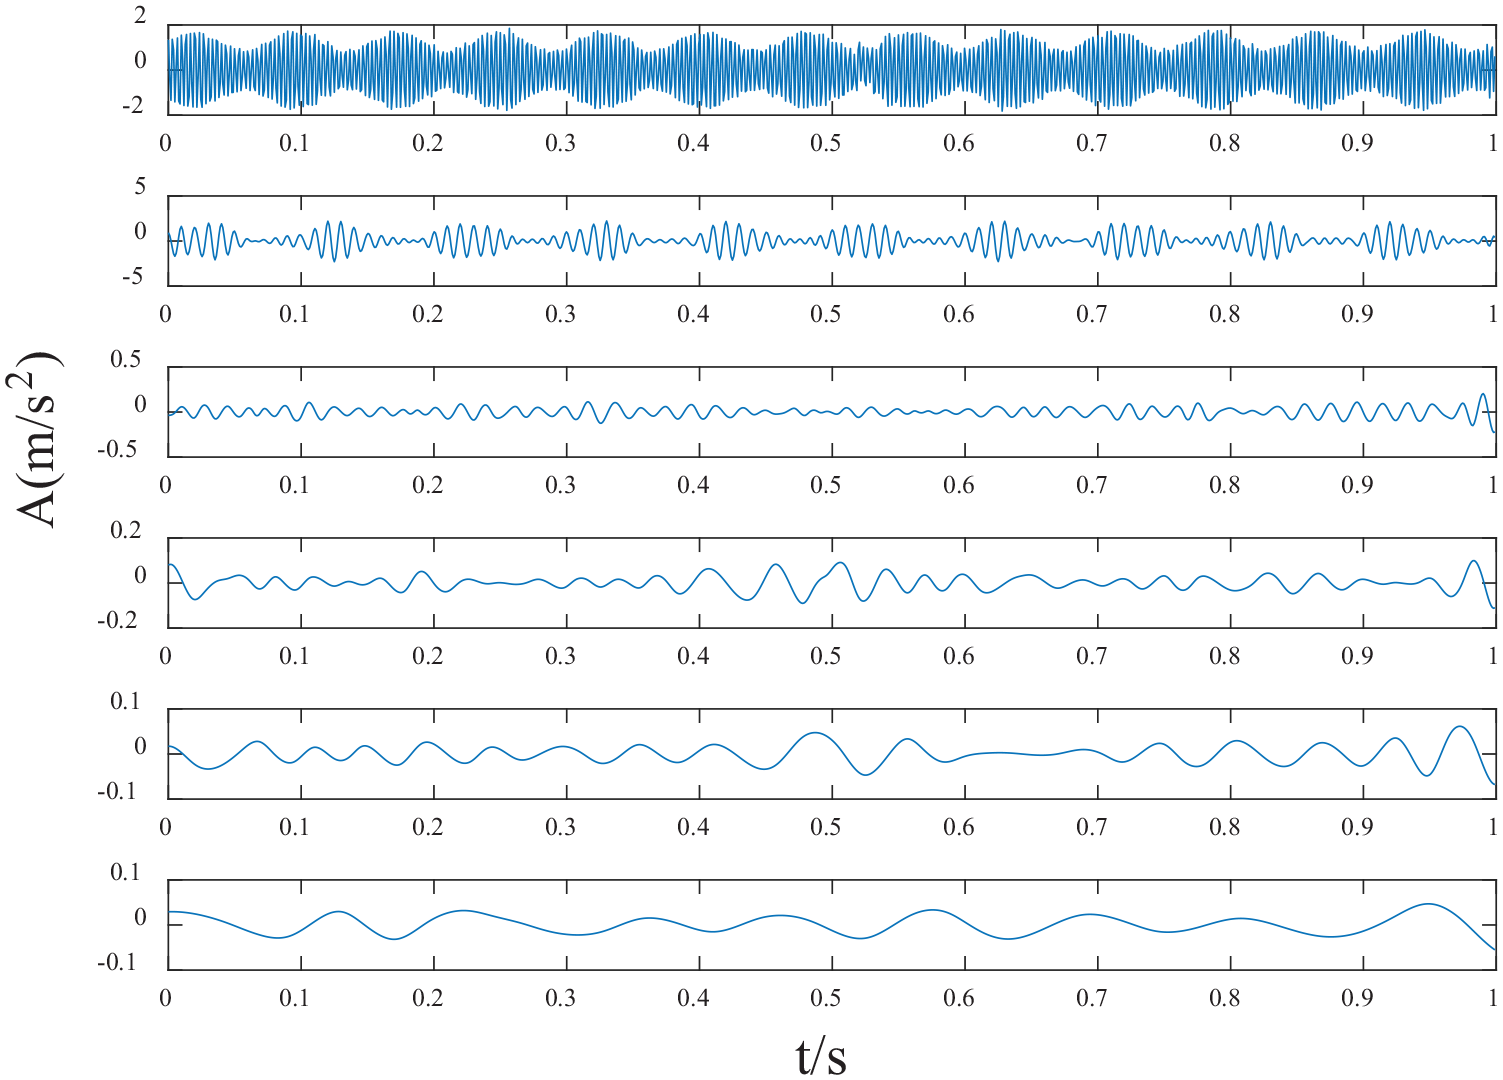
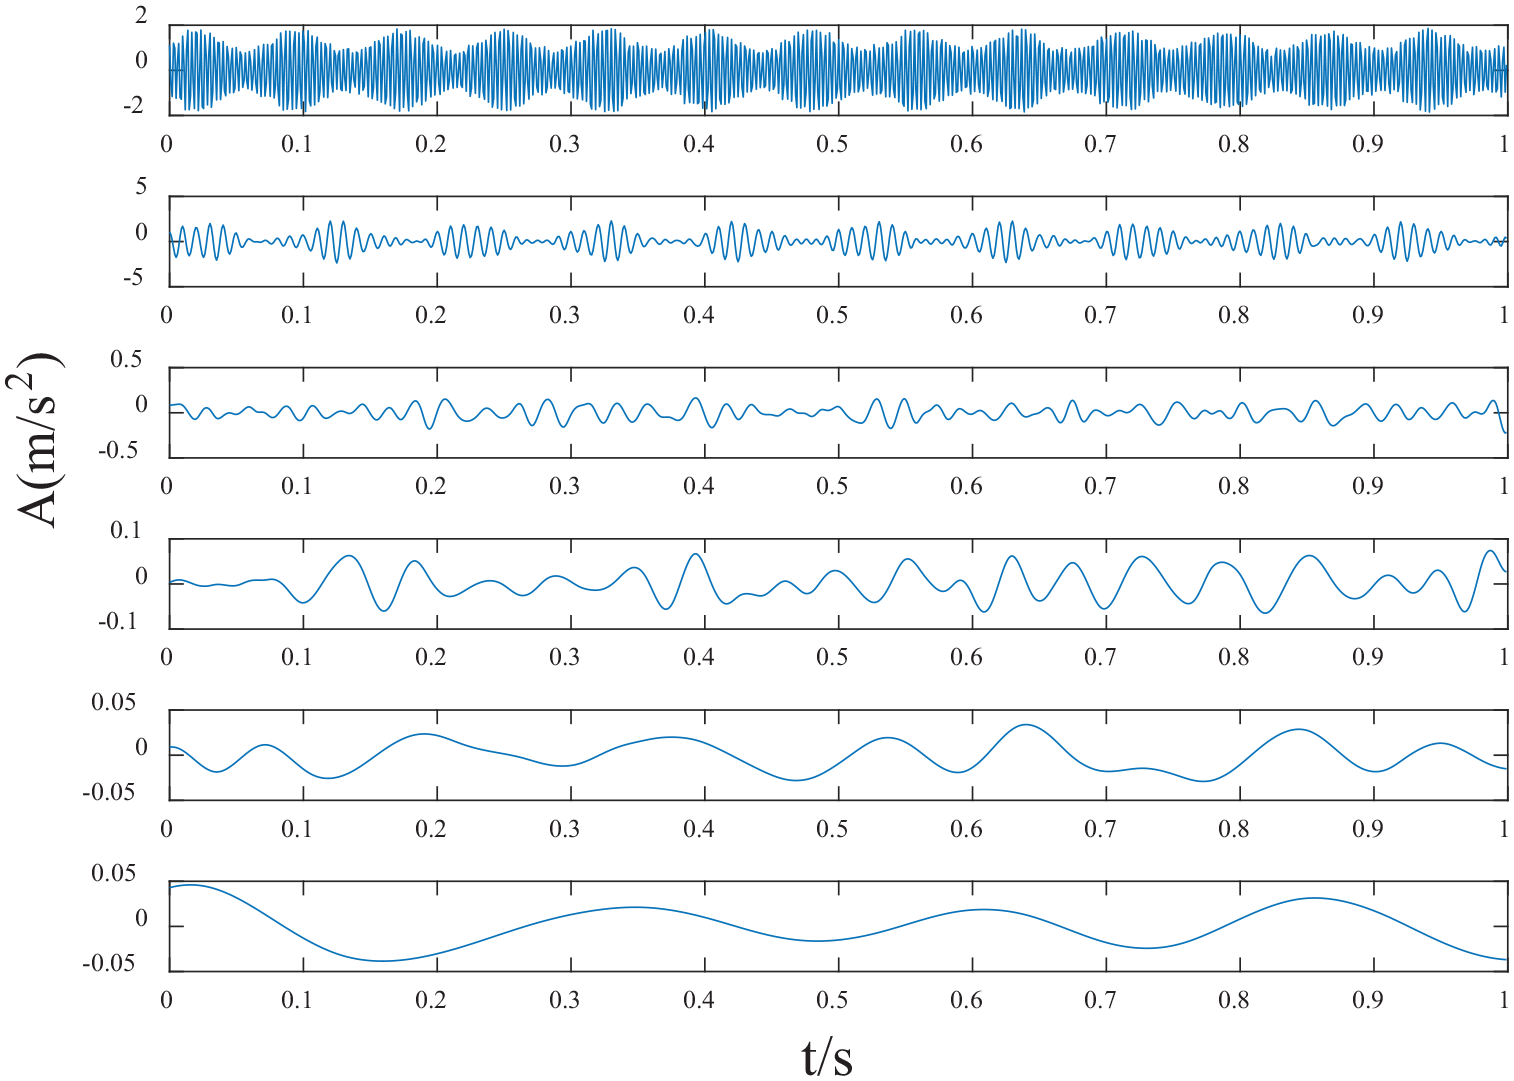
Next, the NMD, EMD, and EEMD decompositions are performed on the simulation signals. Their decomposition results are shown in Figures 4 to 6 respectively.
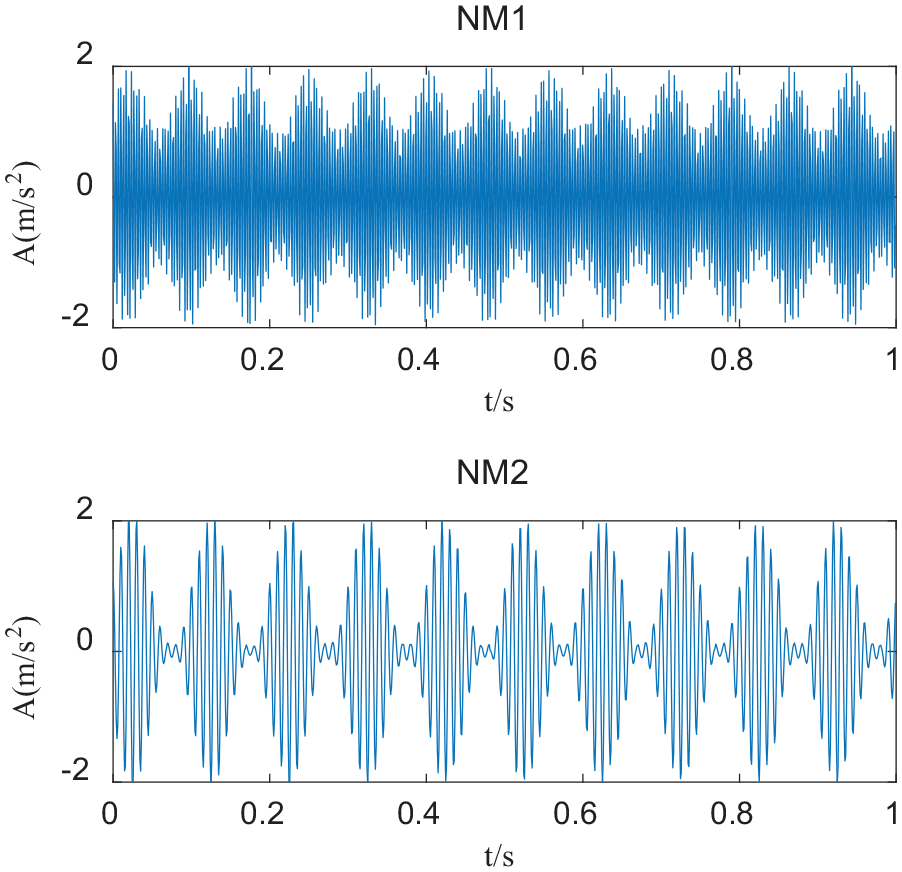
NMD simulation signal decomposition results.
EMD simulation signal decomposition results.
EEMD simulation signal decomposition results.
It can be seen from the decomposition results that NMD only decomposes the simulated signal into two NM components. There are no redundant other components. The decomposed NM1 and NM2 correspond to the simulation signals X1 and X2 respectively, and are basically consistent. However, after EMD decomposition, we can actually get more components, six of which are IMF1–IMF6, among which IMF4–IMF6 is basically meaningless. After EEMD decomposition, more components can be obtained, the first six are IMF1–IMF6, among which IMF4–IMF6 is basically a pseudo component, which has no practical significance. Therefore, from the perspective of the decomposition effect of simulation signals, the decomposition effect of NMD is indeed better than that of EMD and EEMD.
Next, the simulated components obtained from NMD, EMD and EEMD decomposition are demodulated by Teager energy operator respectively, obtain the NM simulation component demodulation spectrum (as shown in Figure 7), the IMF simulation component demodulation spectrum after EMD decomposition (as shown in Figure 8) and the IMF simulation component demodulation spectrum after EEMD decomposition (as shown in Figure 9). From the demodulation results of the NM simulation component and the demodulation results of the IMF simulation component decomposed by EMD and EEMD, it can be seen that the NM simulation component can be extracted to 1 and 2 times the characteristic frequency of the simulated signal fault, respectively. The IMF1 simulation component of EMD decomposition can be extracted to 1 frequency and 2 frequency, but the IMF2 simulation component of EMD decomposition can only be extracted to 1 frequency. The IMF1 simulation component of EEMD decomposition can also extract 1 and 2 times of frequency, but the IMF2 simulation component of EEMD decomposition can only extract 1 times of frequency. Although the demodulation results of EMD and EEMD simulation signal components can also get fault characteristic frequency, the number of peak points is less, and the phenomenon of mode aliasing occurs in the demodulation spectrum of EMD and EEMD simulation components. Therefore, the demodulation results show that the decomposition effect of NMD is indeed better than EMD and EEMD, and it can effectively suppress the phenomenon of modal aliasing, the decomposition and demodulation results of the simulated signal illustrate the advantages of the NMD method. Therefore, this paper uses the decomposition method of NMD.
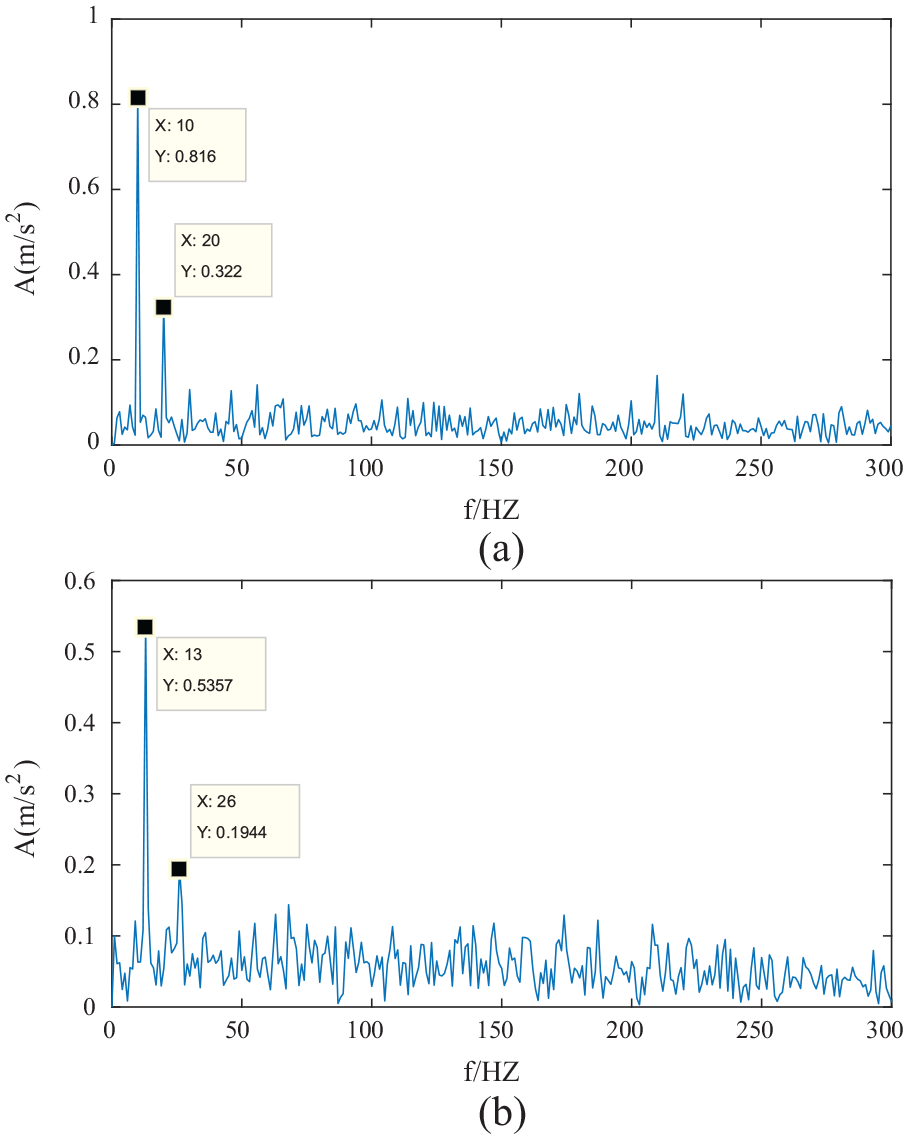
Demodulation spectrum of NM simulation component: (a) demodulation spectrum of NM1 simulation component and (b) demodulation spectrum of NM2 simulation component.
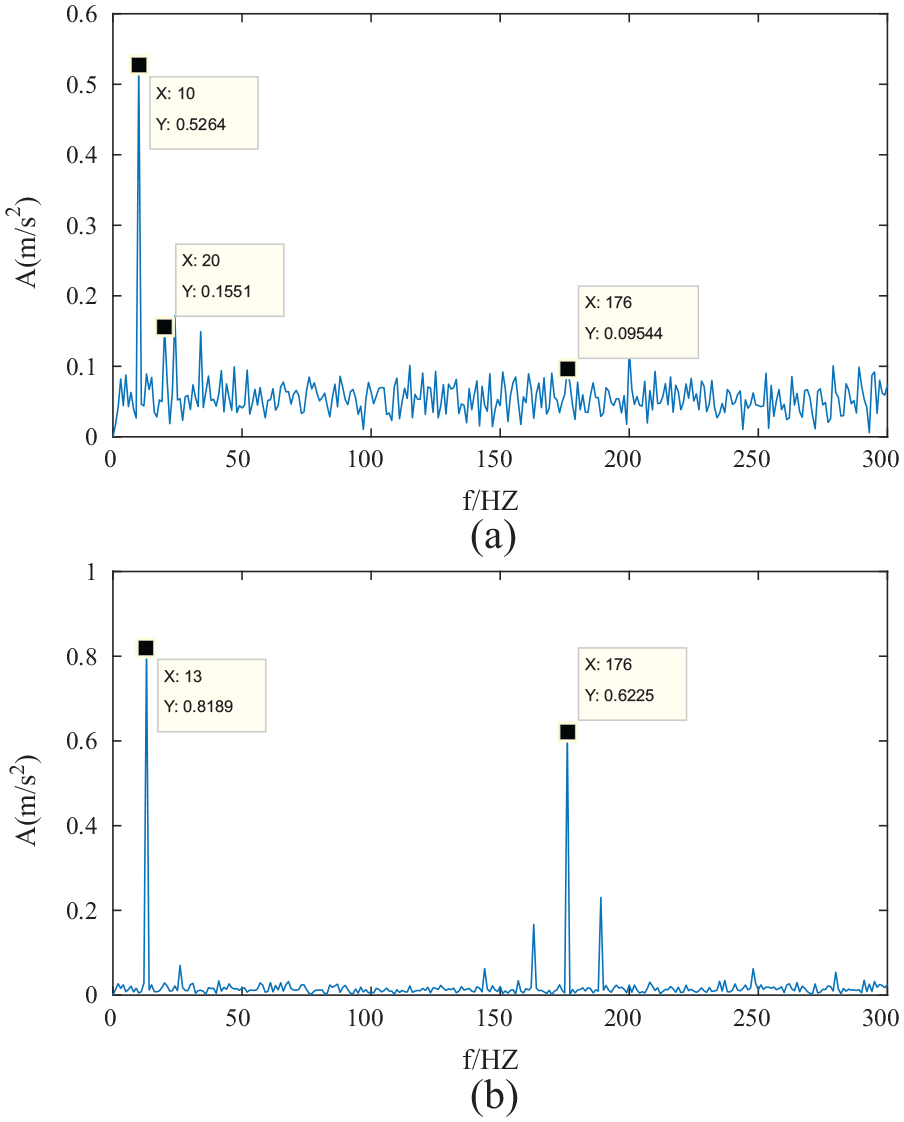
Demodulation spectrum of IMF simulation component decomposed by EMD: (a) demodulation spectrum of IMF1 simulation component decomposed by EMD and (b) demodulation spectrum of IMF2 simulation component decomposed by EMD.
Demodulation spectrum of IMF simulation component decomposed by EEMD: (a) demodulation spectrum of IMF1 simulation component decomposed by EEMD and(b) demodulation spectrum of IMF1 simulation component decomposed by EEMD.
Experimental analysis of gearbox composite fault diagnosis
NMD, EMD, and EEMD methods are compared and applied to the complex fault diagnosis of gear-gear transmission system respectively, so as to verify the effectiveness of this method in practical application. The equipment model used in the experiment is HFXC-I. The experimental equipment is shown in Figure 10. By manual setting, it is set up as a composite failure of pitting of big gear and wear of small gear. The acceleration sensor is used in the experiment, and the experiment is carried out under the load of 0.2 A, the sampling time is 2 S, the sampling frequency is 5120 Hz, and the measured speed is n = 825 r/min. The number of teeth of the small gear and the large gear is
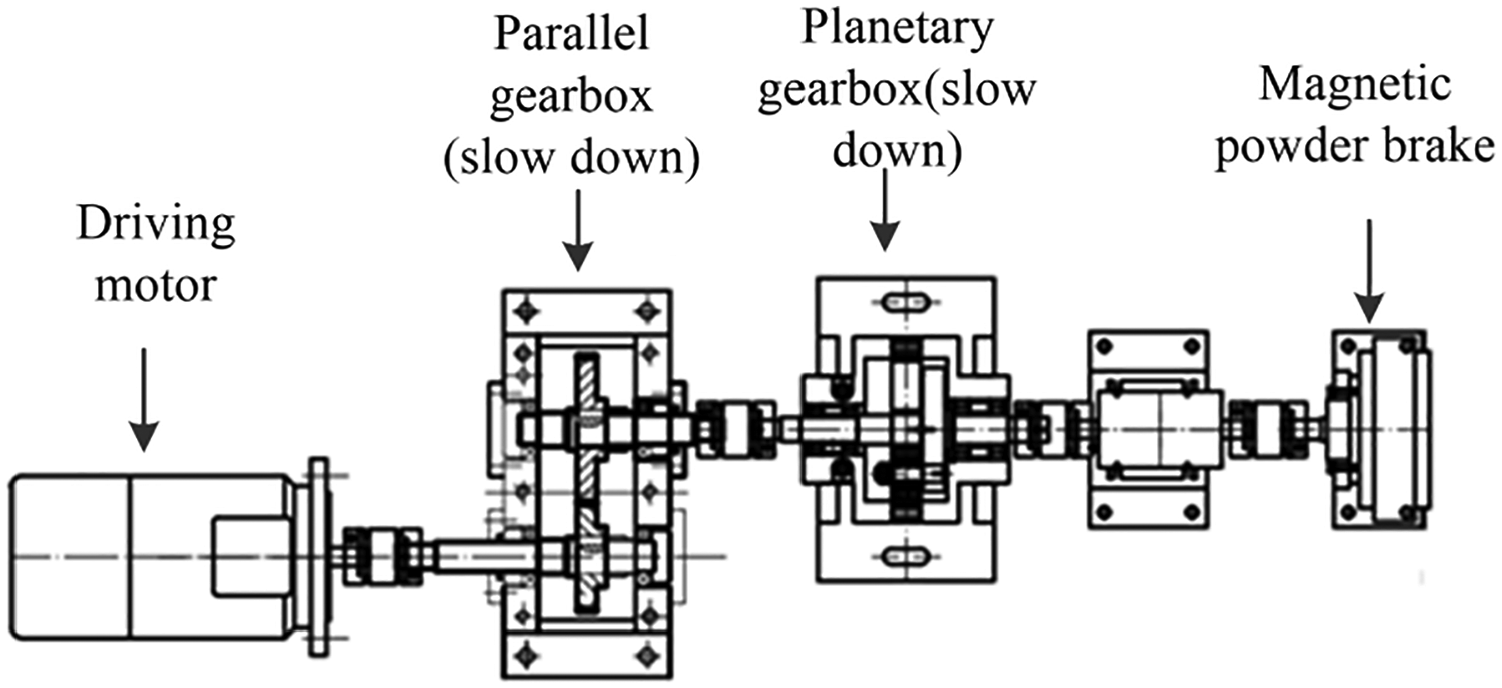
Experimental equipment diagram.
The original composite fault signals were decomposed by EMD, EEMD and NMD methods, and the first two signals obtained by the decomposition of EMD and EEMD were taken, namely, IMF1 and IMF2, The results are shown in Figures 11 and 12, NMD decomposition results in two NM components as shown in Figure 13. Then the signals IMF1 and IMF2 obtained from the decomposition of EMD and EEMD were demodulated by Teager energy operator respectively and the demodulation results of the EMD decomposed signal is shown in Figure 14, and the demodulation results of the EEMD decomposed signal is shown in Figure 15. Then the two NM components obtained by NMD decomposition are demodulated by Teager energy operator, and the demodulation results is shown in Figure 16.
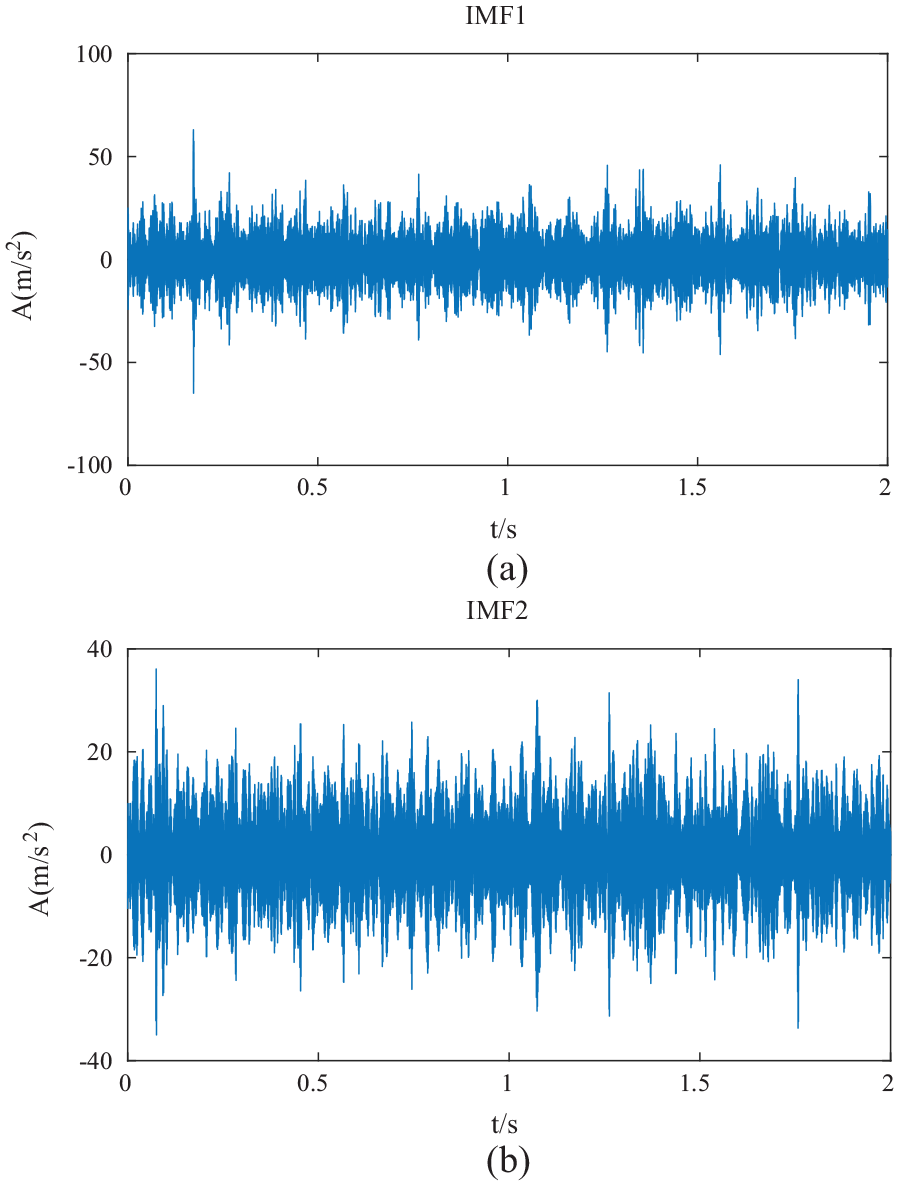
Time domain diagram of IMF components decomposed by EMD: (a) time domain diagram of IMF1 components decomposed by EMD and (b) time domain diagram of IMF2 components decomposed by EMD.
Time domain diagram of IMF components decomposed by EEMD: (a) time domain diagram of IMF1 components decomposed by EEMD and (b) time domain diagram of IMF2 components decomposed by EEMD.
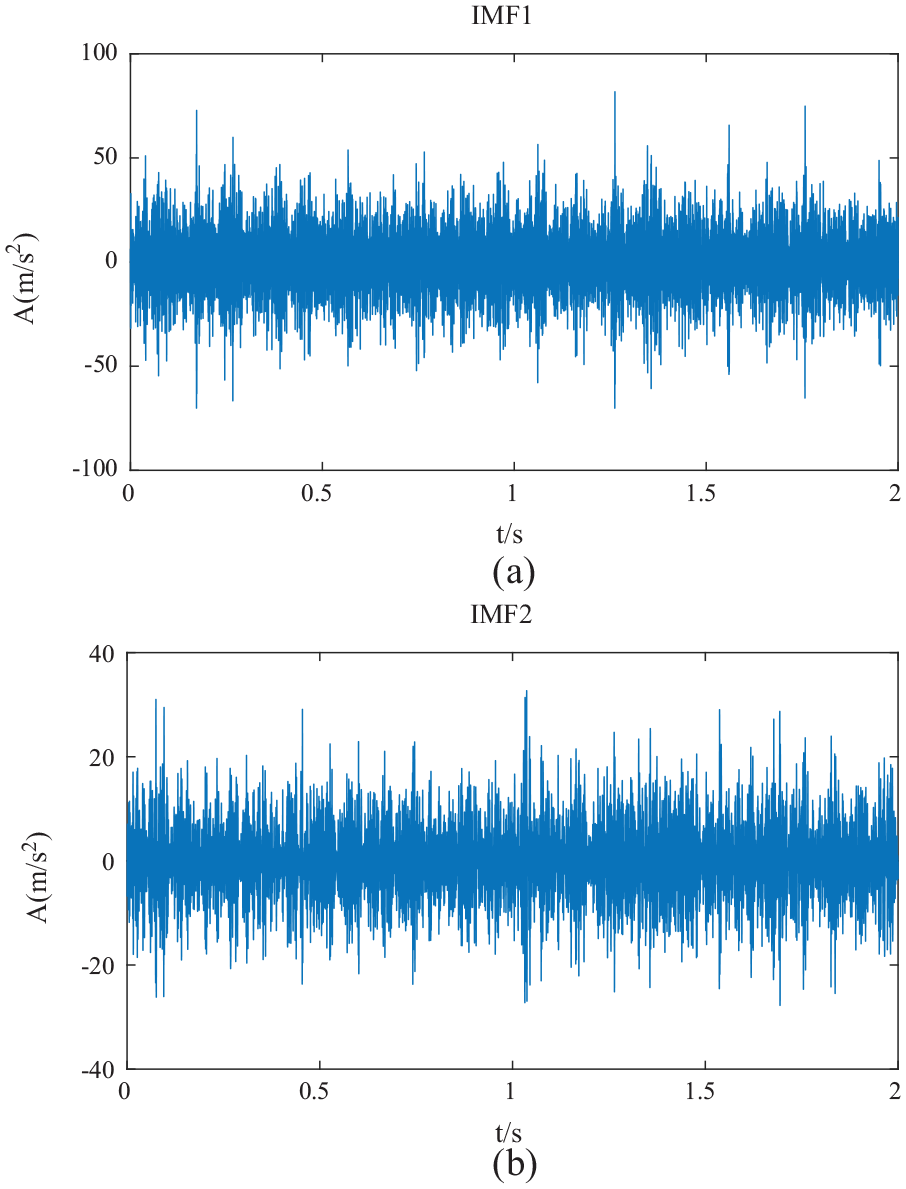
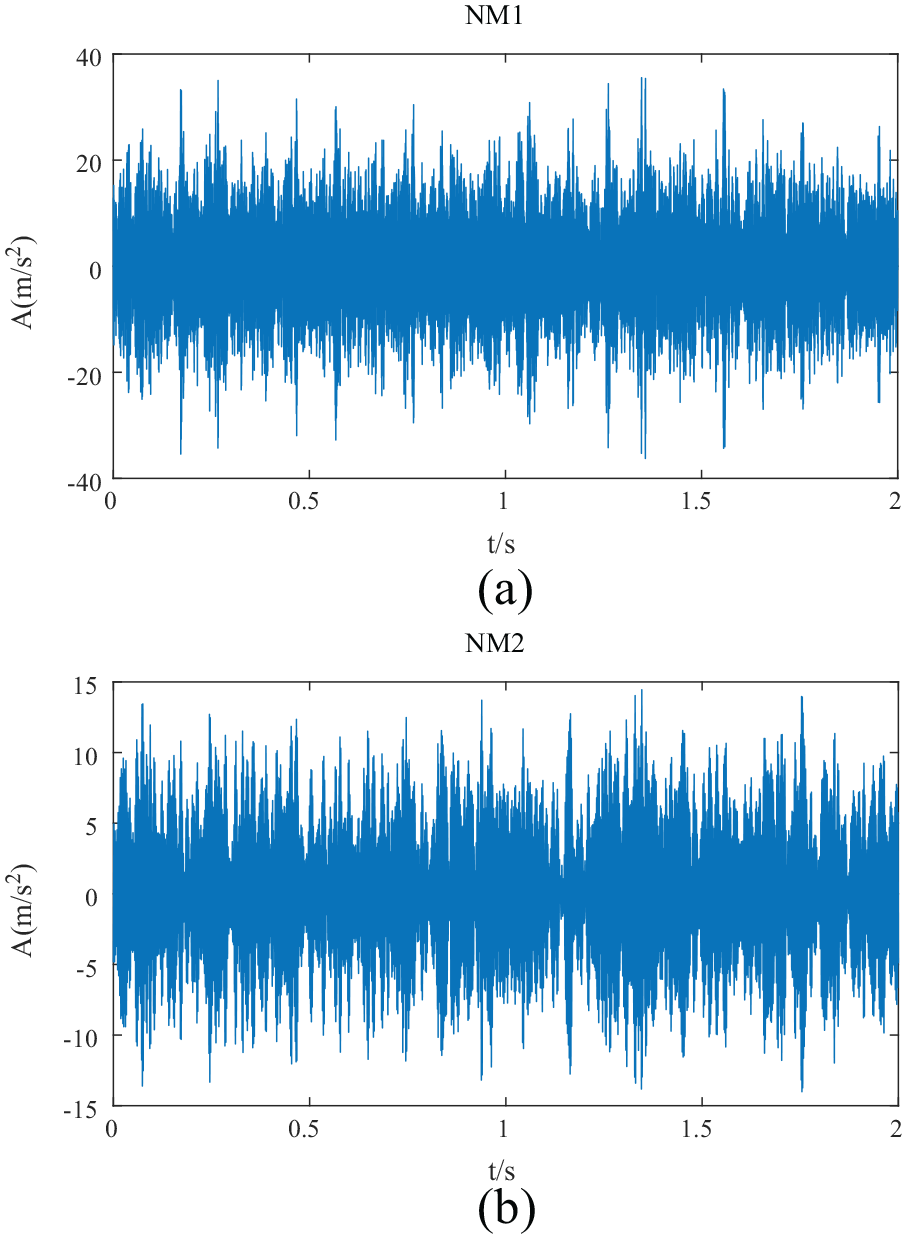
NM component time domain waveform: (a) NM1 component time domain waveform and (b) NM2 component time domain waveform.
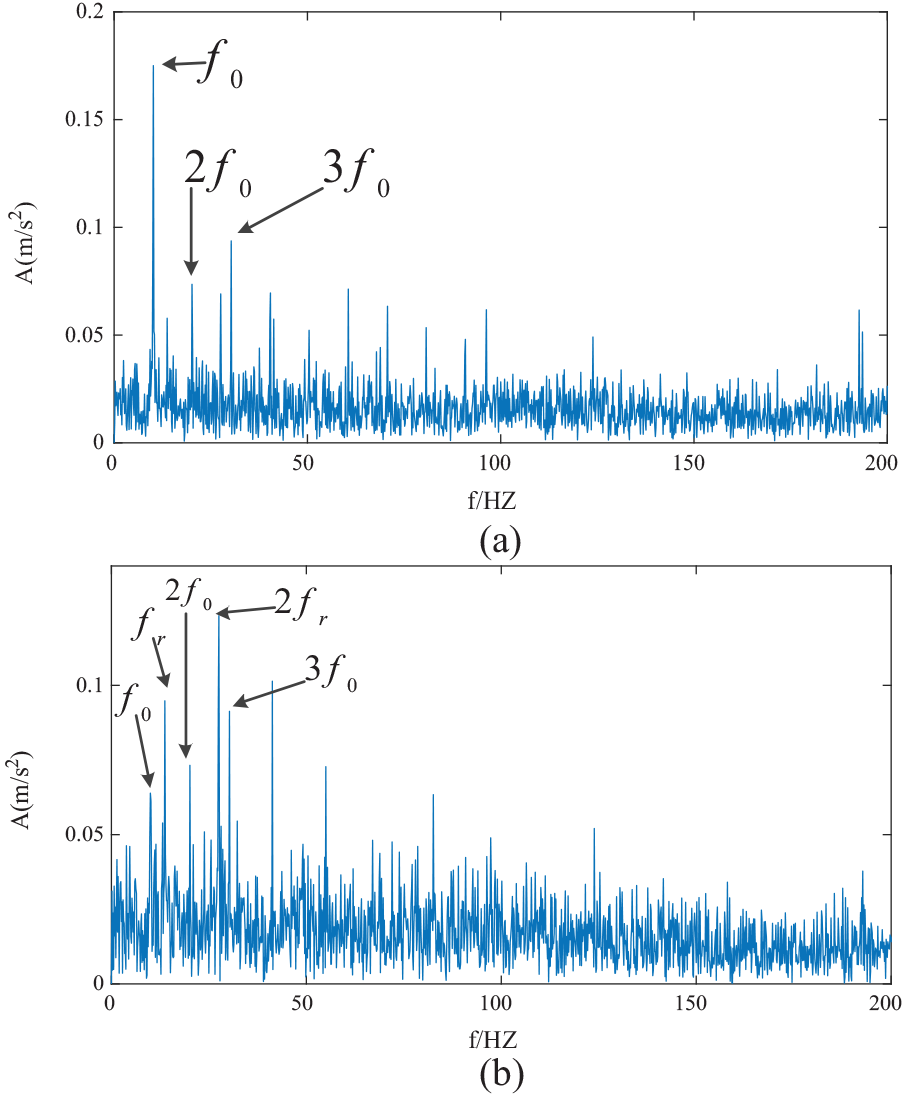
Demodulation spectrum of IMF components decomposed by EMD: (a) demodulation spectrum of IMF1 component of EMD decomposition and (b) demodulation spectrum of IMF2 component of EMD decomposition.
Demodulated spectrum of IMF component of EEMD decomposition: (a) demodulation spectrum of IMF1 component of EEMD decomposition and (b) demodulation spectrum of IMF1 component of EEMD decomposition.
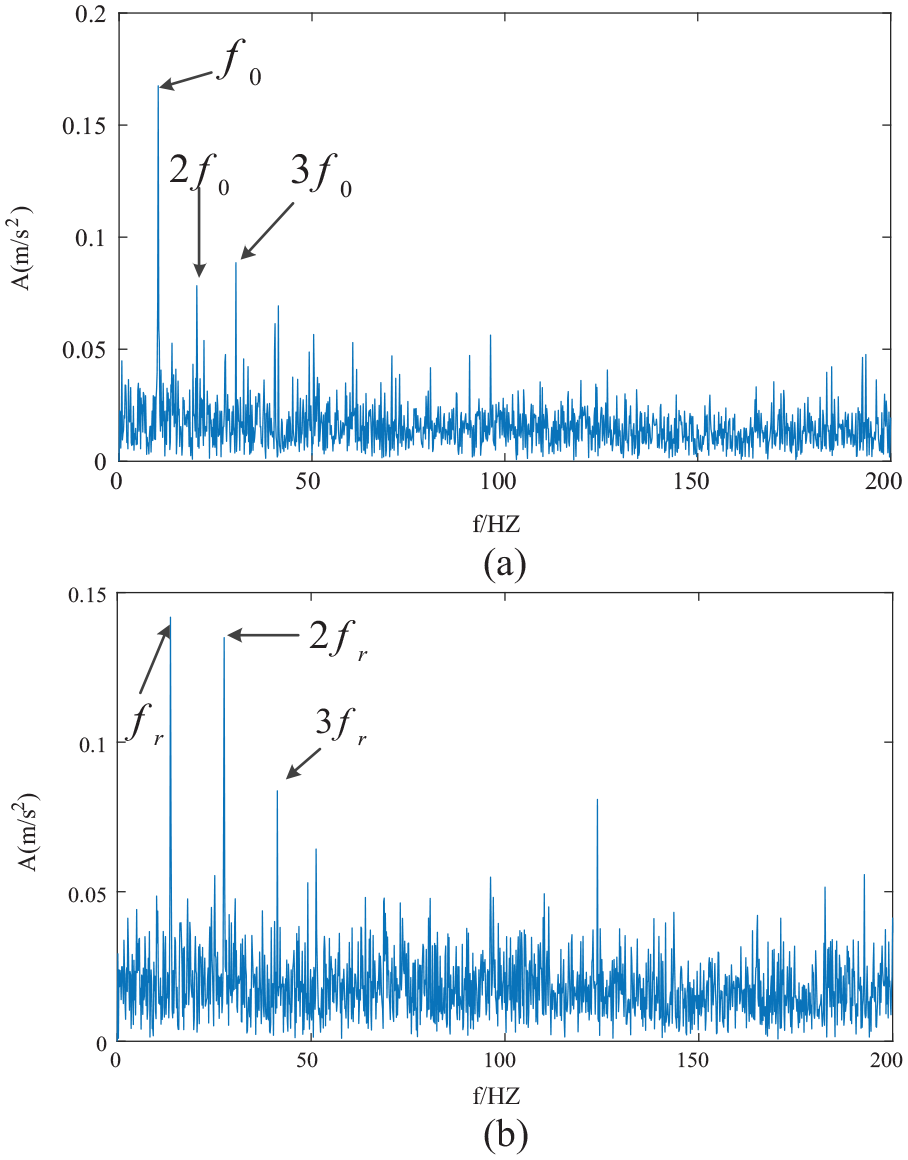
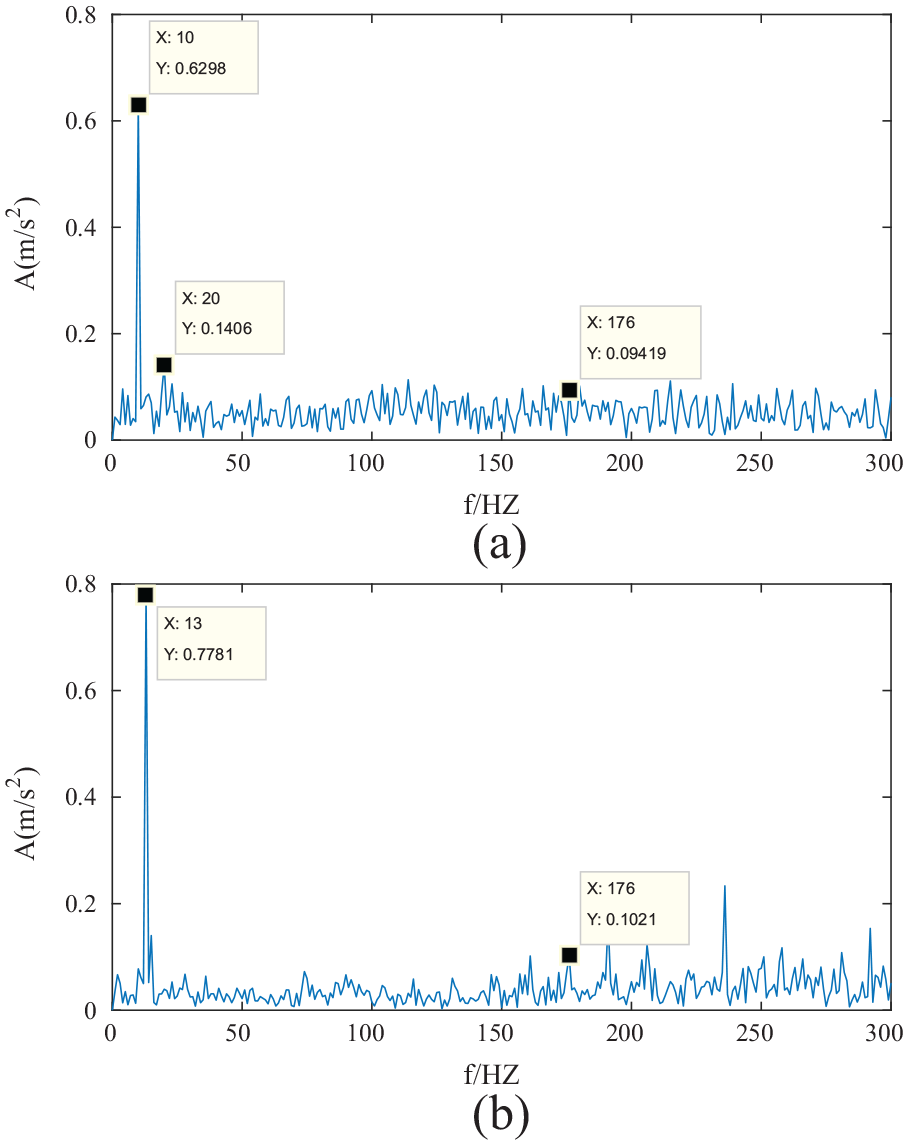
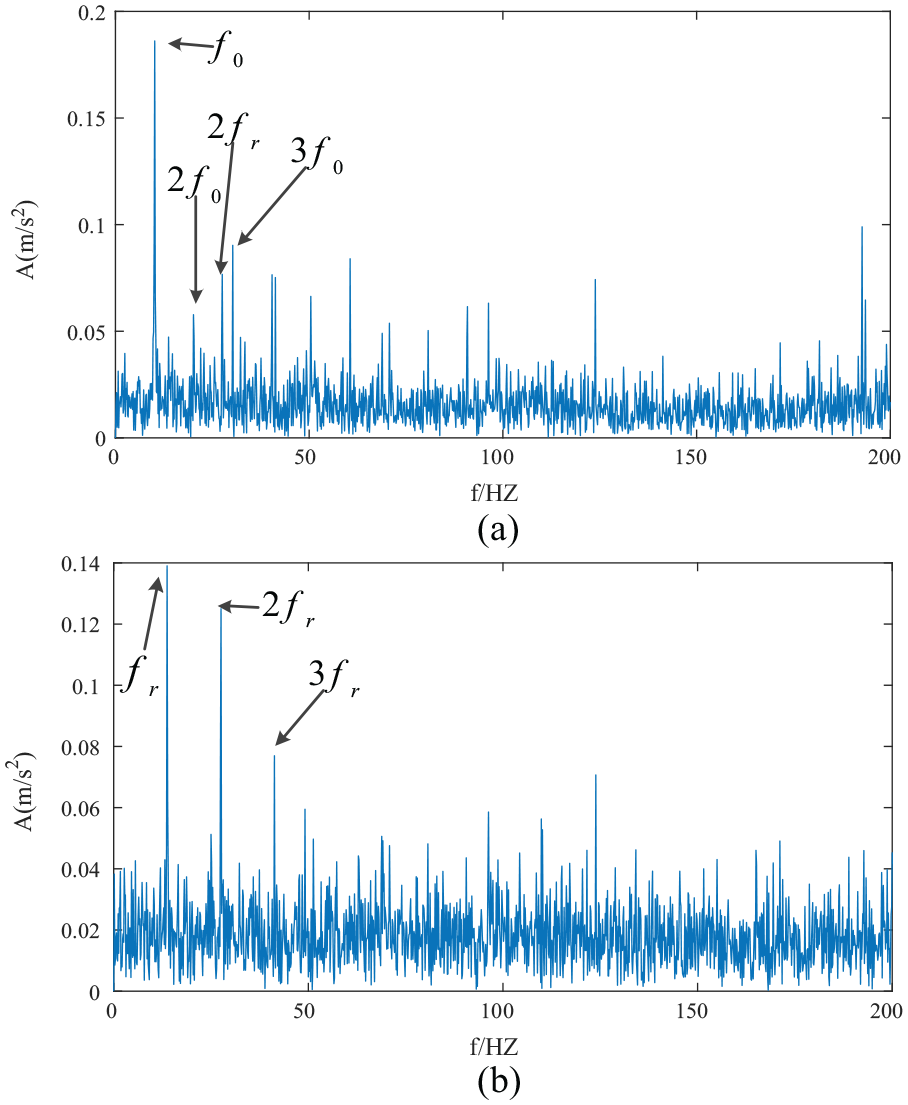
NM component demodulation spectrum: (a) NM1 component demodulation spectrum and (b) NM2 component demodulation diagram
As shown in Figure 14(a), the demodulation results of the IMF1 component after EMD decomposition only extracted the 1-fold, 2-fold, and 3-fold frequency of the characteristic frequency of the large gear. As shown in Figure 15(a), the demodulation spectrum of IMF1 component decomposed by EEMD extracts the 1-fold frequency, 2-fold frequency, and 3-fold frequency of large gear fault feature frequency, and the 2-fold frequency of small gear fault feature frequency. As shown in Figure 16(a), the NM1 demodulation spectrum only extracted the 1-fold, 2-fold, and 3-fold frequency of the characteristic frequency of the large gear. The demodulation results show that EMD and NMD can extract the 1-fold, 2-fold, and 3-fold frequency of the fault feature frequency of large gear. Although EEMD can also extract the 1-fold, 2-fold, and 3-fold frequency of the fault feature frequency of large gear, it also extracts the 2-fold frequency of the fault feature frequency of small gear, which shows that EEMD cannot extract the fault feature frequency of large gear alone. As shown in Figure 14(b), the demodulation results of imf2 component after EMD decomposition extract the 1-fold and 2-fold frequency of pinion fault feature frequency, and extract the 1-fold, 2-fold, and 3-fold frequency of large gear fault feature frequency. As shown in Figure 15(b), the demodulation spectrum of IMF2 component after EEMD decomposition only extracted the 1-fold, 2-fold, and 3-fold the fault characteristic frequency of pinion. As shown in Figure 16(b), the NM2 demodulation spectrum only extracted the 1-fold, 2-fold, and 3-fold frequency of the characteristic frequency of the pinion. The demodulation results show that the EEMD and NMD methods can extract the fault characteristic frequency of the pinion. The effect is better than the EMD method.
Therefore, through the comparative analysis of the demodulation results, we can know that the EMD method can extract the fault feature frequency of the large gear separately, but it can’t extract the fault feature frequency of the small gear separately. The EEMD method can extract the fault characteristic frequency of the small gear, but it cannot extract the fault characteristic frequency of the large gear. It shows that the EMD and EEMD methods cannot effectively extract the fault characteristic frequency of the large and small gears separately. NMD method can not only extract the fault feature frequency of small gear, but also the fault feature frequency of big gear. The superiority of NMD method is illustrated. The NMD method can separate the fault characteristic frequency of the gears separately. It shows that the NMD method is better than the EMD and EEMD methods. Therefore, NMD method is suitable for composite fault diagnosis of gear transmission system, and the effect is good.
Conclusion
The structure of gear transmission system is complex, and it is easy to be affected by noise and other external factors, so it is not easy to extract fault feature frequency and identify fault type. Therefore, this paper proposes a method of Composite Fault Feature Extraction Based on the combination of nonlinear mode decomposition (NMD) and Teager energy operator.
Through comparative analysis with EMD and EEMD methods, it can be seen that the composite fault feature extraction method combining the nonlinear mode decomposition (NMD) and Teager energy operator proposed in this paper effectively suppresses the modal aliasing phenomenon.
Through the analysis of simulation signals and experimental data, we can see that the method proposed in this paper can effectively extract the composite fault characteristics and accurately identify the fault type. The validity of the proposed method is verified.
The proposed method has strong noise robustness and can effectively eliminate modal aliasing. This paper can effectively identify and extract the composite fault features of gear pitting wear. However, the correctness and accuracy of composite fault diagnosis of other mechanical equipment need to be further explored.
Footnotes
Acknowledgements
The authors gratefully acknowledge the support of project funded by the Science and Technology Research Projects of Education Department of Liaoning Province of China (LG201921), Liaoning BaiQianWan Talents Program (2020921031), Natural Science Foundation of Liaoning Province of China (2020-MS-216), State Key Laboratory of Mechanical Transmissions (SKLMT-KFKT-201605), and China Postdoctoral Science Foundation (2017M610496).
Declaration of conflicting interests
The author(s) declared no potential conflicts of interest with respect to the research, authorship, and/or publication of this article.
Funding
The author(s) received no financial support for the research, authorship, and/or publication of this article.