
Abstract
This paper investigated the flow performance around a near-wall cylinder and its effect on heat transfer enhancement in the laminar and early transitional flow region. The numerical model is resolved by finite volume method through FORTRAN code. The results show that the flow field becomes a transitional flow state when Re = 100 due to the insertion of a cylinder. In the transitional flow sate, the heat transfer enhancement is regional, mainly concentrating in the region of –2 ≤x/D≤ 10, and the region increases with the increase of Re; There are three or four peaks in the distribution of instantaneous local Nusselt number. The first peak is caused by the acceleration of the fluid between the cylinder and the bottom wall. The other peaks are caused by the interaction between the cylinder wake and the bottom wall boundary layer. The vortical structure induced by the periodic instability of the fluid in the transitional flow is the main factor for explaining the local heat transfer enhancement of the cylinder downstream wall. Re has a direct impact on the vortical structure in the flow field. The greater Re, the greater the heat transfer enhancement of the cylinder downstream wall. Under the same blocking ratio of D/H, the greater Re, the smaller the optimal clearance ratio of C/D. The guidelines are suggested for the design on heat dissipation of electronic equipment.
Keywords
Introduction
With the development of electrical and electronic equipment towards large capacity, high power, miniaturization, on one hand, the rejection heat per unit volume and the heat flux per unit area keep rising, on the other hand, the effective heat dissipation area is reducing continuously. Thus, it has important engineering significance on how to enhance the heat dissipation of electrical and electronics equipment, in order to avoid thermal failure by the high temperature, improve equipment reliability and prolong equipment life. Therefore, heat transfer enhancement on the wall has become a research focus. For example, changing the surface structure of the channel, roughening the surface, and adding longitudinal vortex generator, etc. are widely used. The basic principle of the above methods is to generate vortices near the wall, increasing the fluid mixing, and destroying the wall boundary layer, to enhance heat transfer. In small devices the fluid flow velocity and characteristic length are relatively small, Reynolds number is low, and the flow state usually is laminar flow.1–3 By using the appropriate vortex generation mechanism, the flow state can be changed to the transitional flow state, which is more advantageous for heat transfer, so as to effectively improve the heat transfer performance of such devices. The focus of this study is to insert a stationary circular cylinder near the wall as the longitudinal vortex generator, and to investigate the influence of the vortices on heat transfer and flow characteristics.
At present, the researches of the flow around the near wall cylinder mainly focus on the flow characteristics,4–9 while few on heat transfer enhancement, and the flow states mainly focus on laminar flow and turbulent flow.1,10–14 Fujita et al. 10 experimentally investigated the flow around a circular cylinder with different diameters from 3 mm to 5 mm, 8 mm and 10 mm, and with the clearance ratio ranged from 0 to 4.0 under Reynolds number of 7000. The distribution of the local average velocity, static pressure and wall heat transfer coefficient (HTC) along the wall were obtained. The results showed that blockage ratio (cylinder diameter), Reynolds number (fluid velocity or boundary layer thickness) and clearance ratio (cylinder insertion location) all have effect on the near-wall HTC, while the clearance ratio is the main factor. Suzuki et al. 11 obtained through experiments that the wall HTC, turbulent heat flux and Reynolds shear stress distribution of the turbulent flow around a near-wall cylinder under different clearance ratios. It was found that the main reason for the difference of heat transfer and momentum transfer was the interaction of the cold fluid flowing to the wall and the hot fluid flowing out of the wall. Wang and Zhao 12 numerically investigated the small-size cylinder as a vortex generator inserted into the fully developed turbulent boundary layer. The results showed the mutual effect between the cylinder wake and the wall boundary layer could significantly alter the flow structure of the turbulent boundary layer, leading to heat transfer enhancement. Cheraghi et al. 1 made a numerical simulation on the flow and heat transfer characteristics at Re = 100, 0.1 ≤Pr≤ 10 and a blockage ratio of D/H = 1/3, obtained the wall Nusselt number distribution and pressure loss distribution, and concluded that it is beneficial for the wall heat transfer with the stationary cylinder as a vortex generator when the Prandtl number was low. Meis et al. 13 numerically investigated circular/elliptical vortex promoters in a 2D, laminar flow in a micro-channel. Some design guidelines were obtained based on the blockage ratio, the Reynolds number, and the relative position and orientation of the obstacle. In addition, there are many literatures about the effect of oscillating or rotating circular cylinder as vortex generator on the wall heat transfer enhancement.14–20
From the above analysis, it can be seen that the numerical and experimental researches on this problem are primarily limited in the common flow states, such as laminar and turbulent flow, and most of them focus on the effects of the cylinder insertion location on the flow and heat transfer characteristics. As the transition flow is a kind of flow state between laminar flow and turbulent flow, and has periodic instability, which makes its heat transfer performance significantly better than laminar flow. However, the mechanism of the influence of periodic flow characteristics on heat transfer enhancement is still not very clear. Therefore, the aim of this present work is to examine the effects of the vortex structure on the wall heat transfer enhancement at different Reynolds number in the transitional flow. Firstly, the flow field and heat transfer characteristics are to be analyzed systematically under different Reynolds numbers in the transitional flow. Secondly, the mechanism of the effects of Reynolds numbers on the heat transfer enhancement of the wall will be studied as well. At last, the relationship between the optimal insertion position of the cylinder and Reynolds numbers is explained.
Numerical methods
Physical model and boundary conditions
A two-dimensional incompressible fluid flow channel with a cylinder inserted at a distance of 6 mm from the bottom wall, as shown in Figure 1, is considered as the simulation model in the present study. The calculation area is 54.5 D× 5D using the Cartesian coordinate system. The origin of coordinates is located at the projection of the cylinder center on the bottom wall. The X-axis direction is the direction of fluid flow, and the Y-axis direction is perpendicular to the direction of fluid flow. That is, the center of the cylinder is 14.5D from the upstream inlet boundary and 40D from the downstream outlet boundary. The blockage ratio D/H is used to represent the size of the cylinder, and C/D represents the insertion position of the cylinder, where D is the diameter of the cylinder, and C is the distance between the cylinder and the lower wall. In this study, C=6 mm, D = 10 mm, that is, C/D = 0.6, D/H = 0.2.
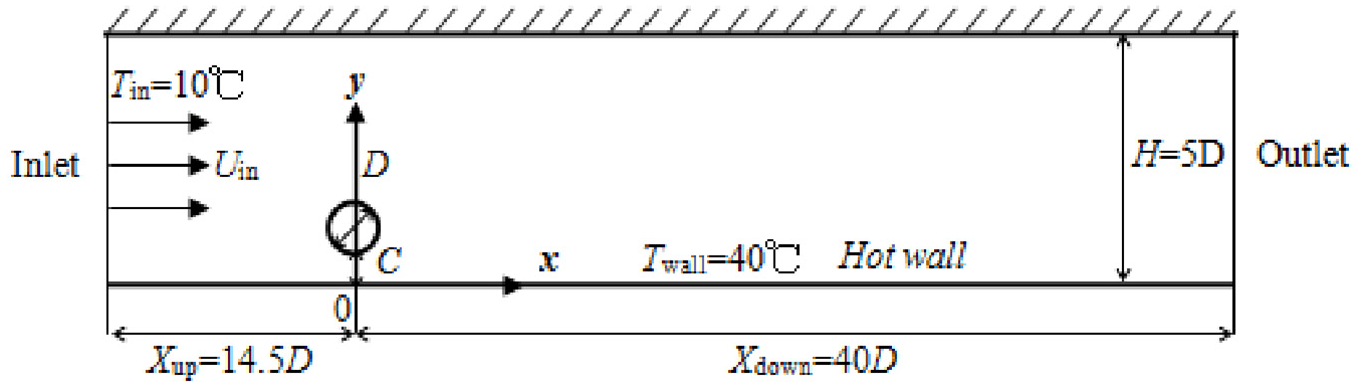
Computational domain.
The boundary conditions are described as follow:
- The fluid velocity Uin and temperature Tin at the inlet of the channel are uniform, and Tin = 10°C.
- The velocity and temperature fields at the channel outlet are assumed to obey the boundary layer approximation.
- The non-slip boundary conditions are adopted for all channel walls and the surface of the circular cylinder. The bottom wall is isothermally heated Twall = 40°C, and the other walls are adiabatic.
Governing equations
In this study, the constant properties of fluid (air) is assumed. A two-dimensional mathematical model is solved for incompressible, unsteady flow and temperature fields around a near-wall circular cylinder. The following governing equations with time term are adopted as shown in equations (1)–(4).
Continuity equation:
Momentum equations:

Energy equation:
The above mentioned governing equations set are resolved by finite volume method in FORTRAN code.21–23 The convective terms in the momentum equations are discretized by the QUICK scheme. The fully implicit forms of the finite difference equations are solved by using ADI method at each time step. Pressure correction calculations are solved with SIMPLE algorithm in the iteration program.
In addition, Reynolds number Re, the local Nusselt number, Nu, and the local friction coefficient, Cf, along the bottom wall are defined by equations (5)–(7).
Mesh generation and independence validation
As shown in Figure 2, the composite grid systems is applied to mesh the computational domain.21–22 The main grid adopts rectangular coordinate system to describe the computing area except the cylinder and its edge, while the sub grid adopts polar coordinate system to describe the area around the cylinder. The two grids systems overlap on the surface of the cylinder and the information can be transferred to each other. The main and auxiliary grids are generated unevenly.
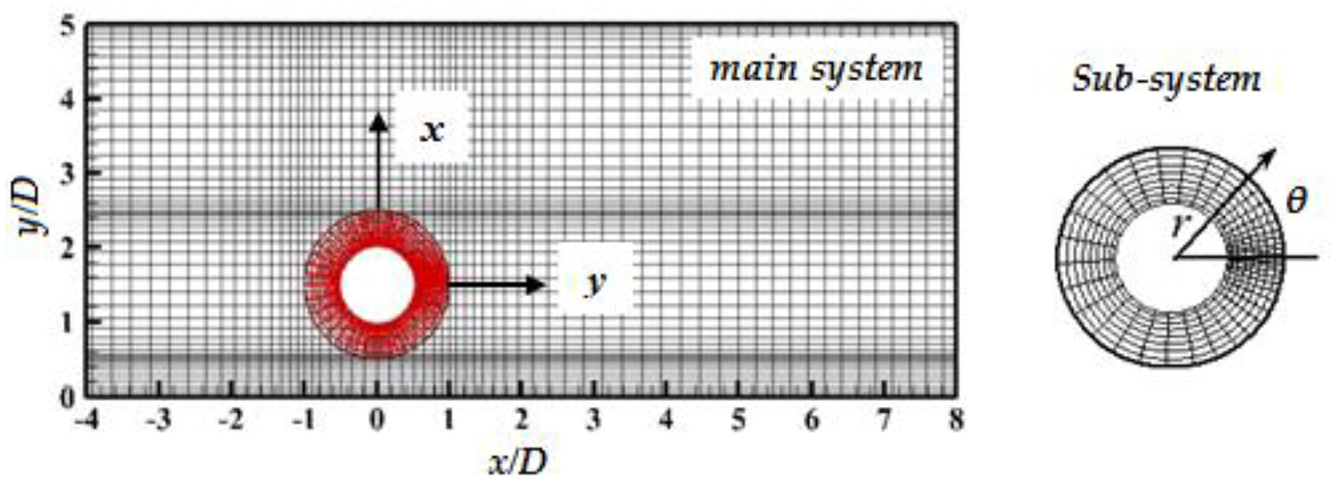
Schematic of the grid structure in the domain.
In order to control the size of the composite grid systems, a grid Reynolds number Regrid is defined by equation (8) based on the minimum grid width of the main grid system, and the minimum grid width of the sub grid is defined as one quarter of the minimum grid width of the main grid. Therefore, the smaller the Regrid, the larger the size of the main and sub grids, the higher the calculation accuracy and the longer the time consumption. Therefore, the appropriate Regrid values are selected for different Re respectively to reduce the calculation time and ensure the calculation accuracy.
Time-average Nusselt number
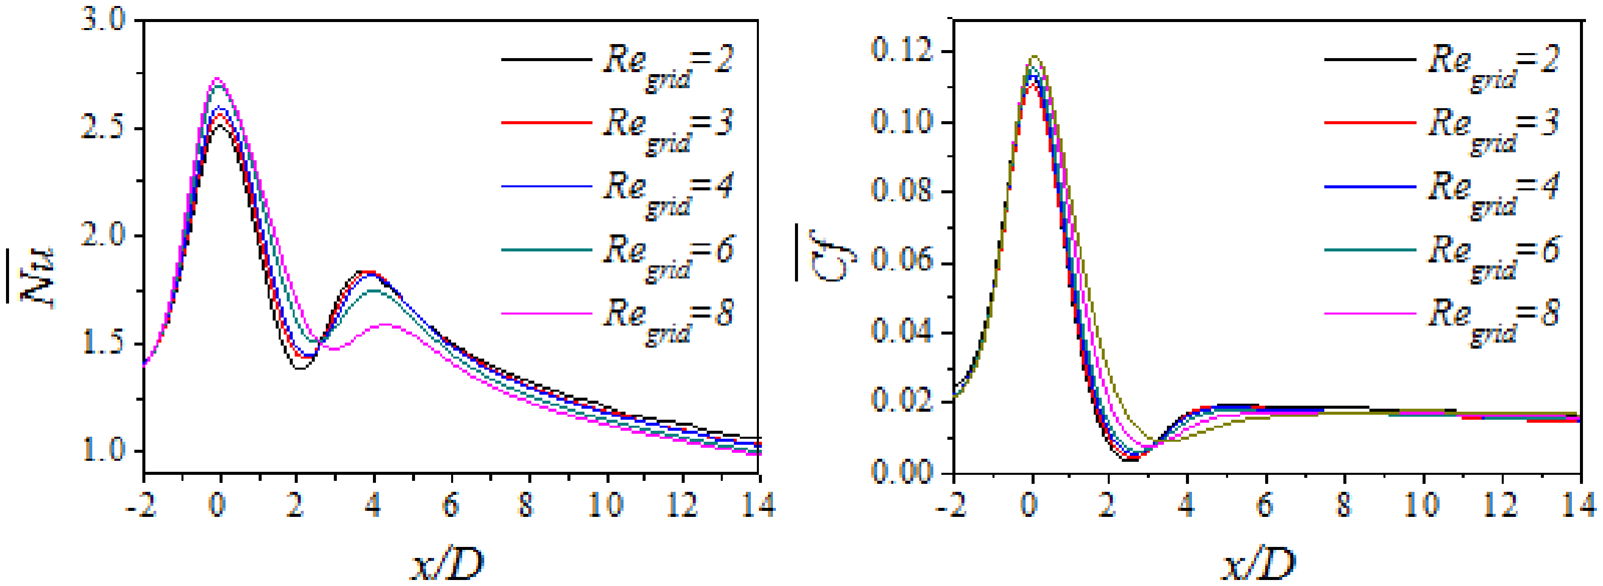
Grid independence test results for local distributions of
It was validated for the same scheme in the simulation on the single cylinder by Xi and Torikoshi. 21 The calculation time-mean local Nusselt number distribution on the surface of the cylinder is consistent with the experimental results of Eckert and Soehngen 24 and Zhou et al. 25 The flow characteristics of the flow field around a cylinder near a wall is consistent with the experimental results of Xu et al.25,26
Results and discussion
In this study, the geometry conditions of D = 10 mm, C = 6 mm, that is, the blockage ratio D/H = 0.2, and the clearance ratio C/D = 0.6, and the flow and heat transfer under different Re were studied. And then the mechanism of the influence of Re on the heat transfer enhancement on the cylinder downstream wall was discussed as well.
Heat transfer characteristics
In order to show clearly the effect of inserting a cylinder near the wall on heat transfer and flow resistance along the bottom wall, the dimensionless ratios of Nusselt number and friction coefficient corresponding to those values without cylinder were selected for analysis. The distribution of time-average local Nusselt number ratio
As shown in Figure 4, there are two kind of
At the case of Re = 100, the
At the case of Re = 200, the
At the case of Re≥ 400, the
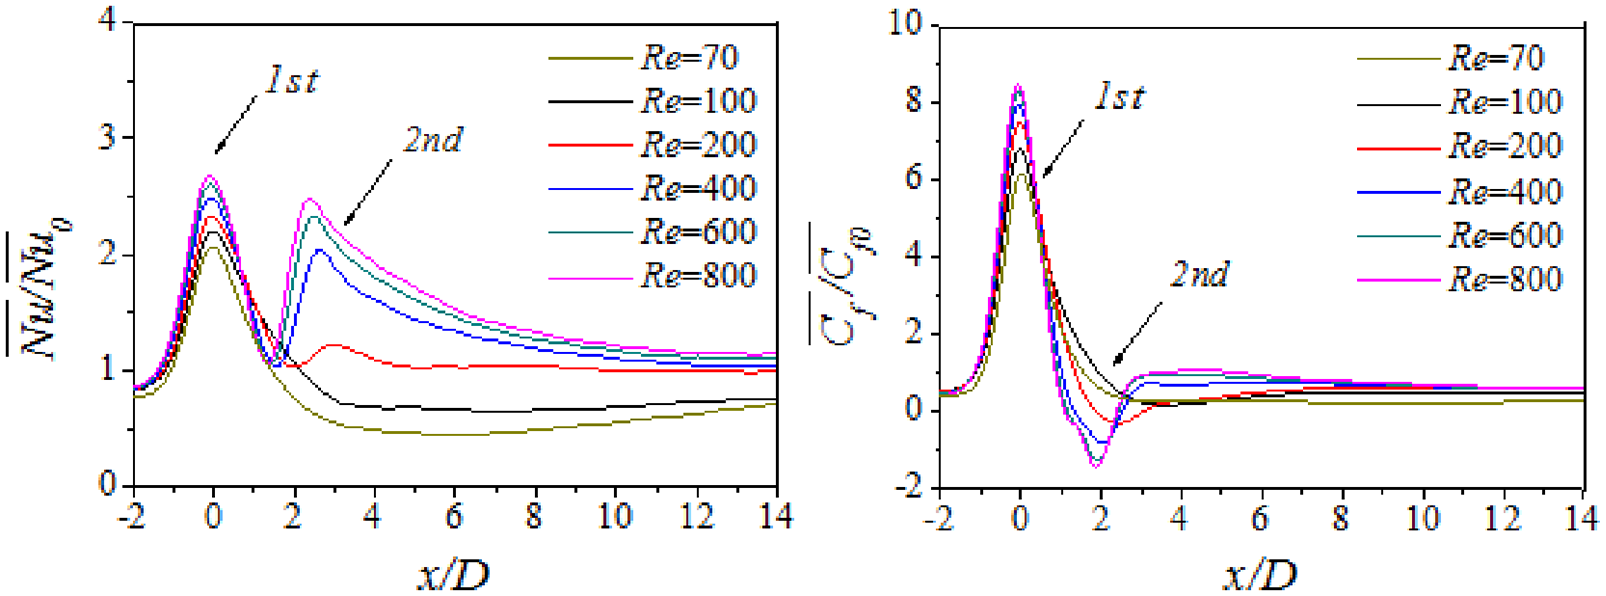
Distribution of time-average local Nusselt number ratio
The above heat transfer phenomena show that with the increase of Re, the flow state becomes transitional flow from laminar flow, the heat transfer on the local wall downstream of the cylinder increases obviously. Moreover, the time-average flow and heat transfer characteristics in this region are not similar, and there are differences between heat transfer and momentum transfer in the transitional flow. For the first peak, the increase of heat transfer and flow resistance on the wall is caused by the forced acceleration flow of fluid between the cylinder and the bottom wall, and since the inlet velocity Uin is proportional to Re, the greater Re is, the greater the heat transfer and resistance on the wall is. While for the second peak, the heat transfer increase with the increase of Re, flow resistance decreases with the increase of Re.
Flow characteristics
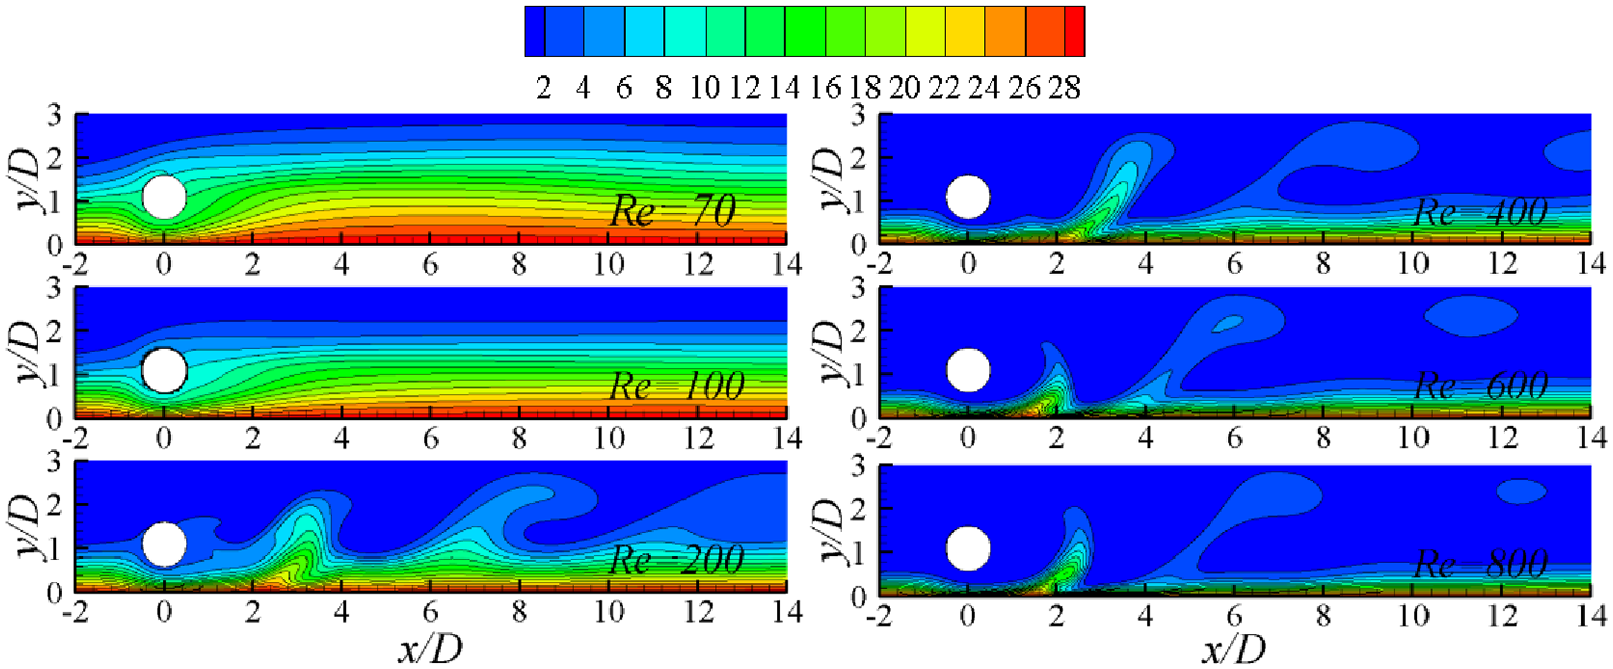
As the heat transfer enhancement on the downstream wall is related to the cylinder wake, Figures 5 and 6 show the instantaneous vorticity and temperature fields at Re = 70 to 800, respectively. The comparison of the vorticity and temperature field can reveal the relationship between flow and heat transfer.
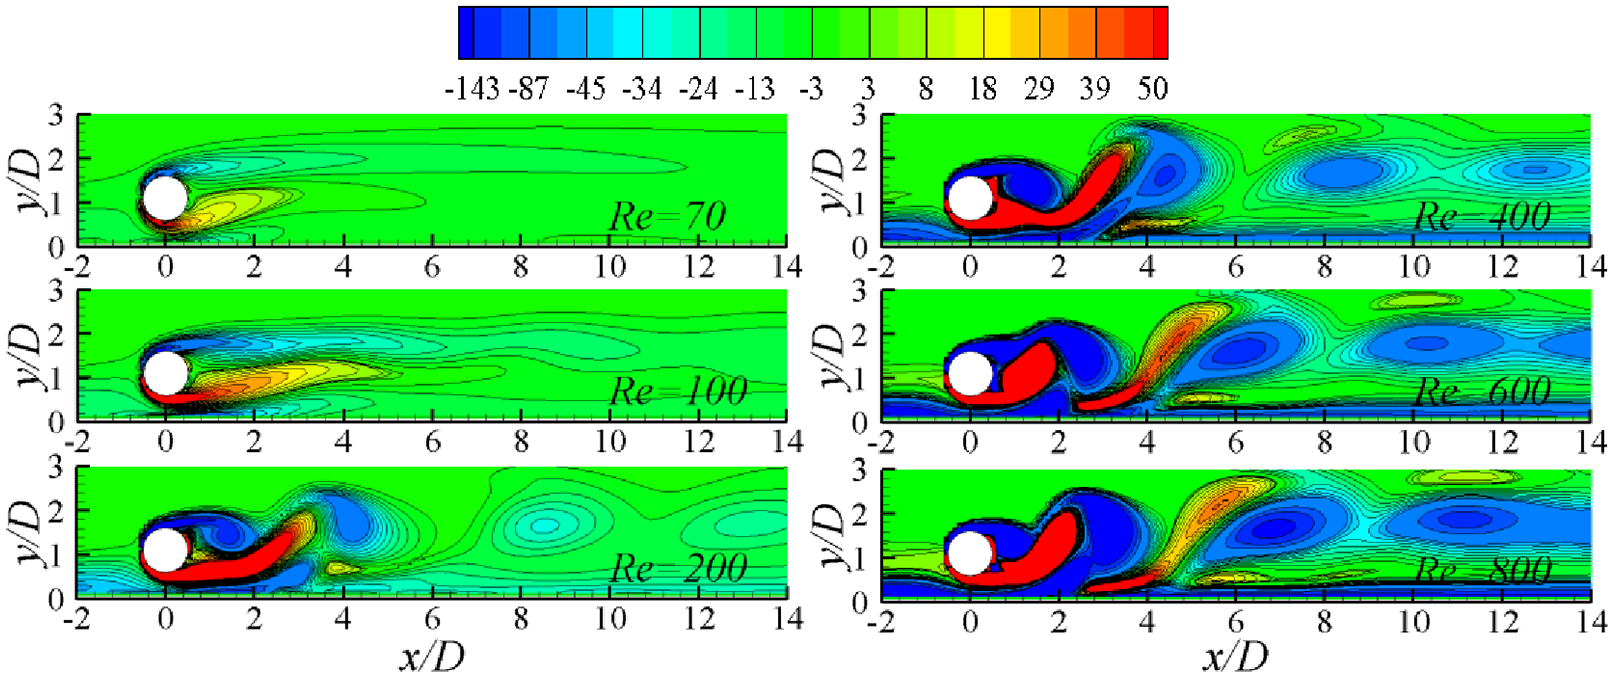
Instantaneous vorticity contours at Re = 70 to 800.
Instantaneous temperature fields (T-Tin) at Re = 70 to 800.
Firstly, it is found in Figure 5 that the structure of flow changes with a variation of Re. The flow field is steady and shows laminar flow characteristics at Re = 70. At the case of Re = 100, the flow field becomes unsteady and begins to fluctuate, which is the characteristic of transitional flow state. When Re increases to 200, negative vortices rotating clockwise are generated at the upper edge of the cylinder and vortex shedding occurs. At the lower edge positive vortices rotating anticlockwise occurs, but due to the inhibition of the wall, the positive vortices are not fully developed and no vortex shedding is formed. Meanwhile, the wall boundary layer protrudes upward under the push of the positive vortex, forming a near-wall vortex with negative vorticity.26–28 When Re further increases to 400, the positive vortices begin to fall off. The positive vortices fall off and move upward driven by the wall, while the negative vortices fall off the upper edge of the cylinder move downward, forming the cross motion of positive and negative vortices. When Re continues to increase to 600, the motion of positive and negative vortices in the wake becomes more and more obvious, forming a vortex street. Moreover, because of the influence of the bottom wall, the wake floats away from the bottom wall to y = H/2. Therefore, the further vortices in the wake have little influence on the heat transfer enhancement of the bottom wall. This also explains why the heat transfer enhancement on the downstream wall of the cylinder is limited to a certain extent.
It is found from Figure 6 that the temperature field corresponds to the structure of the vorticity field, which also reveals that the flow directly affects the heat transfer. The flow shows laminar flow state at Re = 70, and the temperature distribution is stable laminar structure too. At the case of Re = 100, the flow state is only fluctuation, the temperature distribution is also laminar structure. At the case of Re = 200, there are vortices in the wake of the cylinder, and one near-wall vortex in the boundary layer of the wall, which play the role of mixing fluid. Resulting in the fluctuation of the wall temperature boundary layer downstream the cylinder. With the increase of Re, the periodic vortex shedding in the wake becomes stronger and stronger, driving the fluid mixing more and more uniformly. The wall boundary layer gradually becomes thinner and the temperature gradient becomes larger. The heat transfer enhancement along the downstream wall of the cylinder becomes more obvious. The heat transfer on the wall surface is greatly enhanced when the near-wall cylinder flow field enters the transition flow state. This not only proves that the near-wall cylinder flow field enters the transition flow state when Re = 100, but also indicates the superiority of the transition flow in heat transfer.
From the above, Re affects the vortex structure in the transitional flow. It can be observed that the first peak of
Periodic flow and heat transfer characteristics
In order to further study the instability of flow and heat transfer in the transitional flow, Re = 400 is selected to investigate the periodic characteristics. At the cylinder downstream, two test points were set with coordinates of (3, 1.1) and (5, 1.1). Figure 7 shows v in y-direction of the two test points when Re = 400. Figure 8 shows the corresponding power spectral density (PSD) of v. From Figure 7, the normal velocity, v, of the two test points fluctuate regularly with time, and their amplitudes are different, but frequency remain the same. Further from Figure 8, the corresponding frequency f0 of the energy spectrum density peaks of the two test points is equal to 13.34 Hz, which shows that the flow has a self-sustained periodicity at Re = 400, the primary periodic cycle is t = 0.075 s.
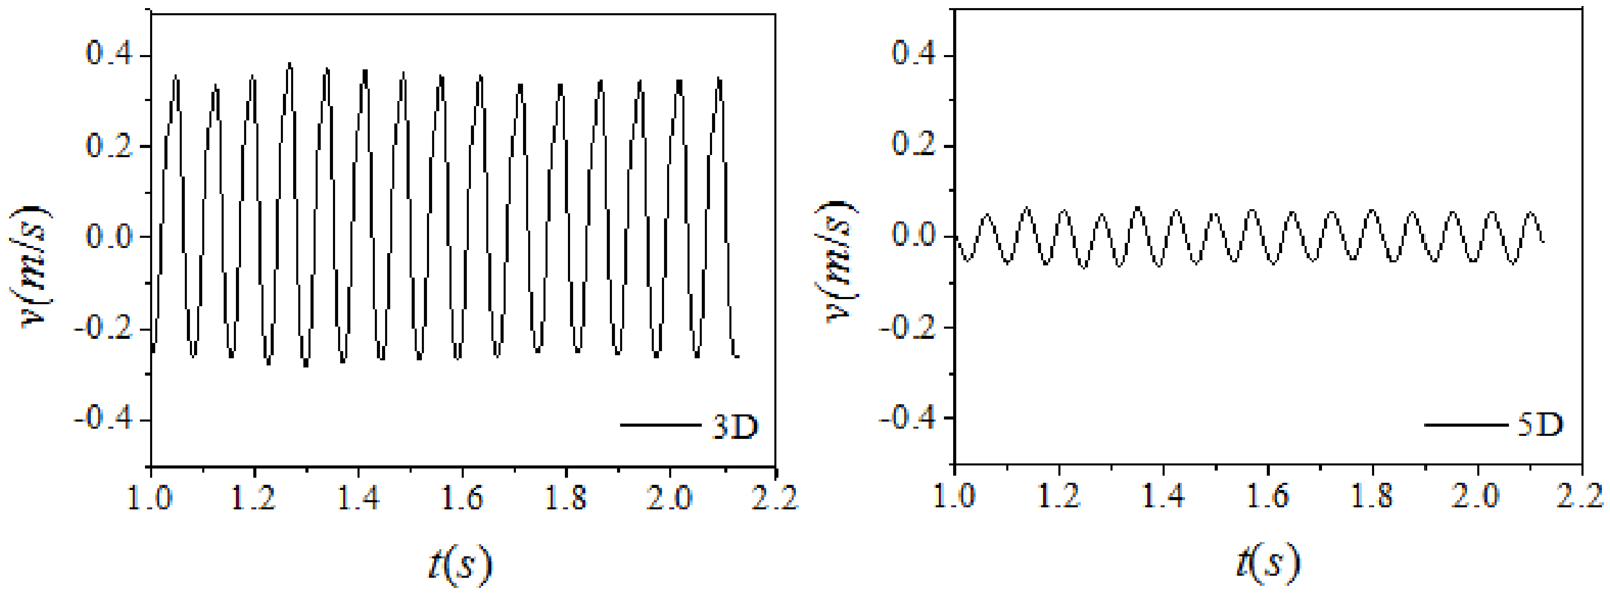
The Normal velocity v of the two test points at Re = 400.
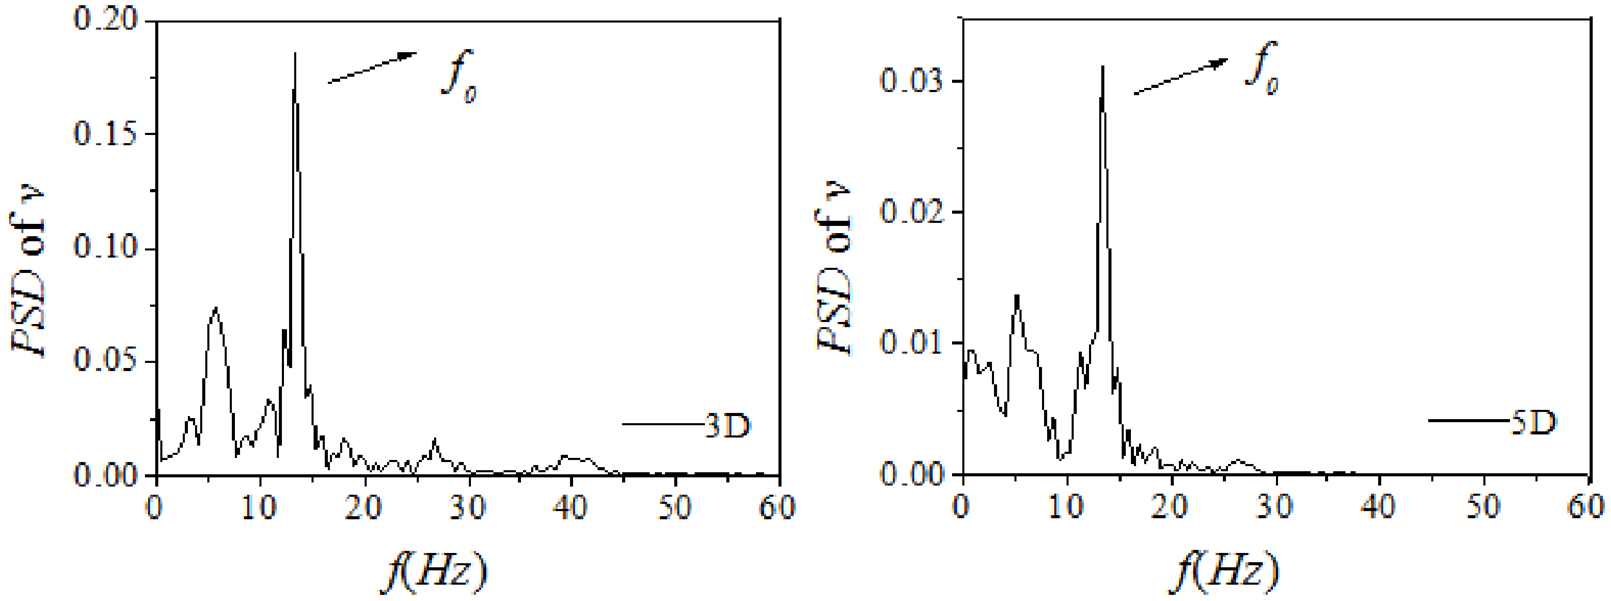
PSD of v (calculated for the data from Figure 7).
Figures 9 and 10 show the distributions of local Nusselt ratio (Nu/Nu0) and friction coefficient ratio (Cf/Cf0) along the bottom wall for various time instants of the periodic cycle at Re = 400. Nu0 and Cf0 are the instantaneous Nusselt number and friction coefficient without cylinder under the same conditions, respectively. For the comparison, the corresponding time mean values are added to each graph in a red dotted line, while the instantaneous values are in the solid line. The arrows in the figures point to the second, the third, and the fourth peaks of Nu/Nu0. We can clearly observe the change at trend curves of Nu/Nu0 and Cf/Cf0 with time at Re = 400. Firstly, there are three or four peaks in the Nu/Nu0 curve. The position of the first peak of Nu/Nu0 is consistent with the first peak of
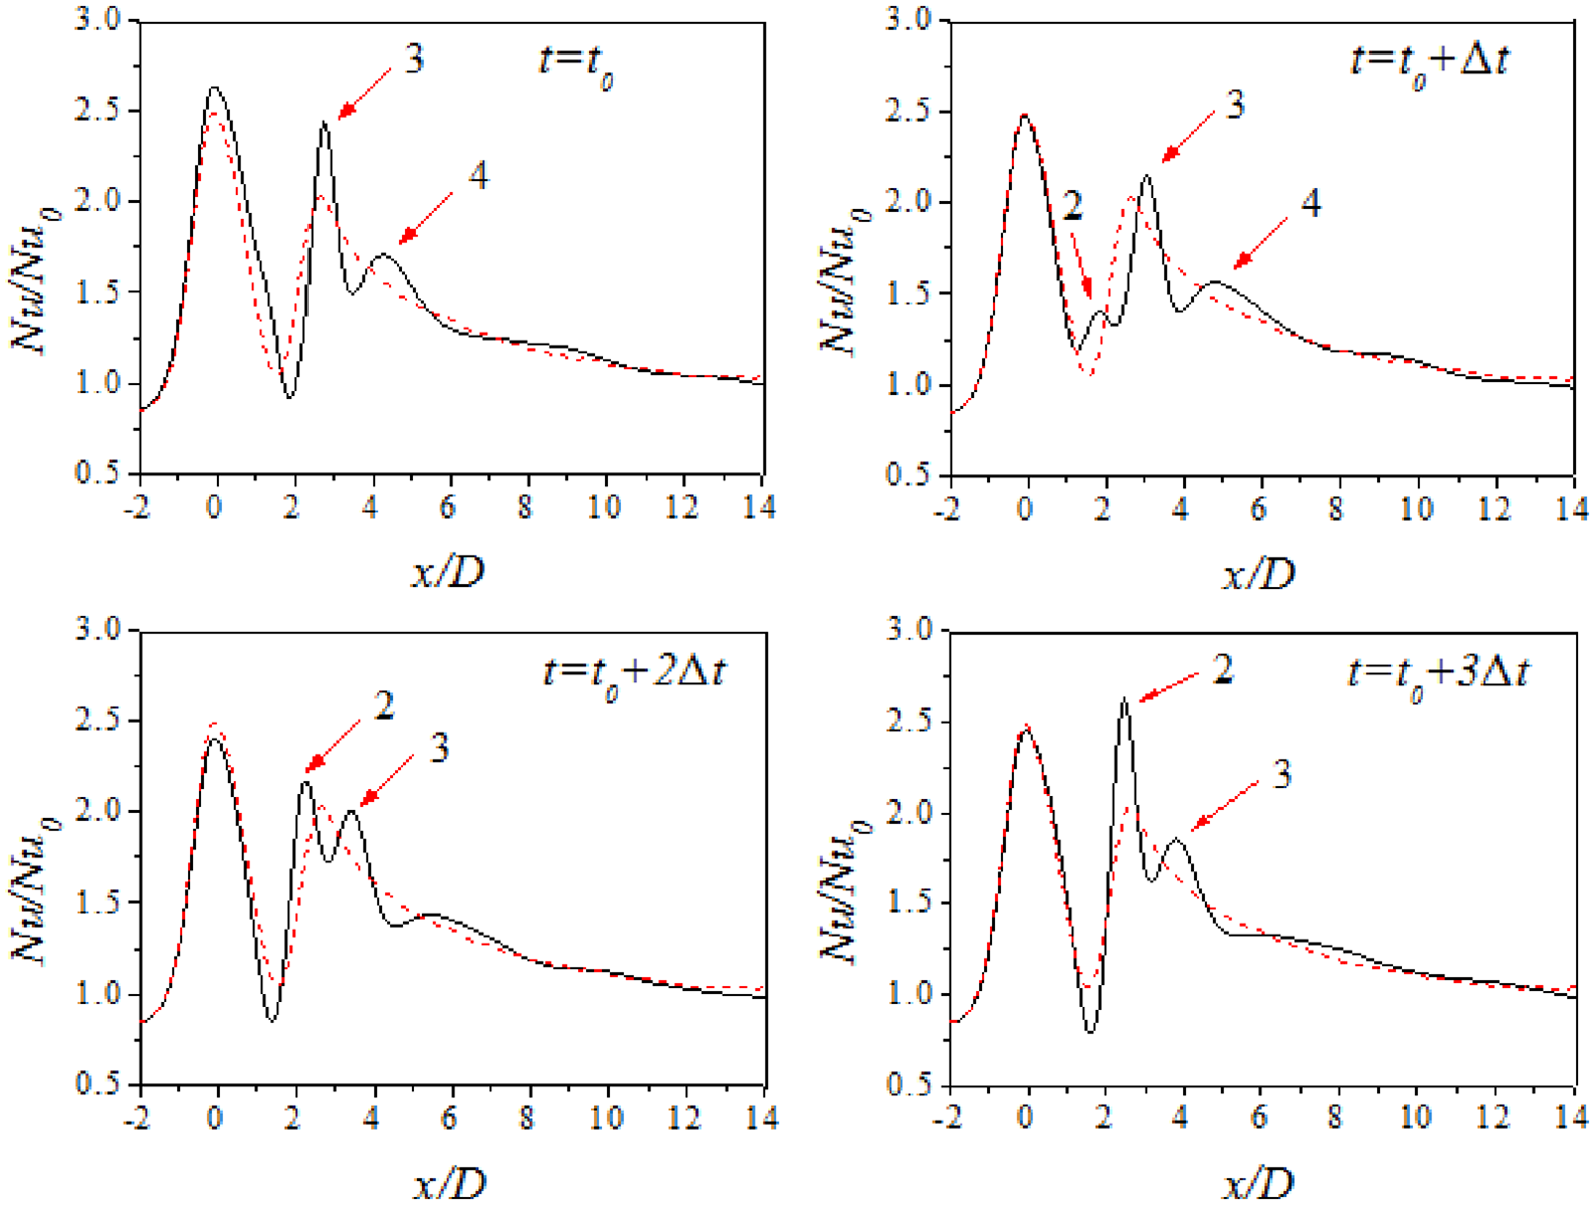
Distribution of instantaneous local Nusselt number at Re = 400, with Δt = 0.01875 s.
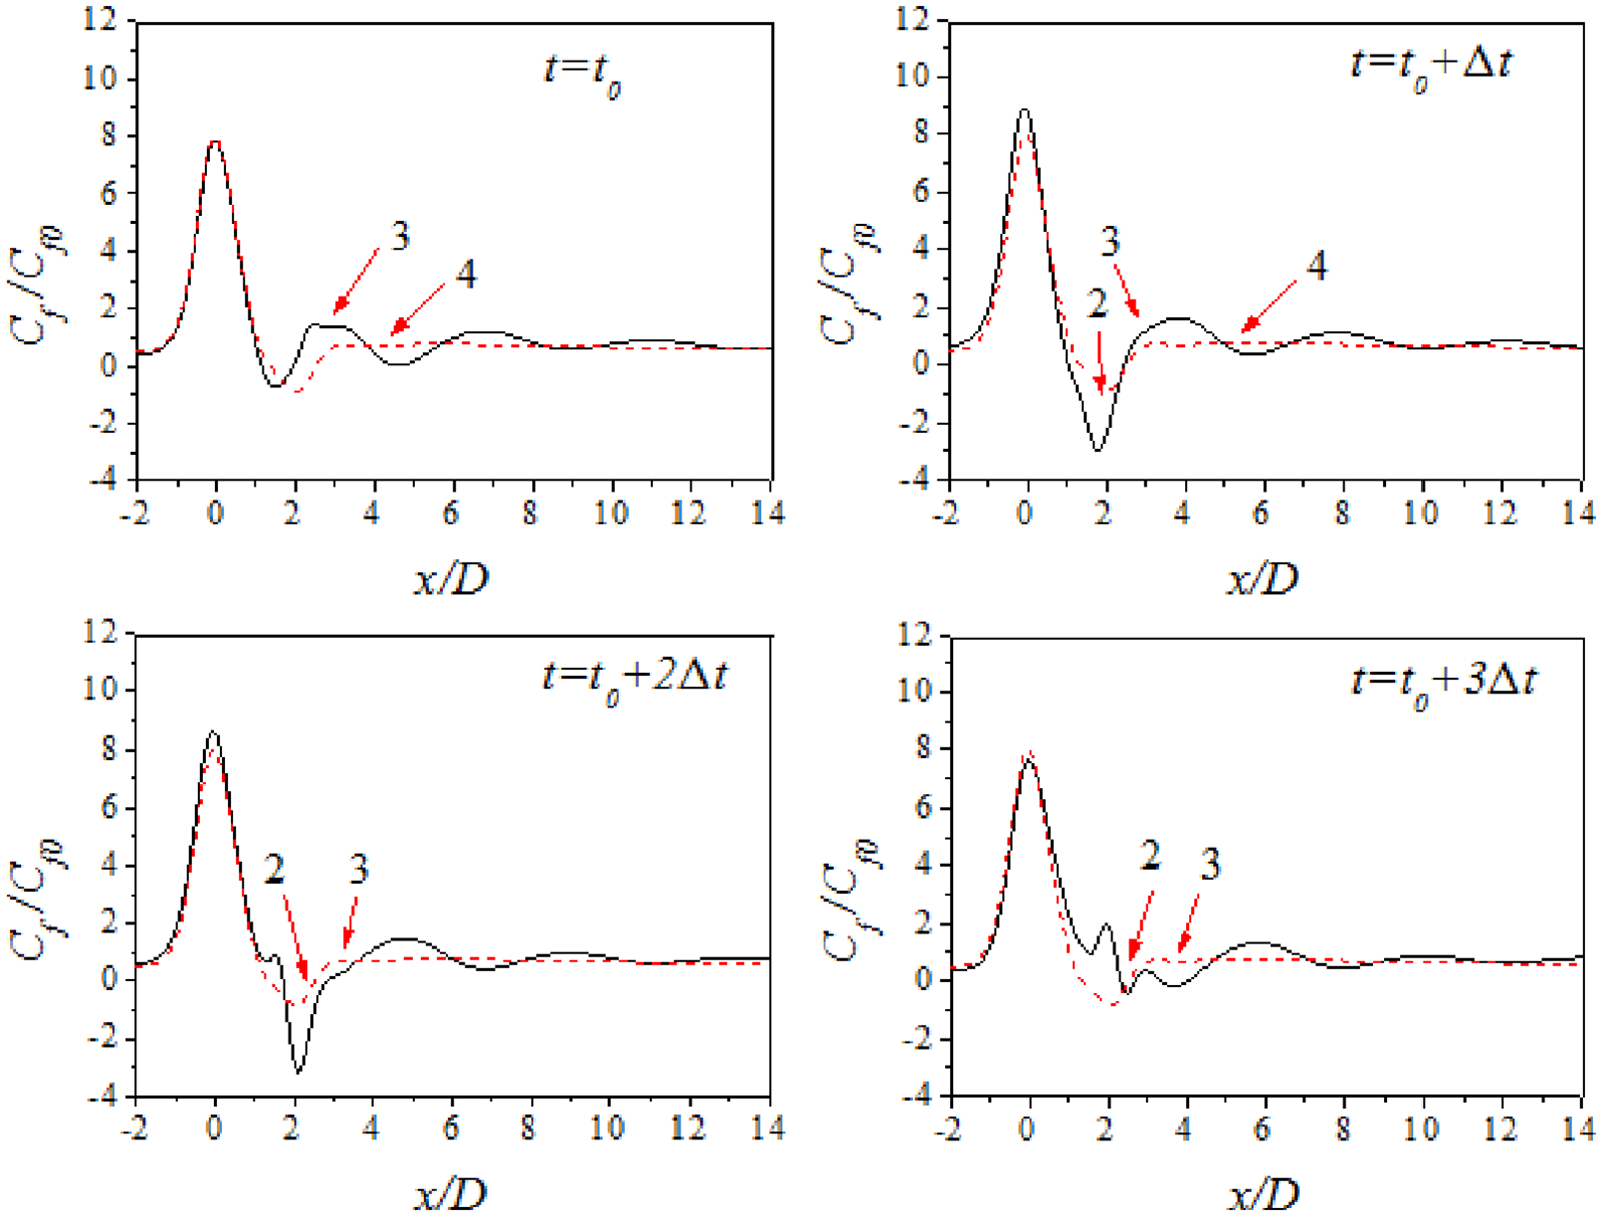
Distribution of instantaneous local friction coefficient at Re = 400, with Δt = 0.01875 s.
Figure 11 are instantaneous streamline and velocity fields (left) and temperature fields (right) corresponding to the time of Figure 9. In streamline and velocity fields, streamline is represented by black line and velocity is represented by blue arrow. The red arrows in the figures point to the corresponding locations of the second, the third, and the fourth peaks of Nu/Nu0 along the bottom wall. It can be found from Figure 11 that the negative vortex with clockwise rotation is generated at the upper surface of the cylinder, and the positive vortex with counter clockwise rotation is generated at the lower surface of the cylinder. The positive and the negative vortices are generated and detached alternately, moving with the flow direction and disappearing gradually. Simultaneously, a near-wall vortex with clockwise rotation is generated from the wall boundary layer at the downstream of the cylinder, which is also moving with the flow direction and gradually gets stronger and then weaker until it disappears. Figure 11 also shows a period of instantaneous temperature field. It is nearly same as the velocity filed. Observing the position of the arrow pointing to the wall, it is found that the near-wall vortex occurs at the second peak of the Nu/Nu0 curve, while the third and the fourth peaks do not have vortex, but the fluid also moves clockwise.
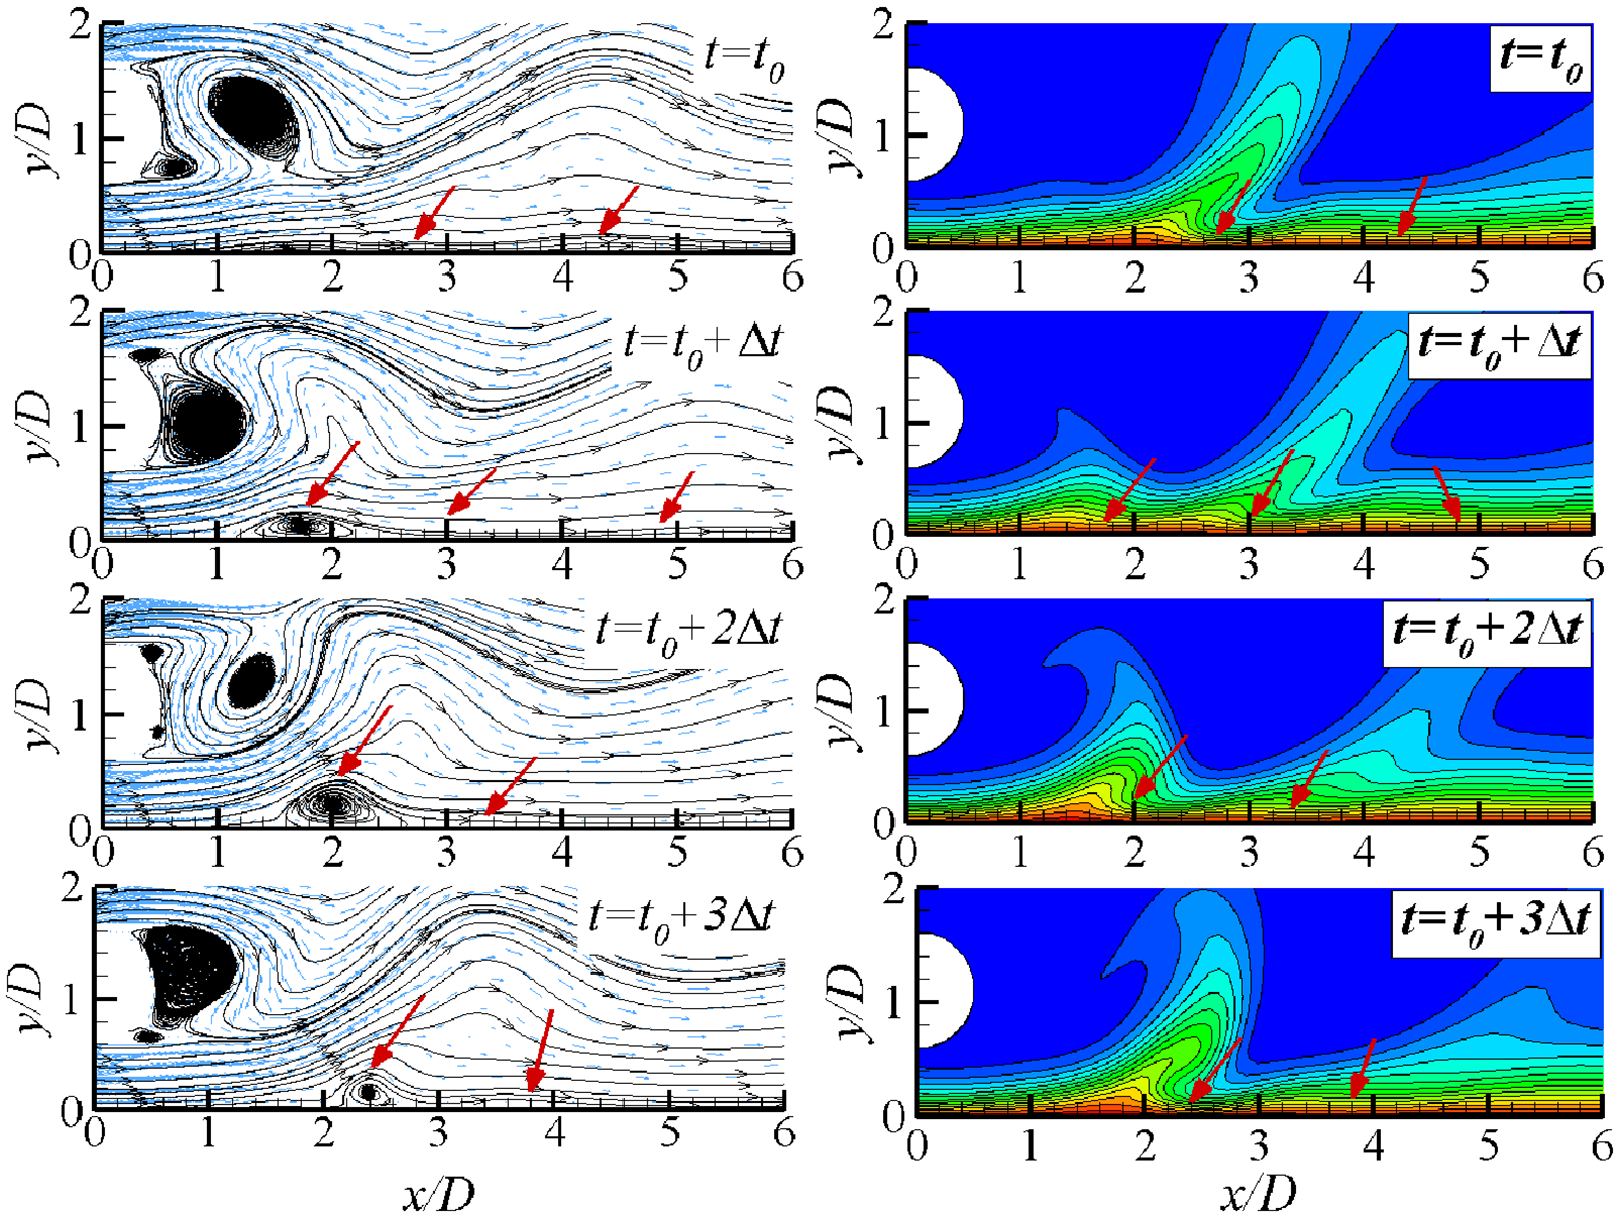
Instantaneous streamlines and velocity fields (left) and temperature fields (right) at Re = 400, with Δt = 0.01875 s.
The instantaneous vorticity contours (left) and fluctuating flow fields (right) corresponding to the time of Figure 9 are shown in Figure 12, respectively. In fluctuating flow field, the white area is the cold fluid whose instantaneous fluctuating component of temperature θ is negative (
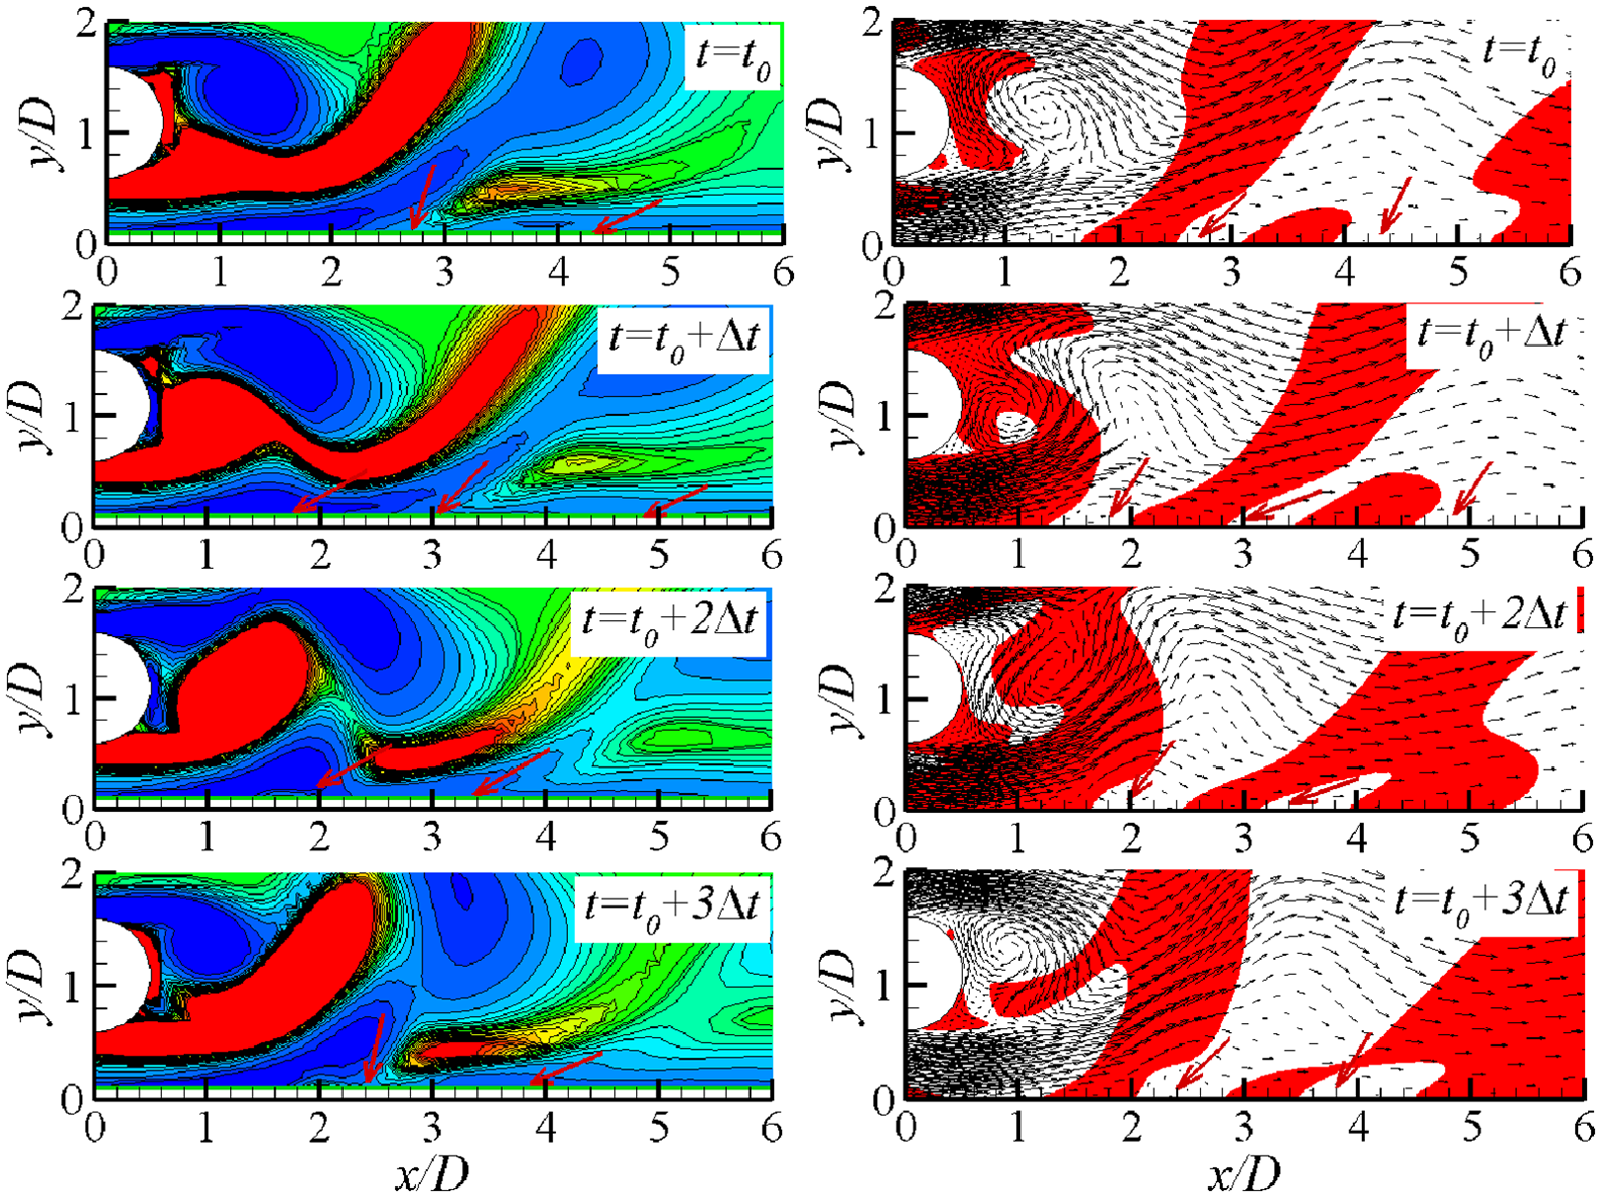
Instantaneous vorticity contours (left) and fluctuating flow fields and cold or hot fluid fields (right) at Re = 400, with Δt = 0.01875 s.
As shown in the vorticity fields of Figure 12, the negative vortex is generated at the upper surface of the cylinder, leading the fluid to rotate clockwise, the positive vortex is at the lower surface of the cylinder, leading the fluid to move anticlockwise. The negative vortex falls off under the compression of the positive vortex and moves downward. Then the positive vortex also begins to fall off under the influence of the negative vortex, and move upward under the push of the wall, thus forming the cross motion.26–31 Moreover, the wall boundary layer is pushed upward by the positive vortex to form two or three bulges with high negative vorticity. According to the instantaneous streamline and velocity fields in Figure 11, although there is only one vortex among these bulges, but the others also have a clockwise movement trend. It is found that the second, the third, and the fourth peaks of the Nu/Nu0 occur at these bulges of the bottom wall boundary layer. Especially at the position where the bulges meet and mix the negative vortex in the cylinder wake, the peak value of the Nu/Nu0 is larger. Observing the fluctuating flow fields in Figure 12, on the one hand, the negative vortices on the upper edge of the cylinder bring the fresh and colder fluid to the wall boundary layer, and the positive vortices on the lower edge bring the hotter fluid away from the boundary layer, which enhance the wall heat transfer. This is the mixing effect of the wake behind the cylinder on the fluid. On the other hand, the clockwise motion of the bulges of the wall boundary layer brings the colder fluid of the downstream to the near wall area, thus enhancing the wall heat transfer. Moreover, the clockwise motion pushes the fluid from the downstream to the upstream, resulting in a decrease in the streamwise velocity u there near the wall, and a decrease in the wall friction coefficient at that location. This is called the scrubbing effect.
In summary, the interaction between the cylinder wake and the bottom wall boundary layer can effectively improve the heat transfer performance of the wall, enhancing the wall heat transfer and reducing the flow resistance.
Time-averaged statistics
Figure 13 shows the cross-sectional distribution of –
Where, N is 10 cycles,
Firstly, both
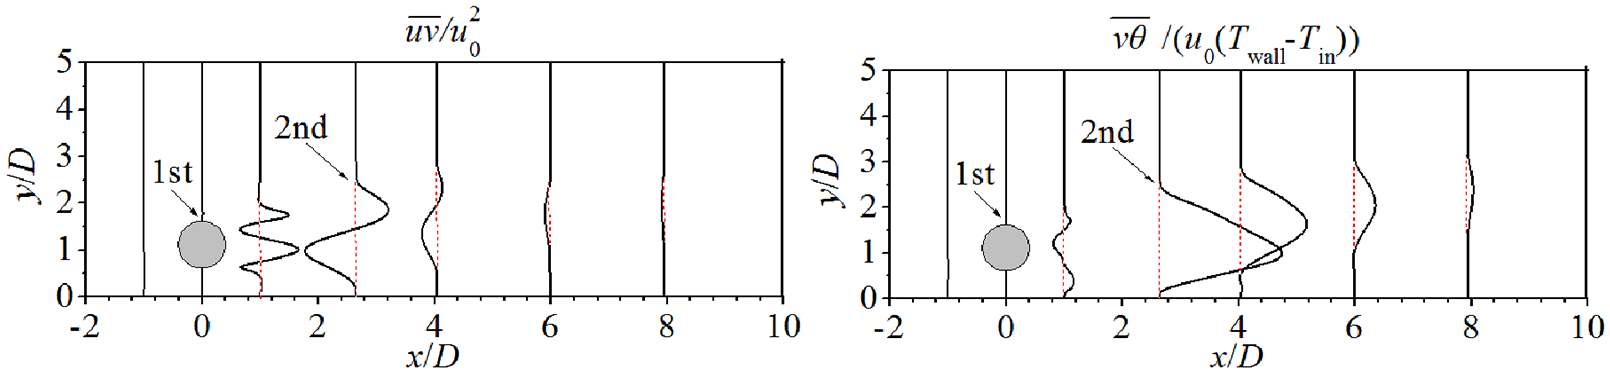
Cross-sectional distribution of
Optimal clearance ratio C/D under different Re
The essence of heat transfer enhancement is to increase heat transfer with a reasonable flow resistance increase. Only when the flow resistance increases less, the heat transfer enhancement is meaningful. Therefore, it is necessary to further study the optimal insertion position for the second peak to reach the maximum under different Re in the transitional flow range, that is, the optimal gap ratio C/D. Since the cylinder of D = 10 mm moves up to the center of the calculation area, it has little effect on the wall heat transfer. Re = 200, 400, 800 and C/D = 0–2.0 are selected in the range of transitional flow to study the relationship of the optimal clearance ratio with Re.
The second peaks of
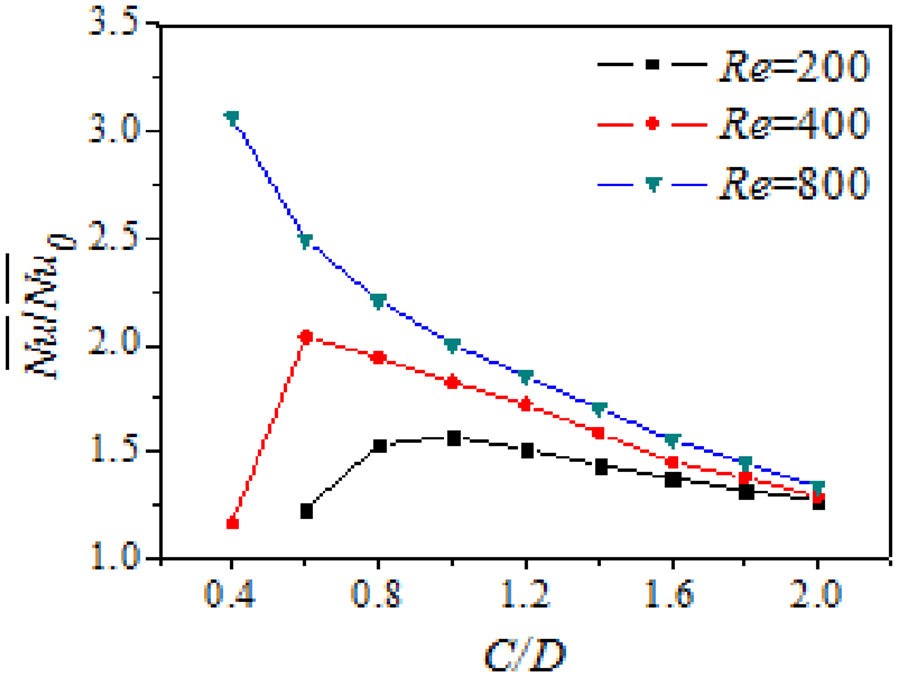
The second peak value of
Conclusion
In this paper, a numerical investigation is used to study the heat transfer enhancement of the wall by inserting a circular cylinder near the wall in transitional flow is performed. The effects of Re on heat transfer enhancement of the wall in the transitional flow state are discussed, and the conclusion is as follows.
When C/D = 0.6, the flow field around the cylinder near the wall enters the transitional state when Re = 100.
In the transitional flow, the heat transfer enhancement of the wall caused by the flow around the cylinder near the wall is regional, and the larger Re is, the larger the heat transfer enhancement area is.
The first peak of
The second peak of
Under the same blocking ratio D/H, the larger Re is, the smaller the optimal clearance ratio C/D is.
Footnotes
Notation
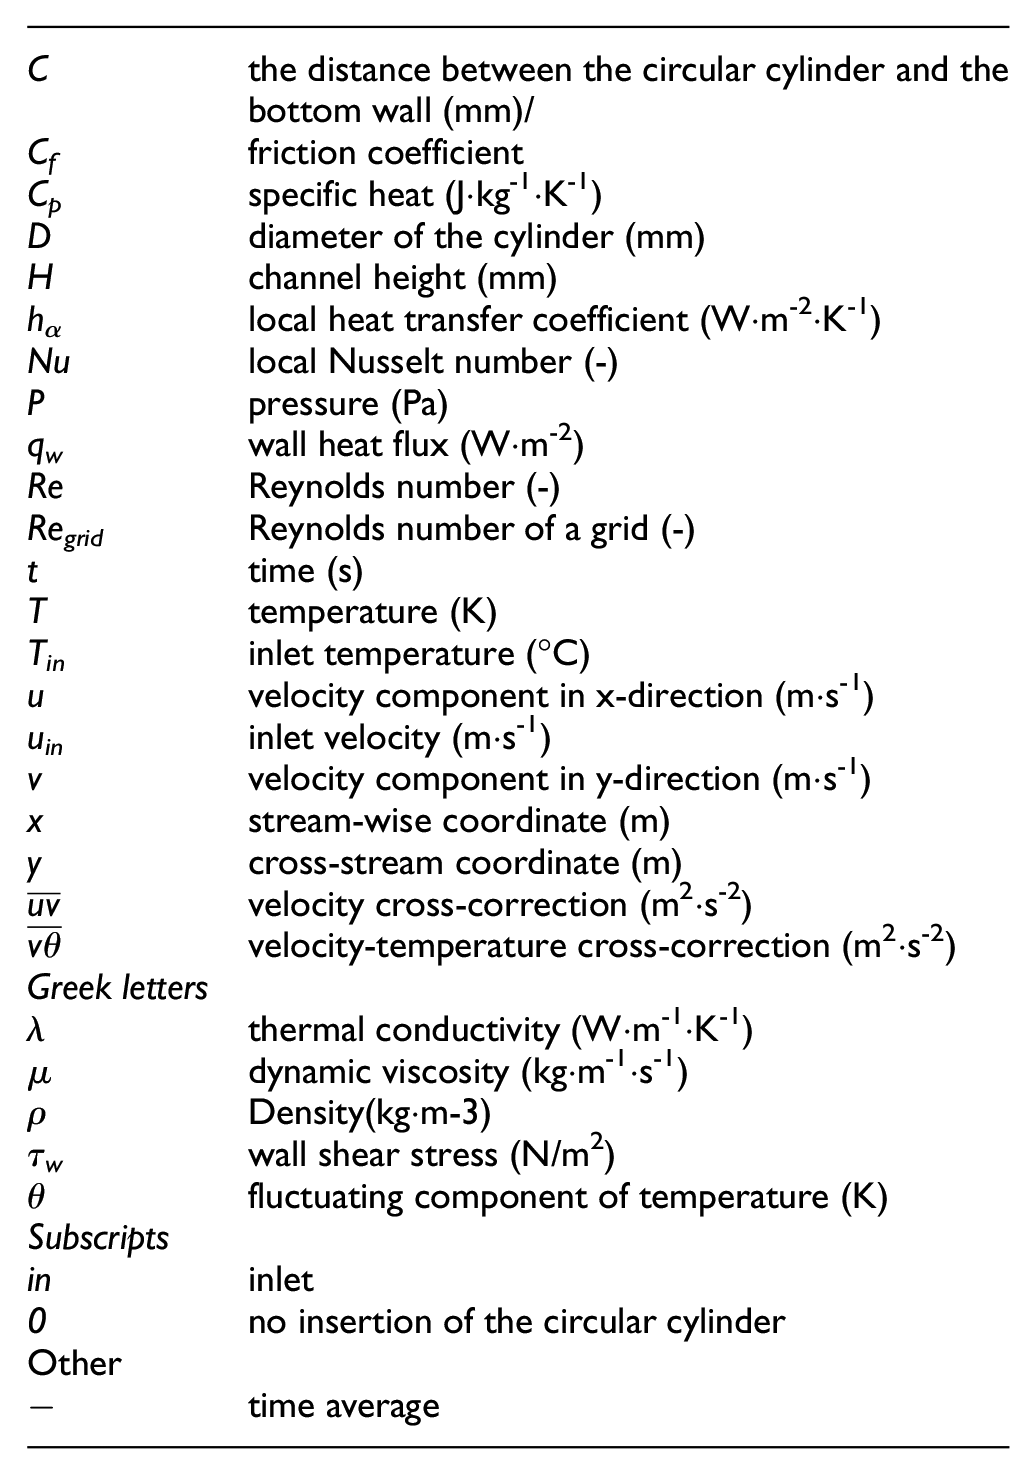
| C | the distance between the circular cylinder and thebottom wall (mm)/ |
| Cf | friction coefficient |
| Cp | specific heat (J·kg-1·K-1) |
| D | diameter of the cylinder (mm) |
| H | channel height (mm) |
| hα | local heat transfer coefficient (W·m-2·K-1) |
| Nu | local Nusselt number (-) |
| P | pressure (Pa) |
| qw | wall heat flux (W·m-2) |
| Re | Reynolds number (-) |
| Regrid | Reynolds number of a grid (-) |
| t | time (s) |
| T | temperature (K) |
| Tin | inlet temperature (°C) |
| u | velocity component in x-direction (m·s-1) |
| uin | inlet velocity (m·s-1) |
| v | velocity component in y-direction (m·s-1) |
| x | stream-wise coordinate (m) |
| y | cross-stream coordinate (m) |
| velocity cross-correction (m2·s-2) | |
| velocity-temperature cross-correction (m2·s-2) | |
| Greek letters | |
| λ | thermal conductivity (W·m-1·K-1) |
| μ | dynamic viscosity (kg·m-1·s-1) |
| ρ | Density(kg·m-3) |
| τw | wall shear stress (N/m2) |
| θ | fluctuating component of temperature (K) |
| Subscripts | |
| in | inlet |
| 0 | no insertion of the circular cylinder |
| Other | |
| − | time average |
Declaration of Conflicting Interests
The author(s) declared no potential conflicts of interest with respect to the research, authorship, and/or publication of this article.
Funding
The author(s) received no financial support for the research, authorship, and/or publication of this article.