
Abstract
In the paper industry, to determine the installation positions of concentration sensor and flow sensor of pulp pipe transportation system, the length of pipe inlet section of pulp fluid must be determined. In order to solve the problem that it is difficult to determine the length of pipe inlet section of pulp fluid, the paper presents a method to determine the length of pipe inlet section of pulp fluid, and the relationship between the length of inlet section and pulp fluid parameters is studied by this method. Firstly, CFD (Computational Fluid Dynamics) method is applied to obtain flow velocity and solid phase concentration distribution data of pulp fluid at different axial positions in the pipe. Then, Pearson correlation coefficient method is applied to analyze these data. Finally, the length of pipe inlet section of pulp fluid is determined according to the obtained correlation coefficient, and the relationship between the length of pipe inlet section of pulp fluid and initial average flow velocity and solid phase concentration is obtained. The conclusion shows that the method can well obtain the length of pipe inlet section of pulp fluid, which provide some theoretical basis for the design of pulp pipe transportation system.
Introduction
In the paper industry, pulp fluid concentration and pulp flow velocity are the two most frequently measured physical quantities. The measurement accuracy of pulp concentration and pulp flow velocity is very important for automatic control of production process, ensuring the quality of pulp and paper, reducing the consumption of raw materials, improving production efficiency and saving production cost.1–3 In recent years, with the application of high-speed paper machines, papermaking production lines have also put forward corresponding requirements for the rapidity and accuracy of pulp concentration and pulp flow velocity measurement. 4 So, when designing the pulp pipeline transportation system, it is necessary to ensure that the concentration and flow velocity of pulp fluid can obtain sufficiently accurate measurement results. Generally, the concentration and flow velocity of pulp fluid are measured by installing sensors on the pulp transportation pipeline. 5 In the case of straight pipe, the installation position of the sensor on the pipe is determined according to the length of pipe inlet section of pulp fluid.
Under the conditions of without considering the bent pipe or the blocking body inside the pipeline and the secondary flow of the fluid, the flow of pulp fluid in the straight pipe is divided into two areas, which are the pipe inlet section and the pipe fully developed section. The area from the inlet of pipe to the stable flow state of the fluid is pipe inlet section, and the pipe area downstream of inlet section is pipe fully developed section. In the pipe inlet section, the solid phase concentration distribution and flow velocity distribution of pulp fluid are in a state of continuous change, after entering the pipe fully developed section, the solid phase concentration distribution and flow velocity distribution of pulp fluid reach the stable state. In order to ensure the measurement accuracy, the pulp concentration and flow sensors need to be installed on the fully developed section of the pipe, so the length of pipe inlet section of pulp fluid must be determined.
At present, the main method for determining the installation position of the sensor in the papermaking industry is to set a long straight pipe upstream of the installation position of the sensor to ensure that the installation position of the sensor is at the pipe fully developed section. This method is only a simple method to determine the installation position of the sensor, it lacks theoretical support and cannot give a definite value of the length of the straight pipe. If the straight pipe is not long enough, it may be less than the length of pipe inlet section of pulp fluid, which inevitably causes measurement errors. If the length of the straight pipe is too long, it will occupy more production sites and waste resources. Therefore, theoretically solving the problem of how to determine the length of pipe inlet section of pulp fluid is of certain significance to the design of the pulp pipeline transportation system in the paper industry.
At present, there are many research results on the pipe inlet section of fluid. Mohanty A K et al. 6 studied the length of pipe inlet section of low Reynolds number fluid through theoretical calculation and a large number of experiments. Zanoun et al. 7 studied the length of inlet section of single-phase flow by experimental method, and proposed an approximate method to determine the length of pipe inlet section of single-phase fluid. Len et al. 8 obtained the law of the length of pipe inlet section and Reynolds number of high Reynolds number fluid through experiments, and obtained the range of the length of pipe inlet section. These studies mainly use theoretical calculation and experimental methods to determine the length of pipe inlet section for single-phase fluid, and some empirical formulas 9 are summarized to determine the relationship between the length of pipe inlet section and the Reynolds number of fluid. These methods and research results are of great significance in determining the length of pipe inlet section of single-phase fluid in the engineering field. However, the pulp fluid is slurry fluid and belongs to liquid-solid two-phase flow. For the problem of how to determine the length of pipe inlet section for slurry fluid, it is difficult to obtain accurate conclusions by using experimental methods or empirical formulas due to the limitations of model size, flow field disturbance and measurement accuracy.
The equation of motion of fluid can be described by N-S equation (Navier-Stokes equation). By solving the N-S equation, the exact solution of the length of the inlet section of slurry fluid pipeline can be obtained. However, the N-S equation is a nonlinear partial differential equation, which is very difficult to solve. In recent years, with the wide application of some new methods and numerical analysis methods for solving non-linear problems in engineering,10–12 many research results have been obtained by solving fluid motion equations or numerical analysis methods to study fluid flow problems.11,13–15 Compared with the experimental method, the method of solving the equation of motion or numerical analysis to study the fluid flow problem has stronger applicability and higher accuracy.
As a method to solve the numerical solution of partial differential equations describing fluid motion, Computational Fluid Dynamics (CFD) method has been widely used in the research of flow. With the development of CFD, great progress has been made in the research of slurry fluid. The CFD method is a discrete approximate calculation method, and it can be used to obtain the numerical solution of fluid flow field problems. Although the CFD method cannot obtain the analytical solution of the fluid flow problem, the error between the numerical solution obtained by this method and the real value is very small, which can well meet the needs of engineering. Hsu et al. 16 established the multiphase flow model of slurry fluid, which can describe the solid phase concentration distribution of slurry fluid. Lin et al. 17 established a high concentration slurry fluid model, which can calculate the concentration and flow velocity distribution of high concentration slurry fluid. Ling et al. 18 proposed a simplified multiphase flow model to calculate the flow of slurry fluid and obtain numerical solutions, which can predict the flow pressure drop, concentration and flow velocity distribution of slurry fluid. Shinichi and He et al.19,20 believe that Euler-Euler multiphase flow model can be used to simulate and calculate the general problems of multiphase flow, and they used Euler-Euler multiphase flow model method to simulate the flow of slurry fluid in the straight pipe. In these studies, the CFD multiphase flow method is used to establish the dynamic model of slurry fluid, and the computer is used to simulate the flow of slurry fluid, so as to obtain the numerical solution of slurry fluid flow problem at a limited number of discrete points, which can well solve the pipe flow problem of slurry fluid. These studies show that the CFD method can overcome the shortcomings of theoretical analysis and experimental methods, and it is appropriate to solve the flow problem of slurry fluid. The pulp fluid is a kind of slurry fluid, so the CFD method is suitable for the study of the length of pipe inlet section of pulp fluid in this paper.
The innovation of this work are mainly reflected in the CFD method is proposed to determine the length of pipe inlet section of pulp fluid, and illustrates the specific process of applying this method through simulation experiments and data analysis, which provides a convenient and low-cost method for determining the installation positions of pulp concentration sensor and flow sensor on the pipeline. This method is simple in principle and easy to solve.
The main work and contributions of this paper are as follows:
The CFD method is proposed to determine the length of pipe inlet section of pulp fluid, the correctness of the method and results are verified by simulation experiments and data analysis, and the specific process of applying the method is explained.
The low that the length of pipe inlet section of pulp fluid is changed by the change of average flow velocity and solid phase concentration of pulp fluid is summarized.
The method and conclusion of this paper provide theoretical support for how to determine the installation position of pulp concentration sensor and flow sensor on the pipeline, which is of certain significance to the design of pulp pipeline transportation system in paper industry.
Mathematical model
In this paper, the Euler-Euler multiphase flow model is used to establish the two-phase flow dynamic model of pulp fluid, and the RNG turbulence equation 21 is used to describe the turbulent flow of pulp fluid.
To establish a mathematical model of pulp flow, the following conditions are required:
The solid phase is a continuous fluid, the liquid phase is an incompressible fluid, and the physical properties of each phase are constant.
There is no phase change in both solid and liquid phases, and cavitation phenomenon in the field is not considered.
The liquid phase of pulp fluid is water and the solid phase is pulp fiber, so the above conditions can be met.
Equation of motion of pulp fluid
The equation of motion of pulp fluid is established in Euler coordinate system as follows:
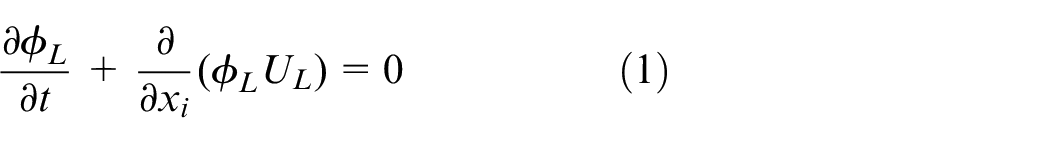
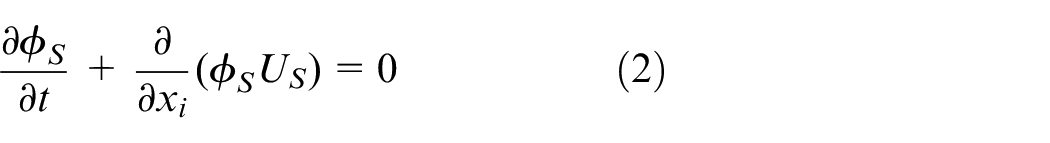
Equations (1) and (2) can be authenticate by reference.
22
Where


Equation (3) is a liquid phase continuous equation and equation (4) is a solid phase continuous equation, the momentum equations is:
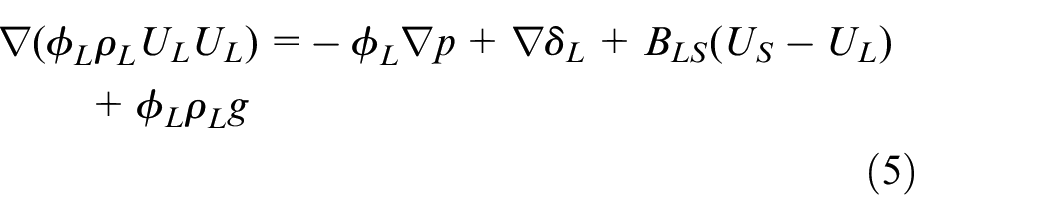
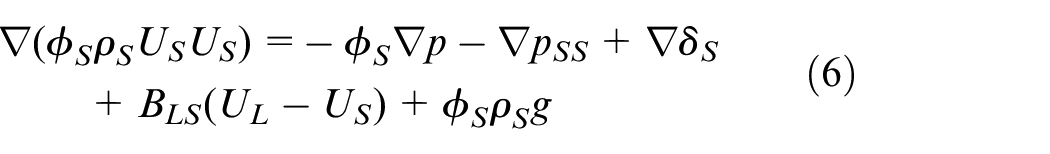
where

then,
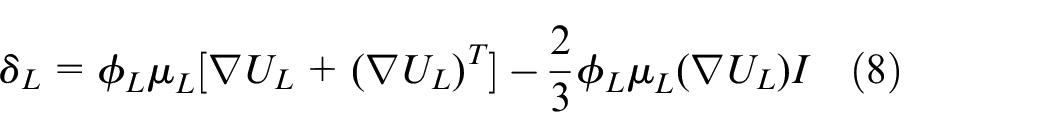
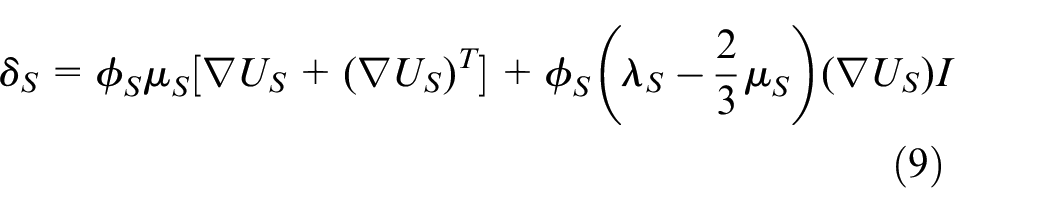
where
Turbulent model of pulp fluid
The turbulent flow of pulp fluid can be described by RNG
a. RNG model adds an additional viscosity term to the N-S equation, and its calculation accuracy is higher.
b. The standard
These characteristics make RNG
Applying RNG method24,25 to N-S equation and introducing turbulence kinetic energy

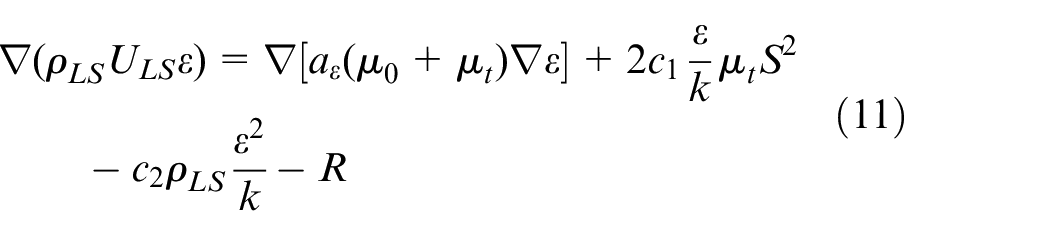
In equations (10) and (11),
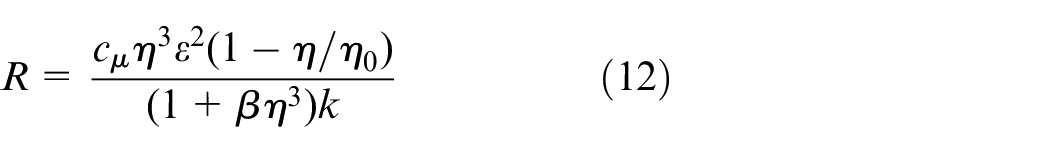
where
Simulation experiment and data analysis
According to the above mathematical model, the CFD method can be applied to obtain the numerical solution of the flow parameters of pulp fluid in the pipeline. The method for determining the length of pipe inlet section of pulp fluid in this paper is as follows: a plurality of positions are sequentially selected in the axial direction of the pipe, and the flow velocity and concentration distribution of pulp fluid at these positions are obtained by CFD method, when the velocity and concentration distribution on all pipe areas downstream of a certain position reach a stable state, the upstream of this position is pipe inlet section, and the downstream of this position is pipe fully developed section.
Boundary conditions and pipe model
In this paper, Comsol Multiphysics 27 is used for numerical simulation and without considering the influence of temperature and density changes on pulp fluid. The boundary conditions and initial conditions are set as follows:
(1) Initial volume concentration of pulp fluid at the pipe inlet.
The range of pulp concentration in the papermaking industry is generally divided into low concentration pulp (
(2) Initial average flow velocity of pulp fluid at the pipe inlet.
At present, the average flow velocity of pulp fluid
(3) The boundary condition of the pipe wall is set as no slip condition, and the outlet is set as free outflow.
(4) The range of equivalent particle size of the pulp solid phase particles is
The two-dimensional model and calculation area of pipe are shown in Figure 1. The pipe model is a two-dimensional symmetrical mirror image structure from the pipe axis to the pipe wall. The model consists of the pipe wall, the pipe central axis, the inlet and the outlet. The pipe is axisymmetric, so only half of the radial direction of the two-dimensional pipe needs to be selected as the area for calculation and data analysis. Set the pipe diameter
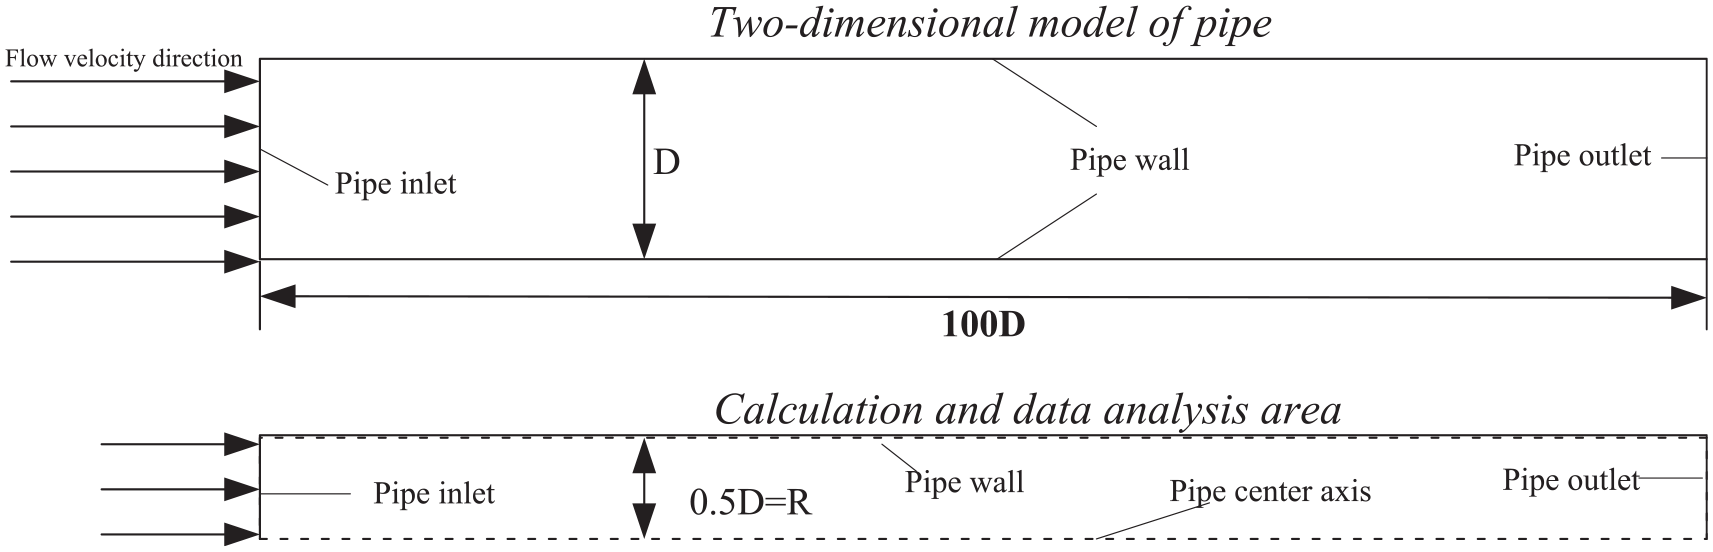
Two-dimensional model and numerical analysis area of pipe.
In the production process of paper industry, the parameters of pulp fluid transportation system such as temperature and pulp density usually change little, so the calculation area model established in this paper can be assumed as ideal condition. The geometric shape and material parameters are set to be constant, and the influence of temperature and density changes is ignored, so that the robustness of the calculation area model can be guaranteed.
Computational grids
The robustness of the fluid model is mainly determined by the number of grids and computer performance. Under the initial conditions and boundary conditions set in this paper, as long as the grid division of the calculation area is appropriate, the model can be guaranteed to have good robustness. If the grid density is reduced, the robustness of the model can be improved to a certain extent, but this will cause the solution to be affected by the number of grids, thus reducing the calculation accuracy and increasing the error.
In order to ensure the grid independence of the solution and to test the robustness of the model, grid testing is necessary. The number of grids tested is respectively the following seven cases: 10,028, 27,672, 48,504, 73,604, 135,562, 303,180, 811,238. In these seven cases, the flow velocity and solid phase volume concentration distribution of pulp fluid with initial average flow velocity
Comparison of the maximum flow velocity and volume concentration for different grid numbers (
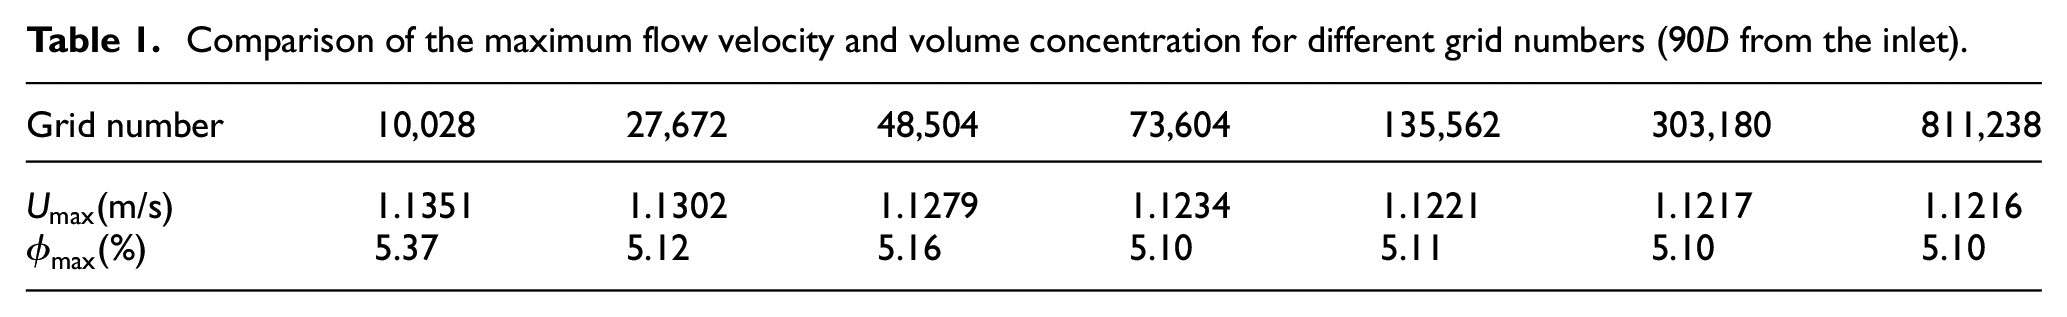
Table 1 shows that numerical solutions can be obtained when the calculation area is divided into the above seven grid densities, which indicates that the model has good robustness. When the number of grids divided is 303,180, that is sufficient to obtain the grid independent solutions. Therefore, in this paper the number of computational area division grids is 303,180.
Numerical simulation and the method for determining length of pipe inlet section of pulp fluid
The flow velocity and concentration distribution of pulp fluid with initial average flow velocity
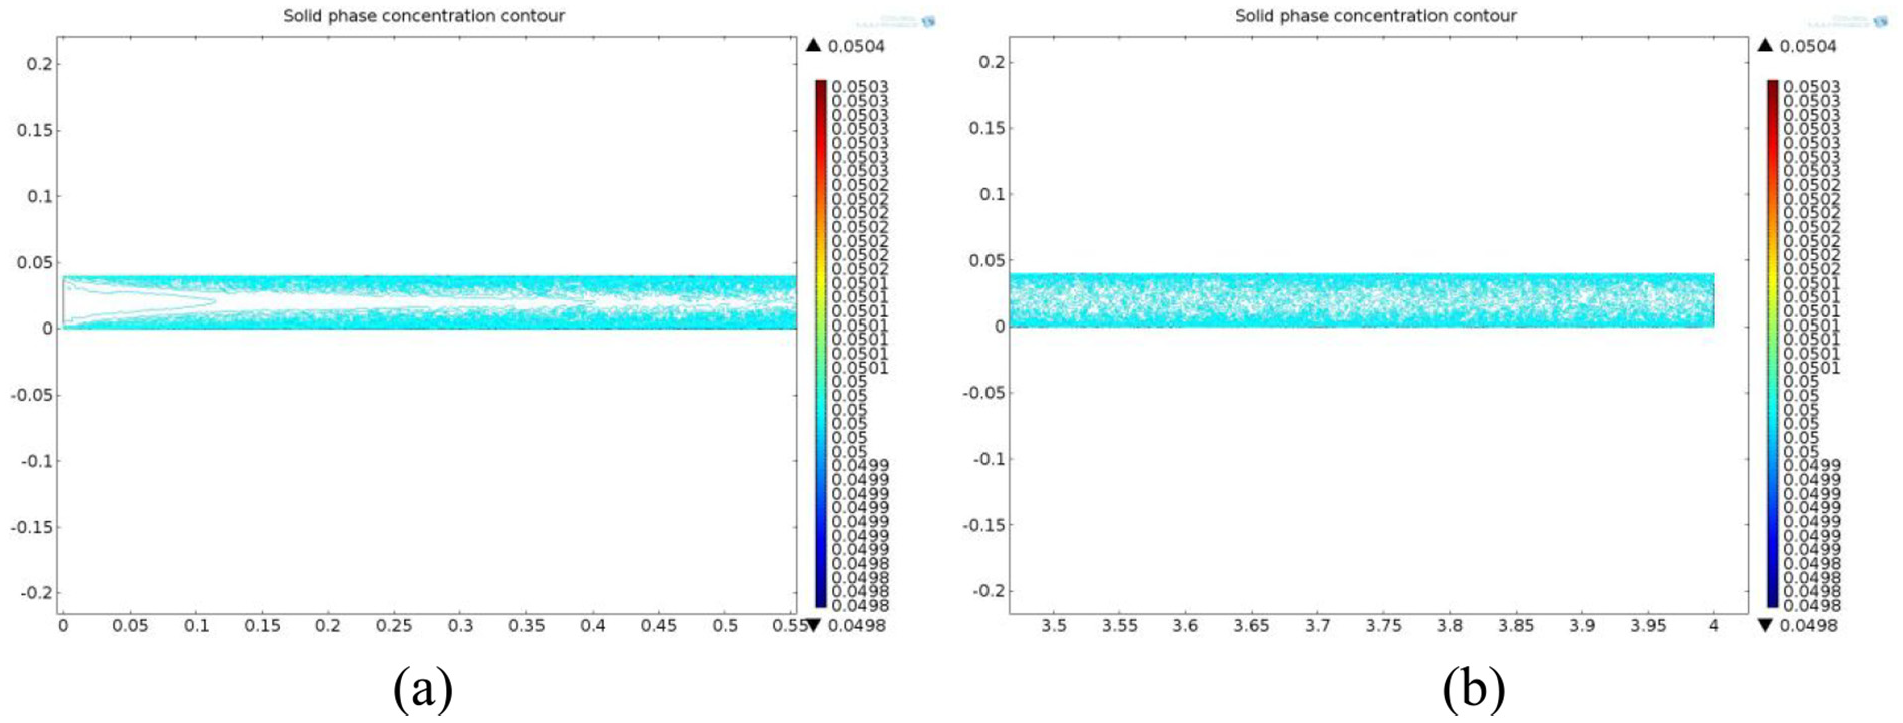
The flow velocity distribution of pulp fluid near inlet and outlet of pipe is shown in Figure 2.
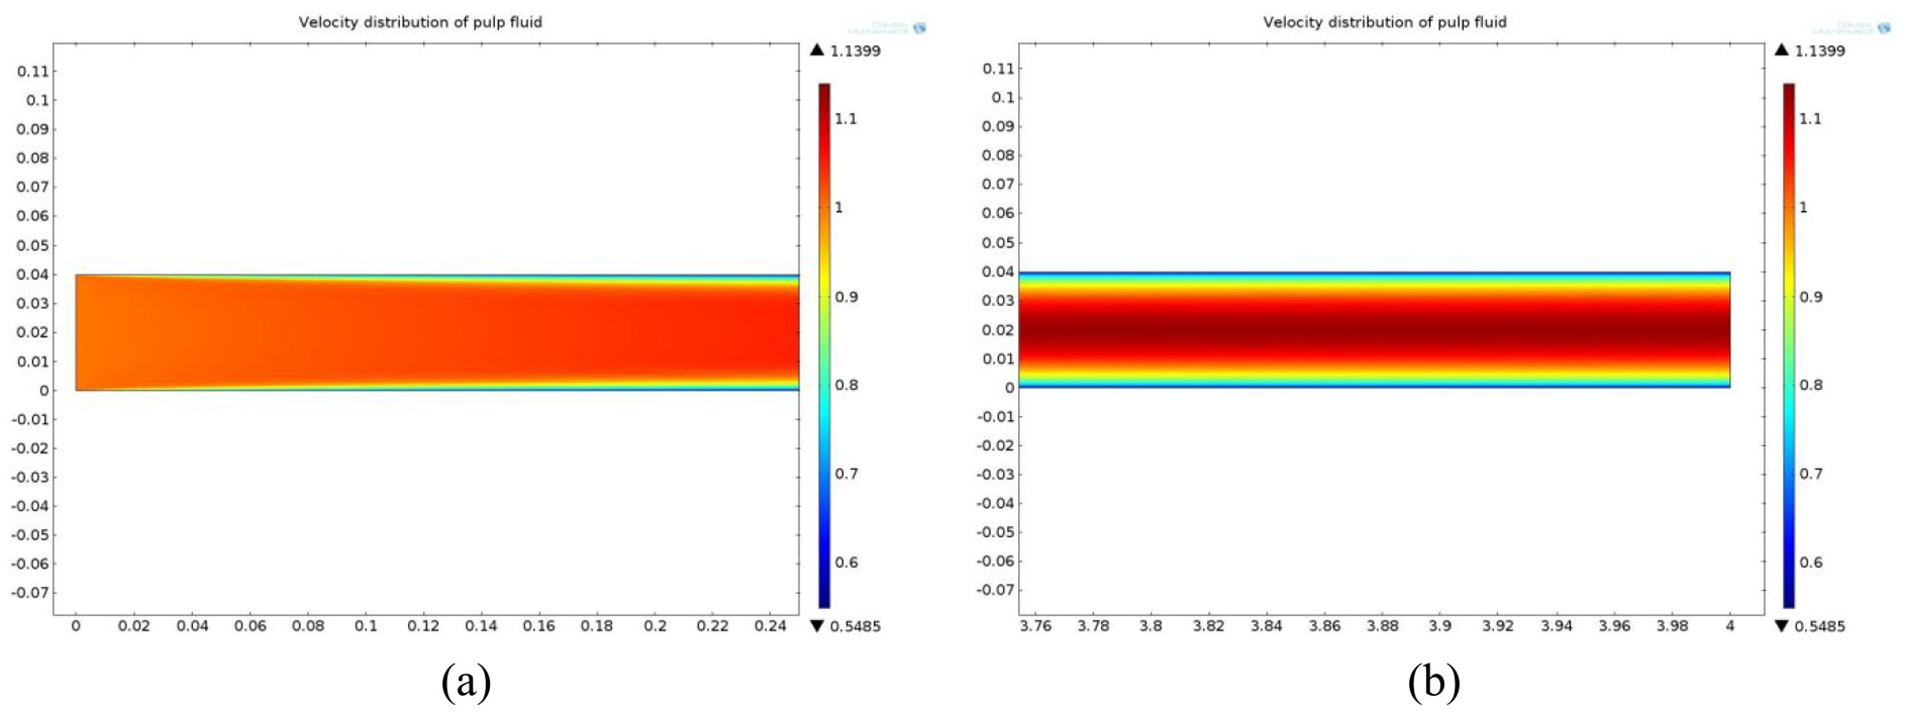
Flow velocity distribution of pulp fluid in pipe (
As shown in Figure 2(a), the flow velocity distribution of pulp fluid in the pipe is constantly changing in the axial direction of the pipe near the inlet, which is caused by the pulp fluid in this section of the pipe is in the pipe inlet section, the flow velocity distribution has not reached the fully developed state. As shown in Figure 2(b), the flow velocity distribution of pulp fluid in the axial direction of the pipe is no longer changed near the outlet, this is because the pulp fluid in this section of the pipe is in the pipe fully developed section, the flow velocity distribution reaches the fully developed state and tends to be stable.
Different axial positions of the pipe are selected, and pulp fluid flow velocity distribution data at these positions can be obtained. The flow velocity data at the positions
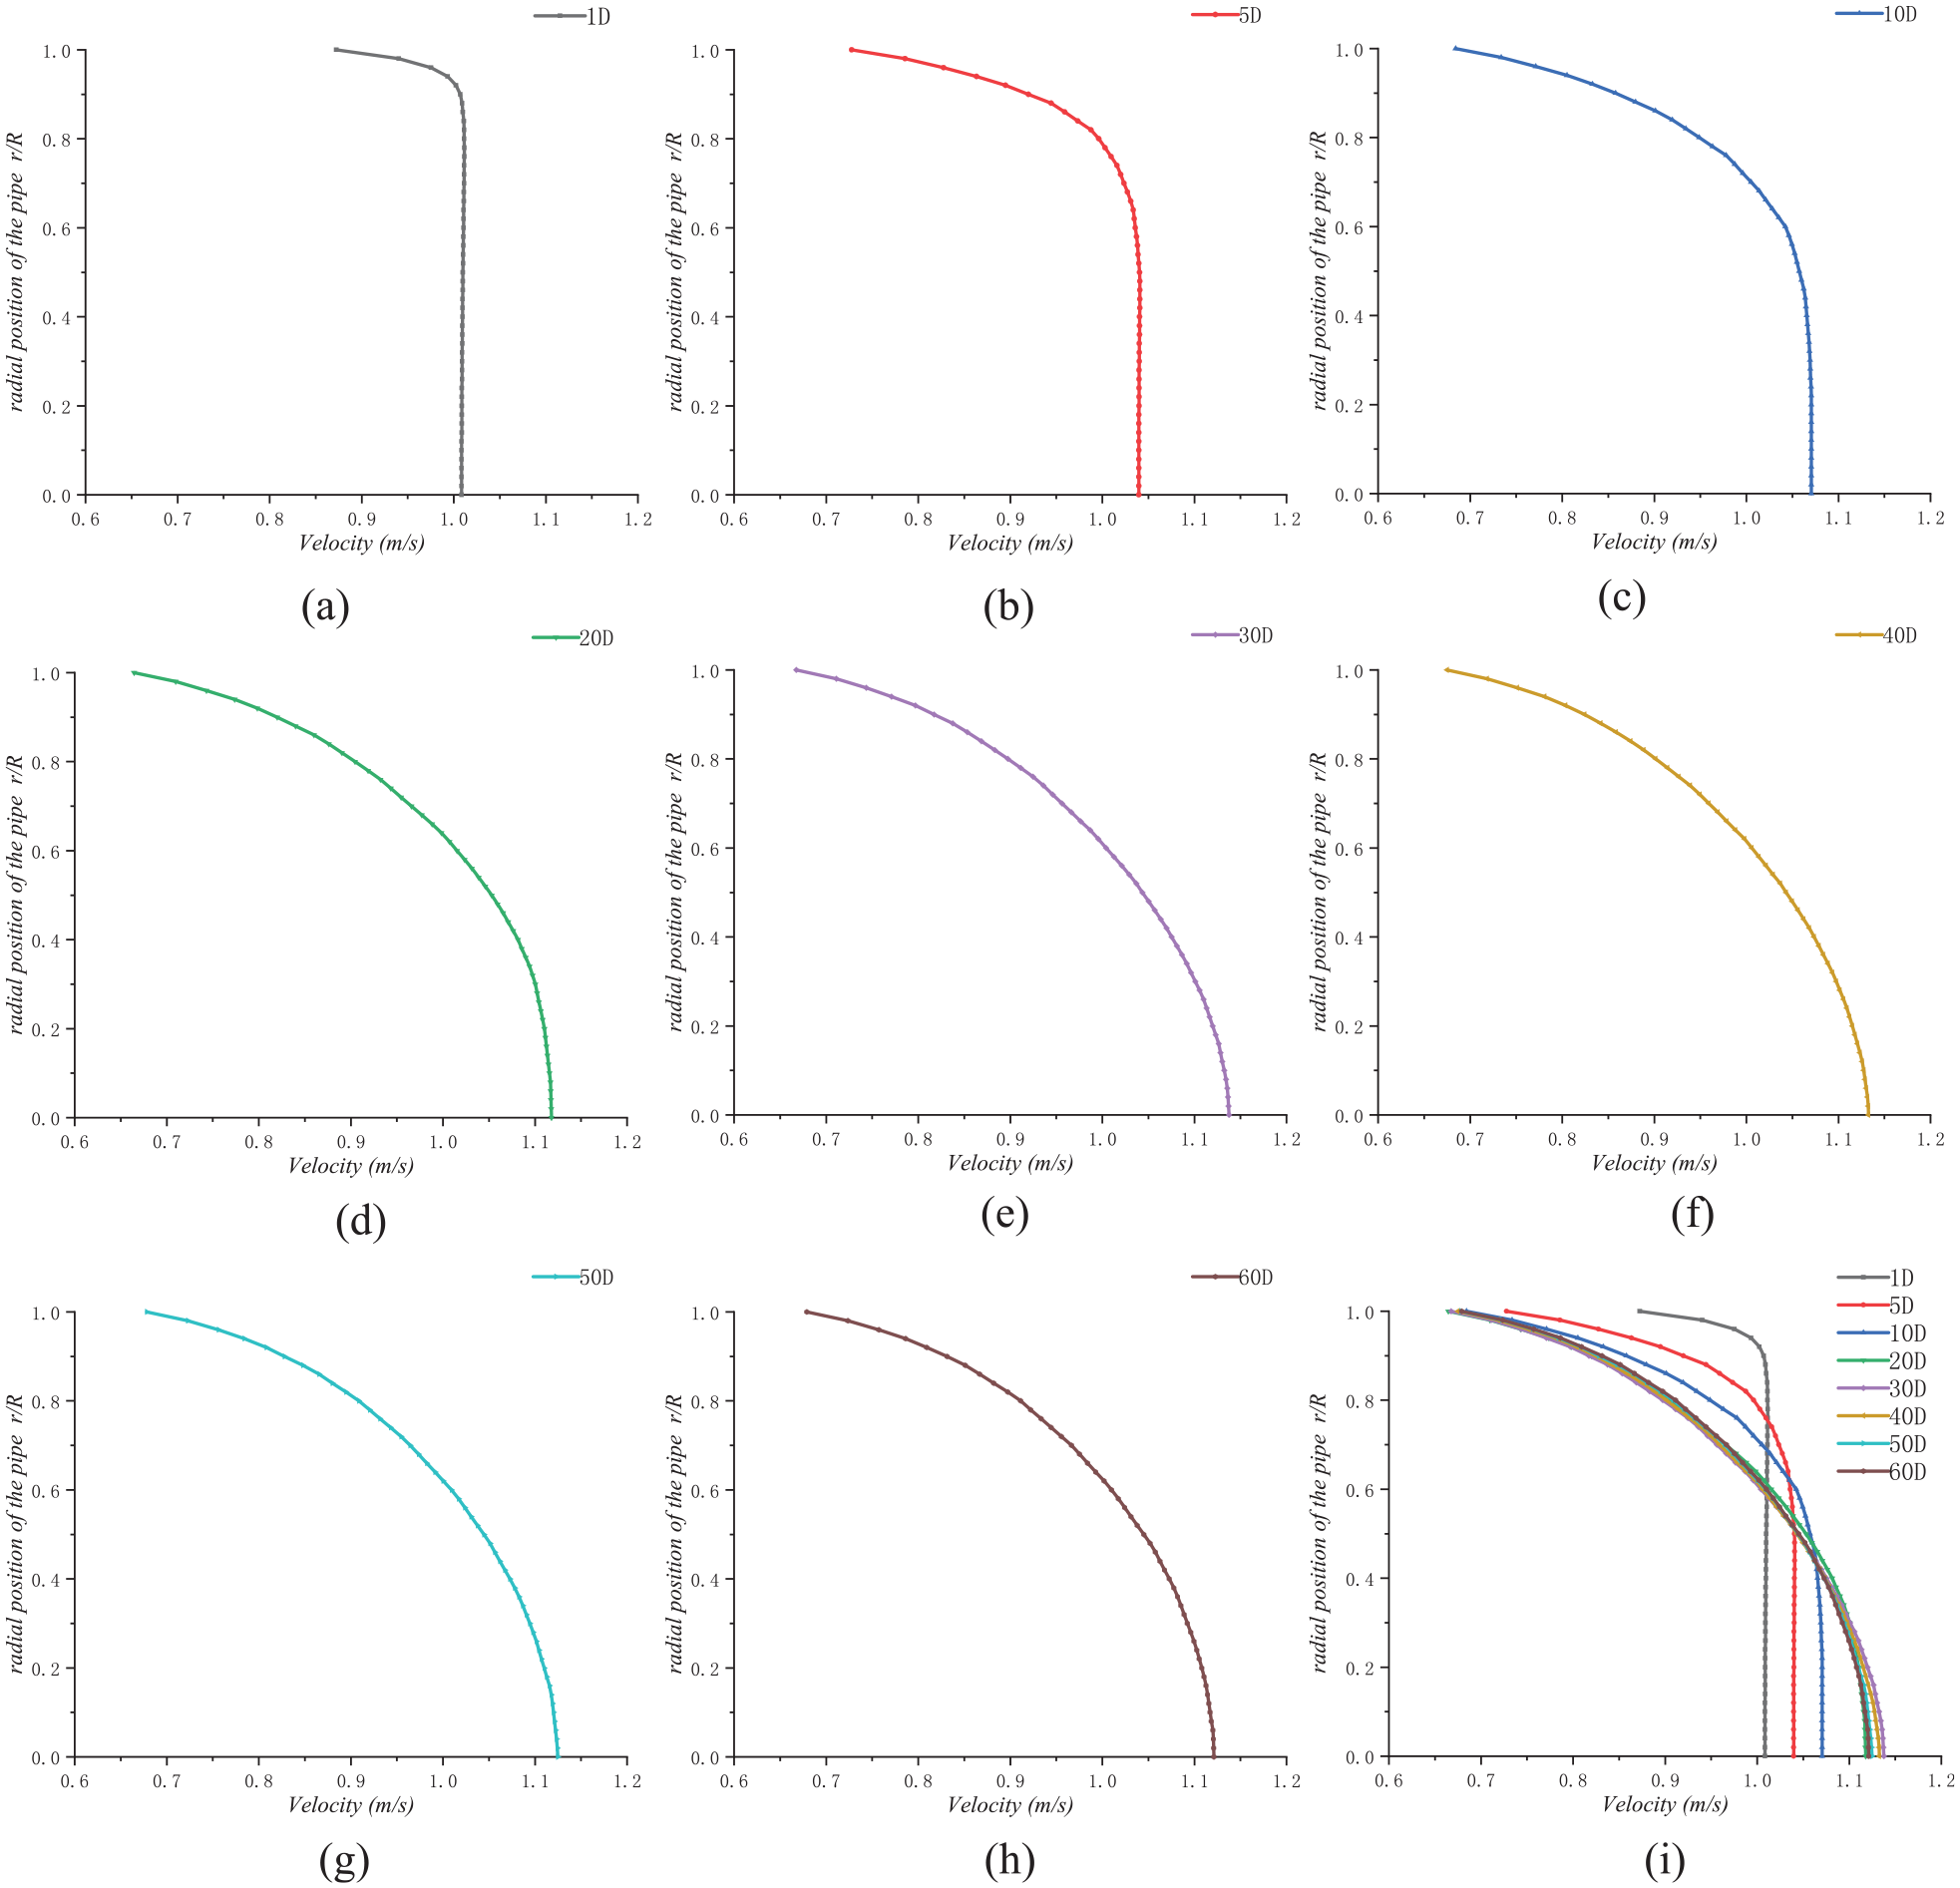
Flow velocity distribution of pulp fluid at different positions in the axial direction of the pipe (
In Figure 3,
Pearson correlation coefficient method is applied to analyze these curve data, and the relationship between the two sets of flow velocity distribution data at different positions of the pipe can be obtained. The flow velocity distribution data of pulp fluid at any two different positions in the pipe can be represented by sequences
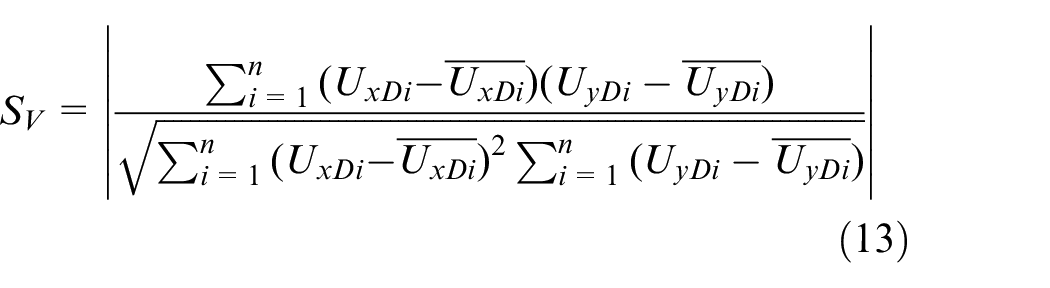
where
Correlation coefficient of flow velocity distribution (
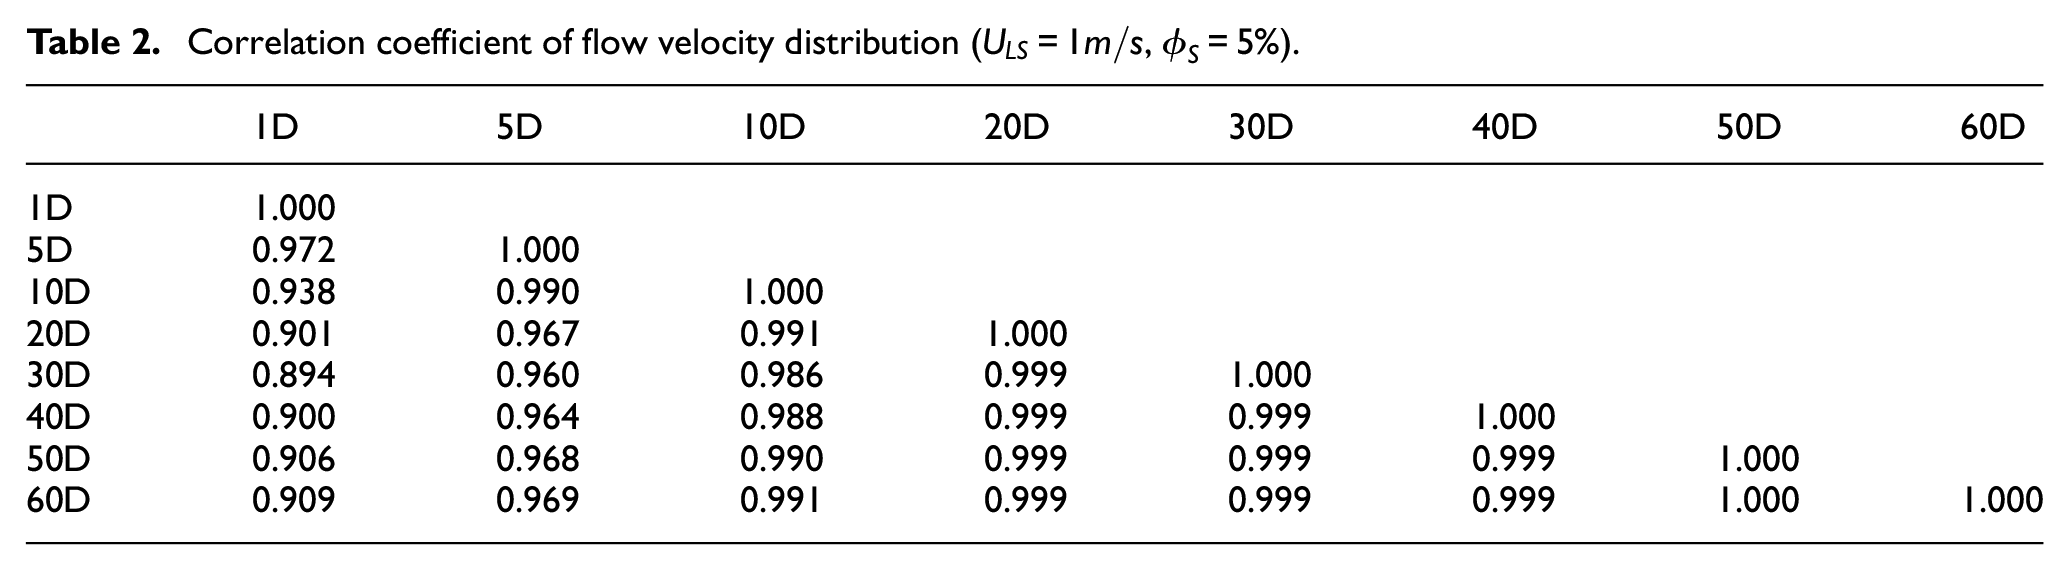
Table 2 shows that the correlation coefficient of flow velocity distribution of pulp fluid is above 99.9% at each position downstream of
Correlation coefficient between flow velocity distribution at each position in the area between
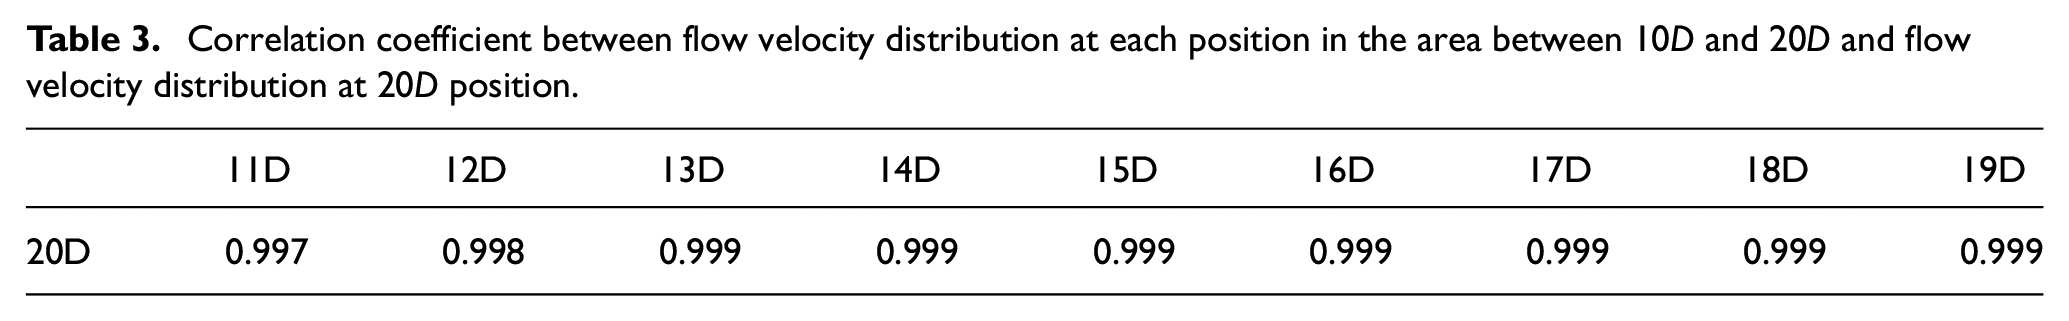
Table 3 shows that in the downstream area of the
In order to determine the length of pipe inlet section of pulp fluid, the solid phase concentration distribution of pulp fluid in the pipe should also be studied. The solid phase concentration distribution of pulp fluid (
Solid phase concentration distribution of pulp fluid in pipe (
It can be seen from Figure 4 that in the pipe inlet section, the solid phase concentration distribution of pulp fluid changes obviously, in the pipe fully developed section, the solid phase concentration distribution of pulp fluid tends to be stable.
The solid phase concentration data at the positions
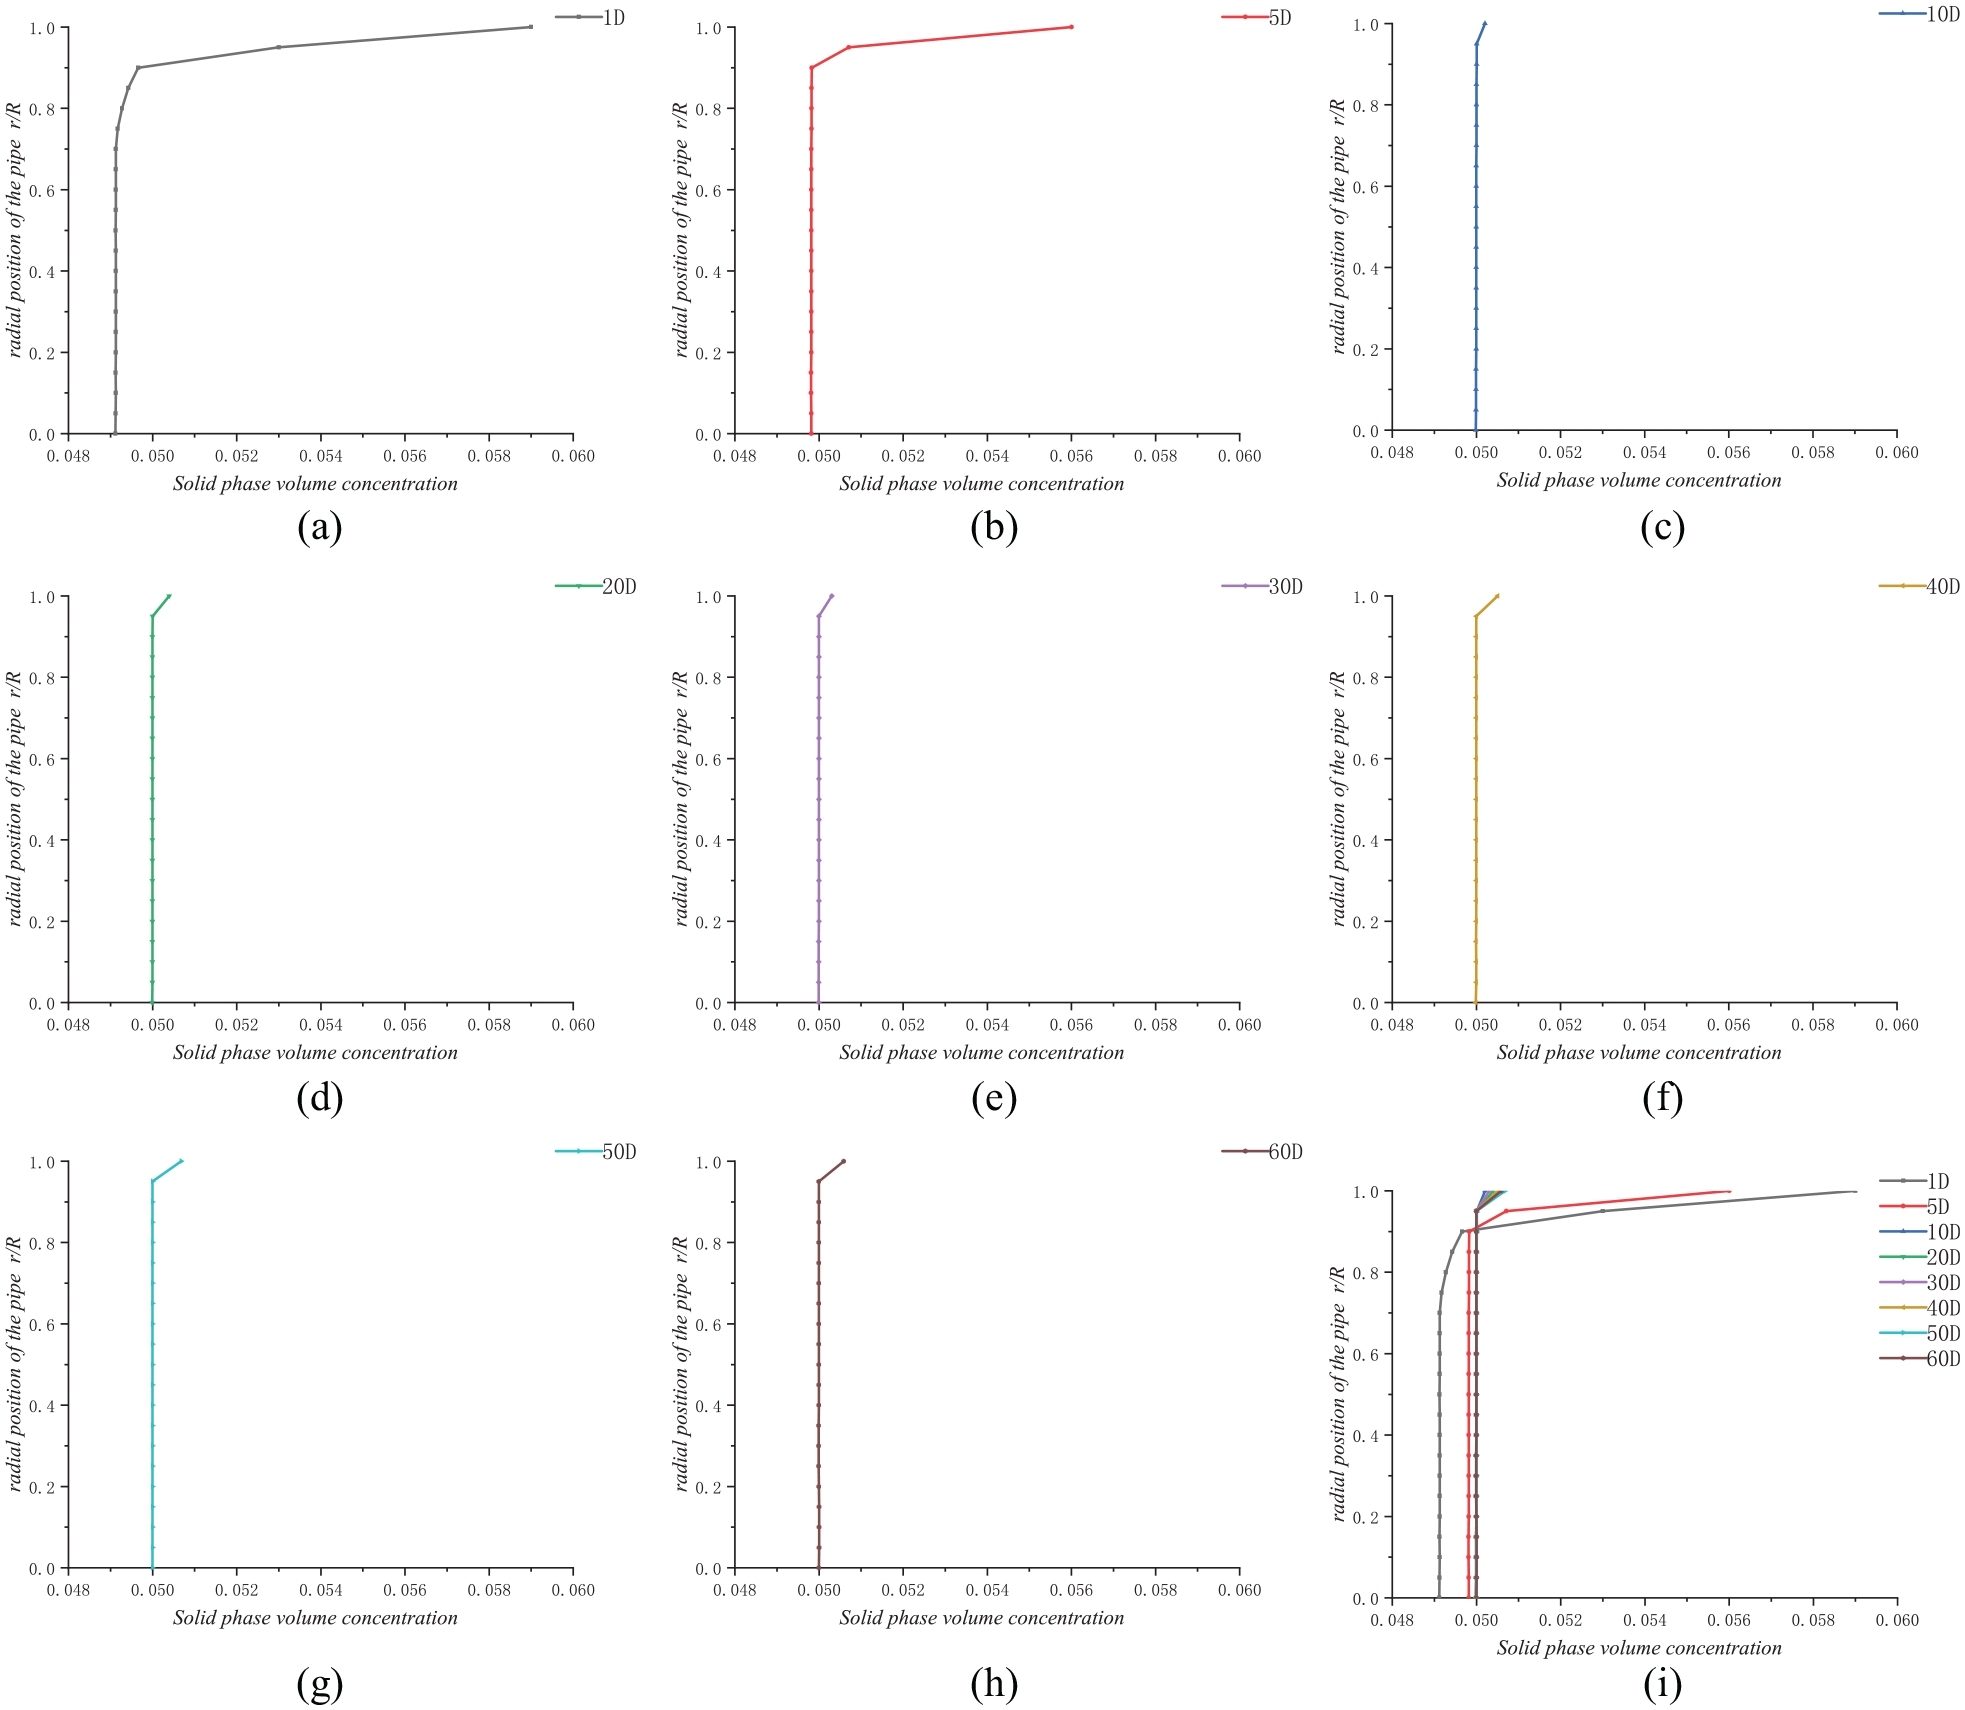
Solid phase concentration distribution of pulp fluid at different positions in the axial direction of the pipe (
It can be seen from Figure 5 that the solid phase concentration of pulp fluid near the pipe wall is relatively high, and this phenomenon is more obvious near the pipe inlet. This is due to the position close to the pipe wall is the viscous sublayer, the flow velocity of pulp fluid in the viscous sublayer is close to 0, resulting in the accumulation of solid particles.
Pearson correlation coefficient method is applied to analyze these curve data, and the relationship between the two sets of solid phase concentration distribution data at different positions of the pipe can be obtained. The solid phase concentration distribution data of pulp fluid at any two different positions in the pipe can be represented by sequences
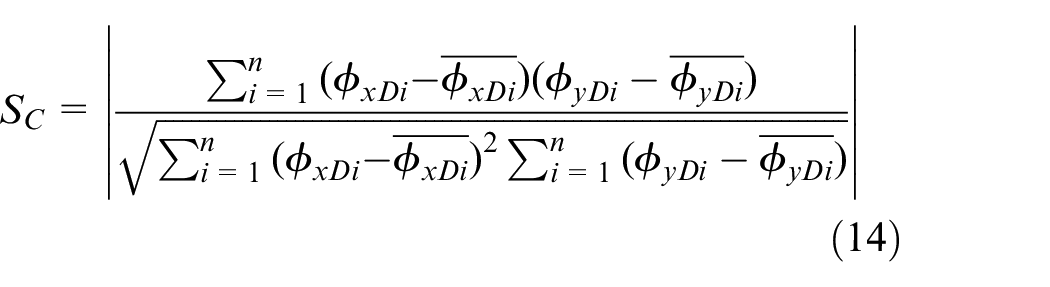
where
Correlation coefficient of solid phase concentration distribution (
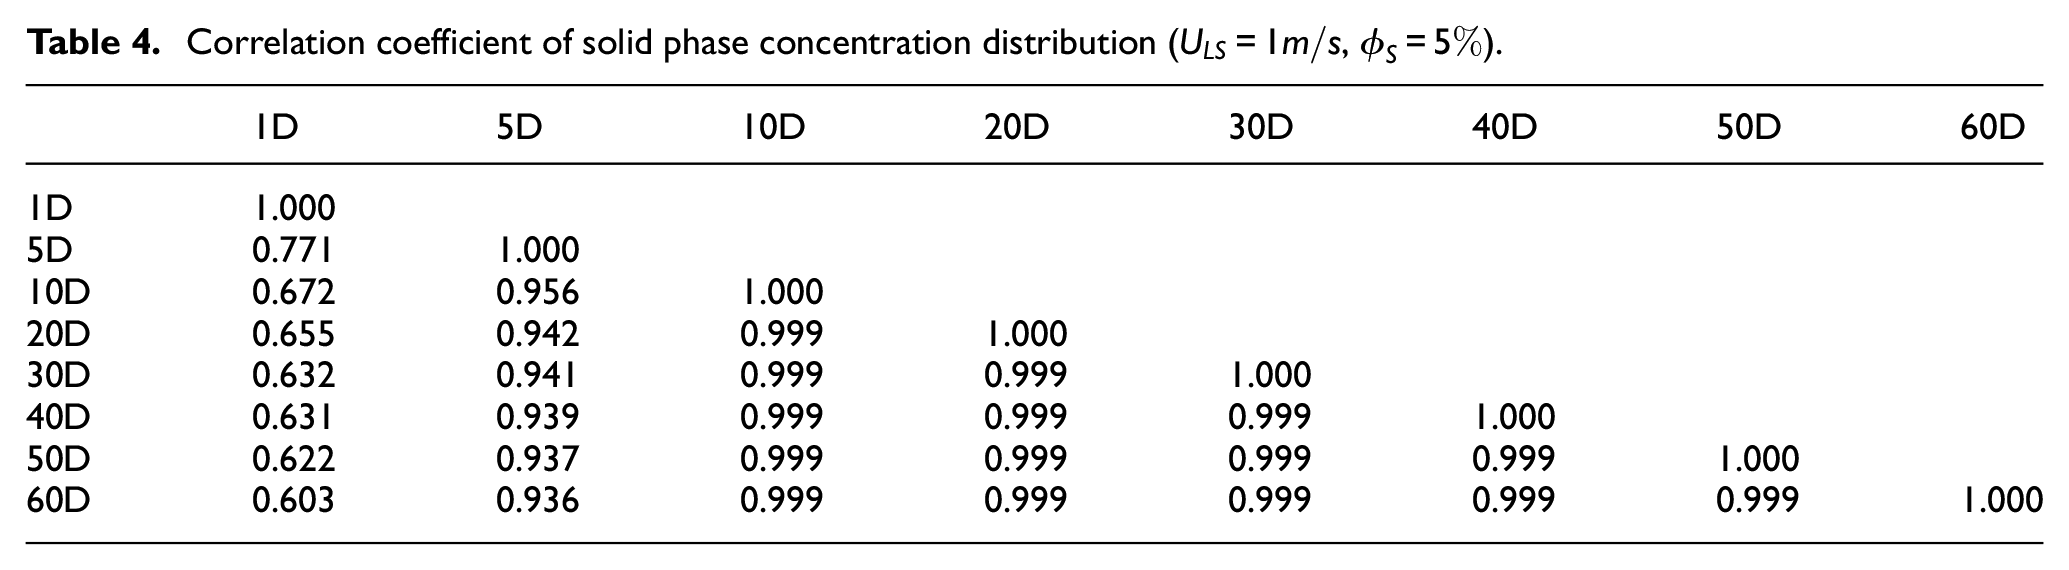
Table 4 shows that the correlation coefficient of solid phase concentration distribution of pulp fluid is above 99.9% at each position downstream of
Correlation coefficient between solid phase concentration distribution at each position in the area between
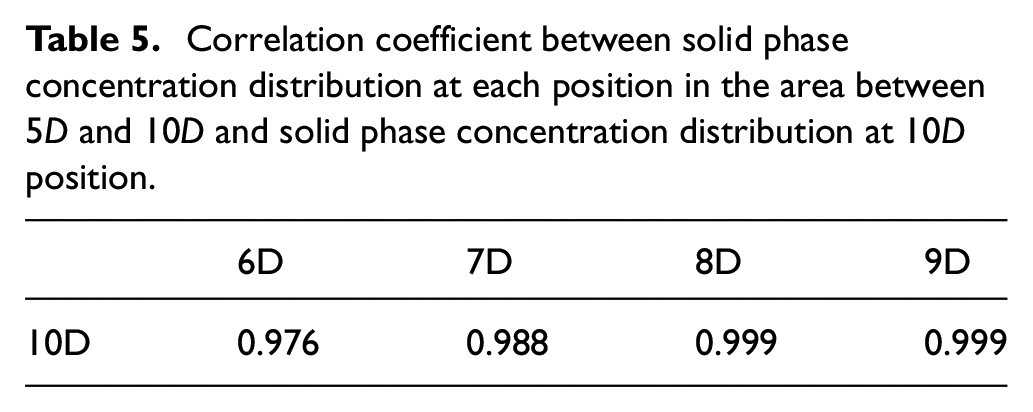
Table 5 shows that in the downstream area of the
According to the analysis of Table 3, it is known that the flow velocity distribution of the pulp fluid reaches the fully developed state downstream of the
Relationship between the length of pipe inlet section of pulp fluid and initial average flow velocity and initial solid phase volume concentration
The above experiments and analysis give the method to determine the length of pipe inlet section based on CFD under the condition of given specific parameters of pulp fluid. Based on this method, the length of pipe inlet section of pulp fluid under different initial conditions is studied. The initial conditions are as follows: the initial solid volume concentration of pulp fluid is 2%, 5%, 10%, 15%, and 20% respectively; the initial average flow velocity of pulp fluid is
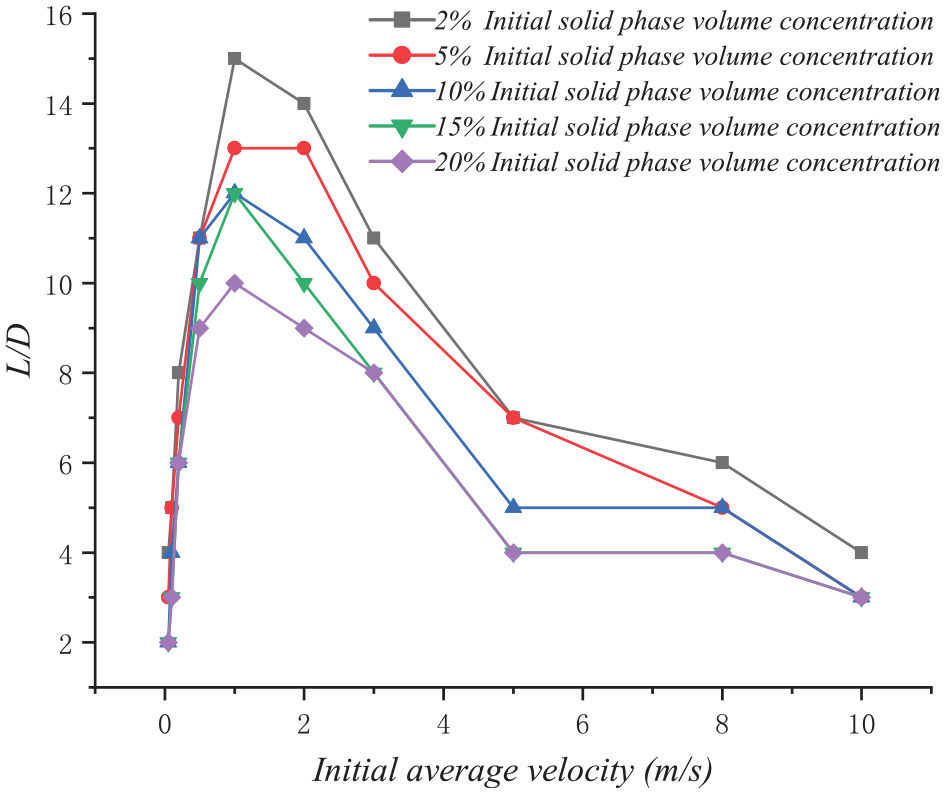
Relationship between the length of pipe inlet section of pulp fluid and initial average flow velocity and initial solid phase volume concentration
As shown in Figure 6, the relationship between the length of pipe inlet section of pulp fluid and initial average flow velocity and initial solid phase volume concentration is as follows:
Under the conditions of different initial average flow velocity and initial solid phase volume concentration, the length of pipe inlet section of pulp fluid is also different;
Under the condition of the same initial average flow velocity, the length of pipe inlet section of pulp fluid decreases with the increase of the initial solid phase volume concentration;
The length of pipe inlet section of pulp fluid always increases first and then decreases with the increase of the initial average flow velocity, and when the initial average flow velocity is about
When the initial average flow velocity is higher than
Discussion
The work of this paper has the following problems worthy of discussion:
The CFD method applied in this paper is carried out under the ideal condition that the pipe is straight pipe. Some boundary conditions, such as the surface roughness of the pipel wall and the influence of secondary flow of fluid in the pipe, are ignored in the mathematical model. Moreover, environmental factors such as vibration and temperature are not considered. Therefore, the results obtained by this method are approximate and have certain errors compared with the real situation. If the mathematical model is further improved, or combined with a large number of experimental analysis, more accurate conclusions can be obtained.
In this paper, Pearson correlation coefficient method is used to analyze the data of flow velocity and solid phase volume concentration of pulp fluid at various positions in the axial direction of the pipe, the more positions are selected in the axial direction of the pipe, the more accurate the results are. Therefore, if the length of pipe inlet section of pulp fluid is determined by the method in this paper, the number of positions selected in the axial direction of the pipe should be as large as possible when the conditions permit.
Conclusion
This paper presents a method to determine the length of pipe inlet section of pulp fluid. Based on CFD, the numerical solution of flow state of pulp fluid in the pipe under the given initial conditions and boundary conditions is obtained, and Pearson correlation coefficient method is applied to analyze the flow velocity distribution and solid phase volume concentration distribution data at various axial positions of the pipe to determine the length of the pipe inlet section of pulp fluid. The conclusion are as follows:
The length of pipe inlet section of pulp fluid is determined by the initial average velocity and the initial solid phase volume concentration.
Under the same initial average flow velocity, the length of pipe inlet section of pulp fluid decreases with the increase of the initial solid phase volume concentration of pulp fluid.
The length of pipe inlet section of pulp fluid always increases first and then decreases with the increase of initial average flow velocity. When the initial average flow velocity is about
The work of this paper provides theoretical support for how to determine the installation positions of pulp concentration sensor and flow sensor on the pipe. In addition, the rule that the length of pipe inlet section of pulp fluid is affected by the average flow velocity and concentration under the normal conditions in the paper industry is summarized, which is of certain significance to the design of the pulp pipe transportation system.
Footnotes
Declaration of Conflicting Interests
The author(s) declared no potential conflicts of interest with respect to the research, authorship, and/or publication of this article.
Funding
The author(s) disclosed receipt of the following financial support for the research, authorship, and/or publication of this article: This work was sponsored by the key scientific research projects in Henan colleges and Universities (No. 18A413006) and Henan province key research and development and promotion special (No. 192102110204) and the national natural science foundation of China under Grant (No. 61805073 & 61801288).